Article

Variation in Cropping Intensity in Northern China from 1982 to 2012 Based on GIMMS-NDVI Data

1
Key Laboratory of Poyang Lake Wetland and Watershed Research, Ministry of Education, School of Geography and Environment, Jiangxi Normal University, No. 99 Ziyang Ave, Gaoxing District, Nanchang 330022, China
2
Department of Microbiology and Plant Biology, Center for Spatial Analysis, University of Oklahoma, No. 101 David L. Boren Blvd, Norman, OK 73019, USA
3
Institute of Biodiversity Science, Fudan University, Shanghai 200433, China
4
Key Laboratory of Land Surface Pattern and Simulation, Institute of Geographic Sciences and Natural Resources Research (IGSNRR), CAS, Beijing 100101, China
*
Author to whom correspondence should be addressed.
Sustainability 2016, 8(11), 1123; https://doi.org/10.3390/su8111123
Submission received: 18 July 2016 / Revised: 24 October 2016 / Accepted: 25 October 2016 / Published: 1 November 2016
(This article belongs to the Special Issue Sustainable Agriculture and Development)

Abstract

:
Cropping intensity is an important indicator of the intensity of cropland use and plays a very important role in food security. In this study, we reconstructed a normalized difference vegetation index (NDVI) time-series from 1982 to 2012 using the Savitzky-Golay (S-G) technique and used it to derive a multiple cropping index (MCI) combined with land use data. Spatial–temporal patterns of variation in the MCI of northern China were as follows: (1) The MCI in northern China increased gradually from north-west to south-east; from 1982 to 2012, the mean cropping index across grid-cells over the study area increased by 4.36% per 10 years (p < 0.001) with fluctuations throughout the study period; (2) The mean MCI across grid-cells over the whole of northern China increased from 107% to 115% with all provinces showing an increasing trend throughout the 1980s and 1990s. Aside from Tianjin, Hebei, Beijing, and Shandong, all provinces also displayed an increasing trend between the 1990s and 2000s. Arable slope played an important role in the variation of the MCI; regions with slope ≤3° and the regions with slope >3° were characterized by inverse temporal MCI trends; (3) Drivers of change in the MCI were diverse and varied across different spatial and temporal scales; the MCI was affected by the changing agricultural population, deployment of food policies, and methods introduced for maximizing farmer benefits. For the protection of national food security, measures are needed to improve the MCI. However, more attention should also be given to the negative impacts that these measures may have on agricultural sustainability, such as soil pollution by chemical fertilizers and pesticides.

1. Introduction

Due to rapid population growth and urbanization in recent years, global food security has increasingly become a major concern [1]. As an important factor in food security, agricultural land use change, including changes in area and cropping intensity, has aroused widespread concern, especially for a country as populous as China [2]. Over the past several decades, rapid urban sprawl and industrialization in China has converted a growing amount of cropland into housing or construction land [3,4,5,6]. These transformations have increased the pressure on maintaining cropland area and meeting the demands of food security in China [7].
Much attention has been paid to agricultural land use changes in China. However, most studies have focused on changes in cropland area [3,8,9] and have, to some degree, ignored changes in cropping intensity despite multiple cropping intensity playing an important role in food security of populous countries such as China and India [10,11,12,13]. Given the significance of cropping intensity, studies on the country-wide spatiotemporal dynamics of cropping intensity are necessary for a better understanding of food security and agriculture-related decision-making in China.
Much effort has been made in China to detect changes in cropping intensity [7,14,15,16]. However, much of the existing effort has focused on tracking cropping intensity within local regions. Additionally, while numerous studies on the cropping systems of northern China [17,18,19] have not provided temporally and spatially continuous monitoring. Most of these studies were based on agricultural statistical data that neglected the spatial heterogeneity of cropping intensity within administrative units. The time lag in statistical data acquisition has also affected the usability of cropping intensity information [20].
Remote sensing technology has been increasingly used to detect and monitor patterns and changes in cropping intensity. The two key issues in remote-sensing-based cropping intensity monitoring are (1) the smoothing of vegetation index time series data and (2) the multiple cropping index (MCI) detection methods. Regarding the smoothing method, there are a variety of reconstruction methods available for long time-series normalized difference vegetation index (NDVI) data [21,22,23,24,25,26,27]. Among them, the Savitzky-Golay (S-G) [21] and Harmonic Analysis of Time Series (HANTS) methods [24,28] have been applied widely. The drawback of the HANTS method is that data-fitting is easily affected by the selected frequency setting. Regional differences in MCI values are not reflected by the HANTS method because the same threshold and parameters are used across the entire study area, constraining its use to large-scale analyses [29]. In contrast, since the S-G filtering method is based on a least squares fit of a sliding window, it could potentially solve this scale issue [30]. Previous methods have depended on phenology to quantify the cropping intensity of an agricultural pixel by counting the number of peaks in a pixel’s vegetation index time series [31]. To extract the peaks, a two-difference algorithm is widely used [17] but is very sensitive to small fluctuations in NDVI data, especially in pixels representing abandoned farmland or overwintering crops (e.g., in the North China Plain, where winter wheat grown as an overwintering crop often creates a false peak in the winter) [30]. It is therefore necessary to improve the algorithm by adjusting the threshold to eliminate false peaks.
The northern region of China, especially the North-east and North China Plains, is of great importance to the food security of China and was therefore selected as the study area for this study. Northern China has experienced a boom in economic development in the past three decades and the resulting agricultural land use changes have created remarkable changes in cropping intensity. The purpose of this study was to detect the spatial and temporal variations of cropping intensity in northern China during 1982–2012. More specifically, we aimed to improve the remote sensing method of MCI monitoring in northern China and to determine the spatiotemporal patterns of cropping intensity changes over the past three decades.

2. Materials and Methods
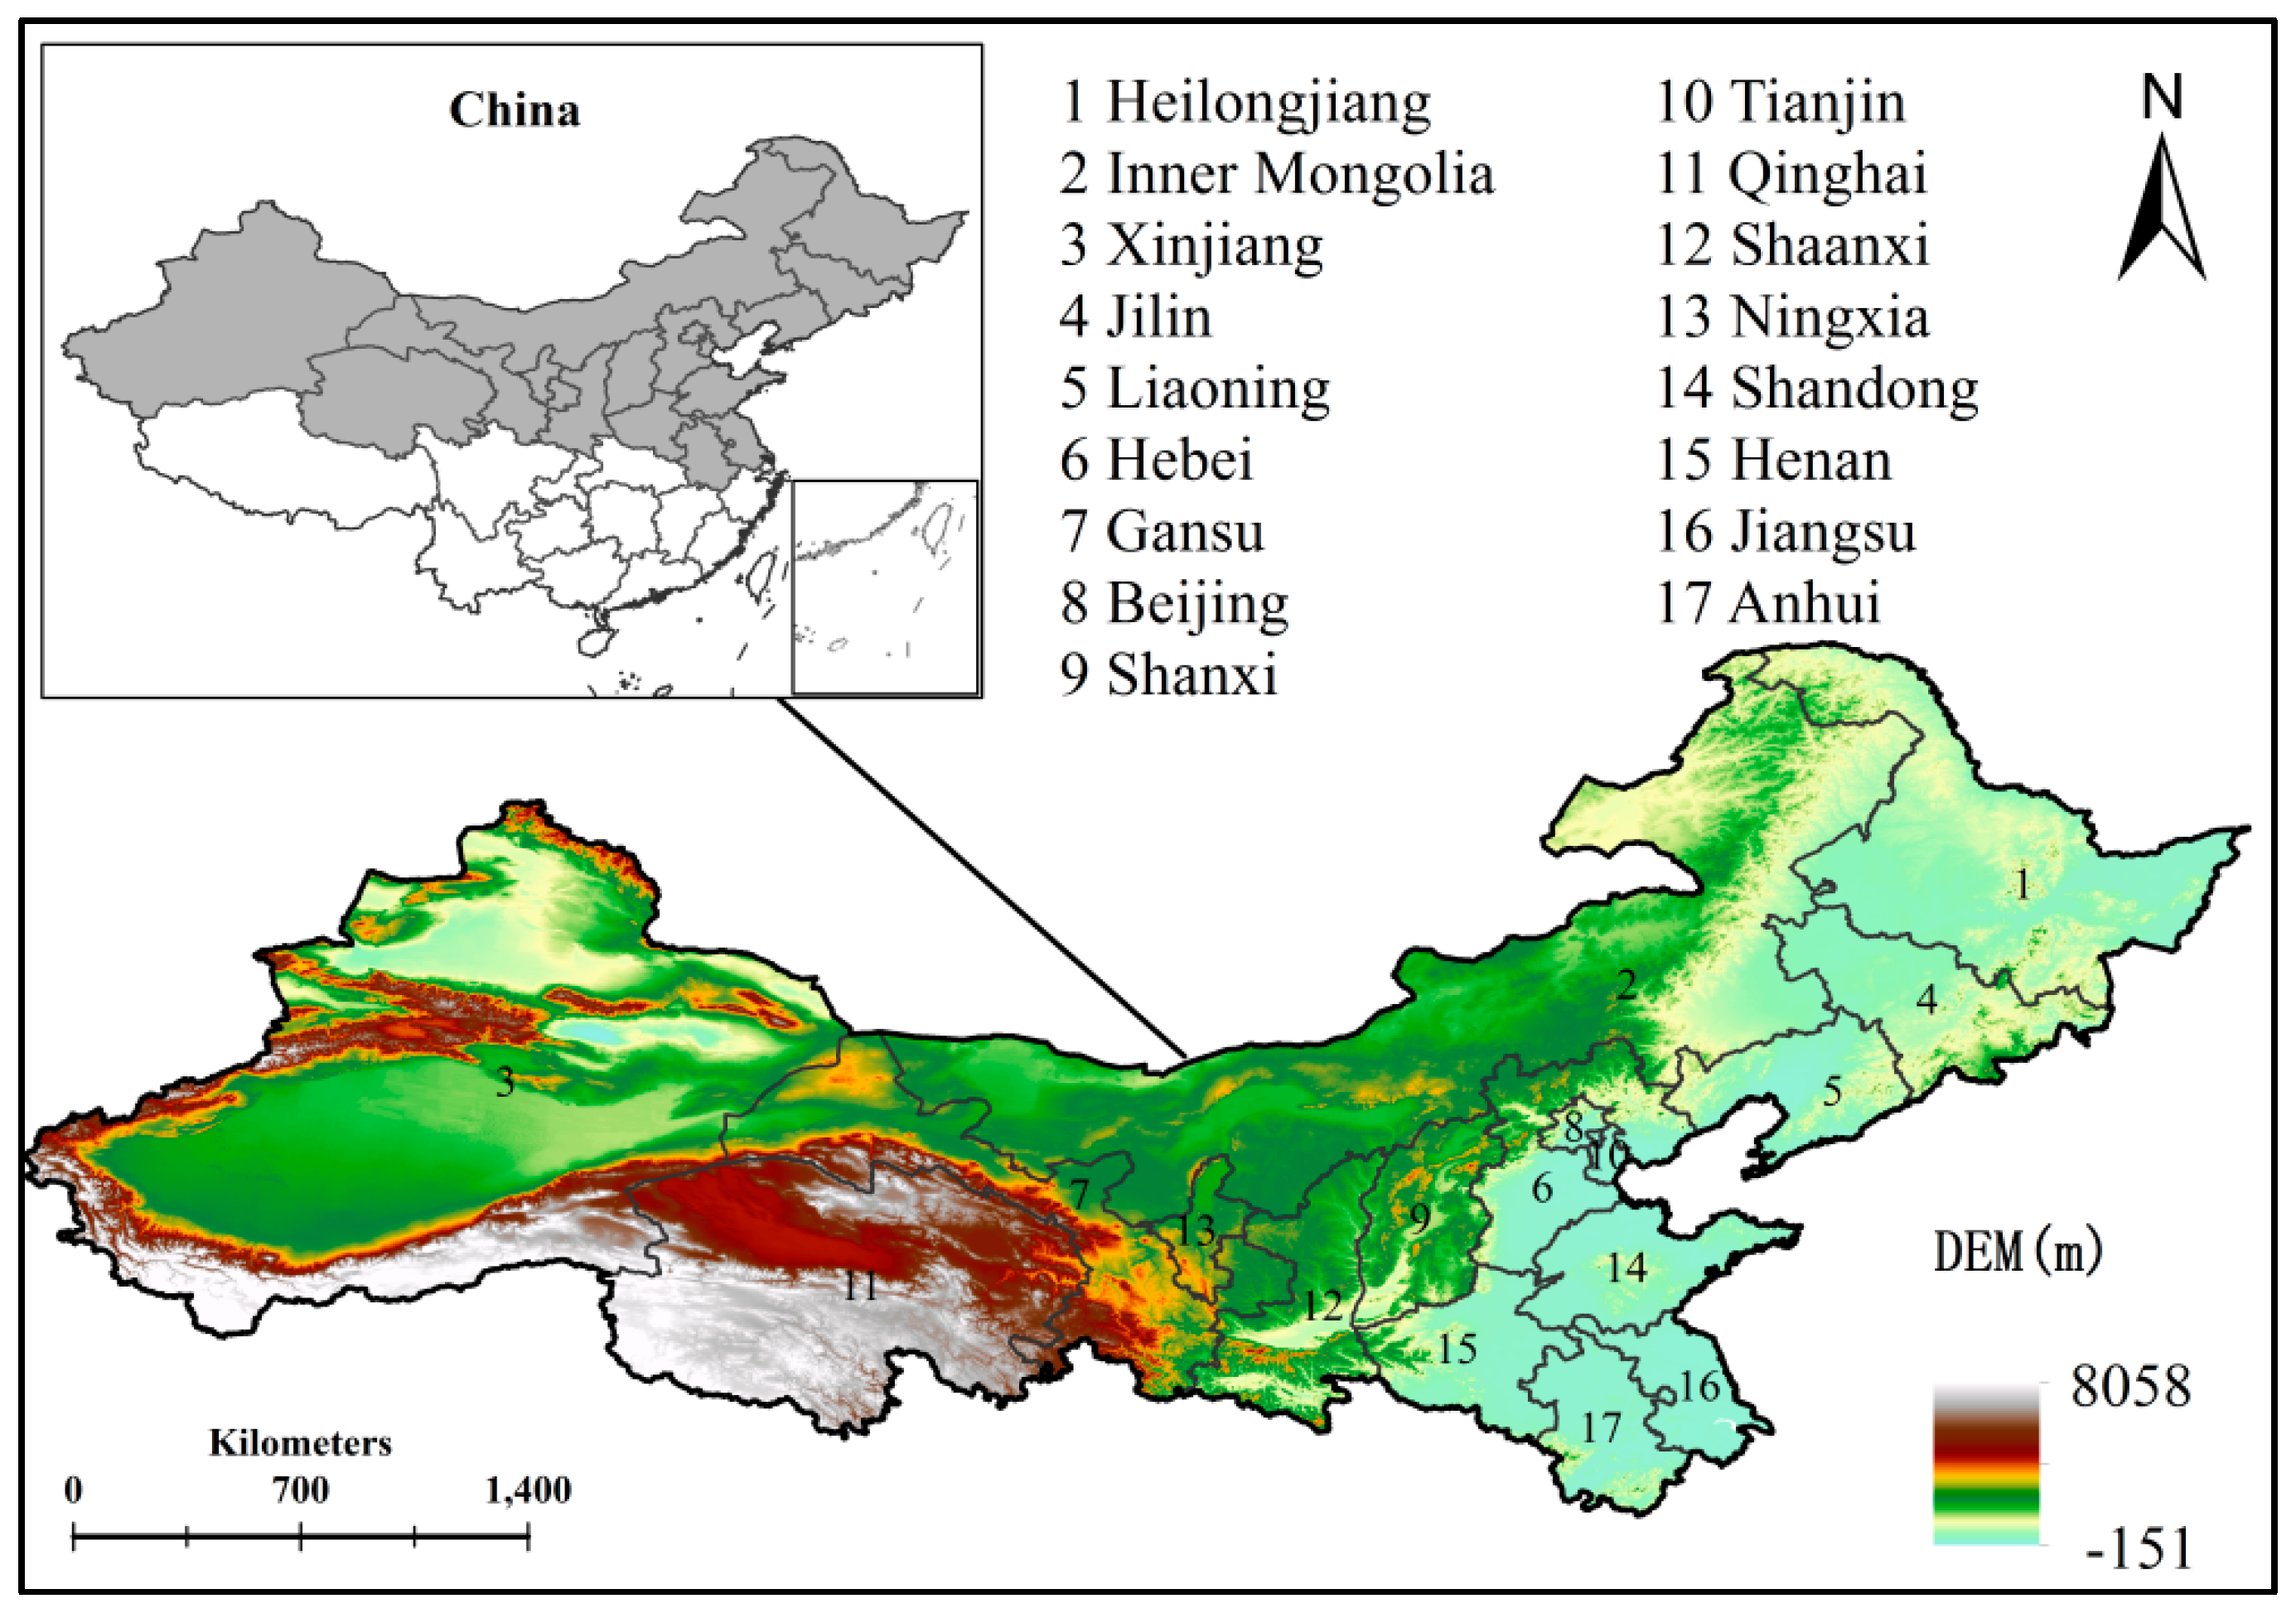
2.1. Study Area

The study area covered the northern part of China between 29°23′42″–53°33′28″N and 73°26′49″–135°5′8″E, which accounts for almost half of the total area of China and includes 17 provincial-level administrative units (Figure 1). The study area is dominated by plains in the east and expansive plateaus and basins in the mid-west. The climate of the eastern region is a middle-temperate zone with monsoons, while the mid-western region is a middle-temperate continental zone. Constrained by thermal conditions, single or double cropping rotation systems are commonly applied. Most of the cropland is planted with rice, maize, sorghum, sugarcane, soybean, and peanuts and are scattered throughout rain-fed plateaus and basins with irrigation. Agriculture is still an important industry for this area, which plays a very important role in China’s cereal production and development.

2.2. NDVI Time-Series Data during 1982–2012

The 8-km spatial resolution Global Inventory Modeling and Mapping Studies (GIMMS) NDVI dataset from 1982 to 2012 was provided by the NASA Global Inventory Monitoring and Modelling Systems group [32,33]. The data were derived from the Advanced Very High Resolution Radiometer (AVHRR) instruments on board the National Oceanic and Atmospheric Administration’s (NOAA) satellite series, which provides the longest time coverage in China. The GIMMS NDVI products were compiled using the maximum value composite (MVC) method to merge 15-day segments (data strips) [34]. The dataset was then calibrated and adjusted for the confounding effects of sensor shifts, sensor degradation, cloud cover, satellite orbit drift, variable solar zenith angle, and other factors before deriving the MCI time-series [35].
SPOT-VGT NDVI data, collected by the vegetation instrument on board the Système Pour l’Observation de la Terre (SPOT) [36], was acquired at 1-km spatial resolution from April 1998 to 2012 at a temporal resolution of approximately 10 days (36 composites in a single-year cycle). The dataset was corrected by the image provider for the effects of satellite shift and sensor degradation. Atmospheric contamination from water vapour, ozone and aerosols were corrected using a simplified atmospheric correction method [35]. In addition, the MVC for each 10-day interval was also applied to minimize further the non-vegetation effects [34,37]. In this paper, the SPOT-VGT NDVI data were used as a reference for data validation at a provincial level.

2.3. Other Data Used in This Study

A 1-km resolution digital elevation model (DEM) was acquired from the Shuttle Radar Topography Mission (SRTM) database to calculate slope throughout the study area. The SRTM employed a specially-modified radar system aboard the Space Shuttle Endeavour during an 11-day mission in February 2000 to obtain elevation data on a near-global scale and generate the most complete high-resolution digital topographic database of Earth at three resolutions (1 km, 90 m, and 30 m) [38].
Additionally, a 1:250,000-scale land use/cover vector dataset was acquired for China from the late 1980s, 1995, 2000, 2005, and 2010 from the Data Sharing Infrastructure of Earth System Science at the Chinese Academy of Sciences [39]. The data were converted into raster format and resampled to a pixel size of 8 km to match other datasets. The statistical multiple cropping index (MCI) of each provincial administration unit was collected by the Chinese Academy of Sciences via the Socioeconomic Statistical Year-book for China’s Province.
We hypothesized that the agricultural cropping system is influenced by the agricultural labour force and that variation in the cropping system can impact crop production. To test this hypothesis, we used agricultural population and grain production data by year and province, which were collected by the Chinese Academy of Sciences via the Socioeconomic Statistical Year-book for China’s Province.

2.4. Methods

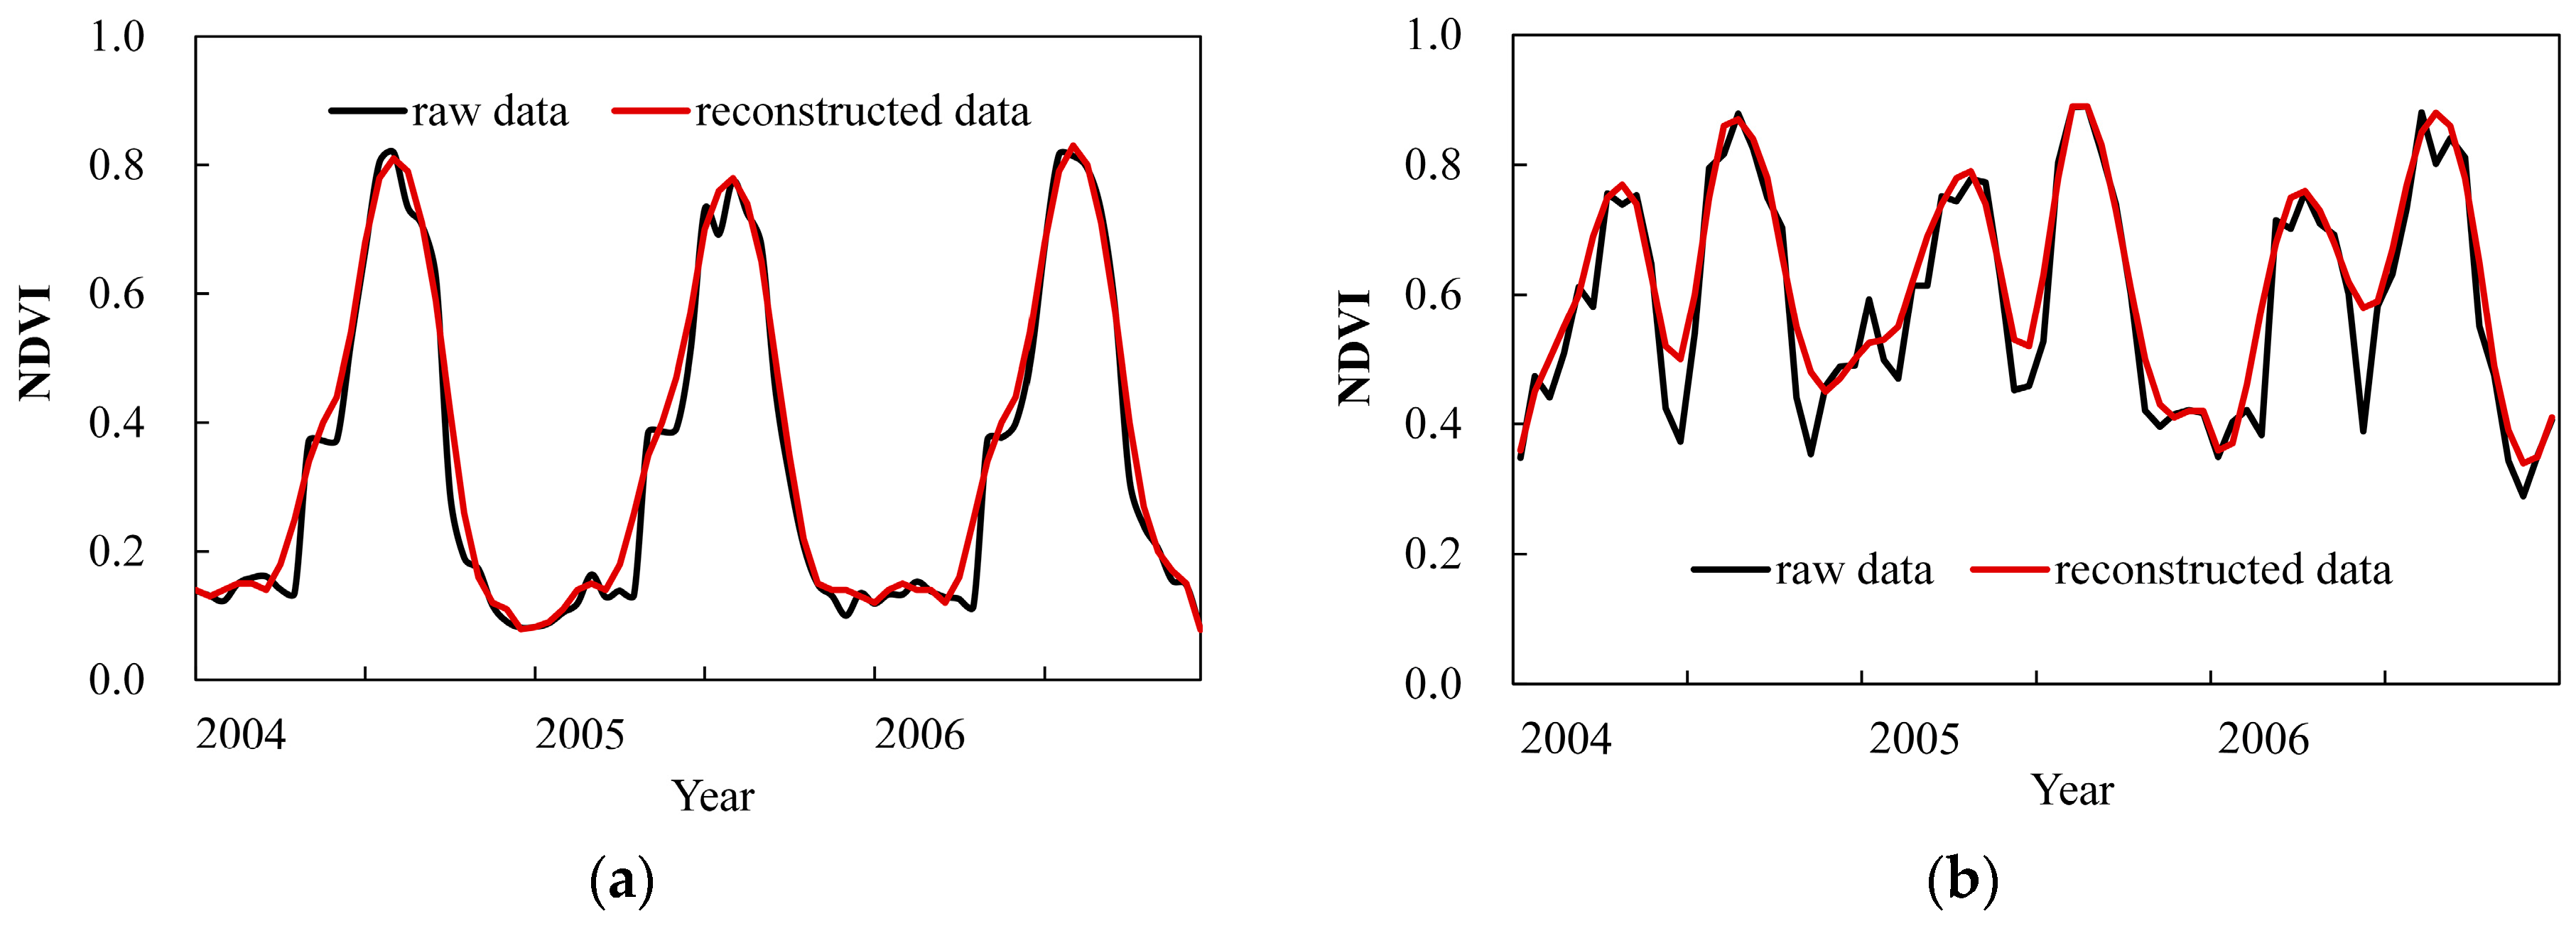
2.4.1. Smoothing NDVI Data via the S-G Technique and Extracting Peaks

The NDVI can provide information about the dynamics of vegetation growth. Throughout the agricultural process, from sowing to harvesting, the NDVI of crops first increases with the growth of vegetation, reaches a peak value at peak growth and then gradually decreases with senescence. The vegetation growth, and thus the NDVI signal, of an area farmed with a single cropping system undergoes one such cycle within one year, while a region with a double cropping system exhibits two such cycles in one year (Figure 2). However, these data are prone to interference from various factors during data acquisition and processing. After application of the MVC technique, sub-pixel-level contamination still remained in the form of residual clouds, long-term cloud haze, and other negative influences. Therefore, the NDVI time-series data required smoothing and reconstruction. There are various smoothing methods available for the reconstruction of long time-series NDVI data [21,24,28,40]. Among them, the S-G and the HANTS methods have been applied most widely. However, data fitting based on the HANTS method is easily affected by frequency setting. If the frequency is too small or too large, the reconstructed curve will be too smooth or not smooth enough, respectively, to reveal real crop information. Additionally, since this method employs the same threshold and parameters across the entire study area, its result does not reflect MCI regional differences and thus characteristically constrains large-scale analyses [29]. In contrast, the S-G filtering method, which is based on a least-squares fit of a sliding window, is relatively suitable for large study areas without adjusting parameters [21]. Therefore, we applied the S-G filtering method to smooth and reconstruct the NDVI time-series data in this study.
Owing to the relationship between the MCI and the smoothed NDVI curves, the frequency of NDVI peaks can be extracted within a specific period, such as the yearly MCI. In this study, a two-difference algorithm was used [17] to extract the peak frequency. First, we regarded the time-series NDVI value (VNDVI) per pixel as a sequence of discrete points. Next, we calculated the difference between the adjacent VNDVI in this sequence to obtain S1 via Equation (1). Then, we obtained S2, a value of either 1 or −1, via Equation (2). Finally, we calculated the difference between the adjacent elements of the S2 series and acquired S3 using Equation (3):
S 1 i = V NDVI i V NDVI i 1 ,
S 2 i = { 1 ,   S 1 i < 0 1 ,   S 1 i > 0 ,
S 3 i = S 2 i + 1 S 2 i ,
where i is the i-th element of the time series and peaks appear in the NDVI curve when the S 3 i value is −2 and the adjacent values are all 0 within the S 3 i time series.
This algorithm was highly suitable for detecting the peaks of the time series with discrete points, but two potential problems remained: (1) there may be fluctuations in the reconstructed NDVI curve in areas of bare land that would result in errors and (2) peaks that appear in the non-growing and pre-winter seasons may cause erroneous results. To minimize these inaccuracies in MCI extraction, we defined the following rules: (1) the interval of two peaks in an NDVI time-series curve was at least two months; (2) NDVI values at peak points had to be greater than 0.4, which was an empirical value determined by referring to a previous study [29]; and (3) since the growth season of some winter crops in the study area spanned two years, we defined the yearly period as November of the previous year to October of the current year and limited the peak analysis to the period of mid-February to early November to eliminate the pre-winter peak of winter wheat.

2.4.2. Analysing Variation in the MCI

MCI was computed at the district scale as follows. First, the number of peak points in pixel i during a year was calculated and denoted by M . The MCI of pixel i could then be calculated as MCI i = M × 100 % . The MCI at state, or district scale was calculated according to Equation (4):
MCI = i = 1 n MCI i / n ,
where n refers to the number of pixels of cropland in the state or district.
To reduce the influence of the land use/cover conversion, we retained only the pixels that were all designated as cropland in the late 1980s, 1995, 2000, 2005, and 2010 land cover data for the analysis of inter-annual change in MCI. The MCI trends were obtained using the least squares method. Furthermore, we calculated the mean MCI values from 1982 to 1989, 1990 to 1999 and 2000 to 2012 at grid level and labelled these periods as the 1980s, 1990s, and 2000s, respectively. Finally, we analysed the variations among the MCI values from the 1980s, 1990s, and 2000s at grid and district levels.

3. Results

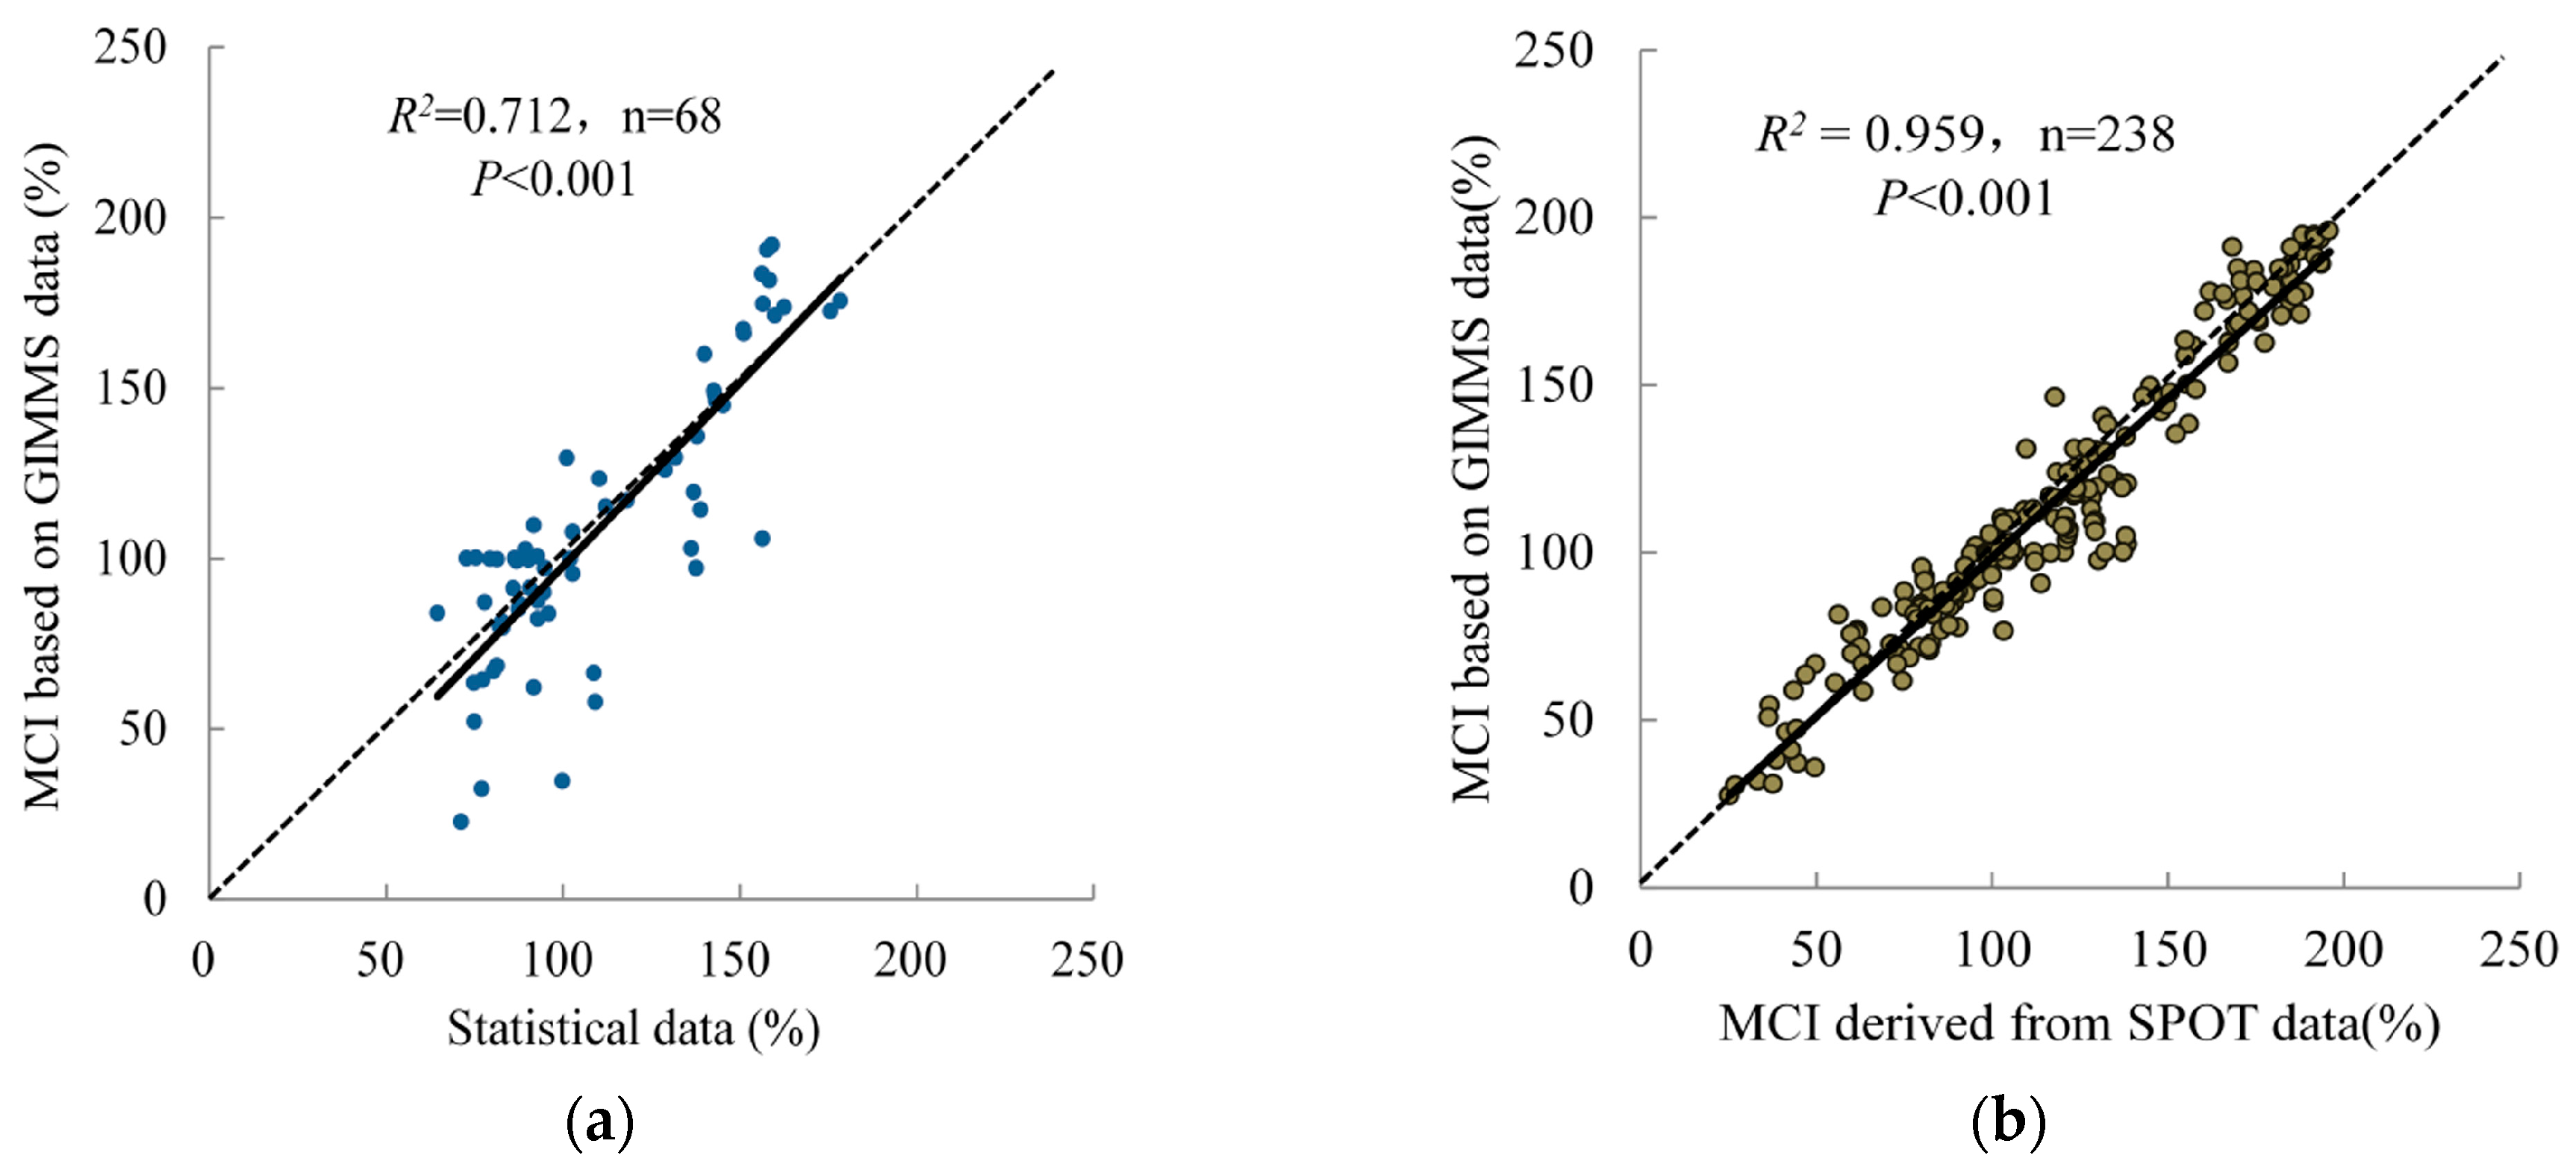
3.1. Evaluation of the MCI Algorithm Using Statistical Data and Other Remote Sensing Data

We calculated the mean MCI values across grid-cells of 17 administrative units in 1995, 2000, 2005, and 2010 based on the land cover data for both the GIMMS-NDVI and SPOT-NDVI datasets and then compared the results of the two sources with agricultural statistical data. Figure 3a shows a comparison between the MCI derived from GIMMS-NDVI data and that derived from the agricultural statistical data, based on administrative units. It suggests that there is a statistically significant linear relationship between them (R2 = 0.712; p < 0.001). We also compared the MCI extracted from GIMMS-NDVI with that from SPOT-NDVI (1999–2012) in accordance with our previous study [30] based on the provincial administration units (Figure 3b). Good consistency was also shown between these two metrics (R2 = 0.959; p < 0.001).

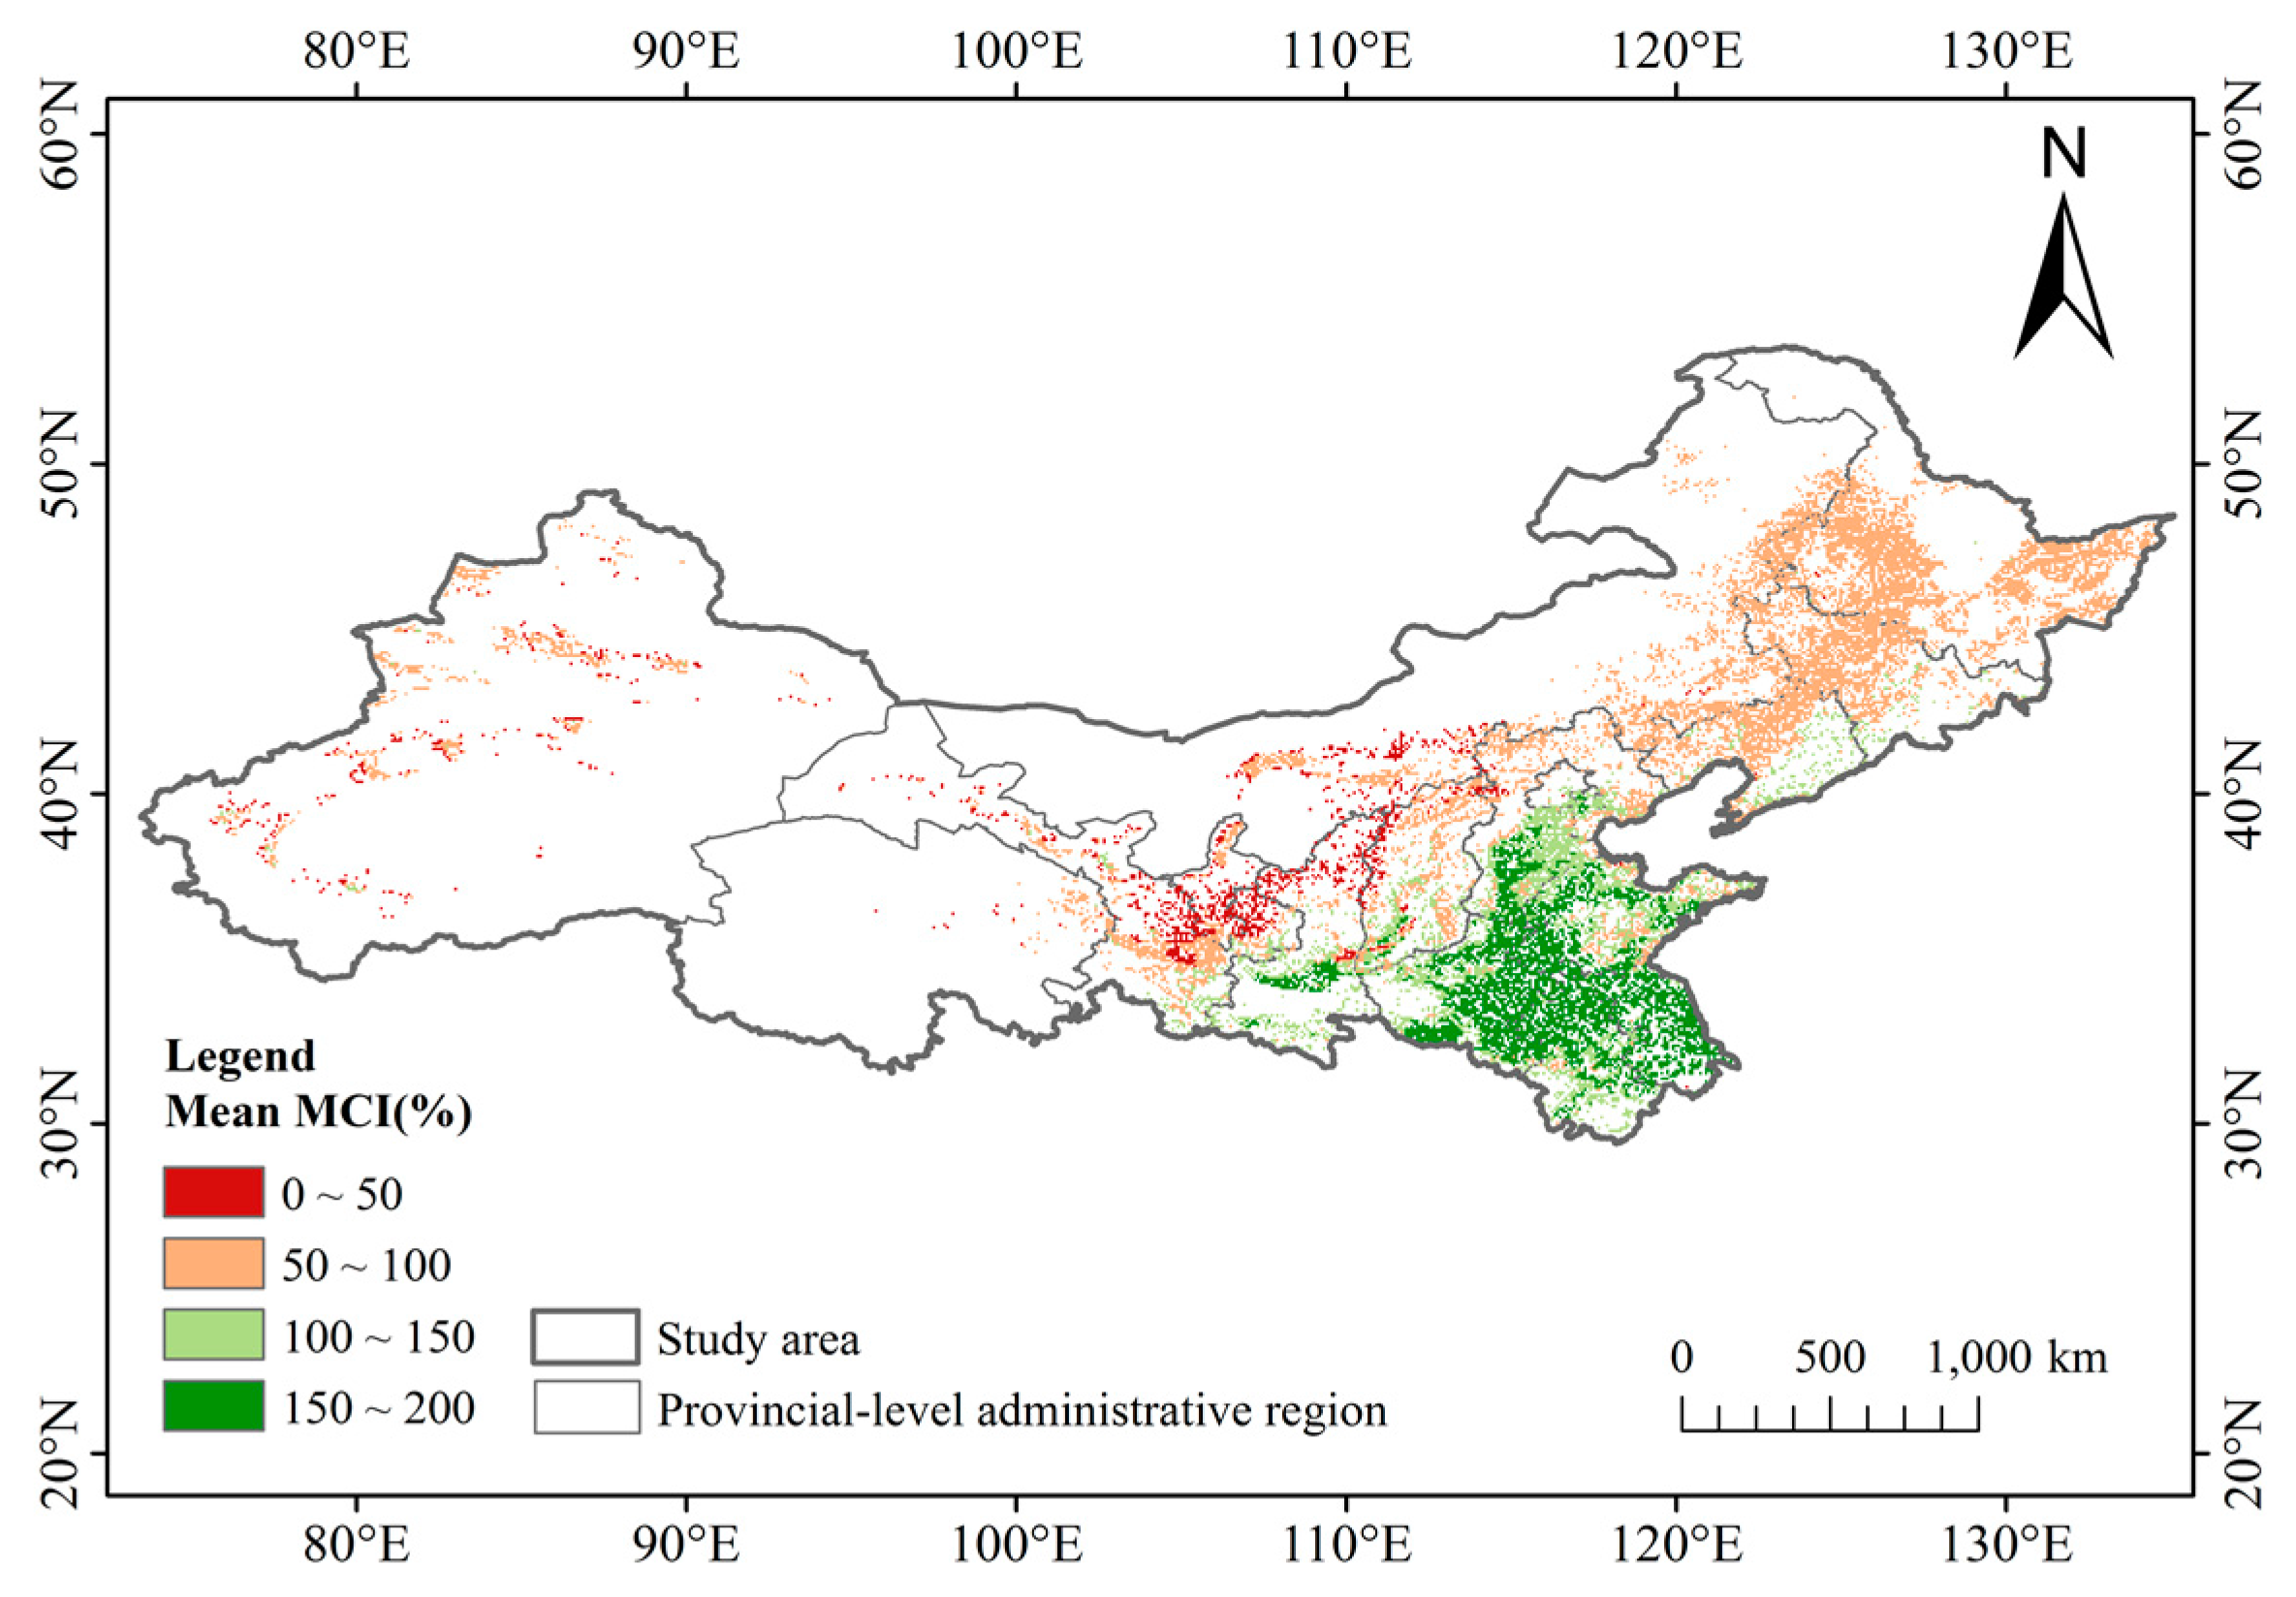
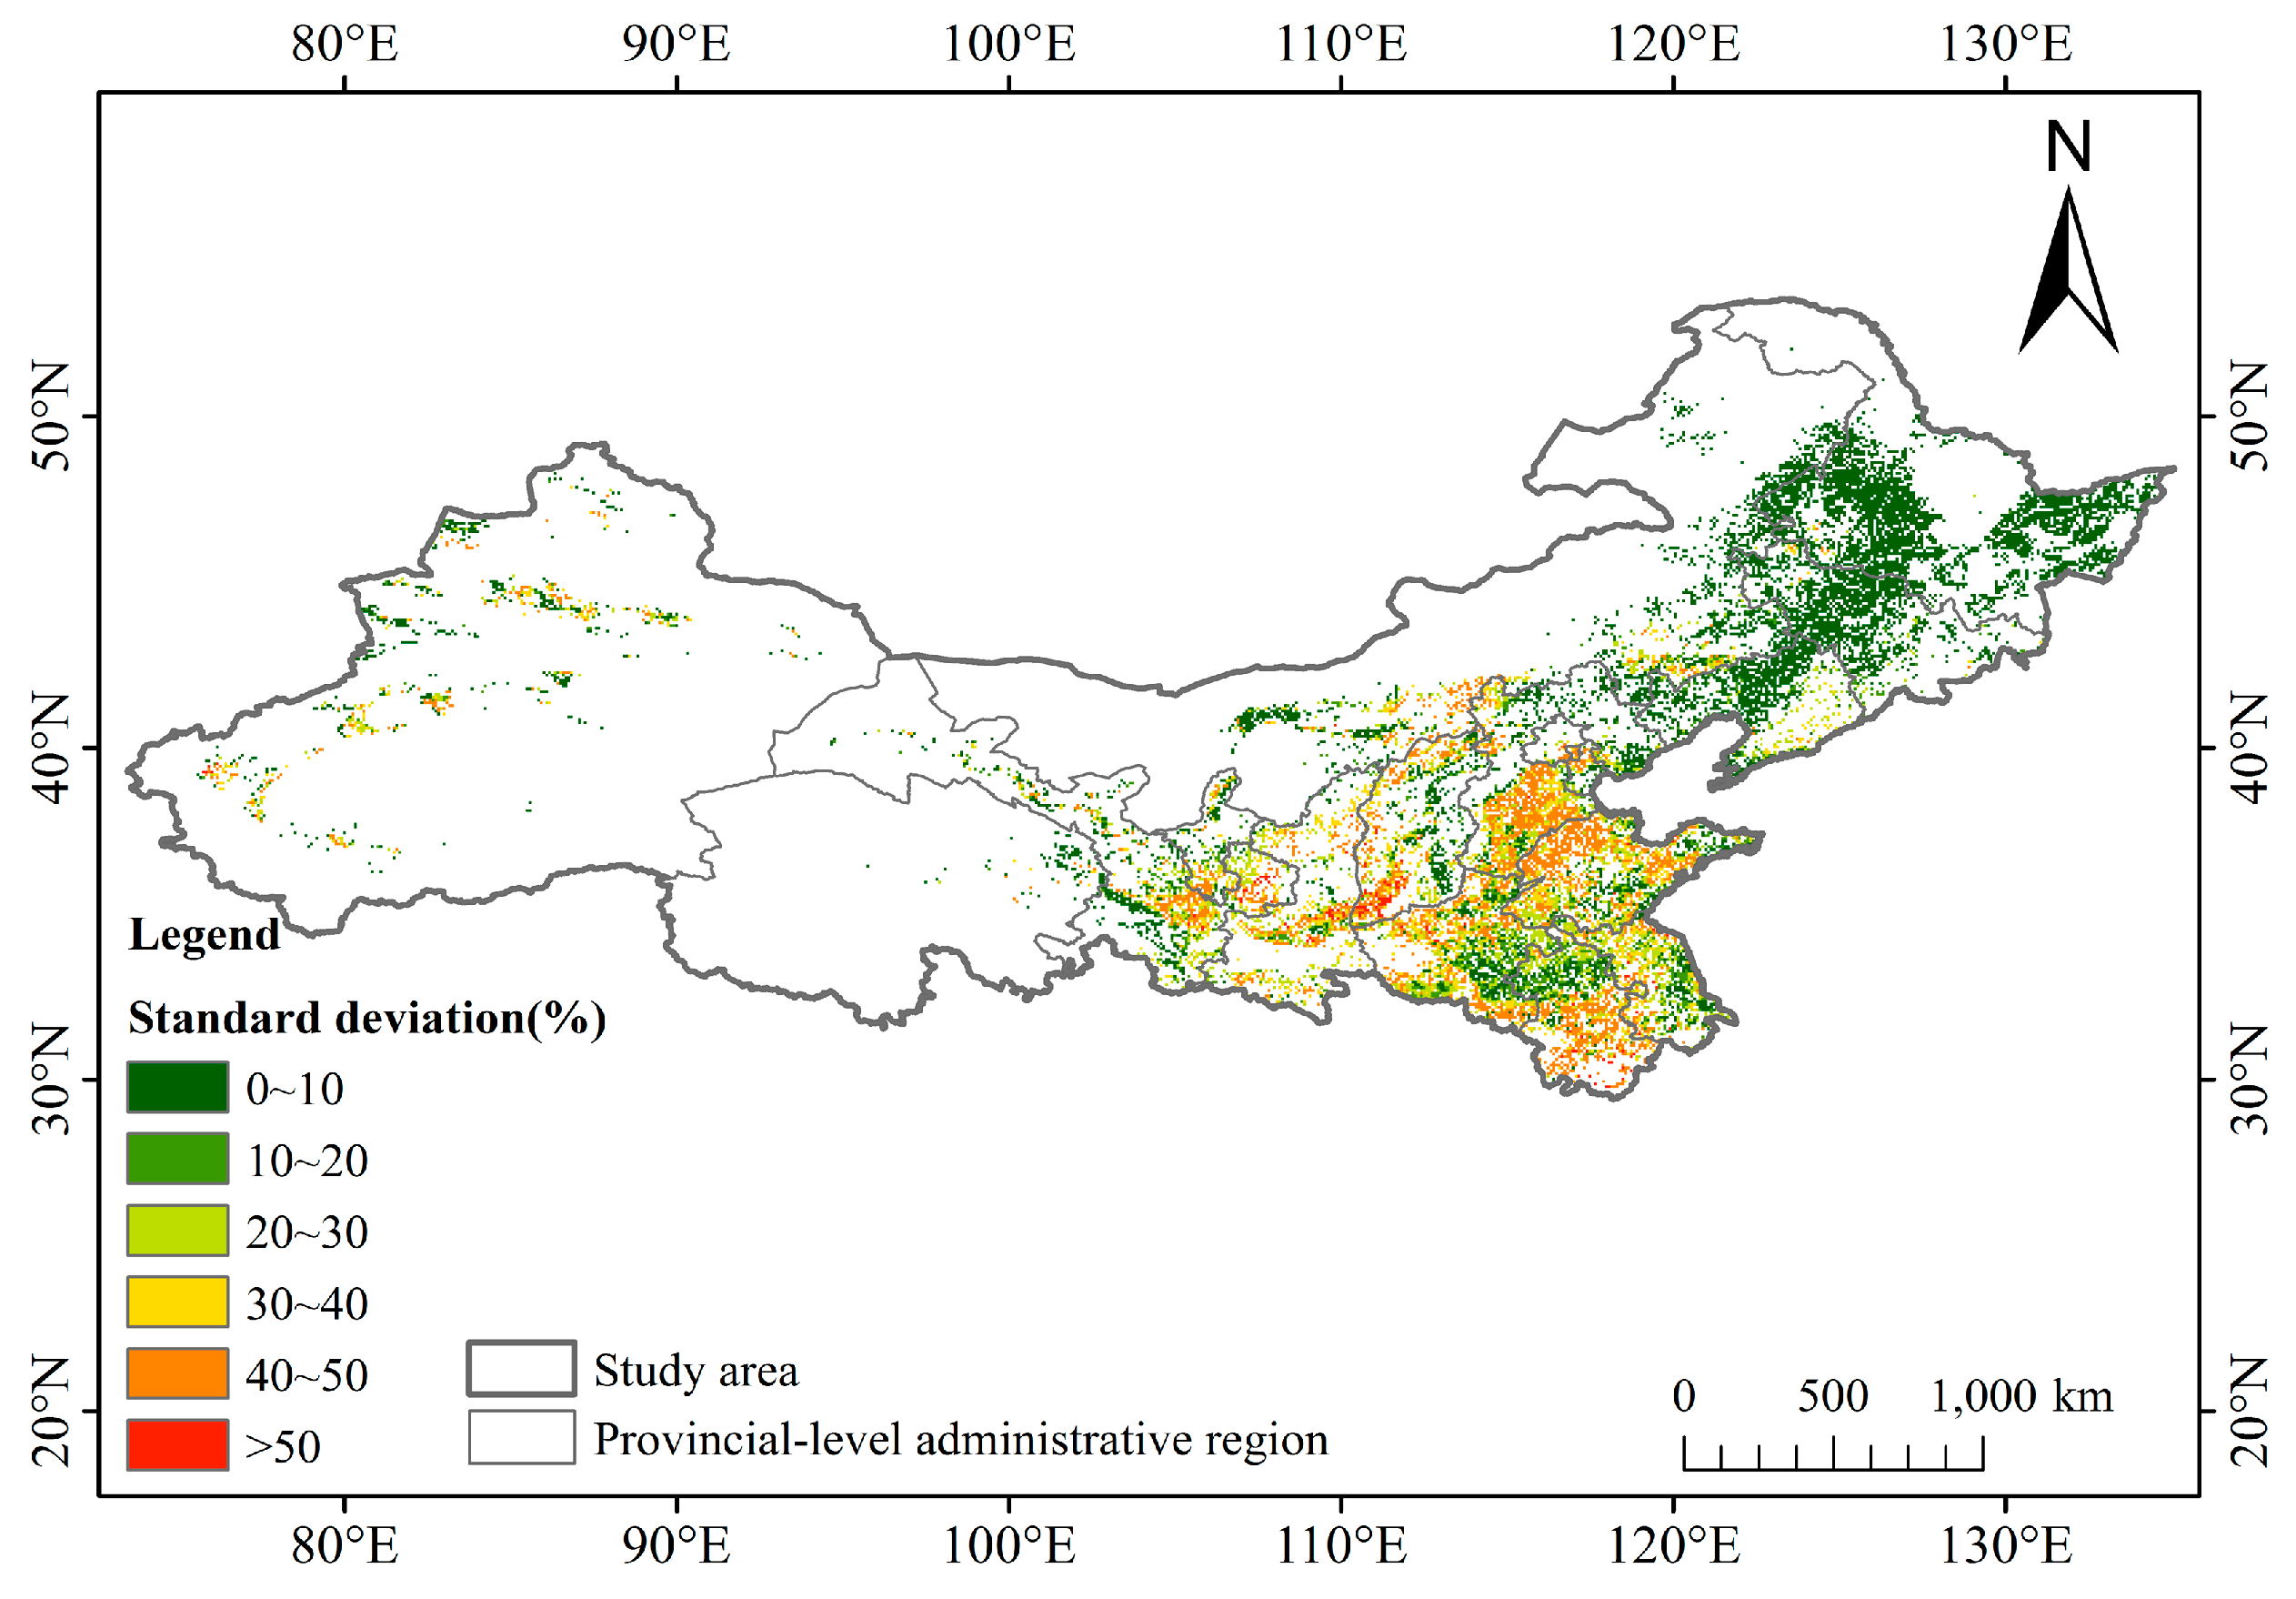
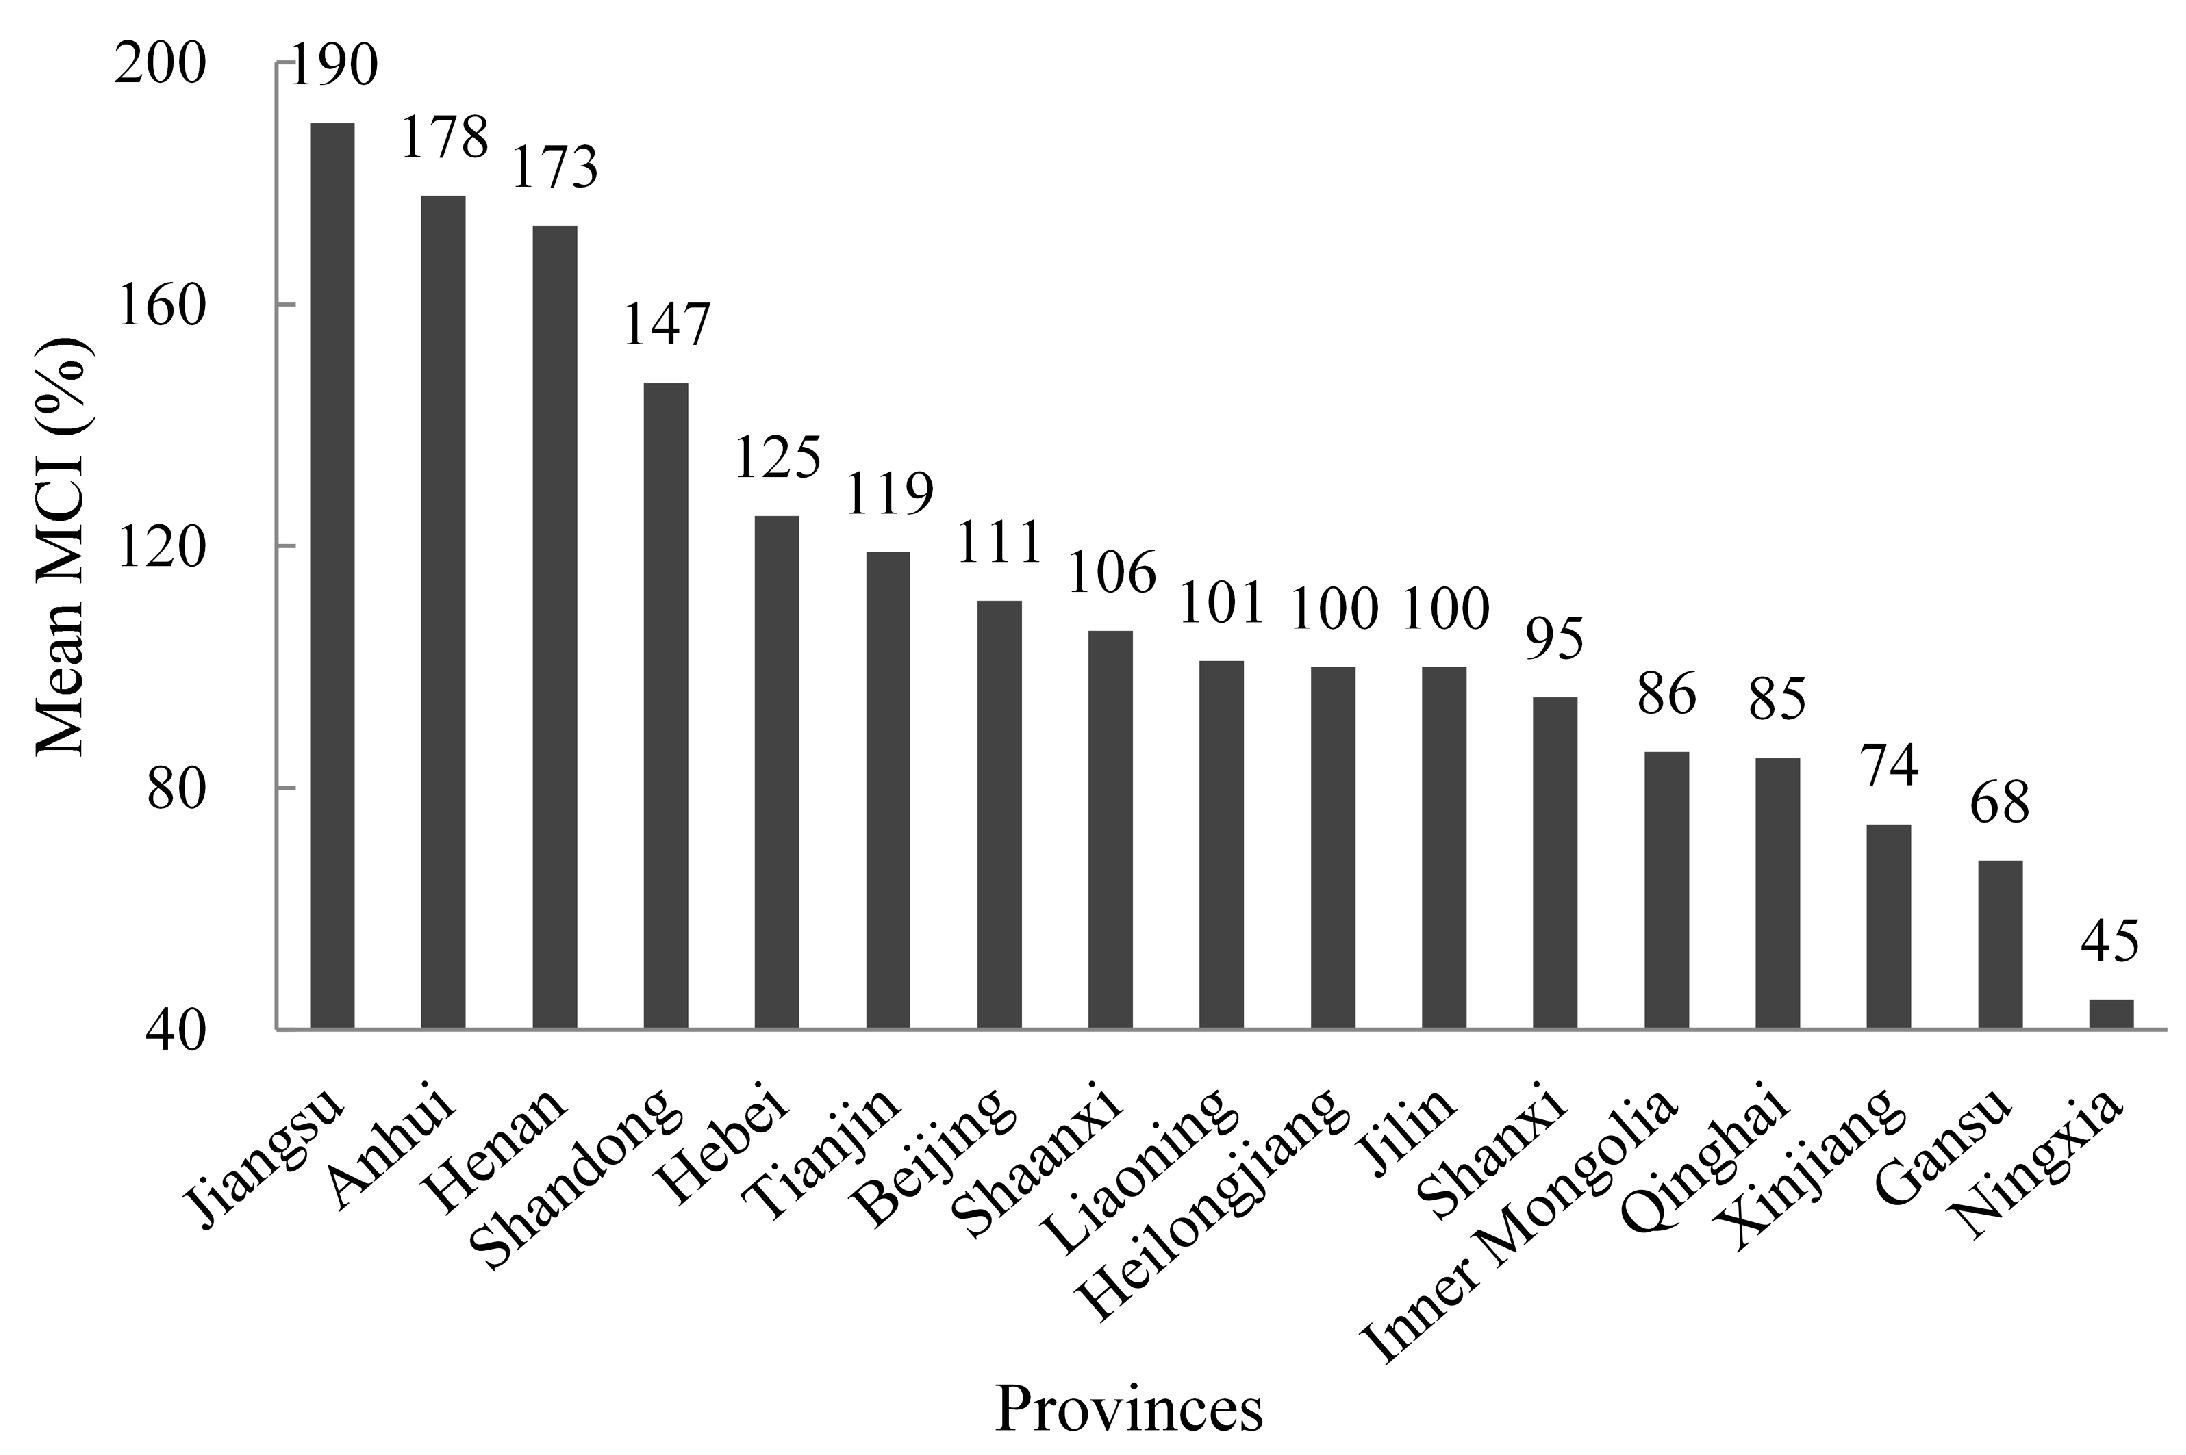
3.2. Statistical Summary of MCI Values from 1982 to 2012

The spatial pattern of the GIMMS-based mean MCI values at grid-cells in northern China from 1982 to 2012 is displayed in Figure 4. The mean MCI values were between 0% and 200%. Areas with MCI values less than 100% accounted for 82.7% of the total cropland area. We found that the mean MCI values in the north-eastern portion of the study area (Heilongjiang, Jilin, and Liaoning Province) were approximately 100% on average. The mean MCI values in the north-western portion of the study area were lower than those in the other areas. In northern China, the land area with MCI values between 100% and 200% accounted for just 17.3% of the total cropland area and was mainly distributed in Henan, Jiangsu, Anhui, the south of Hebei, Shaanxi, and Shandong. The agricultural intensity in this area was greater and more stable than in other areas because most cropland was distributed in the plains and the largest plain in China is found here (Figure 5).
The mean MCI across grid-cells from 1982 to 2012 varied greatly between the provinces of northern China from 45% to 190% (Figure 6). The mean MCI values in Jiangsu, Henan, and Anhui provinces were relatively high (>150%), especially in Jiangsu (190%) while the provinces in the north-west of China had relatively low MCI values (<100%).

3.3. Annual Dynamics of the MCI during 1982–2012

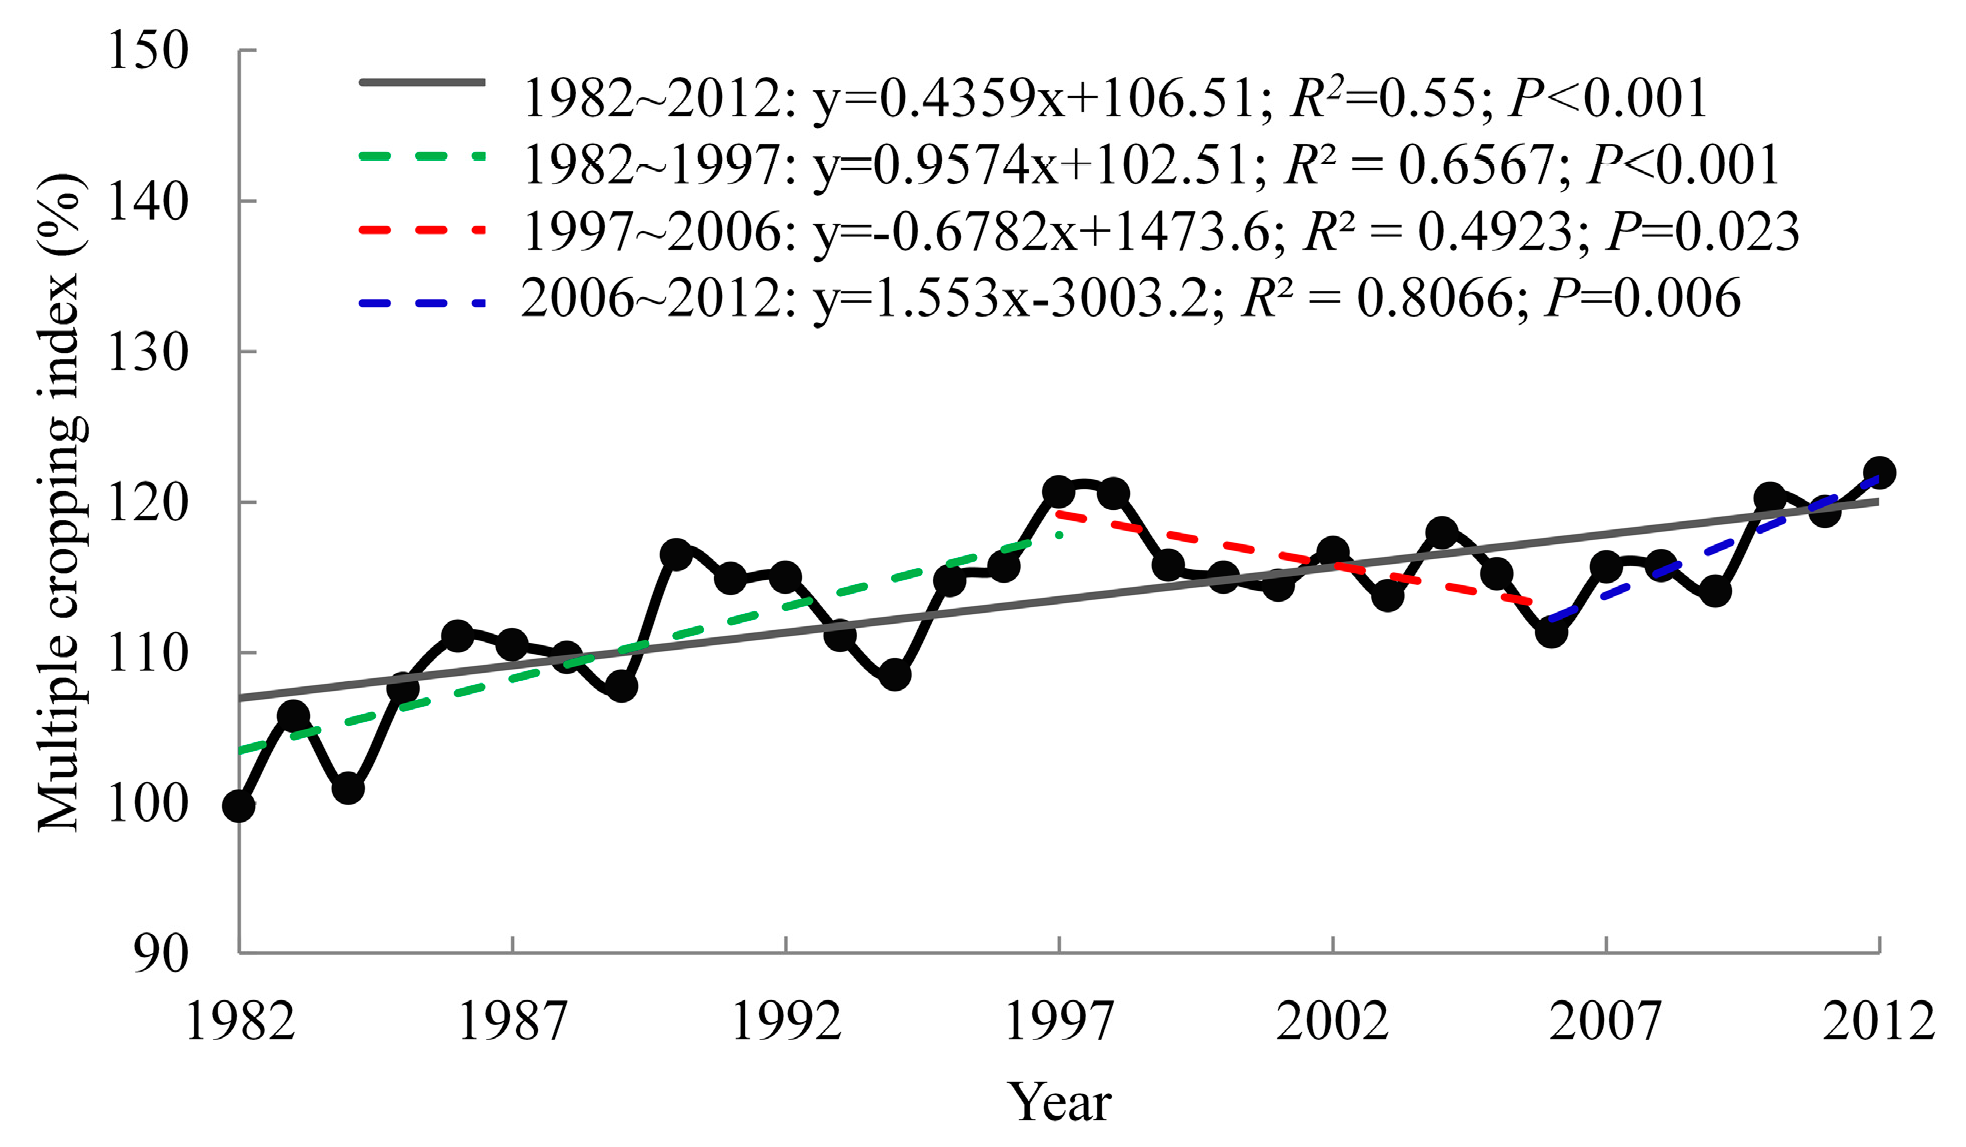
3.3.1. Changes in Mean MCI across Grid-Cells in the Whole of Northern China during 1982–2012

From 1982 to 2012, the mean MCI across grid-cells of the total study area exhibited fluctuations, but showed a statistically significant increasing trend of 4.36% per 10 year interval (p < 0.001) (Figure 7). A significant rising trend of 0.957% per year was evident from 1982 to 1997 (p < 0.001), followed by a wave-like decrease from 1997 to 2006 and then another increasing trend of 1.553% per year after 2006 (p = 0.006).
At the provincial level, we found that the temporal trends in mean MCI across grid-cells could be classified into three types (Figure 8). The first type was MCI showing no obvious variation across the entire study period. This type was apparent in the provinces of north-east China (Heilongjiang, Jilin, Liaoning, and Inner Mongolia). The second type was mean MCI displaying an increasing trend overall, with a turning point at the end of the 1990s. This type was mainly distributed in the developed regions of northern China, such as Hebei, Beijing, Tianjin, and Shandong Provinces. The third type was mean MCI showing a continuous and significant increasing trend. This type was seen mainly in the Shaanxi, Shanxi, Xinjiang, Gansu, Ningxia, Henan, and Anhui Provinces.

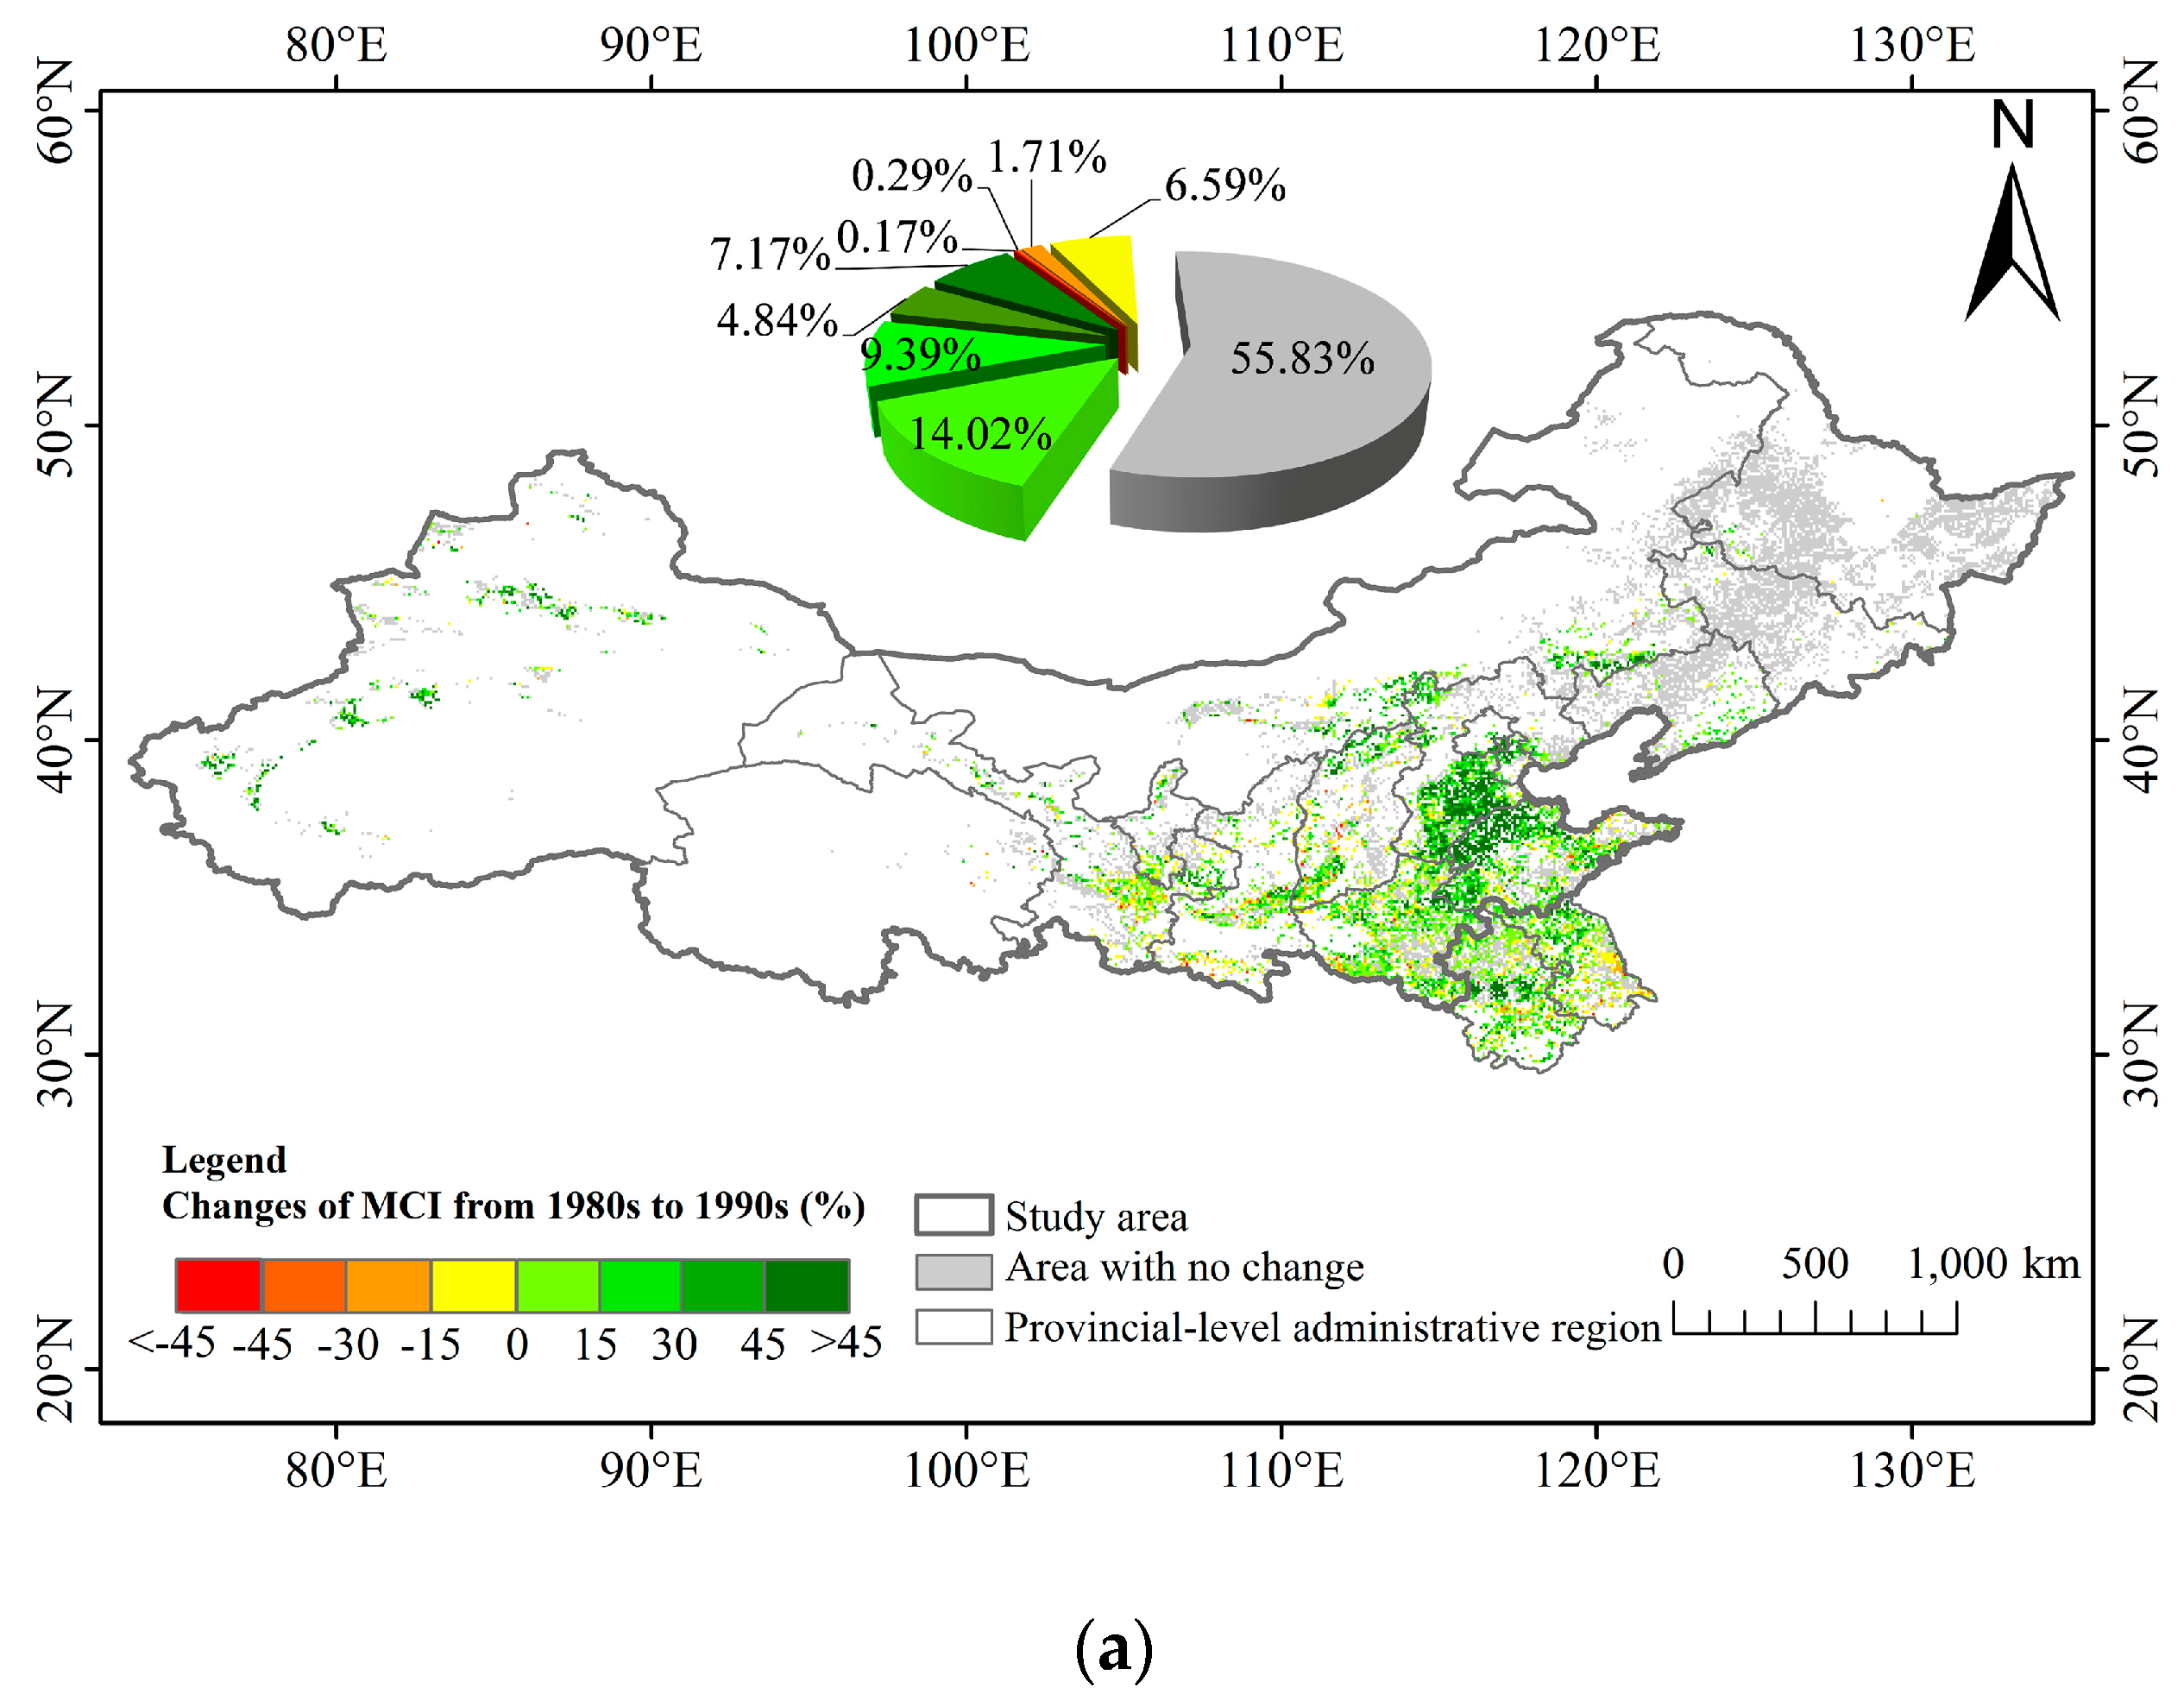
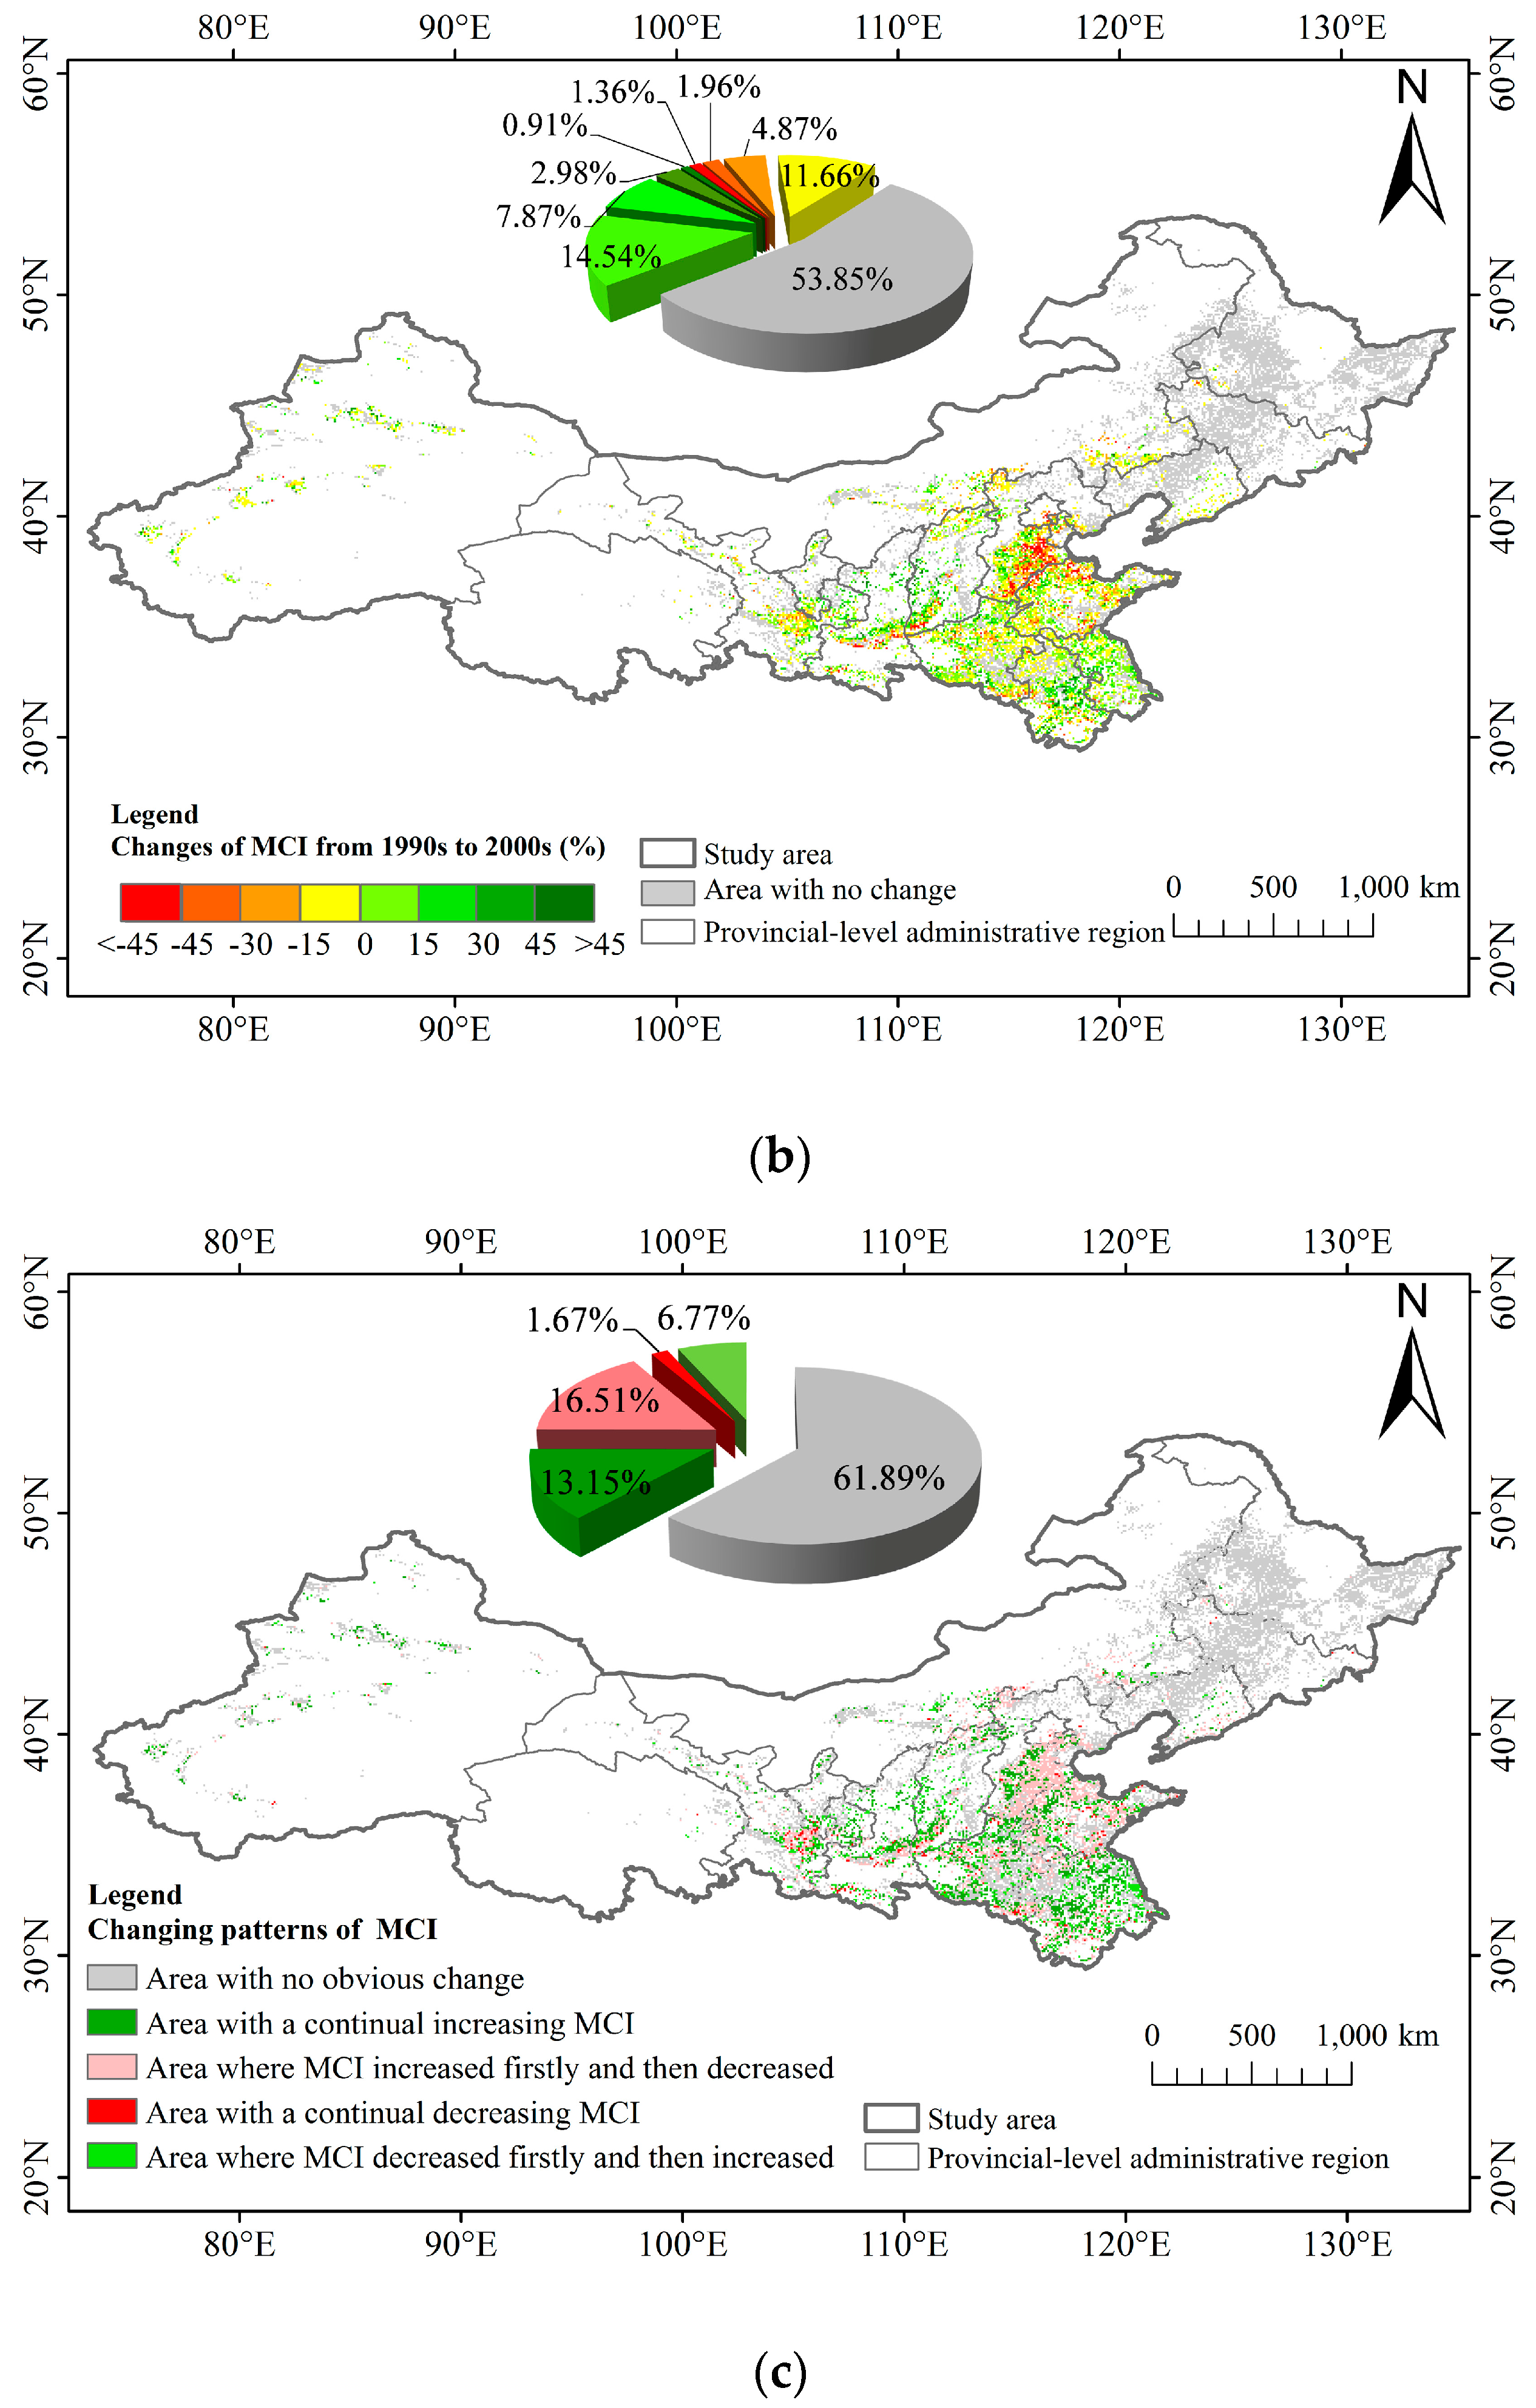
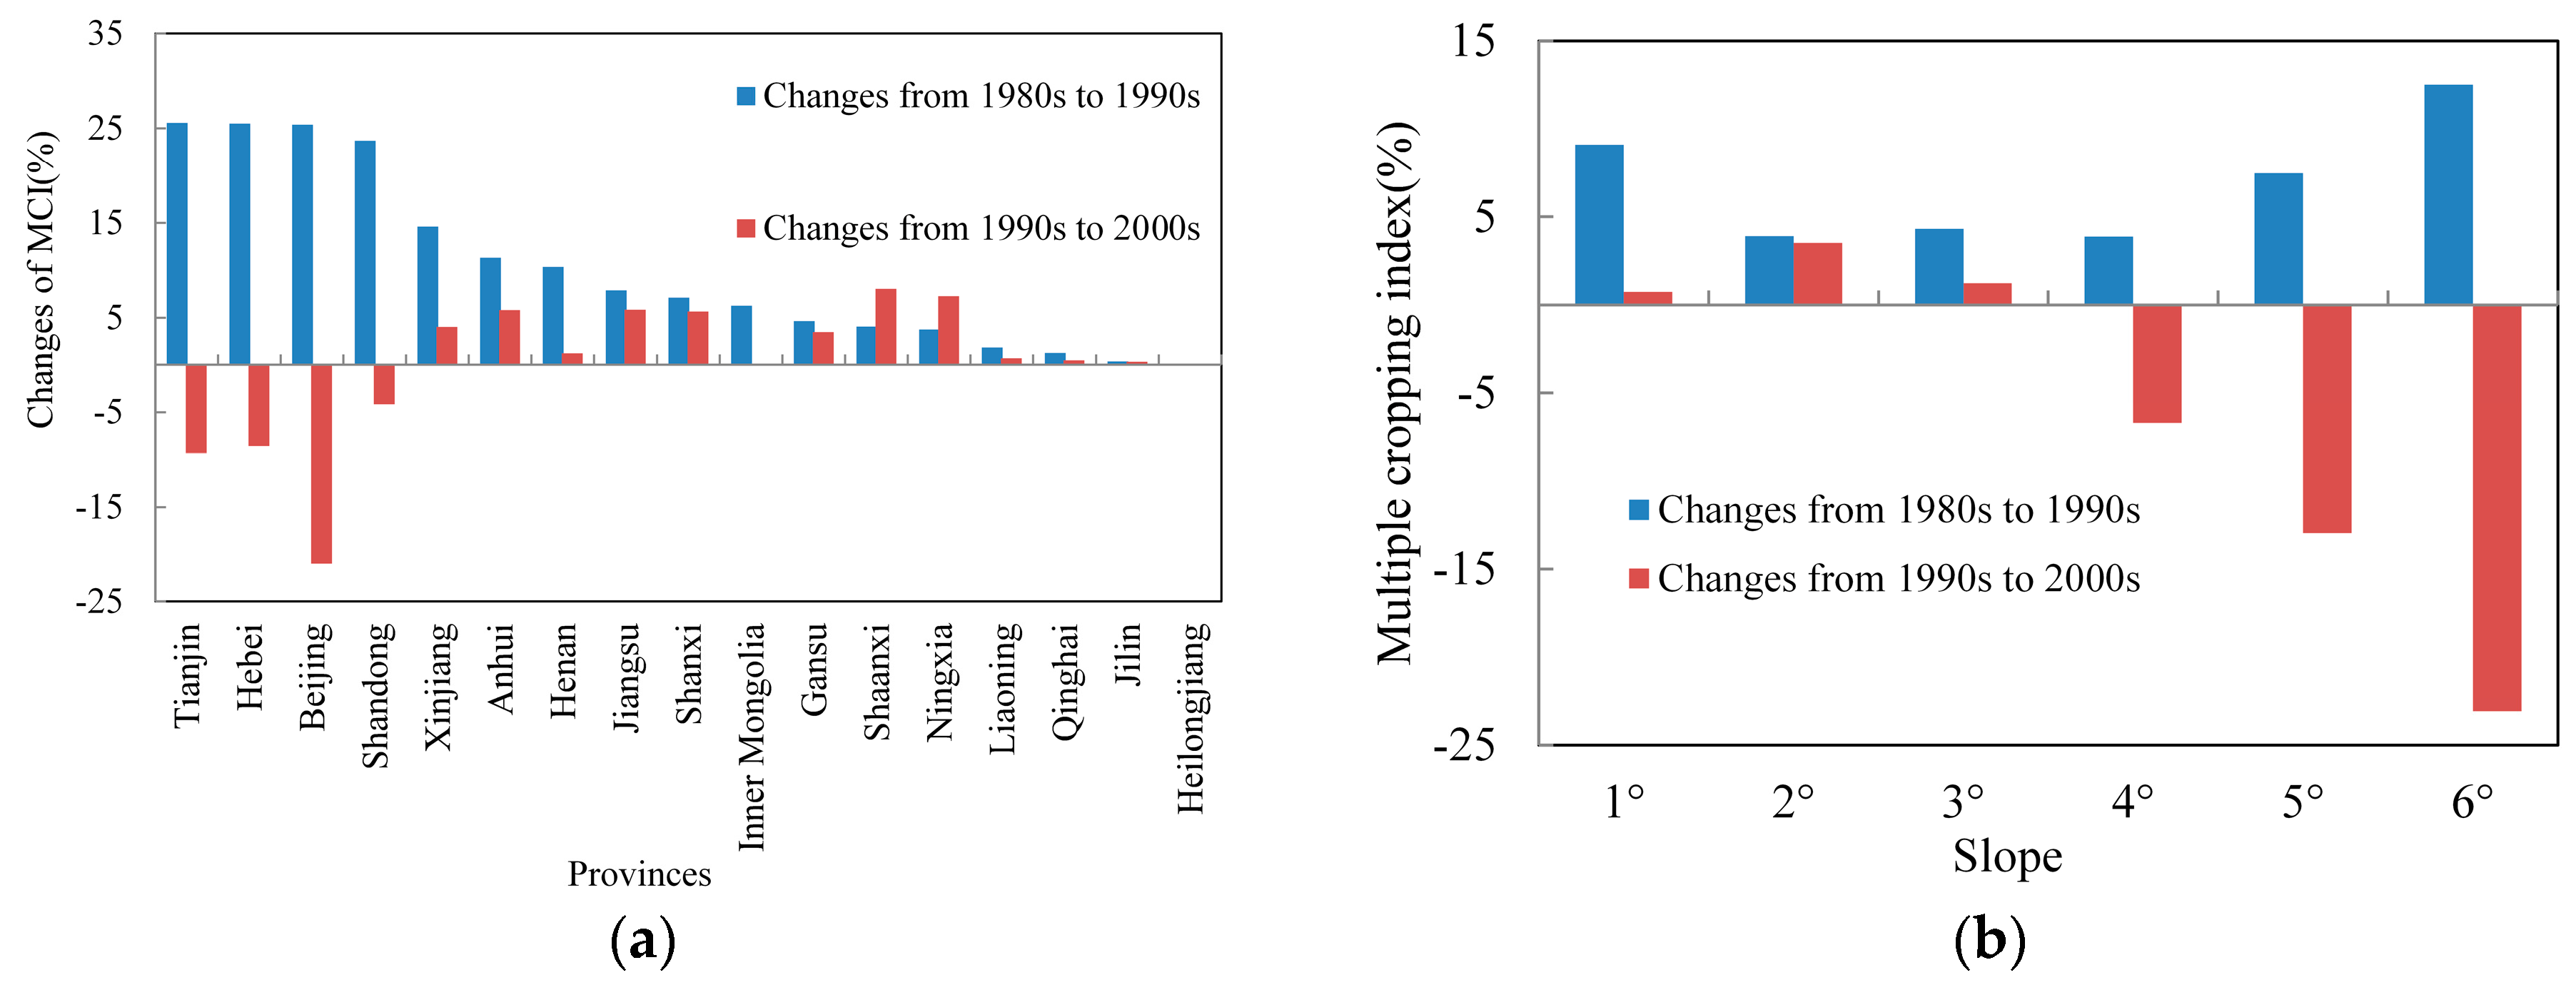
3.3.2. Changing Patterns of MCI from the 1980s to the 2000s

There was spatial–temporal heterogeneity in the MCI of northern China from the 1980s to the 2000s. Areas where there was no obvious change, a continual increasing trend, or a continual decreasing trend in the mean MCI across grid-cells accounted for 61.89%, 13.15%, and 1.67% of the total cropland, respectively. Areas where the MCI increased then decreased or decreased then increased accounted for 16.51% and 6.77% of the total cropland, respectively (Figure 9c).
The mean MCI across the whole of northern China increased from 107% to 115% between the 1980s and the 1990s. However, there was spatial heterogeneity in the trend, with a magnitude of change between −10% and 30% (Figure 9a). The area with an increasing MCI represented 35.43% of the total cropland and was found in the western and eastern study areas, such as Xinjiang, the plains of southern Hebei and northern Shandong, the border of Beijing, Tianjin and Hebei, the southern region of Inner Mongolia, and the middle region of Anhui. A decreasing MCI was found in 8.75% of the total cropland and was found in central Shanxi. Our results are in agreement with the findings of Yan et al. [41]. From the 1990s to the 2000s (Figure 9b), the mean MCI across the grid-cells of northern China showed no obvious change. However, there was spatial heterogeneity during this time as well. A decreasing trend in mean MCI was found across the majority of the study areas, especially in Beijing, the plain of south-eastern Hebei, and north-eastern Shandong. However, increasing MCI was found in 26.30% of the cropland, which included the central and southern study areas, such as central Anhui and the border area of Shanxi and Shaanxi.
According to Figure 9c, there were obvious regional differences in the change of the MCI trend between different periods at grid-cells in northern China. The MCI in the north-eastern region of the study area (including Heilongjiang, Jilin, Liaoning, north of Hebei, and eastern Inner Mongolia) was stable over the past three decades. A continually decreasing MCI trend was found in the central and eastern study areas (including south-east of Gansu, a valley area close to the city in Shaanxi, Shanxi, Henan, and eastern Shandong). An MCI trend that increased first and then decreased was found in other parts of the eastern study area (including Beijing, Tianjin, and the plains areas in south-eastern Hebei). The areas where the MCI showed an increasing trend (either continually increasing or decreasing and then increasing) were mainly found in the western, central, and eastern study areas (including Jiangsu, Henan, south of Anhui, north of the plains area of Hebei, and the plateau area of Gansu, Shaanxi, and Shanxi).
Results based on administrative units indicated that the mean MCI values across the grid-cells of all provinces increased from the 1980s to the 1990s, especially in Tianjin, Hebei, Beijing, Shandong, Xinjiang, and Anhui. Aside from Tianjin, Hebei, Beijing, and Shandong, the mean MCI values of all provinces showed an increasing trend from the 1990s to the 2000s (Figure 10a). Figure 10b shows the changing patterns of mean MCI across grid-cells in cropland with different slopes. From the 1980s to the 1990s, the mean MCI values in cropland with all degrees of slope showed an increasing trend. However, from the 1990s to the 2000s, there was an evident difference in MCI change between the regions with slope ≤3° and the regions with slope >3°. Regions with a slope ≥3° showed a decreasing trend, whereas an inverse trend was observed in regions with slope <3°.

4. Discussion

4.1. Improvement and Uncertainty of the MCI Derived from Remote Sensing

Combined with land use data, GIMMS-3g NDVI data with a spatial resolution of 8 km and a temporal resolution of one half-month were used to generate an MCI time series and subsequently analyse variation in cropping intensity of northern China from 1982 to 2012. Although GIMMS-3g has a relatively coarse spatial resolution compared to SPOT-VGT, which was used in our previous study to produce 1-km resolution MCI maps for the whole of China from 1999 to 2013 [30], this satellite sensor was selected for the longest possible time coverage of northern China. We calculated the mean MCI values across grid-cells of 17 administrative units for 1995, 2000, 2005, and 2010 using GIMMS-NDVI data, SPOT-NDVI data, and land cover data. Good agreement was found between the GIMMS-3g and SPOT MCI datasets (R2 = 0.959; p < 0.001).
Currently, extraction of an MCI from remote sensing data involves two main steps: (1) smoothing the NDVI time-series data and (2) obtaining the frequency of peaks from the smoothed NDVI curves. The S-G filtering method, which is based on a least squares fit of the sliding window, was used in this this paper for its applicability on large study areas without adjustment of parameters. To avoid the sensitivity of the two-difference algorithm to small fluctuations in consecutive NDVI data, efforts were taken by defining strict criteria based on knowledge of crop characteristics in northern China, especially for the pixels containing abandoned farmland or overwintering crops.
To match the resolution of other datasets, land cover data were resampled to the same spatial resolution as NDVI data, based on the criterion that the pixel must contain more than 50% of a specific cropland class to be designated as such. However, this probably resulted in the exclusion of some small arable areas in the mountains, of which information were lost within mixed pixels of multiple different vegetation types. These mixed pixels cause uncertainties in MCI extraction, such as underestimated MCI values in mountain areas compared with relatively accurate estimation in plains areas. Furthermore, various planting patterns, such as intercropping and inter-planting, may influence the NDVI curves of vegetation growth and subsequently affect the NDVI-derived MCI values, particularly in mountain areas.

4.2. Drivers of MCI Changes

The regional-scale MCI in this study showed an increasing trend from 1982 to 2012 (Figure 7); however, there were some fluctuations throughout the entire study period. We found that the timing of these fluctuations matched the timing of changes to China’s agricultural policies and urbanization processes. In the early 1980s, the implementation of the Household Contract Responsibility System raised the efficiency of production and farmers' motivation [42,43]. In the 1990s, the State Monopoly Policy for Grain Purchasing and Marketing was cancelled and the bargain price of grain improved gradually [43]. Additionally, the development of land rental markets, which facilitate mechanization and the implementation of new technologies, has improved the efficiency of agricultural production [44,45]. All of these events may have contributed to the MCI increase from the 1980s to the mid-1990s. However, in the late 1990s and the beginning of the 21st century, China entered the World Trade Organization (WTO), which affected the grain market in China. An enormous transfer of the population from agricultural to non-agricultural areas also occurred at this time during an unprecedented urbanization process [45,46,47]. Each of these changes likely contributed to the MCI decrease. From 2004, the state gradually abolished the agricultural tax until it ended in 2006 and then implemented preferential policies of agricultural subsidies based on the state-issued “No. 1 Central Document”. This state-scale policy may have provided increased motivation for agricultural production and improved land use intensity [48], all of the above imply that agricultural policy and market have substantially influenced the MCI values over time [49].
Excepting agricultural policy and market, some previous studies indicated that the migration of farmers and the rapid growth in the income of farmers have been important factors in MCI variation [7,15,50,51,52]. In our study, we also ran a panel data modelling analysis to identify whether MCI was influenced by the agricultural labour force and found that there was a significant positive relationship between them (Table 1). In actuality, the migration of agricultural labourers is partly driven by maximum benefits, however, the ways in which different farmers seek to maximize benefits vary as a result of differing natural environments and economic levels [7], factors which were spatially diverse throughout the study area. In the mountain areas and/or areas with low economic levels, such as provinces in the north-west of China, farmers seek maximum output from the land to obtain maximum profits because little opportunity exists for workers to move to better-paid jobs in urban areas. This phenomenon thus improves the intensity of land use, which is conveyed through higher MCI values. However, in areas with a high economic level, the high opportunity cost of labour drives the labour into a high-income industry, lowering the intensity of land use, and thus MCI (Figure 8). In the north-east of the study area, one of the most important grain-producing areas of China, the thermal conditions could only meet the demand of single cropping systems [30,53]. Additionally, owing to its flat topography, fertile soil and mechanized farming, the MCI values in most parts of this region were stable (Figure 8). The south of the study area, in areas such as Jiangsu, also has a high-level economy and migration of agricultural labour, but the MCI values had a slight increasing trend (Figure 8). It is likely that agriculture is highly mechanized here because of the high-quality cultivated land and flat topography. This mechanisation would reduce the influence of an outflow of agricultural labour.

4.3. Influence of MCI Values on Grain Production

The factors that influenced grain production in China were various and included changes in agricultural area, MCI, agricultural input, technical efficiency and technological change [54]. As shown in Figure 8, we found a decreasing trend in grain production of some provinces, including Beijing, Tianjin, Jiangsu, and Qinghai despite a slight increasing trend in MCI. This is because a growing quantity of cropland has been converted to housing land or construction land due to rapid urban sprawl and industrialization in these regions. Large losses of agricultural land are found around all major urban areas in these regions, especially the larger areas surrounding Beijing and Tianjin. This phenomenon has posed additional challenges for the security of food provision in China [45]. With urbanization being widespread in China, other regions also face losses of agricultural land around urban areas. Although the MCI trends were generally increasing in these regions, they were relatively weaker than the grain production trend, indicating that there are other factors that may significantly influence grain production. These factors may include agricultural inputs, production efficiency, and technological progress. Neumann et al. [55] hypothesized that the dramatic increase in global grain production over the past 50 years was mainly a consequence of intensified land management and introduction of new technologies. Chemical fertilizer is the most important input in Chinese agriculture and its input has risen rapidly in recent years, generating a positive effect on grain production [54]. These results suggest that China has, at least in certain areas, the potential to increase production and compensate for agricultural area loss by increasing production per unit area. Neumann et al. [55] also surmised that a strong increase in demand for grain in the future may be fulfilled by further agricultural intensification rather than expansion of agricultural areas. However, China’s patterns of land use have already negatively impacted natural resources through land degradation and pollution [54]. Further intensification might damage the long-term sustainability of agricultural production [56].

5. Conclusions

Using the GIMMS-3g NDVI dataset, we obtained an MCI dataset for northern China and explored its spatial and temporal variations throughout 1982–2012. Spatially, MCI values averaged over the entire study period increased gradually from north-west to south-east across the study area of northern China. At a regional scale, the MCI values showed an increasing trend, rising by 4.36% per 10-year interval (p < 0.001). However, MCI changes showed clear spatial and temporal heterogeneity. The mean MCI across grid-cells for all provinces increased from the 1980s to the 1990s, especially in Tianjin, Hebei, Beijing, Shandong, Xinjiang, and Anhui. Aside from Tianjin, Hebei, Beijing, and Shandong, the mean MCI values across grid-cells in the other provinces also showed an increasing trend from the 1990s to the 2000s. We also found that there was an evident difference in MCI change with change in arable slope. With a slope of ≥3°, MCI showed a decreasing trend, while a slope of <3° showed an increasing trend.
Grain production in northern China has increased dramatically over the past 31 years, mainly as a consequence of intensified land use (e.g., increasing MCI) and the introduction of new technologies. However, MCI is also controlled by natural factors (e.g., water, heat, fertility of soil, and overall quality of cropland), labour resource availability, a sharp rise in the cost of farming opportunities, and agricultural policy. Therefore, improving the MCI is very important for the protection of national food security. We posit that the key solutions are to improve agricultural infrastructure construction, promote agricultural mechanisation, increase farmers’ income, and reform farming systems. However, it merits our attention that greater intensification of cropland use may negatively influence the long-term sustainability of agricultural production.

Acknowledgments

This research was supported by the National Natural Science Foundation of China, No. 41571095, 41440004. We are grateful to the anonymous reviewers for their insightful comments that have helped improve this paper substantially.

Author Contributions

Mingjun Ding and Qian Chen designed the study, conducted the analysis, and wrote most of the first draft. Xiangming Xiao and Liangjie Xin contributed to writing the draft, the analysis, and interpretation of the results. Geli Zhang and Lanhui Li contributed to writing the final manuscript and provided technical support and conceptual advice.

Conflicts of Interest

The authors declare no conflict of interest.

References

  1. Josef, S.; Francesco, N.T. Global food security under climate change. Proc. Natl. Acad. Sci. USA 2007, 104, 19703–19708. [Google Scholar]
  2. Khan, S.; Hanjra, M.A.; Mu, J.X. Water management and crop production for food security in China: A review. Agric. Water Manag. 2009, 96, 349–360. [Google Scholar] [CrossRef]
  3. Lichtenberg, E.; Ding, C.R. Assessing farmland protection policy in China. Land Use Policy 2008, 25, 59–68. [Google Scholar] [CrossRef]
  4. Wang, L.; Li, C.C.; Ying, Q.; Cheng, X.; Wang, X.Y.; Li, X.Y.; Hu, L.Y.; Liang, L.; Yu, L.; Huang, H.B.; et al. China’s urban expansion from 1990 to 2010 determined with satellite remote sensing. Chin. Sci. Bull. 2012, 57, 2802–2812. [Google Scholar] [CrossRef]
  5. Long, H.L.; Heilig, G.K.; Li, X.B.; Zhang, M. Socio-economic development and land-use change: Analysis of rural housing land transition in the transect of the yangtse river, China. Land Use Policy 2007, 24, 141–153. [Google Scholar] [CrossRef]
  6. Kuang, W.H.; Liu, J.Y.; Dong, J.W.; Chi, W.F.; Zhang, C. The rapid and massive urban and industrial land expansions in China between 1990 and 2010: A clud-based analysis of their trajectories, patterns, and drivers. Landsc. Urban Plan 2016, 145, 21–33. [Google Scholar] [CrossRef]
  7. Zhu, H.Y.; Li, X.B.; Xin, L.J. Intensity change in cultivated land use in China and its policy implications. J. Nat. Resour. 2007, 22, 907–915. [Google Scholar]
  8. Chen, B.M.; Zhou, X.P. Changes of agriculture resources and grain comprehensive productive capacity of China in recent years. Resour. Sci. 2004, 26, 38–45. [Google Scholar]
  9. Cai, Y.L.; Wang, Y.; Li, Y.P. Study on changing relationship of demand and supply of cultivated land in China. China Land Sci. 2009, 23, 11–18. [Google Scholar]
  10. Turner, B.L.; Doolittle, W.E. The concept and measure of agricultural intensity. Prof. Geogr. 1978, 30, 297–301. [Google Scholar] [CrossRef]
  11. Xu, X.B.; Yang, G.S. Spatial and temporal changes of multiple cropping index in 1995–2010 in taihu lake basin, China. Crops 2013, 29, 148–155. [Google Scholar]
  12. Liu, X.H. A study on the potential of the multiple cropping index in China. Crops 1997, 3, 1–3. [Google Scholar]
  13. Jain, M.; Mondal, P.; DeFries, R.S.; Small, C.; Galford, G.L. Mapping cropping intensity of smallholder farms: A comparison of methods using multiple sensors. Remote Sens. Environ. 2013, 134, 210–223. [Google Scholar] [CrossRef]
  14. Li, X.B. Change of arable land area in China during the past 20 years and its policy implications. J. Nat. Resour. 1999, 14, 329–333. [Google Scholar]
  15. Xin, L.J.; Li, X.B. Changes of multiple cropping in double cropping rice area of southern China and its policy implications. J. Nat. Resour. 2009, 24, 58–65. [Google Scholar]
  16. Jin, S.L.; Hou, L.C.; Xu, L. The relationship between multiple cropping index of arable land change and national food security in the middle and lower reaches of yangtze river. Chin. Agric. Sci. Bull. 2011, 27, 208–212. [Google Scholar]
  17. Zhu, X.L.; Li, Q.; Shen, M.G.; Chen, J.; Wu, M. A methodology for multiple cropping index extraction based on NDVI time-series. J. Nat. Resour. 2008, 23, 534–544. [Google Scholar]
  18. Zuo, L.J.; Dong, T.T.; Wang, X.; Zhao, X.L.; Yi, L. Multiple cropping index of northern China based on MODIS/EVI. Trans. CSAE 2009, 25, 141–146. [Google Scholar]
  19. Dong, J.W.; Xiao, X.M.; Kou, W.L.; Qin, Y.W.; Zhang, G.L.; Li, L.; Jin, C.; Zhou, Y.T.; Wang, J.; Biradar, C.; et al. Tracking the dynamics of paddy rice planting area in 1986–2010 through time series landsat images and phenology-based algorithms. Remote Sens. Environ. 2015, 160, 99–113. [Google Scholar] [CrossRef]
  20. Yan, H.M.; Cao, M.K.; Liu, J.Y.; Zhuang, D.F.; Guo, J.K.; Liu, M.L. Characterizing spatial patterns of multiple cropping system in China from multi-temporal remote sensing images. Trans. CSAE 2005, 21, 85–90. [Google Scholar]
  21. Chen, J.; Jönsson, P.; Tamura, M.; Gu, Z.; Matsushita, B.; Eklundh, L. A simple method for reconstructing a high-quality NDVI time-series data set based on the Savitzky-Golay filter. Remote Sens. Environ. 2004, 91, 332–344. [Google Scholar] [CrossRef]
  22. Lovell, J.; Graetz, R. Filtering pathfinder AVHRR land NDVI data for Australia. Int. J. Remote Sens. 2001, 22, 2649–2654. [Google Scholar] [CrossRef]
  23. Menenti, M.; Azzali, S.; Verhoef, W.; Van Swol, R. Mapping agroecological zones and time lag in vegetation growth by means of fourier analysis of time series of NDVI images. Adv. Space Res. 1993, 13, 233–237. [Google Scholar] [CrossRef]
  24. Roerink, G.; Menenti, M.; Verhoef, W. Reconstructing cloudfree NDVI composites using fourier analysis of time series. Int. J. Remote Sens. 2000, 21, 1911–1917. [Google Scholar] [CrossRef]
  25. Fischer, A. A model for the seasonal variations of vegetation indices in coarse resolution data and its inversion to extract crop parameters. Remote Sens. Environ. 1994, 48, 220–230. [Google Scholar] [CrossRef]
  26. Jönsson, P.; Eklundh, L. Seasonality extraction by function fitting to time-series of satellite sensor data. IEEE Trans. Geosci. Remote Sens. 2002, 40, 1824–1832. [Google Scholar] [CrossRef]
  27. Lu, X.L.; Liu, R.G.; Liu, J.Y.; Liang, S.L. Removal of noise by wavelet method to generate high quality temporal data of terrestrial MODIS products. Photogramm. Eng. Remote Sens. 2007, 73, 1129–1139. [Google Scholar] [CrossRef]
  28. Sakamoto, T.; Yokozawa, M.; Toritani, H.; Shibayama, M.; Ishitsuka, N.; Ohno, H. A crop phenology detection method using time-series MODIS data. Remote Sens. Environ. 2005, 96, 366–374. [Google Scholar] [CrossRef]
  29. Fan, J.L.; Wu, B.F. A methodology for retrieving cropping index from NDVI profile. J. Remote Sens. 2004, 8, 628–636. [Google Scholar]
  30. Ding, M.J.; Chen, Q.; Xin, L.J.; Li, L.H.; Li, X.B. Spatial and temporal variations of multiple cropping index in China based on spot-NDVI during 1999–2013. ACTA Geogr. Sin. 2015, 70, 1080–1090. [Google Scholar]
  31. Biradar, C.M.; Xiao, X. Quantifying the area and spatial distribution of double-and triple-cropping croplands in india with multi-temporal MODIS imagery in 2005. Int. J. Remote Sens. 2011, 32, 367–386. [Google Scholar] [CrossRef]
  32. Pinzon, J.E.; Tucker, C.J. A non-stationary 1981–2012 avhrr NDVI3g time series. Remote Sens. 2014, 6, 6929–6960. [Google Scholar] [CrossRef]
  33. Global Inventory Modeling and Mapping Studies (GIMMS) NDVI Dataset from 1982 to 2012. Available online: http://ecocast.Arc.Nasa.Gov/data/pub/gimms/3g.V0/ (accessed on 27 October 2016).
  34. Holben, B.N. Characteristics of maximum-value composite images from temporal AVHRR data. Int. J. Remote Sens. 1986, 7, 1417–1434. [Google Scholar] [CrossRef]
  35. Rahman, H.; Dedieu, G.S. A simplified method for the atmospheric correction of satellite measurements in the 586 solar spectrum. Remote Sens. 1994, 15, 123–143. [Google Scholar] [CrossRef]
  36. Système Pour l’Observation de la Terre (SPOT) NDVI Dataset from April 1998 to 2012. Available online: http://www.Vgt.Vito.Be (accessed on 27 October 2016).
  37. Maisongrande, P.; Duchemin, B.; Dedieu, G. Vegetation/spot: An operational mission for the earth monitoring; presentation of new standard products. Int. J. Remote Sens. 2004, 25, 9–14. [Google Scholar] [CrossRef]
  38. Farr, T.G.; Rosen, P.A.; Caro, E.; Crippen, R.; Duren, R.; Hensley, S.; Kobrick, M.; Paller, M.; Rodriguez, E.; Roth, L. The shuttle radar topography mission. Rev. Geophys. 2007, 45. [Google Scholar] [CrossRef]
  39. Liu, J.Y.; Kuang, W.H.; Zhang, Z.X.; Xu, X.L.; Qin, Y.W.; Ning, J.; Zhou, W.C.; Zhang, S.W.; Li, R.D.; Yan, C.Z.; et al. Spatiotemporal characteristics, patterns, and causes of land-use changes in China since the late 1980s. J. Geogr. Sci. 2014, 24, 195–210. [Google Scholar] [CrossRef]
  40. Ma, M.G.; Veroustraete, F. Reconstructing pathfinder avhrr land NDVI time-series data for the northwest of China. Adv. Space Res. 2006, 37, 835–840. [Google Scholar] [CrossRef]
  41. Yan, H.M.; Liu, J.Y.; Cao, M.K. Remotely sensed multiple cropping index variations in China during 1981–2000. Acta Geogr. Sin. 2005, 60, 559–566. [Google Scholar]
  42. Nie, Z.B. 30 Years of Grain Distibution System Reform in China (1978–2008); Economy & Management Press: Beijing, China, 2009. [Google Scholar]
  43. Chen, J.C.; Liu, J.B.; Fang, S.Y.; Li, Q. Chinese agricultural policies in thirty years and analysis on the effects. China Popul. Resour. Environ. 2008, 18, 1–6. [Google Scholar]
  44. Deininger, K.; Jin, S.Q. The potential of land rental markets in the process of economic development: Evidence from China. J. Dev. Econ. 2005, 78, 241–270. [Google Scholar] [CrossRef]
  45. Li, J.; Deng, X.Z.; Seto, K.C. The impact of urban expansion on agricultural land use intensity in China. Land Use Policy 2013, 35, 33–39. [Google Scholar]
  46. Han, C. Migrant Workers in China; Cengage Learning Asia: Beijing, China, 2011. [Google Scholar]
  47. Long, H.L.; Li, Y.L.; Liu, Y.S.; Woods, M.; Zou, J. Accelerated restructuring in rural China fueled by ‘increasing vs. decreasing balance’ land-use policy for dealing with hollowed villages. Land Use Policy 2012, 29, 11–22. [Google Scholar] [CrossRef]
  48. Zou, W.; Wu, Q.; Qu, F.T. Influence of agricultural tax exemptions on farmers’ land use behavior. Resour. Sci. 2008, 30, 932–938. [Google Scholar]
  49. Yu, Q.Y.; Wu, W.B.; Verburg, P.H.; van Vliet, J.; Yang, P.; Zhou, Q.B.; Tang, H.J. A survey-based exploration of land-system dynamics in an agricultural region of northeast China. Agric. Syst. 2013, 121, 106–116. [Google Scholar] [CrossRef]
  50. Yang, R.; Liu, Y.S.; Chen, Y.F.; Li, T.T. The remote sensing inversion for spatial and temporal changes of multiple cropping index and detection for influencing factors around bohai rim in China. Sci. Geogr. Sin. 2013, 33, 588–593. [Google Scholar]
  51. Xin, L.J.; Li, X.B.; Tan, M.H.; Hao, H.G. The rise of ordinary labor wage and its effect on agricultural land use in present China. Geogr. Res. 2011, 30, 1391–1400. [Google Scholar]
  52. Xie, H.L.; Liu, G.Y. Spatiotemporal difference and determinants of multiple cropping index in China during 1998–2012. J. Geogr. Sci. 2015, 25, 1283–1297. [Google Scholar] [CrossRef]
  53. Dong, J.W.; Liu, J.Y.; Tao, F.L.; Xu, X.L.; Wang, J.B. Spatio-temporal changes in annual accumulated temperature in China and the effects on cropping systems, 1980s to 2000. Clim. Res. 2009, 40, 37–48. [Google Scholar] [CrossRef]
  54. Verburg, P.H.; Chen, Y.; Veldkamp, T. Spatial explorations of land use change and grain production in China. Agric. Ecosyst. Environ. 2000, 82, 333–354. [Google Scholar] [CrossRef]
  55. Neumann, K.; Verburg, P.H.; Stehfest, E.; Müller, C. The yield gap of global grain production: A spatial analysis. Agric. Syst. 2010, 103, 316–326. [Google Scholar] [CrossRef]
  56. Smil, V. China's Environmental Crisis: An Inquiry into the Limits of National Development; ME Sharpe: New York, NY, USA, 1993. [Google Scholar]
Figure 1. The landform and location of the study area.
Sustainability 08 01123 g001
Figure 2. Raw Global Inventory Modeling and Mapping Studies (GIMMS)-normalized difference vegetation index (NDVI) and reconstructed NDVI time series over a period of three years (2004–2006) derived using the Savitzky-Golay (S-G) technique, where pixels represented (a) a single cropping system (122.54° E, 45.67° N) and (b) a double cropping system (120.34° E, 33.13° N).
Sustainability 08 01123 g002
Figure 3. Correlation of the multiple cropping index (MCI) derived from GIMMS-NDVI with (a) the statistical multiple cropping index (MCI) and (b) SPOT-NDVI, based on provincial administration units.
Sustainability 08 01123 g003
Figure 4. Mean multiple cropping index (MCI) over years 1982–2012 at grid-cells of northern China based on the GIMMS-NDVI dataset.
Sustainability 08 01123 g004
Figure 5. Standard deviation (SD) of the multiple cropping index (MCI) in northern China based on the 8-km resolution from the 1982–2012 GIMMS-NDVI dataset.
Sustainability 08 01123 g005
Figure 6. Mean of annual mean multiple cropping index (MCI) across grid-cells in each province of northern China during 1982–2012.
Sustainability 08 01123 g006
Figure 7. Trend of changing mean multiple cropping index (MCI) across grid-cells in the whole of northern China during 1982–2012.
Sustainability 08 01123 g007
Figure 8. Changes in mean multiple cropping index (MCI) across grid-cells, grain yield, and agricultural population in provinces of northern China during 1982–2012.
Sustainability 08 01123 g008
Figure 9. Spatial distribution of change in multiple cropping index (MCI) within different periods in northern China: (a) from the 1980s to the 1990s; (b) from the 1990s to the 2000s and (c) its processes.
Sustainability 08 01123 g009aSustainability 08 01123 g009b
Figure 10. Characteristics of changes in mean multiple cropping index (MCI) across grid-cells in (a) different provinces and (b) different slopes.
Sustainability 08 01123 g010
Table 1. Results of panel data regression.
MCI
Fixed EffectRandom Effect
Agricultural population0.37 **0.66 ***
(0.18)(0.15)
Cons98.69 ***91.04 ***
(4.89)(7.46)
F4.130
P[0.000]
Chi2 18.19
P [0.000]
Hausman8.2
P[0.004]
R20.6010.601
Sample number527527
Standard errors in parentheses; ** p <0.05, *** p < 0.01.

