Regional-Level Allocation of CO2 Emission Permits in China: Evidence from the Boltzmann Distribution Method

1
School of Economics and Management, North China Electric Power University, Beijing 102206, China
2
Beijing Key Laboratory of New Energy and Low-Carbon Development (North China Electric Power University), Beijing 102206, China
*
Author to whom correspondence should be addressed.
Sustainability 2018, 10(8), 2612; https://doi.org/10.3390/su10082612
Submission received: 11 June 2018
/
Revised: 7 July 2018
/
Accepted: 23 July 2018
/
Published: 25 July 2018
(This article belongs to the Special Issue Clean Waste to Energy)
Abstract
:To achieve the commitment of carbon emission reduction in 2030 at the climate conference in Paris, it is an important task for China to decompose the carbon emission target among regions. In this paper, entropy maximization is brought to inter-provincial carbon emissions allocation via the Boltzmann distribution method, which provides guidelines for allocating carbon emissions permits among provinces. The research is mainly divided into three parts: (1) We develop the CO2 influence factor, including per capita GDP, per capita carbon emissions, carbon emission intensity and carbon emissions of per unit industrial added value; the proportion of the second industry; and the urbanization rate, to optimize the Boltzmann distribution model. (2) The probability of carbon emission reduction allocation in each province was calculated by the Boltzmann distribution model, and then the absolute emission reduction target was allocated among different provinces. (3) Comparing the distribution results with the actual carbon emission data in 2015, we then put forward the targeted development strategies for different provinces. Finally, suggestions were provided for CO2 emission permits allocation to optimize the national carbon emissions trading market in China.
1. Introduction
It is a great concern in the international community that global greenhouse gases in the atmosphere have caused climate change. In 2005, it is estimated that the contribution of CO2 among all greenhouse gases to global warming exceeds 50% by the Intergovernmental Panel on Climate Change (IPCC) [1]. As the largest developing country and the largest carbon emission country in the world, it is a great responsibility for China to reduce CO2 emission. At the Paris climate conference in 2015, China once made a commitment to reduce carbon intensity by 60–65% in 2030 based on the level in 2005 [2].
However, there are enormous challenges to achieve China’s carbon emission reduction commitments. The establishment of the national carbon market is an important measure to reduce emissions at the national level. With the huge regional disparity, and seven pilot cities (Beijing, Shanghai, Tianjin, Chongqing, Hubei, Guangdong and Shenzhen) for carbon market has not been involved in the allocation of inter-provincial CO2 emission permits. It has become the focus of attention to establish an inter-provincial CO2 emission permit allocation scheme giving consideration to both fairness and efficiency. How to balance the fairness, efficiency and acceptability in a regional permits allocation scheme is still a difficult problem in current research.
In this paper, the inter-provincial allocation of carbon emissions permits is carried out by the Boltzmann distribution based on maximum entropy, which belongs to the field of economic physics [3], that is, the mathematical ideas and methods of physics were used to solve the problems in economics. To simplify the analysis, we assume that the CO2 emissions of the provinces are independent; CO2 emission reduction targets can be converted into CO2 emission permits and distributed among 30 provinces. Meanwhile, if different distribution principles and plans are formulated according to different regional characteristics, it will inevitably increase the difficulty of permits allocation. Therefore, from the significance and reality of allocating the carbon emission permits, it is necessary to follow the same standard which adequately contains regional differences. Factors such as economic development, industrial structure, technical level, energy consumption, carbon emissions intensity, and energy resources are quite different in different areas, and these also lead to cost reduction and potential differences which need to be paid more attention.
Based on the principle of fairness and efficiency, this paper focuses on the allocation of the permits of CO2 emission reduction in 30 provinces in China, and compares the results between the Boltzmann distribution and the actual emission reduction, and puts forward the development proposals to promote the CO2 emission reduction. Besides, it is very significant to study the distribution of inter-provincial carbon emission reduction, not only laying the solid foundation for the national carbon market, but also accelerating the carbon emission reduction process from the angle of fairness of the provinces, and is conductive to the realization of international commitments on emission reduction targets. In general, the main contributions of this paper include:
- We define the CO2 influence factor as a composite index of factors that affect carbon emissions. Considering the economic development level, urbanization level, energy structure, industrial structure, opening up level and so on as an important reference for the allocation of carbon emission permits in different provinces.
- CO2 emission reduction distribution model was constructed based on the simplicity of Boltzmann distribution, and applied to the inter-provincial distribution model of CO2 emission permits in China to avoid the subjectivity of allocation. Through the Boltzmann distribution model, the maximum entropy is introduced into the carbon emissions, which provides guidance for the allocation of inter-provincial carbon permits.
- Comparison and analysis between the Boltzmann distribution model and real emission reduction data. According to the characteristics of different provinces, we put forward the corresponding allocation strategy and suggestions on the permits allocation of the national carbon emissions trading market in China.
The remainder of this study is organized as follows. Section 2 mainly introduces some literature related to the study. Section 3 presents the methods and model adopted in this paper. The empirical results and the interpretations of the comparison results are reported in Section 4. Finally, we summarize the conclusions of this paper and put forward several policy recommendations in Section 5.
2. Relevant Literature Review
2.1. Factor Analysis of Carbon Emission Difference among Regions
The differences in carbon emissions among different regions were first proposed by IPCC in 1996. The results indicate that greenhouse gases have different impacts on climate change under different economic conditions [4]. The main factors of carbon emission difference among different regions include indicators analysis, decomposition analysis and cluster analysis. In the indicator’s analysis method, Hedenus et al. [5] proposed Atkinson indicators to measure the inequity of per capita emission among countries. Duro et al. [6] stressed the Theil indicators to explain the unfairness of per capita emissions, largely due to the inequality of per capita income. Heil et al. [7,8] combined Gini coefficients to measure the unfair emissions per capita in different countries.
In factor decomposition analysis, it brings the related factors of carbon emission into the same framework, and obtains the quantitative analysis results of each factor through the deformation of mathematical formula. The earliest factor decomposition model is the IPAT equation proposed by Ehrlich and Holdren [9,10] for human’s impact on the environment. On the basis of IPAT, the Japanese scholar Yoichi Kaya proposed the Kaya carbon emission equation. Scholars [11,12,13,14] also investigated LMDI and Kaya identity models to study energy and carbon emission factors. Xu, Shichun et al. [15] rewrote the Kaya identity, and analyzed the influencing factors of carbon emissions in china by the decomposition of carbon emissions related to energy consumption. Zhang, J, Y et al. [16] proposed the LMDI method to study the energy-related carbon emissions and the proportion of emissions of various sectors in Beijing. Lin, Boqiang et al. [17] assessed the LMDI decomposition method to quantitatively analyze the impact of energy intensity, industrial activity and carbon intensity on energy-related carbon emissions.
Some scholars studied the degree of importance of carbon emission factors by IPAT [18] or STIRPAT [19] models. Wang, Zhaohua et al. [20] combined the improved STIRPAT model to study the impact of urbanization level, the proportion of the third industry, energy intensity and R&D output on carbon emissions. Li Huanan et al. [21] explored the driving force of the impact of China’s carbon emissions based on Path-STIRPAT model. Brantley Liddle [22] investigated a stochastic IPAT model and STIRPAT to examine the impact of population and affluence on carbon emissions from transportation and household electricity consumption in developed and developing countries.
There are also scholars exploring other models, such as Yu [23], who proposed the Shapley value decomposition method of population, industry classification and resident income of carbon emission factors, and controlling area carbon emission through controlling the carbon emission factors. Zhang and Da [24] combined PDA decomposition method to analyze the driving factors of China’s carbon emissions growth, and provided important policy recommendations for the Chinese government. There are scholars considering comprehensive factors, such as economy, industry, energy and other elements, to discuss on the pattern of regional carbon emissions, and from the view of geography to study and grasp the spatial pattern and evolution of Chinese carbon emissions based on cluster analysis method [25].
2.2. The Choice of Permits Allocation Methods among Regions
A successful allocation method needs to be balanced among fairness, efficiency, feasibility and sustainability. At present, most of the international greenhouse gas emission regional decomposition schemes are aimed at the allocation among countries [26], because it is the core issue of the Kyoto protocol. Using the experience of other principles and methods for decomposition method for reference, some scholars have been carrying out the relevant regional decomposition models [27,28], these research results have important reference significance to our study about regional-level CO2 emission permits allocation.
The research on the method of allocating permits between regions is mainly based on the fairness principle [29,30], efficiency principle [31,32,33] or both principles [34,35,36]. Since fairness is the main concern of the key body of carbon emission reduction, most of the relevant literatures were involved in the issue of fairness. Billette de Villemeur [37] and Leroux pointed that decision makers first need to reach a consensus before determining the initial carbon emission allocation scheme. From the perspective of fairness, determining which various economic entities need to be responsible for regional characteristics, regional characteristics of which would not be responsible, so as to obtain the corresponding compensation, that is to distinguish regional characteristics with the carbon emission reduction responsibility of “relevant” and “irrelevant” [38].
Phylipsen [39] and other comprehensive emissions per capita, GDP, per capita GDP and carbon emission intensity were used as allocation parameters, and the equal weighted sum method was used to construct the model. Pan et al. [40] allocated carbon permits according to per capita cumulative carbon emissions to achieve a global fair carbon emission space. For carbon emissions trading in the initial allocation of carbon permits problems, Park [41] considered the fairness of the participating country and proposed the Boltzmann distribution method which used the maximum entropy principle of carbon emissions trading in the initial allocation of carbon.
With respect to the allocation methods based on the efficiency principle, there are mainly the mathematical programming method [42], DEA model method [43] and general equilibrium analysis method [44,45] etc. Among them, the mathematical programming method can be divided into grey programming, fuzzy programming, linear programming and nonlinear programming. Based on input-output multi-objective programming, Fan [46] discussed the distribution of China’s CO2 emission permits from the perspective of environmental economic optimization and minimum emission reduction cost, and estimated the cost of macroeconomic emission reduction. Wu et al. [47] put forward the improved DEA model considering the EU fair amount of emission reduction and redistribution for the initial allocation of carbon emissions in a cap and trade system, the conclusion of the redistribution mechanism is fair, and the overall efficiency of the system has been improved.
In recent years, there are also a few literatures [48,49] using the Shapley value method to consider the CO2 emission permit’s allocation problem from the perspective of cooperative game. Filar and Gaertner [50] divided the whole world into four regions, and used the Shapley value method to allocate the carbon permits through the cooperation game among the four regions. Li and Piao [51] put forward the problem of cooperation cost reduction between Beijing, Tianjin and Hebei by Shapley value, which proved the rationality of the cooperation mechanism.
The literatures above have important reference significance for the study of the factors of regional carbon emission differences, and the allocation method of inter-provincial CO2 emission permits. Because of the differences existing in allocation objects and allocation methods, the allocation results of different allocation schemes cannot be directly compared. Overall, the allocation results of each scheme have certain reliability, but there are some shortcomings and deficiencies, which restricts the rationality and acceptability of the distribution results. There are some comprehensive and complex distribution models for the allocation of carbon permits among different regions. The rationality and acceptability of the model is greatly improved, but the model requires higher input parameters, the model complexity is greatly increased, and the operability is poor [52].
What we are attempting to do here is to develop an allocation method that considers the influence factors in different areas of carbon emissions using the Boltzmann distribution. In contrast to the existing common allocation methods, Grandfathering method is based on historical emission levels for initial distribution, which is able to motivate participants, but unable to reflect the differentiation of different regions. Auctioning method means that the government holds the public permit auction regularly, and the highest bidder gets the emission permit. However, there are huge differences between different enterprises, industries and provinces about the comprehensive emissions reduction potential of emissions, which leads to an unfair situation. While based on the Boltzmann distribution model, the differences in carbon emissions between provinces are integrated into the emission factors. And the new allocation method based on the Boltzmann distribution provides a simple, reasonable, reproducible and feasible model for allocating emission permits among provinces.
3. Methods and Models
3.1. Principles of Emissions Allocation
The completion of China’s emission reduction targets depends on the common emission reduction behaviors of provinces and autonomous regions, and the emission reduction power of each province depends on the division of emission reduction responsibilities among them. The key to the carbon emissions trading market is the initial allocation of CO2 emission permits, if the permits allocation is tight, greater cost burden will be imposed to the regional economic development; on the contrary, if the permits allocation is loose, the capacity of CO2 emission reduction cannot be stimulated. Therefore, the total allocation of carbon emissions in various regions should take the actual development of each region into consideration.
Concerning the current research on carbon emissions allocation schemes at home and abroad, the fairness principle, efficiency principle and feasibility principle are mainly considerations. These three principles are the main starting point for the “common but differentiated responsibilities”. Among them, fairness and efficiency are always the focus of carbon emission reduction research, as well as the difficulty of the carbon emission reduction program. First of all, the principle of fairness includes the consumption needs of each region’s residents connecting with CO2 emissions are met, at the same time, developing regions should be given more of its emissions allocation in order to ensure the right to development. Secondly, the principle of efficiency refers to the total amount of carbon emissions in the resources under the same area, the initial allocation mechanism can make the economic output of the whole country reach maximum, while the essence of the efficiency of carbon resources should flow to more efficient areas.
In addition, it is necessary to consider the actual situation about the distribution of carbon emission reduction targets. When allocating the absolute carbon emission reductions, different factors among the provinces such as economic capacity, discharge, CO2 reduction capacity and emission levels should be contained. Then we select the per capita GDP, per capita carbon emissions, carbon emission intensity and carbon emissions of per unit industrial added value, the proportion of the second industry, and the urbanization rate as the construction of carbon emission influence factors.
3.2. Object of Emissions Allocation
The initial allocation of CO2 emission permits depends on the central government, who allocates CO2 emission permits to provinces, autonomous regions and municipalities, and then distributes them to the emission enterprises by local governments. Setting clear carbon emission reduction targets and allocation object is the premise of the initial allocation of CO2 emission permits. Distribution of objects in various carbon emission allocation schemes proposed domestically and abroad can be divided into three basic types: The domain decomposition of the amount of absolute carbon emission reduction; the domain decomposition of reductions of carbon emission intensity reduction target; the domain decomposition of total carbon emissions, incremental under the constraint of carbon emission intensity. Emission intensity reduction is essentially a kind of “soft” constraint of total emission control. The difference between this constraint and the total amount of absolute emission reduction is that the total amount of emissions continues to rise during a certain period of control, so the key is the control of increments and growth rates. The regional decomposition of carbon emission reduction targets in China at present is mostly regional decomposition of total emission increment under an intensity constraint.
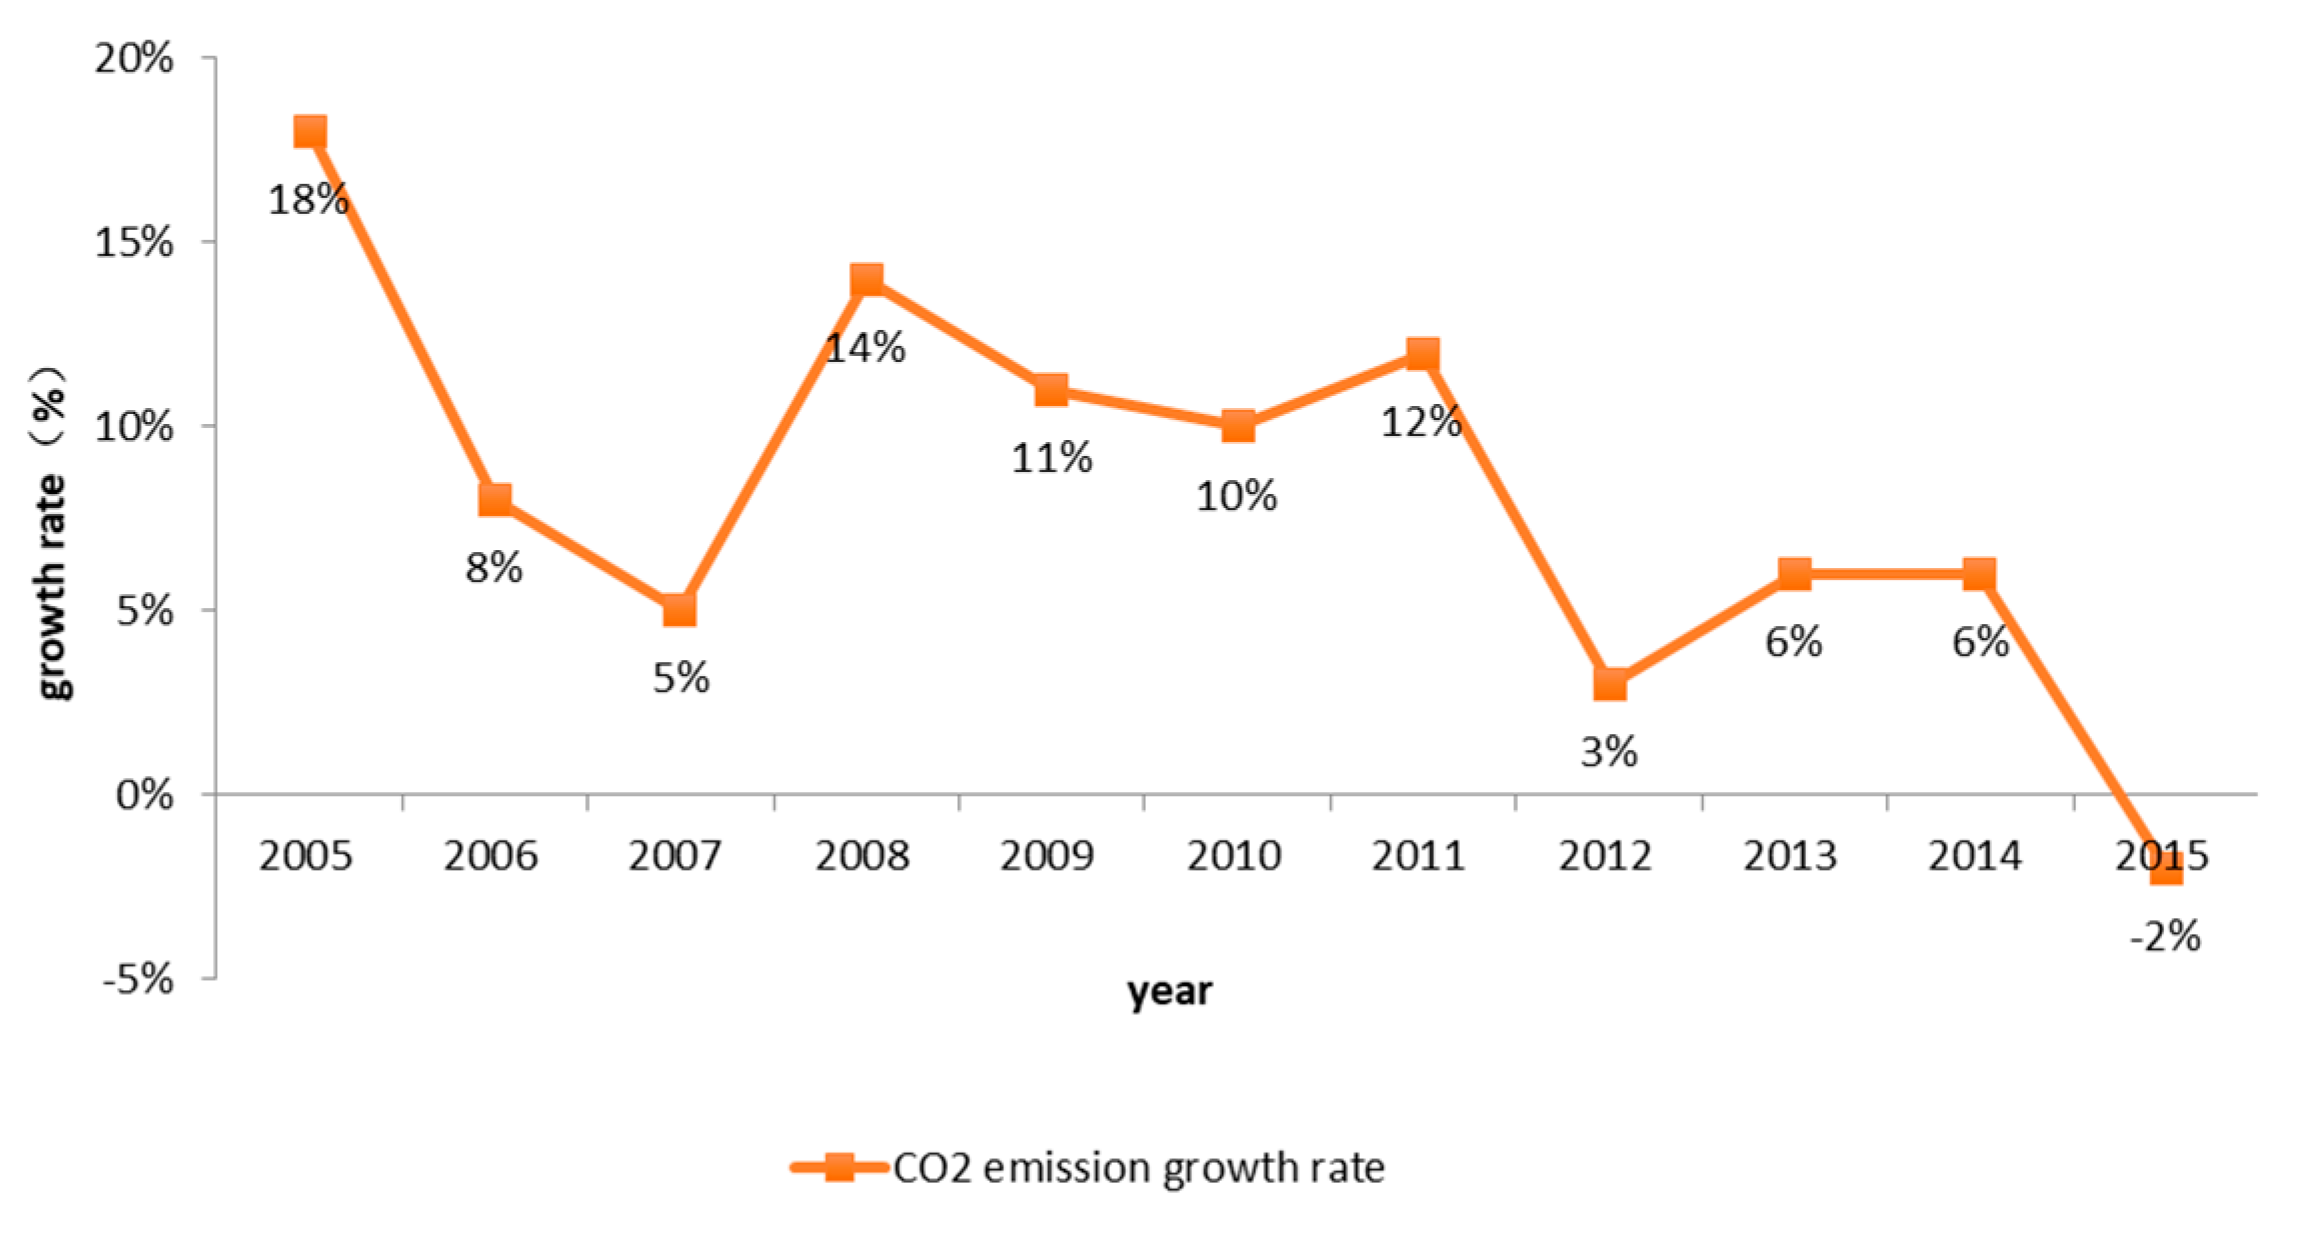
According to the statistics from the China Emission Accounts & Datasets (CEADs), the CO2 emission of the provinces in 2015 declined for the first time, as shown in Figure 1. With the new normal, industrial restructuring, and the implementation of various energy saving measures, energy saving and carbon emission reduction in China have achieved great success. Therefore, this study aims to transform the intensity target into an absolute CO2 emission reduction target of 30 provinces in China, and allocate the absolute CO2 emission reduction to the regions.
Many scholars have decomposed the long-term goals according to the carbon emission intensity reduction in 2020 and 2030, which are more macroscopic for the actual operation level of each province. The national carbon emission trading market in China has been established, and the provinces should better shoulder the responsibility of “common but different” emission reduction. This responsibility is no longer the decomposition of total increment, but the decomposition of absolute carbon emission reduction. The advantage of this choice is that it has a direct guiding role in the next year’s emission reduction work, has a direct guiding role in the cost decision of CO2 emission permits, and also affects the vitality of the carbon trading market.
3.3. Emissions Allocation Methods
Boltzmann distribution is a probability distribution, which is usually applied in the physics and chemistry area. Boltzmann distribution law describes the distribution regularity of physical particles in the external force field. It is, rather, the system probability at a certain state as a function of energy and for physical particle is valid as long as long as the interaction among the particles can be taken to be negligible. Boltzmann distribution has been applied to many fields, describing the distribution and evolution process of the economic system, and solving various practical problems, including the allocation of CO2 emission permits between countries [53,54]. The temperature of any (macroscopic) physical system is the result of the molecular and atomic motions that make up the system. These particles have different speed ranges, and any single particle velocity is changing due to collisions with other particles; however, the large number of particles, if the system is in or near equilibrium, the specific speed in a range of the proportion of particles is almost constant. The Boltzmann distribution describes the probability P of a particle in a single state i. For any velocity range, it is expressed as a function of the system temperature [41]:
where e is the base of the natural logarithm, , (k is the Boltzmann constant, T is the system temperature), is the energy of the single i.
Park [41] transforms relevant concepts from a physical system into a CO2 emission permits allocation system, using the conception of a global environment with multiple countries instead of the material system; in other words, using unit carbon permits instead of the material particles. Suppose that everyone in a country produces the same carbon emission, then the energy of material i is replaced by the per capita carbon emissions of national i. The probability of carbon permits allocated to national i is directly proportional to the national population and is inversely proportional to the country’s per capita carbon emissions through conceptual change.
Kong Y et al. [55] explored the Boltzmann model between enterprises of carbon permits allocation mechanism in their study, through the replacement of conceptions, assigned carbon permits to enterprise i proportional to the history of carbon emission intensity and reduction target, so as to achieve both historical emission levels and reward efficient enterprises; specific application analogy of Boltzmann distribution is shown in Table 1.
3.4. Emissions Allocation Model
According to the Boltzmann distribution model, the probability distribution of particles is inversely proportional to their energy level; then, the probability distribution of carbon emission reductions is inversely proportional to their relevant influence factors. Therefore, we defined the CO2 influence factor taking political and economic development, industrial structure and other factors into consideration, represented by . Selecting per capita GDP, per capita carbon emissions, carbon emission intensity and carbon emissions of per unit industrial added value, the proportion of the second industry, the urbanization rate of 30 provinces as theCO2 influence factor, and weighted the six indicators above by entropy method [56].
Entropy method is widely used in decision models to determine the weight of objective indicators. In information theory, entropy is a measure of uncertainty and disorder. The greater the amount of information, the smaller the uncertainty, the smaller the entropy would be; the smaller the amount of information, the greater the uncertainty, the greater the entropy would be. According to the characteristics of entropy, we can use the entropy method to determine the degree of dispersion of carbon emission reduction capacity, carbon emission reduction responsibility and carbon emission reduction potential indicators. The greater the dispersion indicators, the greater the impact of the indicators is on the comprehensive evaluation.
Firstly, the judgment matrix X of carbon emission reduction capacity was constructed, including carbon emission reduction responsibility and carbon emission reduction potential indicators of 30 provinces.
where, is the value of the jth evaluation indicators of the provinces i (i = 1, 2, 3…, 30; j = 1, 2, 3, 4, 5, 6). Due to the different dimensions of the evaluation indicators, it is necessary to normalize Formula (2):
where, is the normalized value of the jth indicator of province i; and represent the maximum and minimum values of the jth indicator of province i in the original evaluation matrix X respectively. Normalized matrix Z is obtained after normalization:
Then, according to the Normalized matrix Z, the entropy weight of the jth indicator is calculated as follows:
Then the weight is calculated according to the entropy weight of the jth indicator:
Then the distribution probability of CO2 emission reductions can be expressed as follow:
where, is determined by the system temperature and the Boltzmann constant originally, which is a constant. In inter-provincial CO2 emission reductions distribution model, is estimated by the least square method. Through fitting the distribution of historical results and the actual data, we can obtain the value.
The minimum value of the least square y is the reference point .
Suppose that n provinces participate in CO2 emission reduction, and the absolute emission reduction target is A. represents the annual emission reductions of Province i in year t, representing the population of Province i in year t, indicating that the reductions of the jth individuals of Province i in year t are satisfied with the Boltzmann distribution , where, is constant and satisfies the constraint conditions:
Rearranging:
Therefore, the emission reduction probability of Province i in year t can be expressed in Equation (11):
Then the emission reduction permits that are allocated to province i in year t is:
Therefore, the can be obtained by the optimization model:
When the least square value (y) has its minimum at a value, it can be considered a useful reference value.
4. Results and Discussion
We select 30 provinces to demonstrate rationality and validity of CO2 emission permits allocation through the Boltzmann distribution model. Since 2008, the concept of a “low-carbon economy” has been put forward in China. And with the development of the economy, various energy conservation and emission reduction activities were carried out. So, the data after 2008 can reflect the CO2 emission better. CO2 emissions data of 30 provinces in China, which are only up to 2015, can be obtained from the Emission Accounts and Datasets during 2008–2015. Population, GDP, industrial added value, and the proportion of the second industry and urbanization ratio of 30 provinces in China during 2008–2015 can be obtained from the “China Statistical Yearbook” of 2009–2016; and calculating per capita GDP, per capita carbon emissions, carbon emission intensity, and carbon emissions of per unit industrial added value we still need. Then, this part estimates the distribution results of 30 provinces in 2015, Table 2 shows the calculation results of six indicators in 2015.
According to the historical data of 2008–2015, when the least square value (y) has its minimum at value by Formula (13), it can be considered a useful reference value.
According to Formulas (2)–(4), the initial six indicator’s data in Table 2 is standardized. And the weight of six indicators are determined by the entropy method according to the Formulas (5) and (6). Then CO2 influence factor can be obtained, as shown in Table 3. Then the distribution probability of the absolute carbon emission reduction target can be calculated by the Boltzmann distribution model (11). We choose 2% of the 11,872.9 million tons of total carbon emission in 2014 as the absolute carbon emission reduction targets in 2015, namely 237.458 million tons. Finally, inter-provincial carbon emission reduction distribution can be obtained by the Boltzmann distribution model (12).
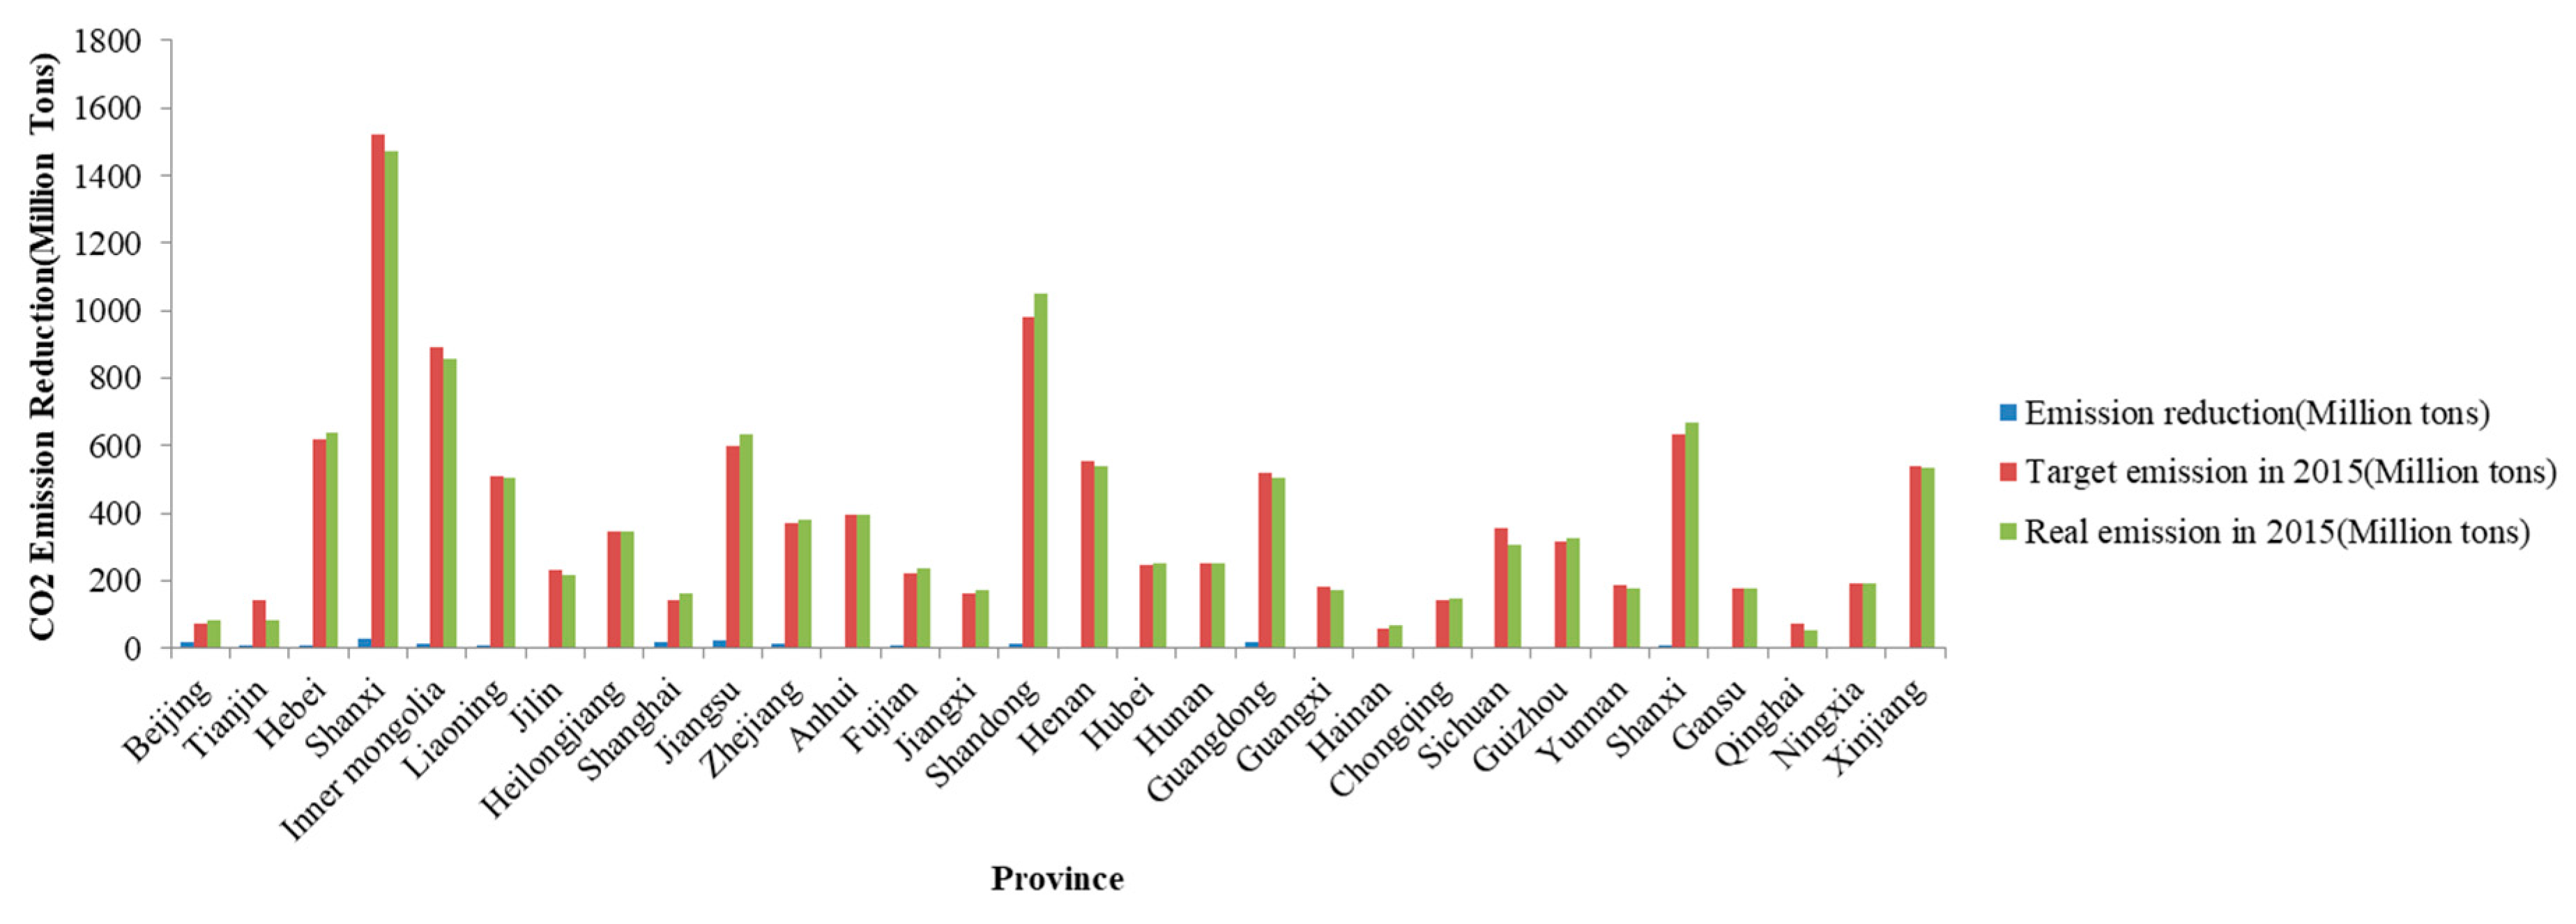
According to the Boltzmann distribution model, the comparison results of 2015 target carbon emissions and actual carbon emissions in each province were shown in Figure 2.
(1) On the whole, combined with the actual carbon emissions in 2015, 15 provinces could achieve target reduction in the allocation of the absolute amount of carbon emission reduction, while the other 15 provinces could not complete the target carbon emission reduction under Boltzmann distribution. According to the results, total carbon emissions reduction target would be better classified from the perspective of regional differences in the various regions. The total amount of the eastern region owns the largest carbon emission reduction target, followed by the central region, and the western region had the least. This is different to the distribution results in Reference [55], which obtained 30 province’s distribution proportions of 2020 incremental carbon emission intensity targets. Although the results can provide macro guidance, which has no direct effect for actual carbon emission trading, the results of this paper can help to realize the inter-provincial trade directly.
(2) The results of allocation were better matched with the features of regional development. The eastern region has achieved more carbon emission reduction tasks, while the central and western regions are relatively loose. For the eastern region, economic development is relatively mature, which has the responsibility to shoulder more of the carbon emission reduction target for rapid technological progress. Meanwhile, the awareness of carbon emission reduction would strengthen with more stringent targets, and technological innovation would be accelerated. While the central and western regions still have a relatively slow economic development speed, there are also corresponding responsibilities to bear, such as optimizing the production mode, adjusting the industrial structure and so on. It is easier to implement redundant carbon emission reduction in the trading market and to provide a transition period for these areas by reducing the cost of carbon emission reduction.
(3) Combined with the actual characteristics of each province and the results of Boltzmann distribution, we can see that:
The eastern region: The allocation of more permits in Tianjin owing to rapid economic development, the highest GDP per capita, carbon emissions of per unit industrial added value at least among 30 provinces in 2015. The Boltzmann allocation of carbon emissions targets is much higher than the actual carbon emissions, which is conducive to promoting the transformation of the industrial structure and the integration of the joint development of Beijing-Tianjin-hebei.
The per capita carbon emissions and carbon emission intensity in Shandong province are quite a bit higher in the eastern regions, owing to its economic development which relies on energy consumption; the total energy consumption accounted for 1/10 of the total energy consumption. The allocation of less permits is conducive to the transformation of economic development mode. Meanwhile, for optimizing the industrial structure, vigorously developing new energy and renewable energy are both effective means to promote the development of low-carbon economy in Shandong province. The carbon emission intensity and carbon emissions of per unit industrial value of Hebei province are higher, resulting in less allowable emissions. In Shanghai and Jiangsu provinces, the higher per capita GDP and urbanization, the more permits, which reflects the principle of fairness, and makes use of the economic development advantages to shoulder more carbon emission reduction responsibilities.
The central region: Overdependence on extensive resources during the process of economic development and growth in Shanxi, Inner Mongolia. results in high carbon emissions intensity. Guiding the transformation of the economy, encouraging the development of low-carbon economy is quite urgent. The distribution has been taking the dual goals of economic development and energy saving and emission reduction into consideration. Besides, more allowable emission is obtained for the large population in Henan Province.
The western region: Sichuan carbon owns huge market space. The number of clean development mechanism (CDM) projects and carbon emission reduction ranks first in China, and more permits help with the innovation and development of carbon emission reduction. Qinghai province is rich in natural resources such as hydropower, solar energy, wind energy and so on. It has a very broad prospect in the development of carbon emissions trading. And more permits help with the reduction of energy saving development costs. Shaanxi is a big province with energy consumption, the proportion of coal consumption being about 75% of the energy. The sustained and rapid development of the economy has greatly increased industrial emissions, coal chemical industry overcapacity and lack of high-end added value of products; the allocation of less permits contributes to the acceleration of industrial upgrading in Shaanxi province.
5. Conclusions and Policy Recommendations
With the development of economy and the change of technological progress, the carbon emission reduction potential and carbon emission reduction cost of various regions are changing, so it is time to establish a dynamic permits adjustment scheme. At the beginning of the establishment of the national carbon emission trading market, the adoption of top-down mode would have been better, and the total allocation amount of CO2 emission permits among provinces should have been formulated by the central of government, and then the total allocation amount of CO2 emission permits would be decomposed and allocated through allocation methods, such as the Boltzmann Distribution method.
(1) Increasing the control of carbon emission and developing low carbon economy. According to the statistical analysis, the total carbon emission in China has declined; although the carbon emissions in the eastern region are decreasing, it is still at a high level. The gap between the central and western regions of carbon emissions is gradually narrowing. Choosing absolute carbon emission reduction allocation as the object of emission allocation would be better. And it may take 2~3 years as a stage to determine the total amount of inter-provincial CO2 emission permits in order to overcome the complexity and uncertainty caused by determining allocation target every year. For example, 2018–2020 carbon emission reduction targets can be set according to 2% of the actual carbon emissions the year before, and strengthen the constraints gradually according to economic growth and carbon emission intensity.
(2) Compared with the actual situation, the Boltzmann distribution results indicated the rationality and effectiveness of the model, and accord to the development characteristics of individual provinces. To mobilize the enthusiasm of the carbon emission reduction and improve the efficiency of carbon emission reduction, the unified national standard of distribution based on the accurate estimation of the carbon emissions demand in different provinces should be designed. Each province trades the permits in a trading market at the end of the supervision cycle, and prices depend on the transaction situation. Considering the regional heterogeneity and non-equilibrium characteristics, it must be adapted to local conditions, making the difference with regional characteristics of carbon emission reduction strategies as soon as possible to successfully achieve the carbon emission reduction targets, to ensure sustained and economic development.
(3) In the framework of ecological civilization, it is necessary to promote low-carbon green recycling transformation and development. With the absolute carbon emission reductions as the object of the distribution, it contributes to explore the transformation of green low-carbon development, and reach the peak value of carbon emissions targets no later than 2030. In order to ensure the smooth implementation of the allocation of CO2 emission permits, relevant management mechanisms should be established as soon as possible. Besides, improving the information collection; transaction management; emission supervision, detection and measurement work to ensure the allocation of CO2 emission permits is fair and open is necessary.
In summary, based on the unified allocation standard, through fiscal transfer and other support and other ways to solve the regional differences of development, and to make timely adjustments to improve fairness and the economy of the carbon emissions trading system, which is great significant to sustainable development of the national carbon emission trading market. In addition, this method can also be used in the inter-industry permits allocation, industrial park and so on. Then we will further explore the Boltzmann distribution model of inter-industry carbon emission target and its application.
Author Contributions
All authors have contributed to this paper. Z.L. designed the model and analyzed the data. Y.L. initiated the project and gave guidance for the methods. M.W. contributed much in the revised version of our manuscript. F.Z. and G.D. completed the paper in English.
Funding
This research was financed by “Natural Science Foundation of China Project” (Grant No. 71471058), Beijing social science foundation research base project (Grant No. 17JDGLA009).
Acknowledgments
The authors thank the anonymous reviewers for careful reading and many helpful suggestions to improve the presentation of this paper.
Conflicts of Interest
The authors declare no conflict of interest.
References
- Intergovernmental Panel on Climate Change (IPCC). The physical science basis. In Contribution of Working Group I to the Fourth Assessment Report of the intergovernmental Panel on Climate Change; Solomon, S., Ed.; Cambridge University Press: Cambridge, UK, 2007. [Google Scholar]
- Cooper, M. Renewable and distributed resources in a post-Paris low carbon future: The key role and political economy of sustainable electricity. Energy Res. Soc. Sci. 2016, 19, 66–93. [Google Scholar] [CrossRef]
- Zhou, D.; Wang, M.; Zhang, Q. Regional carbon emissions based on entropy distribution among enterprises. J. Beijing Inst. Technol. 2015, 17, 16–22. [Google Scholar]
- Cooper, R.N. Climate Change 1995: Economic and Social Dimensions of Climate Change. Glob. Environ. Chang. 1996, 7, 189–190. [Google Scholar] [CrossRef]
- Hedenus, F.; Azar, C. Estimates of trends in global income and resource inequalities. Ecol. Econ. 2005, 55, 351–364. [Google Scholar] [CrossRef]
- Duro, J.A.; Padilla, E. International inequalities in per capita CO2 emissions: A decomposition methodology by Kaya factors. Energy Econ. 2006, 28, 170–187. [Google Scholar] [CrossRef]
- Heil, M.T.; Wodon, Q.T. Inequality in CO2 Emissions Between Poor and Rich Countries. J. Environ. Dev. 1997, 6, 426–452. [Google Scholar] [CrossRef]
- Heil, M.T.; Wodon, Q.T. Future Inequality in CO2 Emissions and the Impact of Abatement Proposals. Environ. Resour. Econ. 2000, 17, 163–181. [Google Scholar] [CrossRef]
- Ehrlich, P.R.; Holdren, J.P. Impact of population growth. Science 1971, 171, 1212. [Google Scholar] [CrossRef] [PubMed]
- Holdren, J.P.; Ehrlich, P.R. Human population and the global environment. Am. Sci. 1974, 62, 282. [Google Scholar] [PubMed]
- Yan, Z.; Zhang, J.; Yang, Z.; Li, S. Regional differences in the factors that influence China’s energy-related carbon emissions, and potential mitigation strategies. Energy Policy 2011, 39, 7712–7718. [Google Scholar]
- Zhang, W.; Li, K.; Zhou, D.; Zhang, W.; Gao, H. Decomposition of intensity of energy-related CO2, emission in Chinese provinces using the LMDI method. Energy Policy 2016, 92, 369–381. [Google Scholar] [CrossRef]
- Ma, J.; Chen, Z.; You, J. Spatial Econometric Analysis on China’s Provincial Primary Energy-Related Carbon Dioxide Emission. Technol. Econ. 2010, 29, 62–67. [Google Scholar]
- Zhu, C.; Ma, Z.; Wang, C.; Liu, Z. Analysis of difference features of energy-related CO2 emission in China. Ecol. Environ. 2006, 68, 2122–2128. [Google Scholar]
- Xu, S.C.; He, Z.X.; Long, R.Y. Factors that influence carbon emissions due to energy consumption in China: Decomposition analysis using LMDI. Appl. Energy 2014, 127, 182–193. [Google Scholar] [CrossRef]
- Zhang, J.Y.; Zhang, Y.; Yang, Z.F.; Li, S.S. Estimation of energy-related carbon emissions in Beijing and factor decomposition analysis. Procedia Environ. Sci. 2012, 13, 1602–1608. [Google Scholar] [CrossRef]
- Lin, B.; Moubarak, M. Decomposition analysis: Change of carbon dioxide emissions in the Chinese textile industry. Renew. Sustain. Energy Rev. 2013, 26, 389–396. [Google Scholar] [CrossRef]
- Feng, K.; Hubacek, K.; Guan, D. Lifestyles, technology and CO2, emissions in China: A regional comparative analysis. Ecol. Econ. 2009, 69, 145–154. [Google Scholar] [CrossRef]
- Li, H.; Mu, H.; Zhang, M.; Gui, S. Analysis of regional difference on impact factors of China’s energy—Related CO2 emissions. Energy 2012, 39, 319–326. [Google Scholar] [CrossRef]
- Wang, Z.; Yin, F.; Zhang, Y.; Zhang, X. An empirical research on the influencing factors of regional CO2, emissions: Evidence from Beijing city, China. Appl. Energy 2012, 100, 277–284. [Google Scholar] [CrossRef]
- Li, H.; Mu, H.; Zhang, M.; Li, N. Analysis on influence factors of China’s CO2, emissions based on Path–STIRPAT model. Energy Policy 2011, 39, 6906–6911. [Google Scholar] [CrossRef]
- Liddle, B. Population, affluence, and environmental impact across development: Evidence from panel cointegration modeling. Environ. Model. Softw. 2013, 40, 255–266. [Google Scholar] [CrossRef] [Green Version]
- Yu, S.; Wei, Y.M.; Wang, K. Provincial allocation of carbon emission reduction targets in China: An approach based on improved fuzzy cluster and Shapley value decomposition. Energy Policy 2014, 66, 630–644. [Google Scholar] [CrossRef]
- Zhang, Y.J.; Da, Y.B. Decomposing the changes of energy-related carbon emissions in China: Evidence from the PDA approach. Nat. Hazards 2013, 69, 1109–1122. [Google Scholar] [CrossRef]
- Yu, S.; Wei, Y.M.; Fan, J.; Zhang, X.; Wang, K. Exploring the regional characteristics of inter-provincial CO2, emissions in China: An improved fuzzy clustering analysis based on particle swarm optimization. Appl. Energy 2012, 92, 552–562. [Google Scholar] [CrossRef]
- Chiu, Y.H.; Lin, J.C.; Liu, J.K. An Efficiency Evaluation of the EU’s Allocation of Carbon Emission Allowances. Energy Sources Part B Econ. Plan. Policy 2015, 10, 192–200. [Google Scholar] [CrossRef]
- Meng, L.; Guo, J.; Chai, J.; Zhang, Z. China’s regional CO2 emissions: Characteristics, inter-regional transfer and emission reduction policies. Energy Policy 2011, 39, 6136–6144. [Google Scholar] [CrossRef]
- Zhao, X.; Burnett, J.W.; Fletcher, J.J. Spatial analysis of China province-level CO2, emission intensity. Renew. Sustain. Energy Rev. 2014, 33, 1–10. [Google Scholar] [CrossRef]
- Lecourt, S.; Palliere, C.; Sartor, O. Free allocations in EU ETS Phase 3: The impact of emissions-performance benchmarking for carbonintensive industry. Working Pap. 2013, 66, 33–51. [Google Scholar]
- Lecourt, S.; Pallière, C.; Sartor, O.J. The impact of emissions-performance benchmarking on free allocations in EU ETS Phase 3. J. Clin. Microbiol. 2013, 33, 1283–1288. [Google Scholar]
- Lin, T.; Ning, J.F. Study on allocation efficiency of carbon emission permit in EU ETS based on ZSG-DEA model. J. Quant. Tech. Econ. 2011, 3, 36–50. [Google Scholar]
- Pan, X.; Teng, F.; Wang, G. A comparison of carbon allocation schemes: On the equity-efficiency tradeoff. Energy 2014, 74, 222–229. [Google Scholar] [CrossRef]
- Chiu, Y.H.; Lin, J.C.; Hsu, C.C.; Li, J.W. Carbon emission allowances of efficiency analysis: Application of super SBM ZSG-DEA model. Pol. J. Environ. Stud. 2013, 22, 653–666. [Google Scholar]
- Song, J.; Zhang, K.; Cao, Z. Provincial allocation of carbon emission permits-under the fusion of fairness and efficiency. J. Arid Land Resour. Environ. 2017. [Google Scholar]
- Zhang, Y.J.; Hao, J.F. Carbon emission permits allocation among China’s industrial sectors based on the equity and efficiency principles. Ann. Oper. Res. 2016, 255, 1–24. [Google Scholar]
- Qin, Q.; Liu, Y.; Li, X.; Li, H. A multi-criteria decision analysis model for carbon emission permits allocation in China’s east coastal areas: Efficiency and equity. J. Clean. Prod. 2017. [Google Scholar] [CrossRef]
- Villemeur, E.B. D.; Leroux, J. Sharing the Cost of Global Warming. Scand. J. Econ. 2011, 113, 758–783. [Google Scholar] [CrossRef]
- Tungodden, B. Responsibility and redistribution: The case of first best taxation. Soc. Choice Welf. 2005, 24, 33–44. [Google Scholar] [CrossRef] [Green Version]
- Phylipsen, G.; Bode, J.W.; Blok, K.; Merkus, H.; Metz, B. A Triptych sectoral approach to burden differentiation; GHG emissions in the European bubble. Energy Policy 1998, 26, 929–943. [Google Scholar] [CrossRef]
- Pan, X.; Fei, T.; Wang, G. Sharing emission space at an equitable basis: Allocation scheme based on the equal cumulative emission per capita principle. Appl. Energy 2014, 113, 1810–1818. [Google Scholar] [CrossRef]
- Park, J.W.; Kim, C.U.; Isard, W. Permit allocation in emissions trading using the Boltzmann distribution. Physica A 2012, 391, 4883–4890. [Google Scholar] [CrossRef] [Green Version]
- Hobbs, B.F.; Pang, J.S. Spatial oligopolistic equilibria with arbitrage, shared resources, and price function conjectures. Math. Program. 2004, 101, 57–94. [Google Scholar] [CrossRef]
- Wu, J.; Chu, J.F.; Liang, L. Target setting and allocation of carbon emissions abatement based on DEA and closest target: An application to 20 APEC economies. Nat. Hazards 2016, 84, 279–296. [Google Scholar] [CrossRef]
- Yao, Y.F.; Liang, Q.M. Approaches to carbon allowance allocation in China: A computable general equilibrium analysis. Nat. Hazards 2016, 84, 333–351. [Google Scholar] [CrossRef]
- Dissou, Y.; Robichaud, V. Curbing GHG Emissions Using an Output-Based Permit Trading System A Dynamic General Equilibrium Analysis. 2003. Available online: https://www.researchgate.net/publication/228417171_Curbing_GHG_Emissions_Using_an_Output-Based_Permit_Trading_System_A_Dynamic_General_Equilibrium_Analysis (accessed on 23 July 2018).
- Fan, Y.; Zhang, X.; Zhu, L. Estimating the Macroeconomic Costs of CO2, Emission Reduction in China Based on Multi-objective Programming. Adv. Clim. Chang. Res. 2010, 1, 27–33. [Google Scholar] [CrossRef]
- Wu, H.; Du, S.; Liang, L.; Zhou, Y. A DEA-based approach for fair reduction and reallocation of emission permits. Math. Comput. Model. 2013, 58, 1095–1101. [Google Scholar] [CrossRef]
- Hanoteau, J.A. Lobbying for Emissions Allowances: A New Perspective on the Political Economy of the US Acid Rain Program. Riv. Polit. Econ. 2003, 93, 289–314. [Google Scholar]
- Chen, Y. Analyzing Interaction of Electricity Markets and Environmental Policies Using Equilibrium Model; Lawrence Erlbaum: Philadelphia, PA, USA, 2007. [Google Scholar]
- Filar, J.A.; Gaertner, P.S. A Regional Allocation of World CO2, Emission Reductions; Elsevier: New York, NY, USA, 1997. [Google Scholar]
- Li, J.; Piao, S.R. Research on Regional Synergy Carbon Reduction Cost Allocation Based on Cooperative Game. Adv. Mater. Res. 2013, 781–784, 2569–2572. [Google Scholar] [CrossRef]
- Liu, C.; Cai, B.; Chen, C. A review of regional decomposition methods for China’s carbon emission reduction targets. Geogr. Sci. 2013, 33, 1089–1096. [Google Scholar]
- Reif, F. Fundamentals of Statistical and Thermal Physics; McGraw-Hill: New York, NY, USA, 1965. [Google Scholar]
- Landau, L.D.; Lifshitz, E.M.; Reichl, L.E. Statistical Physics, Part 1. Phys. Today 2010, 34, 74. [Google Scholar] [CrossRef]
- Kong, Y.; Zhu, D. Research on carbon permits allocation mechanism among enterprises. China Open. Herald 2013, 3, 36–41. [Google Scholar]
- Zhang, Y.J.; Wang, A.D.; Da, Y.B. Regional allocation of carbon emission permits in China: Evidence from the Shapley value method. Energy Policy 2014, 74, 454–464. [Google Scholar] [CrossRef]
Figure 1.
CO2 Emission growth rate in China during 2005–2015 years.

Figure 2.
Comparison of distribution results.


Table 1.
Application analogy of Boltzmann distribution.
| Boltzmann Distribution | Description |
|---|---|
| Physics application [41] | Where, stands for the probability that a particle is in a single state i. e is the base of the natural logarithm . (K is the Boltzmann constant, and T is the system temperature). stands for Energy for singlet i. |
| Application of carbon emission allocation among countries [41] | Where, stands for the probability of the first carbon permits of the national i. is adjustment parameters, obtained by the historical data of the countries. stands for the Carbon emissions per capita of national i. stands for the population of the national i. |
| Application of initial allocation of carbon emissions among enterprises [54] | Where, stands for the initial carbon permits for the enterprise i. is adjustment parameters, obtained by the historical data of the enterprises. stands for the target carbon intensity of enterprise i. stands for the historical carbon emissions of enterprise i. stands for the target carbon emissions of enterprise i. |
Table 2.
Six indicators data summary table in 2015.
| 2014 Carbon Emission | 2015 Carbon Emission | Per Capita GDP | Per Capita Carbon Emission | Carbon Emission Intensity | Carbon Emissions of Per Unit Industrial Added Value | The Proportion of the Second Industry | Urbanization Rate | |
|---|---|---|---|---|---|---|---|---|
| Million Tons | Million Tons | 10,000 Yuan/Person | Ton/Person | Ton/10,000 Yuan | Ton/10,000 Yuan | % | % | |
| Beijing | 89 | 83.3 | 10.60 | 3.84 | 0.36 | 2.24 | 0.20 | 0.86 |
| Tianjin | 150 | 82.4 | 10.69 | 5.33 | 0.50 | 1.18 | 0.47 | 0.83 |
| Hebei | 624.7 | 639.4 | 4.01 | 8.61 | 2.15 | 5.06 | 0.48 | 0.51 |
| Shanxi | 1553.8 | 1474.5 | 3.48 | 40.24 | 11.55 | 33.82 | 0.41 | 0.55 |
| Inner mongolia | 903.2 | 858.8 | 7.10 | 34.20 | 4.82 | 11.10 | 0.50 | 0.60 |
| Liaoning | 521 | 502.4 | 6.54 | 11.47 | 1.75 | 4.46 | 0.45 | 0.67 |
| Jilin | 234.9 | 218.7 | 5.11 | 7.94 | 1.56 | 3.58 | 0.50 | 0.55 |
| Heilongjiang | 350.4 | 347.7 | 3.96 | 9.12 | 2.31 | 8.58 | 0.32 | 0.59 |
| Shanghai | 156.7 | 161.8 | 10.40 | 6.70 | 0.64 | 2.26 | 0.32 | 0.88 |
| Jiangsu | 621.1 | 634.2 | 8.79 | 7.95 | 0.90 | 2.27 | 0.46 | 0.67 |
| Zhejiang | 380.9 | 381.6 | 7.74 | 6.89 | 0.89 | 2.22 | 0.46 | 0.66 |
| Anhui | 401.7 | 392.8 | 3.58 | 6.39 | 1.78 | 4.24 | 0.50 | 0.51 |
| Fujian | 229.2 | 234.4 | 6.77 | 6.11 | 0.90 | 2.17 | 0.50 | 0.63 |
| Jiangxi | 165.5 | 170.4 | 3.66 | 3.73 | 1.02 | 2.46 | 0.50 | 0.52 |
| Shandong | 998 | 1052.2 | 6.40 | 10.69 | 1.67 | 4.06 | 0.47 | 0.57 |
| Henan | 557.8 | 537.2 | 3.90 | 5.67 | 1.45 | 3.39 | 0.48 | 0.47 |
| Hubei | 251.8 | 252.7 | 5.05 | 4.32 | 0.86 | 2.19 | 0.46 | 0.57 |
| Hunan | 255.9 | 250.5 | 4.26 | 3.69 | 0.87 | 2.29 | 0.44 | 0.51 |
| Guangdong | 541.6 | 506.7 | 6.71 | 4.67 | 0.70 | 1.67 | 0.45 | 0.69 |
| Guangxi | 183.4 | 173.2 | 3.50 | 3.61 | 1.03 | 2.72 | 0.46 | 0.47 |
| Hainan | 58.9 | 65.3 | 4.06 | 7.17 | 1.76 | 13.44 | 0.24 | 0.55 |
| Chongqing | 144.8 | 146.6 | 5.21 | 4.86 | 0.93 | 2.64 | 0.45 | 0.61 |
| Sichuan | 360 | 307.8 | 3.66 | 3.75 | 1.02 | 2.79 | 0.44 | 0.48 |
| Guizhou | 319.5 | 327.6 | 2.98 | 9.28 | 3.12 | 9.88 | 0.39 | 0.42 |
| Yunnan | 187.7 | 178.7 | 2.87 | 3.77 | 1.31 | 4.64 | 0.40 | 0.43 |
| Shaanxi | 639 | 665.8 | 4.75 | 17.55 | 3.69 | 9.07 | 0.50 | 0.54 |
| Gansu | 180.4 | 176.6 | 2.61 | 6.79 | 2.60 | 9.93 | 0.37 | 0.43 |
| Qinghai | 74.5 | 51.3 | 4.11 | 8.72 | 2.12 | 5.74 | 0.50 | 0.50 |
| Ningxia | 195.2 | 193.4 | 4.36 | 28.95 | 6.64 | 19.74 | 0.47 | 0.55 |
| Xinjiang | 542.3 | 535 | 3.95 | 22.67 | 5.74 | 19.52 | 0.39 | 0.47 |
| Total | 11,872.9 | 11,603 | 160.84 | 304.69 | 66.65 | 199.35 | 12.98 | 17.28 |
Data sources: CEADs (China Emission Accounts and Datasets); “China Energy Statistics Yearbook” and “China Statistical yearbook”in 2016. Where, the per capita GDP = GDP of province i/population of province i over the same period; Per capita carbon emissions = carbon emissions of province i/population of province i over the same period; Carbon emissions intensity = carbon emissions of province i/GDP of province i over the same period; Carbon emissions of per unit industrial added value = carbon emissions of province i/industrial added value of province i over the same period.
Table 3.
Comparison results of Boltzmann model distribution and real carbon emission in 2015.
| CO2 Influence Factor | Distribution Probability | Carbon Emission Reduction (Million Tons) | Target Carbon Emissions in 2015 (Million Tons) | Real Carbon Emissions in 2015 (Million Tons) | Deviation (Million Tons) | Deviation Rate | |
|---|---|---|---|---|---|---|---|
| Beijing | 0.5804 | 0.0765 | 18.17 | 70.83 | 83.3 | −12.47 | −15% |
| Tianjin | 0.5370 | 0.0416 | 9.88 | 140.12 | 82.4 | 57.72 | 70% |
| Hebei | 0.2107 | 0.0263 | 6.25 | 618.45 | 639.4 | −20.95 | −3% |
| Shanxi | 0.5763 | 0.1259 | 29.89 | 1523.91 | 1474.5 | 49.41 | 3% |
| Inner mongolia | 0.5050 | 0.0554 | 13.15 | 890.05 | 858.8 | 31.25 | 4% |
| Liaoning | 0.3762 | 0.0434 | 10.31 | 510.69 | 502.4 | 8.29 | 2% |
| Jilin | 0.2515 | 0.0126 | 2.98 | 231.92 | 218.7 | 13.22 | 6% |
| Heilongjiang | 0.2445 | 0.0167 | 3.95 | 346.45 | 347.7 | −1.25 | 0% |
| Shanghai | 0.5435 | 0.0676 | 16.06 | 140.64 | 161.8 | −21.16 | −13% |
| Jiangsu | 0.4016 | 0.0925 | 21.96 | 599.14 | 634.2 | −35.06 | −6% |
| Zhejiang | 0.3641 | 0.0509 | 12.09 | 368.81 | 381.6 | −12.79 | −3% |
| Anhui | 0.1801 | 0.0180 | 4.27 | 397.43 | 392.8 | 4.63 | 1% |
| Fujian | 0.3223 | 0.0272 | 6.46 | 222.74 | 234.4 | −11.66 | −5% |
| Jiangxi | 0.1623 | 0.0120 | 2.84 | 162.66 | 170.4 | −7.74 | −5% |
| Shandong | 0.3053 | 0.0628 | 14.91 | 983.09 | 1052.2 | −69.11 | −7% |
| Henan | 0.1530 | 0.0235 | 5.57 | 552.23 | 537.2 | 15.03 | 3% |
| Hubei | 0.2234 | 0.0224 | 5.33 | 246.47 | 252.7 | −6.23 | −2% |
| Hunan | 0.1604 | 0.0176 | 4.17 | 251.73 | 250.5 | 1.23 | 0% |
| Guangdong | 0.3382 | 0.0849 | 20.15 | 521.45 | 506.7 | 14.75 | 3% |
| Guangxi | 0.1225 | 0.0098 | 2.33 | 181.07 | 173.2 | 7.87 | 5% |
| Hainan | 0.2177 | 0.0034 | 0.80 | 58.10 | 65.3 | −7.20 | −11% |
| Chongqing | 0.2566 | 0.0142 | 3.37 | 141.43 | 146.6 | −5.17 | −4% |
| Sichuan | 0.1281 | 0.0174 | 4.13 | 355.87 | 307.8 | 48.07 | 16% |
| Guizhou | 0.1464 | 0.0084 | 1.99 | 317.51 | 327.6 | −10.09 | −3% |
| Yunnan | 0.0837 | 0.0076 | 1.81 | 185.89 | 178.7 | 7.19 | 4% |
| Shanxi | 0.3210 | 0.0267 | 6.33 | 632.67 | 665.8 | −33.13 | −5% |
| Gansu | 0.1229 | 0.0053 | 1.27 | 179.13 | 176.6 | 2.53 | 1% |
| Qinghai | 0.2136 | 0.0021 | 0.50 | 74.00 | 51.3 | 22.70 | 44% |
| Ningxia | 0.4412 | 0.0099 | 2.35 | 192.85 | 193.4 | −0.55 | 0% |
| Xinjiang | 0.3299 | 0.0175 | 4.16 | 538.14 | 535 | 3.14 | 1% |
Data sources: CO2 influence factor can obtained through weighing six indicators in Table 2 by entropy method; probability distribution is calculated according to the Boltzmann distribution model; 2% of total carbon emission in 2014 as the absolute emission reduction targets in 2015; deviation describes the difference between actual emission data and target emission by the Boltzmann distribution model.
© 2018 by the authors. Licensee MDPI, Basel, Switzerland. This article is an open access article distributed under the terms and conditions of the Creative Commons Attribution (CC BY) license (http://creativecommons.org/licenses/by/4.0/).
Share and Cite
MDPI and ACS Style
Li, Y.; Li, Z.; Wu, M.; Zhang, F.; De, G. Regional-Level Allocation of CO2 Emission Permits in China: Evidence from the Boltzmann Distribution Method. Sustainability 2018, 10, 2612. https://doi.org/10.3390/su10082612
AMA Style
Li Y, Li Z, Wu M, Zhang F, De G. Regional-Level Allocation of CO2 Emission Permits in China: Evidence from the Boltzmann Distribution Method. Sustainability. 2018; 10(8):2612. https://doi.org/10.3390/su10082612
Chicago/Turabian StyleLi, Yanbin, Zhen Li, Min Wu, Feng Zhang, and Gejirifu De. 2018. "Regional-Level Allocation of CO2 Emission Permits in China: Evidence from the Boltzmann Distribution Method" Sustainability 10, no. 8: 2612. https://doi.org/10.3390/su10082612
Note that from the first issue of 2016, this journal uses article numbers instead of page numbers. See further details here.