Determinants of Smallholders’ Market Preferences: The Case of Sustainable Certified Coffee Farmers in Vietnam


Department of Agricultural Economics, Faculty of Life Sciences, Humboldt University of Berlin, 10099 Berlin, Germany
*
Author to whom correspondence should be addressed.
Sustainability 2019, 11(10), 2897; https://doi.org/10.3390/su11102897
Submission received: 9 April 2019
/
Revised: 4 May 2019
/
Accepted: 14 May 2019
/
Published: 22 May 2019
(This article belongs to the Special Issue Sustainable Business and Development II)
Abstract
:This study attempts to analyze the market preference of coffee farmers in Vietnam. Using the transaction cost approach, a seemingly unrelated regression (SUR) model was developed based on the sales volume in different markets, transaction cost attributes, socioeconomic factors, and behavioral aspects of sustainable certified coffee farmers. Factors that significantly influence farmers’ market preference include several transaction cost attributes (price uncertainty, market competition, transportation cost, speed of payment, and sale volume agreement) and characteristics of coffee farmers (age, ethnic, farming experience, location, and certificate ownership). Repeated economic transaction embedded in the social relationship indicates the largest sales volume of coffee farmers to the market of buying agents and the existence of local traders. There is a belief that formal institution brings better market access for coffee farmers, but main issues are regarding opportunistic behavior, imperfect market knowledge, traditional farming habits, and contract noncompliance, which have resulted in a lower preference for the market of processors/exporters.
1. Introduction
Rural coffee farmers are often extremely vulnerable to climate and market shocks that leave them struggling to improve their main source of income. Access to productive technologies and effective production management can partly minimize the impact of climate change, yet market failure can occur due to a variety of reasons. In this regard, improved market access has been identified as one of the vital elements for enhancing agriculture-based economic growth and increasing rural income [1]. It is common in Vietnam that agricultural transactions are traditionally made through spot markets. However, the problems with spot markets and the traditional price mechanism are deficiencies in transferring production and marketing information in terms of quality, timing and future demand [2,3,4,5,6]. Vietnamese coffee farmers sell most of their products to purchasing agents or local traders because of inadequate market information, limited sales channel choices, and poor marketing infrastructures. This serves as a further reason for why smallholder farmers are often cash-strapped and forced into a debt cycle where they seek credit to repay previous loans. Lack of bargaining power along with various credit-bound relationships with the buyers has led them to sell off their harvest at a heavy discount to a market rate. Smallholder farmers usually capture less than 10% of the retail price while buyers set rules of the game, especially in the context of current oversupply of green coffee beans.
High agricultural transaction costs are major marketing constraints for smallholder farmers in developing countries [7]. According to Sadoulet and de Janvry [8], high transportation cost issues such as poor infrastructure and distance to market, high marketing margins due to merchants with local economy power, high search and recruitment costs due to imperfect information, and supervision and incentive costs to labor create a price band that deters small farmers from entering the market. Furthermore, household specific factors that influence participation decisions to engage in market exchange include aversion to risk and uncertainty, social network and organization, age, gender, education, and intra-household interactions [9]. These variables affect the transaction cost in terms of information seeking, negotiation, monitoring, and enforcement [10]. Recent studies of the managerial economics of agriculture have revealed that commodities with high transaction costs in marketing and processing are ideally suited for some forms of vertical integration, such as contract farming [11]. However, while this form of institutional arrangement in developing countries has yielded successes, it has also had many failures [4,12,13].
The purpose of this study is to examine the impacts of different transaction cost components associated with socioeconomic characteristics of smallholder farmers on the marketing of sustainable certified coffee in different sales channels in Dak Lak Province, Vietnam. Sale decisions have been among the most complex and challenging decisions facing coffee farmers in Dak Lak as coffee prices can sometimes be volatile and unpredictable. Further, the determinants of the sales channel choices among smallholder coffee farmers have never been explored specifically in this study area. Therefore, a study of this nature is important from a policy perspective, as it will inform practical interventions required to improve smallholders’ market access and ultimately, secure their livelihood and participation in the sector. In addition, many previous studies have already examined farmers’ market preference in several agricultural sectors by using stated choice experiment and logistic regression. In this approach, farmers are presented alternative descriptions of transaction cost attributes that influence their sale decisions. In the real world, the research outcome might be different from their actual behavior. For that reason, by using revealed preference and seemingly unrelated regression model (SUR), this study hopes to provide empirical evidence to fill the gap in the existing literature.
This study used a sample of 183 farmers who have participated in the sustainable coffee program (SCP) in Dak Lak province. Key informant interviews of different processor-exporters, purchasing agents and local traders as well as document analysis were also used to provide the overview of the recent market situation. The paper is organized into four sections as follows: First, the existing literature on transaction cost economics and farmers’ behavior develops a transaction cost framework that can be applied to the analysis of smallholder coffee farmers’ market preference. The next section outlines the analytical approach and overview of research area and data collection. Finally, the main findings, conclusion, and the direction of future research are discussed.
2. Review of Literature
2.1. Transaction Cost Approach
Transaction cost approach dates back to the theory of the firm created by Ronald Coase [14] who claimed that the exchange should be organized within markets until the (transaction) cost of using the market outweighs the cost to organize the exchange within a firm. Since then, transaction costs are generally understood as those costs associated with the transfer, capture, and protection of ownership rights of economic assets [2,15,16,17,18,19,20,21,22,23,24]. Throughout the seven decades of its development, there are many definitions of transaction cost found in the literature, with different classifications and different meanings [23,25]. Following Coase’s idea [14] with transaction cost defined as “the cost of using the price mechanism”, Williamson [15] developed a justification and classification scheme of transaction costs. Accordingly, transaction costs consist of the costs of finding a bargaining partner, negotiating a sale agreement, and monitoring/enforcing performance of the terms of trade. Shelanski and Klein [26] placed the definition of transaction costs under the complexity of the transaction, uncertainty of future condition, and frequency of trade. Hobbs [27] categorized the components of transaction costs in relation to the transaction with uncertainty increasing information, negotiation, and monitoring. Delgado and Nicholson [28] classified transaction costs into observable and unobservable transaction costs. Key [29] defined transaction costs as fixed and proportional transaction cost. Furubotn and Richter [30] described the transaction cost concept as the costs of defining and measuring resources or claims, plus the costs of utilizing and enforcing the ownership right. They also classified transaction costs in terms of the market transaction, managerial transaction, and political transaction. By far, application of transaction costs falls under the umbrella of transaction cost economics in terms of market exchange, governance, and measurement [24]. In addition, Den Butter and Mosch [31] defined transaction costs in trade as they comprise transportation costs, policy barriers, information cost, contract enforcement costs, legal and regulatory costs, local distribution costs, search costs, costs of gathering information on product quality and the reliability of trading partners, control costs, and costs associated with international payments. Trade pattern in the context of imperfect competition also contributes to the differences of transaction costs [32].
With the transaction cost approach, we employed the classification scheme of transaction cost by Hobbs [27] in our survey and analysis. Hobbs [27] also identified factors related to a household’s socioeconomic characteristics and behavioral aspects that influence farmer’s sale decisions. The Seemingly Unrelated Regression model for a farmer’s market preference was developed to analyze the effect of transaction cost attributes on the market preference of sustainable coffee farmers. The transaction cost attributes include uncertainty of price, market information, market competition, transportation, product classification, payment, delivery frequency, contracted quantity and reliability of trading partner. The model helps explain common issues of market and institutional failures, and incomplete contractual arrangements in the coffee market of Vietnam.
2.2. Empirical Studies on Smallholder Farmers’ Market Preference
The agricultural sectors in developing countries experience many issues, including information asymmetry, missing markets, risk and uncertainty, incomplete property rights, incomplete contracts, as well as organization and institutional failures [33]. Furthermore, poor infrastructure, distance to the market, and high marketing margin due to a power monopoly of the local traders are significant barriers to market participation and sales channel preference by smallholder farmers [1,29,34]. A number of empirical studies have applied the transaction cost approach to improve understanding of market choice decisions facing farmers in developing countries.
Different authors have used binomial Logit and Probit models [35] to analyze farmers’ market preference of different agricultural products, both of which are suitable for binary choice problems [36]. A few empirical studies employed the Tobit model. However, the Multinomial Logit (MNL) model is most often used for the choices among three or more markets. Shema [37] employed MNL in the study of institutional factors influencing a farmer’s choice of milk marketing channels in Rwanda. The study showed that forms of payment negatively influenced the preference of the local vendors marketing channel over brokers’ channel and contract farming significantly influenced the preference of the local vendors marketing channel over the brokers’ channel. The results indicated that forms of payment and accesses to market information negatively affect the probability of selecting the milk collection centers marketing channel over the brokers’ channel. The MNL model was also used by Fekadu [38] on the study of farmers’ marketing preferences in local coffee markets in Ethiopia. Using stated choice experiment and MNL with latent class specification technique, the study showed that characteristics of the traders are more important than the price offered when anchoring their transactions in personal relationships.
Considering the possible inter-relationships between various markets and a bundle of sales channel choices made by farmers, others have employed the Multivariate Probit (MVP) econometric techniques to simultaneously model the influence of the set of explanatory variables on each of the different sales channel choices, while allowing the unobserved factors (error terms) to be freely correlated [7,36,39,40]. Multivariate probit regression (MVP) was used in the study of market outlet choice of a smallholder mango producer in Southern Ethiopia. The author Honja [41] claimed that family size, distance to the market, quantity of mango produced, and price agreement are the significant determinants for the preference of the wholesale market. Farmers’ choice of collector market is determined by the family size, distance to the nearest market, quantity of mango produced, price offered and access to non-farm income. The preference of retailer market is determined by the variables such as quantity of mango produced and price offered.
Similar to MVP, except that the dependent variables are not binary outcomes [42], the Seemingly Unrelated Regression (SUR) model was used in the study of Bailey and Hunnicutt [43] to determine the role of transaction costs in market selection for commercial feeder cattle operations. This approach was also used by Krishna [44] to explain a farmer’s decision to choose the direct sales channel in retail food systems of the United States.
Few authors have employed choice experiments as a survey-based technique for modeling the preference of market. Data about the market selection decisions of famers can be obtained from methods based on revealed preference or stated preference [45]. Methods based on stated preference requires the experimental design of preference. However, Mark Wardman [46] argued that individuals’ stated preferences might not correspond closely to their actual preferences.
3. Methodology
3.1. Study Area
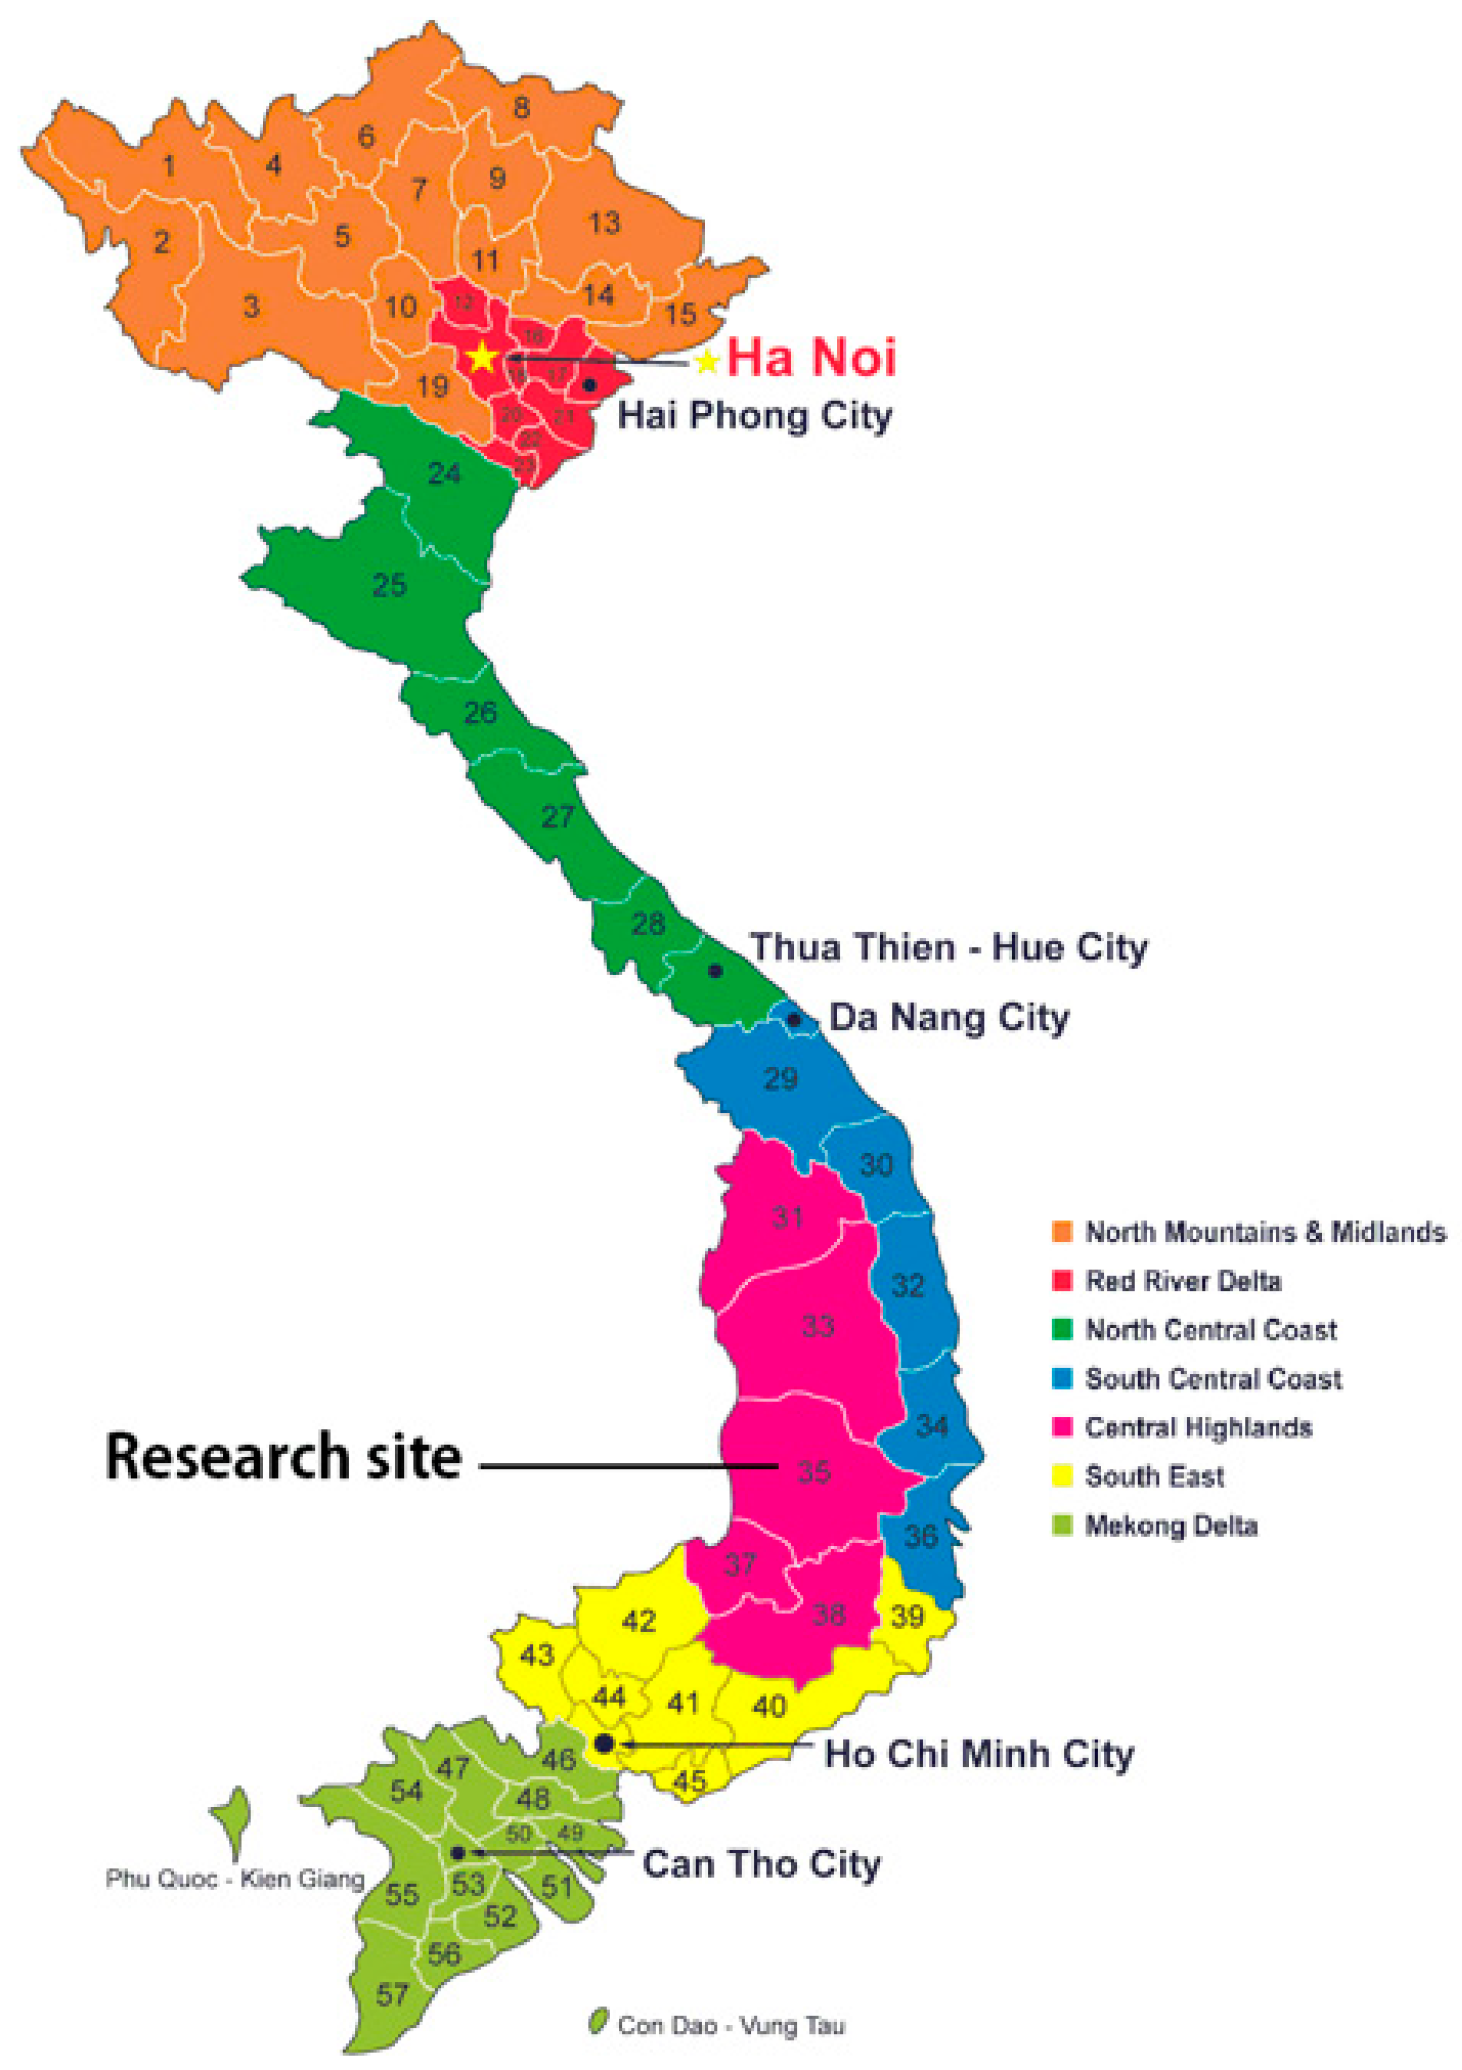
The study was conducted in Dak Lak province, Vietnam. Dak Lak province is located in the Central Highlands, the upper course of Serepok River and a part of Ba River, a land famous for its coffee and rubber production (Figure 1). Its geographic coordinates are from 107°28′57″ to 108°59′37″ east longitude and from 12°9′45″ to 13°25′06″ north latitude with an average elevation about 400–800 m. Dak Lak occupies an area of 13,125.37 square kilometers. Total population was 1,796,666 people and the density was over 137 people per square kilometer. More than 75.9 percent of total population is living in rural areas. There are 47 different ethnic minorities in Dak Lak, of which the Kinh accounts for approximate 70 percent of total population and the rest are other ethnic minority communities including Ede, Gia rai, M’nong, Thai, Tay, Nung, etc. The administrative units of the province are: Buon Ma Thuot City, Town Lake and the district of Buon Ea H’Leo, Easup, Krong Nang, Krong Buk, Buon Don, Cu M’gar, Ea Kar, M’Drac, Krong Pac, Krong Ana, Krong Bong, Lak, Cu Kuin. Dak Lak is represented by coffee production, accounting for more than 30 percent of the total coffee production area in Viet Nam. Coffee is also the main agricultural product and coffee export turnover in 2015 was approximately 479 million dollars, accounted for more than 60 percent of gross domestic product by Dak Lak province (Dak Lak People’s Committee).
3.2. Data Collection
In this study, we collected quantitative and qualitative data from primary and secondary sources. The methods of data collection conducted were direct interview, key informant interview, and field observation in the 2017 crop year. Regarding the sampling strategy, a sample size of 200 sustainable certified coffee farmers was purposively selected from Krong Pak (KRP) and Cu M’gar (CMG) districts in Dak Lak. These farmers grow certified Robusta under the sustainable coffee program (SCP) launched by the Dak Lak People’s Committee in 2008. Under the so-called industrialization process of the sector, they have recently been encouraged to coordinate with coffee processors/exporters (private and state-owned companies) in order to produce a greater range of high-quality standardized products. In the sample selection process, office experts in local authorities, extension centers, and the Dak Lak Department of Agriculture and Rural Development (DARD) were consulted. The heads of each local village are also involved in the finalizing process of the respondents list. The pre-test survey of 50 sustainable coffee farmers was implemented in April 2016.
Questionnaire was designed into several sections. First, the respondents provide the information about the demographic and socio-economic characteristics of the farmer household. A set of closed-ended questions in the latter sections was used to elicit different attributes of transaction costs that influence sale the decisions of the coffee farmers. Problems and concerns of a farmer’s participation in each market were in the final section. The response rate was 91.5 percent, and then final 183 questionnaires were completed. Furthermore, reports and documents regarding the Dak Lak coffee sector were collected from Dak Lak DARD, WASI (Western Highlands Agro-Forestry Scientific and Technical Institute, Dak Lak, Viet Nam), Buon Ma Thuot Coffee Association (BMTCA), and VICOFA (Vietnam Coffee Cocoa Association).
3.3. Seemingly Unrelated Regression Model
In this study, the proportion of sale in different markets, transaction cost attributes, socioeconomic factors, and behavioral aspects of sustainable coffee farmers are analyzed using seemingly unrelated regression (SUR) developed by Zellner [47,48]. The model with p > 1 dependent variable allows for different estimator matrices in each equation and accounts for contemporaneous correlation. We consider here a model comprised of M multiple regression equations of the form:
where yti is the tth observation on the ith dependent variable which is to be explained by the ith regression equation, xtij is the tth observation on jth explanatory variable appearing in the ith equation, βij is the coefficient associated with xtij at each observation and εti is the tth value of the random error component associate with ith equation of the model.
These M equations can be compactly expressed as:
where yi is (T × 1) vector with elements yti; Xi is (T × Ki) matrix, the columns of which represent the T observations on an explanatory variable in the ith equation; βi is a (ki × 1) vector with elements βij; and εi is a (T × 1) vector of disturbances. These M equations can be further expressed as:
where the orders of y is (TM × 1), X is (TM × k *), β is (k *× 1), ε is (TM × 1) and k* = ∑ki
Treat each of the M equations as the classical regression model and make conventional assumptions for i = 1, 2, …, M as:
Xi is fixed
where Qii is nonsingular with fixed and finite elements:
E (uiui′) = σii IT where σii is the variance of disturbances in ith equation for each observation in the sample.
Considering the interactions between the M equations of the model, we assume:
where Qij is non-singular matrix with fixed and finite elements and σij is the covariance between the disturbances of ith and jth equations for each observation in the sample.
Compactly, we can write:
where ⊗ denotes the Kronecker product operator, ψ is (MT × MT) matrix and Σ = ((σij)) is (M × M) positive definite symmetric matrix. The definiteness of Σ avoids the possibility of linear dependencies among the contemporaneous disturbances in the M equations of the model.
The structure E (uu’) = Σ ⊗ IT implies that the:
variance of εti is constant for all t
contemporaneous covariance between εti and εtj is constant for all t
intertemporal covariance between εti and εt*j (t ≠ t*) are zero for all i and j
3.4. Data Analysis and Model Specification
Methods of data analysis such as descriptive statistics, cross tabulation, the chi-square test and t-test were used. Simple descriptive statistics were conducted using Statistical Package for Social Sciences (SPSS 22.0). Another statistic program Stata 13 was used to analyze factors that influence the farmers’ decision of the coffee market choice. Based on the theory of rational choice, coffee farmers are expected to be rational and they are more likely to choose the mix of markets to maximize his/her utility. As previously mentioned, if the dependent variables are categorical (proportion) outcomes and the error terms are contemporaneously correlated, then the SUR model leads to an efficient parameter estimate [49]. Seemingly unrelated regression models appear to be joint estimates from several regression models, each with their own error term. The regressions are related because the (contemporaneous) errors associated with the dependent variables may be correlated [47,48,50]. The correlations of the residuals in the PCSE, PCSA, and PCST models are −0.3031, −0.1583, and −0.5215 that we can reject the hypothesis that correlations are zero (see Table A4 Appendix A). The efficiency gain of using the SUR method increases, not only with increasing correlation of the error terms, but also with higher multicollinearity between explanatory variables [49]. However, a test using VIF (variance inflation factor) indicates the absence of severe collinearity problem (see Table A3 Appendix A). The model of market preference consists of three single equations (which share a common error structure) to simultaneously estimate the sale proportion for each market as the following:
where αi, βi, γi, and δi are the regression coefficients to be estimated and εi are the error terms in the SUR model for the proportion of coffee sold (PCS) of ith farmer in each market. PCSE, PCSA, and PCST are proportion of coffee sold to market of exporter/processor, buying agent, and local trader, respectively. TCA represents farmer’s attitudes toward different transaction cost attributes in each market (l = UCER, INFO, COM, PORT, GRAD, PAY, FREQ, QUAN, and TRUS). DSC consists of several demographic and socio-economic factors of coffee farmers (m = AGE, GEN, EDU, ETHN, EXPE, FARM, and LOC), which are exactly the same regressors in each equation. Coffee farmers might select a market either because they are satisfied with that alternative or because they are less satisfied with other alternatives. Table 1 shows the questionnaire and specification of variables used in the SUR model.
4. Results
4.1. The Coffee Market in Dak Lak
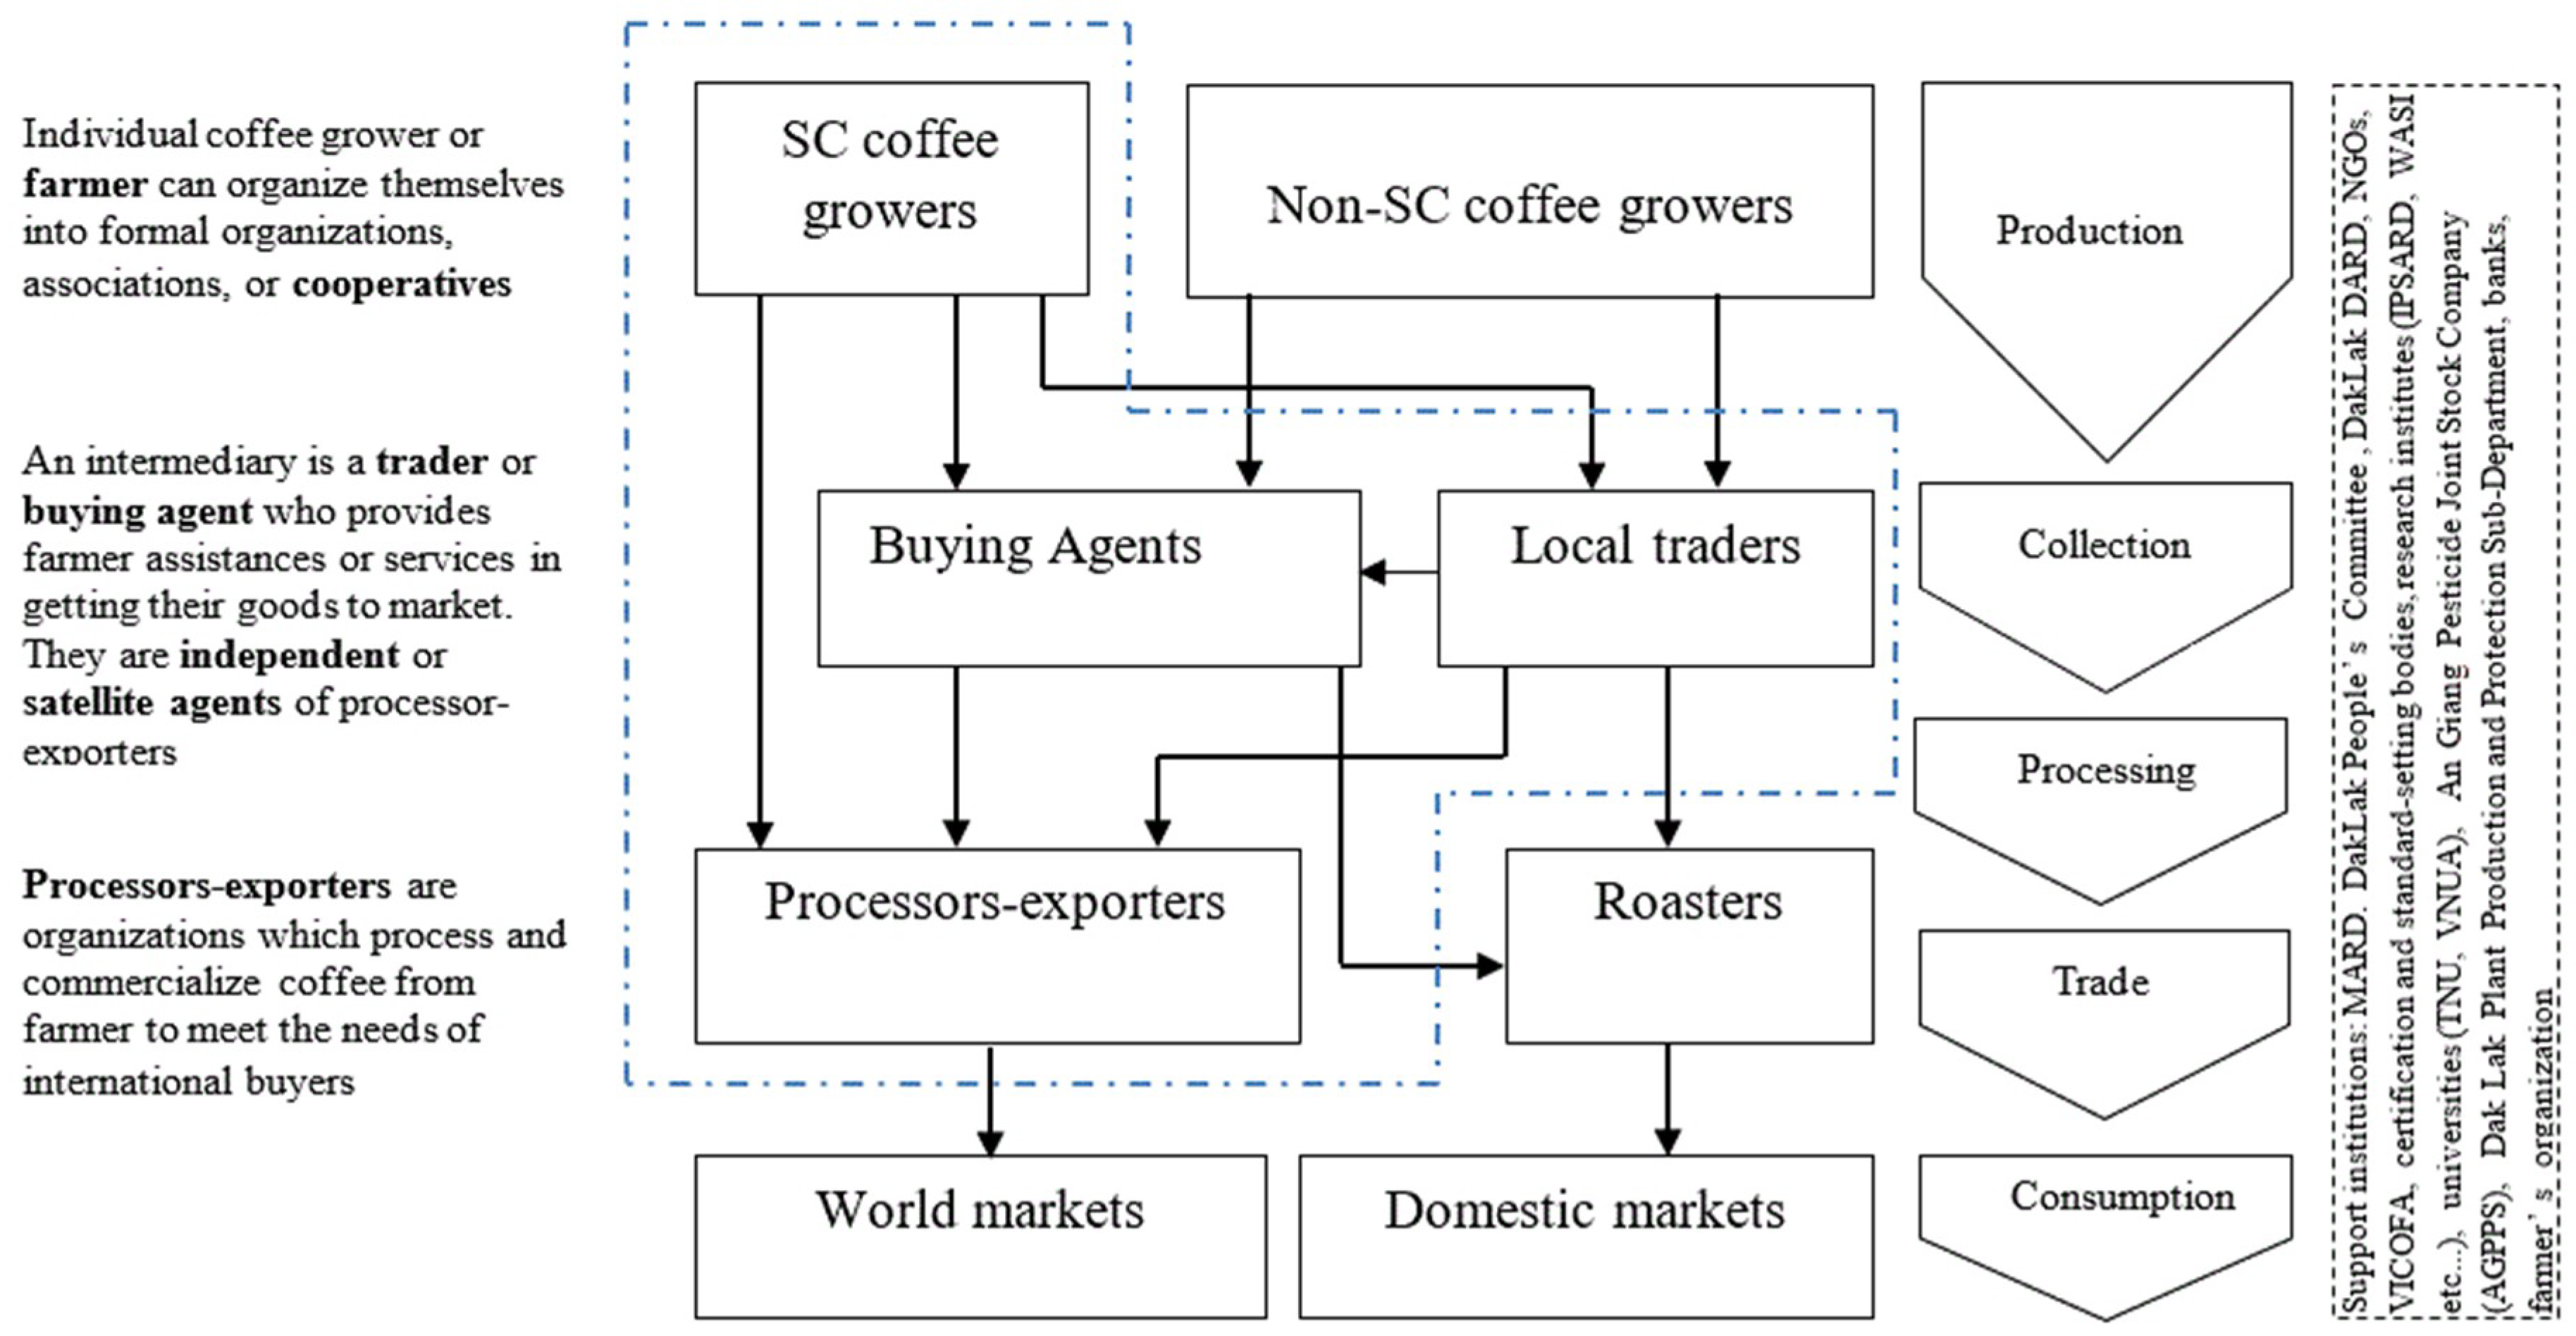
According to Dak Lak DARD in 2015, there are approximately 300,000 family labors, and 100,000 hired labors harvesting coffee from 203,746 hectares in Dak Lak. Coffee farmers achieved the average productivity of 2.3 tons/hectare, which contributed to the provincial annual yield of 400,000 tons. Smallholder coffee farmers sell their coffee to local traders, processors/exporters, roasters, and mostly to buying agents with the sale proportion of 5.37%, 2.01%, 0.46%, and 92.16%, respectively (Dak Lak DARD). Figure 2 presents the supply chain of coffee in Dak Lak.
The harvest season of coffee in Dak Lak always lasts approximately a month, starting at the end of November or beginning of December. Once the coffee cherry was picked, it is either stored for a few weeks or hulled right away to remove the outer skin and the inner parchment. Then the preliminary dry processing must begin as quickly as possible to prevent spoilage. These activities have been done on the farm where many concrete yards and village roads are used for coffee sun-drying. After this, most of the sun-dried coffee beans are delivered to buying agents (or collectors). The buying agents purchase dried beans from smallholder farmers through individual informal contract (verbal). State-owned companies licensed these buying agents during the 1990s (functioning as satellite agents) but they are now operating mostly as private firms. Coffee farmers consign (or deposit) a large proportion of their harvest to them because of their credit-bound relationship. Coffee export prices and market trends were communicated daily between coffee farmers and buying agents. When the coffee farmers feel the price is right, then the decided sale volume is subtracted from the farmer’s consignment. Conversely, processors/exporters in the provincial coffee market also rely on buying agents to guarantee their supplies of dried coffee beans. Even though these companies have been trying to integrate coffee farmers into their own supply system through contract farming, the reward is considered insignificant. This explains the fact that only a small proportion of farmers’ dried beans bypasses the buying agents and are sold directly to processors/exporters.
Both private (including foreign-invested companies) processors/exporters and state-owned processors/exporters (including joint stock companies) are in the provincial supply chain making the coffee bean markets highly competitive. By far, the monopsony of the buying agents plus farmers’ coffee consignment to the buying agents altogether symbolizes the coffee market supply of Dak Lak [51]. Throughout significant structural change in the coffee sector, from direct government intervention to primarily operating through private channels, the role of buying agents in the coffee market is unquestionable. Despite fierce competition between state-owned processors/exporters (joint-stock company) and private processors/exporters (companies with foreign direct investment) in local coffee bean markets, buying agents still acquire the largest share of the market supply. Local traders are also those who try to play the buying agents’ game to gain benefit through price margins, especially during the harvest season.
At harvest time, a small quantity of red cherries goes to wet processing by selling directly to processors/exporters or indirectly through local traders. Coffee processed by wet method (called wet processed or washed coffee) only accounted for approximately 15.3% in 2015. According to Dak Lak DARD, there are 16 enterprises owning wet processing technology and 23 processing enterprises owning dry processing technology. The wet processing capacity of the whole province is 64,000 tons/year while the dry processing capacity is 475,000 tons/year. Although further processing steps take place whereby the coffee beans are cleaned, sorted, polished, and graded, coffee beans are exported to 53 different world markets including: Germany (43,468 million USD), Japan (53,090 million USD), Switzerland (43,468 million USD), Italy (42,228 million USD), etc.
4.2. Descriptive Statistics
According to the descriptive statistics shown in Table 2 the results revealed that surveyed coffee farmers in CMG and KRP mostly are male (122 of 183). Similar to other agricultural sectors, male farmers often play an important role in the decision making of the household. These farmers have considerable experience in coffee farming (more than 8 years), and some farmers even have 15 years of participating in this sector. The age of coffee farmers ranges from 20 to 67, and the average age is 44.6 years. The average years of educational level are 9.66 meaning most farmers attained their education at high school level. Household size was approximately five persons on average. In some cases, household size was eight persons. Coffee farmers probably may utilize members of the household as family labor for some operations relating to the production and marketing of coffee. BMTCA reported that hired labor is costly and extremely hard to find in harvest season. Furthermore, the average farm size was 1.4 hectares and the maximum farm size was 4 hectares. The fact is that most coffee plantations in Dak Lak are small-scale operations (<2 hectares) that do not allow farmers to benefit from economies of scale as well as expand areas and apply synchronous technologies. The average productivity was 3.2 tons/hectare and the maximum productivity was 5.4 tons/hectare. A total 139 respondents are Kinh ethnic, the rest are Ede, Gia rai, Tay, etc. Surveyed farmers have different kinds of sustainable coffee production certifications such as 4C, Fairtrade, RFA (Rainforest Alliance), and UTZ Certified. The number of respondents for each kind of certification are 13 (7.1%), 60 (32.8%), 34 (18.6%) and 76 (41.5%) respectively (Table 3).
Descriptive statistics results also show that SCP farmers sell their coffee beans to processors/exporters, buying agents, and local traders with the respective sale proportions of 0.27, 0.54, and 0.17. Results of a pairwise comparison show that the farmers’ average proportion of coffee sold to buying agents (PCSA) is significantly higher than farmers’ average proportion of coffee sold to processors/exporters (PCSE) and local traders (PCST). The t values from a pairwise comparison between PCSE and PCSA, PCSE and PCST, PCSA and PCST are −12.778, 4.843, and 14.610 respectively. When comparing the farmer’s proportion of coffee sold to different markets between regions (CMG and KRP), the test statistics however show insignificant differences of PCSE, PCSA, and PCST. The mean values of PCSE, PCSA, and PCST in CMG and KRP are 0.26 and 0.28 (independent sample t-test with t = −1.423), 0.54 and 0.56 (independent sample t-test with t = −0.268), 0.20 and 0.16 (independent sample t-test with t = 1.445) respectively (Appendix A). From this point, regional factors might not have a significant impact on SCP farmers’ preference prior to different buyers in provincial coffee market. However, as distinct market competitiveness and local infrastructure conditions in each production area, the inclusion of the regional factor in the SUR model for further analysis might give opposite outcomes.
Table 4 shows the descriptive statistics of different transaction cost attributes of sustainable coffee farmer in each market. In terms of price uncertainty (UCER), only 35.6% and 37.2% of the surveyed farmers are confident about the price prior to selling their coffee to processors/exporters and local traders respectively. Indeed, this value is much higher in the market of buying agents (76%). This is because the farmers are able to access the daily export price information from the processors/exporters through buying agents. Sustainable certified coffee farmers in KRP are slightly more confident about the price than those in CMG when they sell their coffee to processors/exporters (21.9% vs. 13.7%) and buying agents (39.9% vs. 36.1%). The story is opposite in case of selling to the local traders market (16.4% vs. 20.8%). Although the coffee farmers seemed confident about the price, only a relatively small number of farmers reported that they have access to market information (INFO) prior to selling at each market. About 21.9%, 69%, and 37.2% of the respondents have access to market information when they sell coffees to processors/exporters, buying agents, and local traders respectively. Still, buying agents are able to provide more market information to coffee farmers than other actors in the coffee supply chain.
As mentioned previously, the provincial coffee market is either dominated by private or state-own processors/exporters. In KRP, Thangloi and Phuocan (state-owned company) are sharing the market. In CMG, Dakman and Amazaro (foreign-invested company) have long been the largest players. In fact, none of the surveyed farmers in CMG agreed that the market of processors/exporters is highly competitive. However, about 11.5% of the respondents in KRP agreed that competition exists between two state-owned companies, Thangloi and Phuocan. Indeed, the markets of buying agents and local traders are more competitive as many of these chain actors are scattered throughout the coffee production areas. A total of 60.1% and 79.8% of the respondents claimed that markets of buying agents and local traders are highly competitive.
Out of the total of the surveyed farmers, nearly 80.3%, 76.5, and 60.6% need to ship their coffee prior to selling to processors/exporters, buying agents, and local traders respectively. The number of KRP coffee farmers that had to bear the expense of transportation (PORT) is significantly higher than CMG. This is because most of coffee collection and trading activities in KRP take place adjacent to the Interstate 14 where Thangloi and Phuocan companies are based and the road conditions are much worse than CMG. At the procurement point, the percentages 45.5%, 36.1%, and 33.9% of the surveyed farmers need to go through grading procedure (GRAD) before finalizing the transactions with processors/exporters, buying agents, and local traders. The grading requirements from the processors/exporters are highly stringent, as coffee beans are sorted by size as well as the classification of ripe cherries. The comparison of GRAD variables in each market and the average PCSE, PCSA, and PCST also reveals that grading requirements might hinder farmers from entering the market. Many more coffee farmers in KRP have to go through grading requirements compared to CMG at each market.
Dak Lak coffee farmers receive cash in the market exchange with local traders or processors/exporters. Prior to selling to buying agents, farmers consign (or deposit) their coffee beans and receive payment in cash later or in exchange of inputs for the next crop year. In some worse scenarios, the consignment is immediately used to pay for the previous loans. Delayed payment in most markets is often a case. About 45.9%, 18.5%, and 35% of the respondents have experienced delayed payment prior to selling coffee to processors/exporters, buying agents, and local traders respectively. In the case of processor/exporter markets, the number of surveyed farmers who receive late payment in CMG (16.4%) is significantly smaller than KRP (29.5%). However, the story is somewhat different at the market of buying agents (10.9% vs. 7.6%).
Through informal contracts with processors/exporters, the delivery of sustainable certified coffee is arranged before the harvest. The fact is that only 53% of the respondents report that the delivery was scheduled (DELI) with the processors/exporters. The statistics are 26.6% and 26.2% in case of selling to buying agents and local traders. Agreement on quantity (QUAN) is not always fixed between sustainable certified coffee farmers and buyers. This variable was reported at 56.3%, 24.1%, and 23.5% prior to selling to processors/exporters, buying agents, and local traders respectively. In rural areas, the trust factor is not simply in terms of a verbal or written contract, but also built over time with desired economic attributes such as consistency, trustworthiness, dependability, and reliability. Farmers establish long-term client relationships based on the economic merits of the traders [38]. In this case, the social relationships are embedded in economic transaction. However, there are many incidents in Dak Lak where buying agents’ bankruptcy has ruined their strong bond with coffee farmers, even though many buying agents and local traders are villagers. Not surprisingly, only 36.1% and 36.6% of the surveyed farmers have trust in buying agents and local traders, while this number in the case of selling to processor/exporters is much higher (80.3%). Our in-depth interviews confirm that written commitment is more reliable and convincible than verbal commitment, especially when coffee farmers move from subsistence farming to commercial farming.
4.3. Estimation of SUR Model
In this section, the SUR model was used to analyze the factors influencing the farmers’ preferences over the different markets for sustainable certified coffee. The proportion of coffee sold to each market (PCSE, PCSA, and PCST) was regressed on a farmer’s socio-economics characteristics and different transaction cost attributes to identify reasons underlying the market choice. The test statistic of Breusch–Pagan (test of independence) was 71.171 (Table A4 Appendix A). Hence, the equations are stochastically related through the disturbances that are serially correlated across equations. This indicates the system is referred to as SUR model.
Parameter estimates found in Table 5 provide additional insights about the determinants of farmers’ choice of market. The probability of farmers’ participation in processor/exporter market was significantly influenced by speed of payment (PAY), fixed procurement quantity (QUAN), age of farmer household (AGE), education level (EDU), ethnic of farmer household (ETHN), and farm size (FARM). Speed of payment (PAY) is positively correlated with the probability of farmers’ preference for the market of processors/exporters at 10% level of significance. QUAN (negotiation cost) appears to be a more important determinant than other transaction cost attributes that influences coffee farmers’ decision prior to selling to processors/exporters. This variable is positively correlated with the probability of farmers’ preference for processor/exporter market at 5% level of significance. Socio-economic characteristic such as age (AGE), education level (EDU), farm size (FARM) have a negative influence on the farmers’ preference for processor/exporter market at respectively 0.10, 0.05, and 0.01 level of significance. Therefore, coffee farmers with older age, higher education, and larger farm size do not intend to increase their proportion of coffee sold to processor/exporter market outlets. Variable Ethnic (ETHN) has a significantly positive influence on the farmer’s preference for processor/exporter market at 0.01 level. Thus, Kinh ethnic coffee farmers prefer to sell their coffee beans to processor/exporter market.
The probability of choosing buying agent market was determined by price uncertainty (UCER), market competition (COM), transportation cost (PORT), fixed procurement quantity (QUAN), age of household (AGE), ethnic (ETHN), and farm size (FARM). In this market, information costs (UCER and COM) are statistically significant determinants of farmers’ preference for the buying agent market. Coffee farmers with a perception of market competition and being confident about the price are more likely to increase their proportion of coffee sold to the buying agent. On the other hand, price uncertainty may hinder a farmer’s participation in the market as it most likely increases search, screening, and negotiation costs [52,53]. Transportation cost (negotiation cost) is negatively correlated with farmers’ preference for the buying agent market at 1% level of significance. Higher transportation cost eventually hinders coffee farmers from increasing their proportion of coffee sold to buying agents. Besides, variable QUAN (also negotiation cost) has a positive influence on the coffee farmer’s choice of buying agent market at 1% level of significance. Contrary to the market of processor/exporter, the age of farmer household (AGE) has positive influence on the farmer’s preference for market of buying agents. This means farmer with farmers with an older age prefer to increase their sales to buying agents. Farm size (FARM) also has a positive influence on a farmer’s preference for the market of buying agents at 5% level of significance. The estimated coefficient of ETHN show that Kinh ethnic coffee farmers tend to decrease their proportion of coffee sold to buying agents, which also indicates that the minority farmers favor this market.
The determinants of a farmer’s preference for market of local traders are price uncertainty (UCER), fixed procurement quantity (QUAN), trust on buyers (TRUS), and farm size (FARM). This suggests that coffee farmers who have guaranteed quantity of sale and trust on local traders, are confident about the price, and own a large farm size are more likely to increase their proportion of coffee sold to local traders. The positive influence of UCER, QUAN, TRUS, and FARM variables on farmer’s preference for market of local traders are statistically significant at 1%, 1%, 5%, and 5% respectively. In general, variables such as market information (INFO), grading (GRAD), payment (PAY), delivery frequency (DELI), gender (GEN), and farming experience (EXPE), and location (LOC) do not have significant impact on the market preference of smallholder coffee farmers.
5. Discussion
In this study, farmers used three identified sales channel and preferred to sell the largest proportion of their coffee beans to the market of buying agents. Over the past few years, coffee farmers established a strong bond with buying agents based on their credit-bound relationship that somehow fulfills the desired economic attributes [54]. This, in particular, explains the crucial role of buying agents and their existing monopolistic power in the supply chain [51]. Yet, the sector has recently restructured. As a response to the industrialization process, coffee processors/exporters (stated-owned and FDI private companies) are now making efforts to engage farmer growers into coordinating production and marketing. Participating farmers can either cultivate in their lands or stated-owned farms, carry out production under direct supervision or through cooperatives, commit total sale agreement or proportional coffee volume on designated planting area, and follow technical guidance and support. This institutional arrangement has paved a shortcut to the end market of raw coffee beans in the province. However, rigorous requirements in production and product standardization do not often translate into price premiums, which leads to farmers’ noncompliance or retreat from coordination. In this situation, farmers prefer to sell their harvest elsewhere due to market price fluctuation, his (or her) opportunistic behaviors and traditional farming habits. Indeed, this is not completely ruling out the power of buying agents in the local market, but it is already turning them into competitive actors in the supply chain. The statistics of coffee sale proportion in this study provides empirical evidence that greater coordination in the coffee supply chain leads to better market access for farmers.
Like most market participants, coffee farmers decide whether to sell their products in different markets based on several transaction cost attributes including price uncertainty, a farmer’s perception of market competition, local infrastructure conditions and distance to the market, local monopoly power, market information, product standardization and supervision [8]. Surprisingly, price uncertainty (UCER) significantly influences farmers’ preference for the market of buying agents and local traders. Farmers appear to be more confident about the price they will receive at these markets, but are not quite convinced about the price given by processors/exporters. This implies that the higher the probability of being uncertain, then the lower the farmer’s preference for the market [9,52,53]. The irony is that the daily price information circulated in local markets is actually provided by processors/exporters. So, due to the imperfect knowledge of market participants, uncertainty can be represented by high transaction cost as the farmer has to face costs to obtain information, to screen, and to negotiate [52,53]. SUR results also showed that a higher level of market competition significantly influences a farmer’s preference for the market of buying agents. Local poor infrastructure conditions and distances to the procurement point of processors/exporters increase transportation cost, making them even higher than the margin farmers receive as if they sell their coffee beans to market of processors/exporters. In this regard, it helps explaining the positive influence of market competition and negative influence of transportation cost (PORT) on farmers’ preference for the market of buying agents. The results are in line with Jari and Fraser [55] who claimed that poor infrastructure has led to inefficient use of different markets. Negotiation cost, the cost of arriving at an agreement to undertake the transaction [56], variable QUAN (guaranteed quantity of sale) significantly influence the farmers’ preference for most markets. The SUR estimate results showed the great positive impact of this transaction cost attribute on farmer’s preference for three markets. The more the coffee farmer is certain about the sale volume, the more likely it is that he/she would enter the market. Consistent with the findings of Chitika [57], on-time payment (PAY) positively influences the farmer’s decision to enter the market, as coffee production is their main source of their income. The last transaction cost attribute in the SUR model that significantly affects the farmers’ decision to enter the market of local traders is TRUS (trust). In Viet Nam, the local traders are commonly embedded in social relationships with coffee farmers. Hence, economic transactions are embedded in personal relationships, as long as the reciprocal benefit is sustained [38].
Significant farmers’ demographic and socioeconomic variables in SUR model that influence transaction costs, and thus farmer’s market preference, include age, farming experience, farm size, ethnic, location, and certificate ownership. Aged and well-educated farmers can make information and search costs relatively cheaper [10], thereby encouraging farmers to enter or retreat from the market. Farmers located in high-potential production areas may experience lower levels of transaction costs than those in low-potential production areas [9]. This also indicates the impact of the ethnicity variable on a farmer’s preference to participate in the market, which was mentioned in the study of Tadesse and Shively [54]. Transactions in the local markets are personalized and influenced by family lineage, acquaintance, kinship, ethnic, and patron-client relationships. Also, a farmer’s market preference is assumed to be proportionally related to farm size as farmers with larger farm sized face higher negotiation costs or otherwise [9]. Certification ownership represents quality of coffee, which is a function of all pre- and post-harvest activities [58], may include monitoring and enforcement costs [27]. Certificate ownership can also be understood as information and negotiation cost, thus facilitating the speed of the transaction. However, this factor was omitted from the SUR estimation due to severe multicollinearity problems. In brief, transaction costs are either observable or non-observable [28]. Inclusion of both is important to determine a farmer’s market preference.
6. Conclusions
There have been an increasing number of farmers participating in sustainable certified coffee production of Dak Lak. The benefits of standardization have been realized in terms of production efficiency, environmental protection, biodiversity preservation, and social equity. The belief is that these desirable impacts were also stemmed from the industrialization process and market reform in the coffee sector. However, many smallholder farmers at this moment still work their way to struggle with the main source of income from coffee production. Yet, among the main issues, the biggest problem of the coffee market is the market itself. With the transaction cost approach, this study used the classification scheme by Hobbs [27] to identify several transaction cost components that influence farmers’ sale decisions in different markets. Empirical results highlight the significant role of several socio-demographic factors on the market preference of a coffee farmer. The former explanation could be instable coffee price and ineffective institutional structure in the local market. Farmers normally expect coffee prices at a level that covers the cost of production and creates reasonable profit. However, bounded rationality and opportunism behavior redirect their decisions toward an imperfect market. Besides, economic problems such as imperfect knowledge, ambiguity, and distortion of information could lead to uncertainty in choosing the right buyers. In addition, the unavoidable cash-shortage and limited access to loans in rural areas narrow their choices of buyer, and hence constrains small-scale farmers in the credit-bound relationship with buying agents. Despite the decreasing monopolistic power, buying agents are still key players in the local coffee supply chain. Repeated transactions between coffee farmers and buying agents are most often embedded in social relationships (family lineage, kinship, acquaintance, etc.) where the trust factor anchors their long-term commitment. Given the alternative formal institution, as processors/exporters have made efforts to engage smallholder farmers in coordinating production and marketing, a few have been able to gain access to a better market. However, while this new governance structure has earned initial successes, is has also resulted in numerous failures. Noncompliance, marginalization, over-dependence, disrupt power relation, and exploitation are typical examples. In this regard, the vertical integration, on one the hand, progressively bring farmers in high-potential areas closer to high-value markets, but simultaneously on the other hand, excludes farmers in low-potential areas from the sector. In brief, farmers are key contributors to the sustainable development of the Vietnamese coffee sector but also are the most vulnerable ones. Buy exploring the farmer’ market preference through transaction cost attributes and socio-demographic factors, this study has provided empirical evidence that social mobility and norms should be carefully taken into account in coffee market transformation. The markets of exporter/processor were expected to bring a shortcut to economic well-being of smallholder coffee farmers by offering risk-sharing opportunities, technological advantages in production, transparency of market information, and price premiums. However, problems of inconsistency, mutual trust, and thin institutional structure associated with production constraints of coffee farmers have ruined their shared belief. Therefore, market imperfection continues to triumph the monopolistic power of buying agents and opportunism of local traders.
The study is not extrapolated to the entire coffee sector due to results being obtained from a small research sample. Certified coffee production only accounts for 48.2% of the total coffee output in Dak Lak. The chosen research areas are adjacent to Buon Me Thuot City where most of coffee trading activities take place. For that reason, a study at a larger scale could complement this study. In addition, the inclusion of personalized transaction attributes in the analysis could be another direction for further research.
Author Contributions
W.B. is the initiator of this PhD research. He provided instructions for the research design and approach. N.H.A. collected data through surveys in Vietnam, developed and improved the paper, and provided responses for the journal’s reviewers and editorial board. All the authors read and approved the final manuscript.
Funding
The authors are grateful to Vietnam International Education Development for funding of this research.
Conflicts of Interest
The authors declare no conflict of interest.
Appendix A

Table A1.
Descriptive statistics.
| District | N | Mean | Std. Deviation | Std. Error Mean | |
|---|---|---|---|---|---|
| PCSE | CMG | 88 | 0.25793038 | 0.16095402 | 0.01715776 |
| KRP | 95 | 0.28875435 | 0.13145864 | 0.01348737 | |
| PCSA | CMG | 88 | 0.54385117 | 0.21984888 | 0.02343597 |
| KRP | 95 | 0.55147926 | 0.16253306 | 0.01667554 | |
| PCST | CMG | 88 | 0.19821844 | 0.19576541 | 0.02086866 |
| KRP | 95 | 0.15976639 | 0.16381120 | 0.01680667 | |
Table A2.
Independent samples test.
| Variable | Levene’s Test | t-test for Equality of Means | ||||||
|---|---|---|---|---|---|---|---|---|
| F | Sig | t | df | Sig. (2-tailed) | Mean Difference | Std. Error Difference | ||
| PCSE | Equal variances assumed | 0.458 | 0.500 | −1.423 | 181 | 0.156 | −0.030824 | 0.021657 |
| Equal variances not assumed | −1.412 | 168.27 | 0.160 | −0.030824 | 0.021824 | |||
| PCSA | Equal variances assumed | 3.785 | 0.053 | −0.268 | 181.00 | 0.789 | −0.007628 | 0.028441 |
| Equal variances not assumed | −0.265 | 159.54 | 0.791 | −0.007628 | 0.028763 | |||
| PCST | Equal variances assumed | 0.201 | 0.655 | 1.445 | 181.00 | 0.150 | 0.038452 | 0.026614 |
| Equal variances not assumed | 1.435 | 170.19 | 0.153 | 0.038452 | 0.026795 | |||
Table A3.
Collinearity Diagnostics.
| Variables | PCSE | PCSA | PCST | |||
|---|---|---|---|---|---|---|
| Tolerance | VIF | Tolerance | VIF | Tolerance | VIF | |
| UCER | 0.889 | 1.124 | 0.583 | 1.716 | 0.544 | 1.839 |
| INFO | 0.885 | 1.130 | 0.591 | 1.691 | 0.593 | 1.686 |
| COM | 0.721 | 1.387 | 0.868 | 1.152 | 0.956 | 1.046 |
| PORT | 0.645 | 1.551 | 0.571 | 1.753 | 0.927 | 1.079 |
| GRAD | 0.855 | 1.170 | 0.903 | 1.108 | 0.902 | 1.109 |
| PAY | 0.837 | 1.195 | 0.930 | 1.076 | 0.911 | 1.098 |
| DELI | 0.638 | 1.567 | 0.834 | 1.199 | 0.892 | 1.121 |
| QUAN | 0.934 | 1.071 | 0.870 | 1.150 | 0.904 | 1.106 |
| TRUS | 0.850 | 1.177 | 0.857 | 1.167 | 0.862 | 1.160 |
| AGE | 0.673 | 1.487 | 0.685 | 1.459 | 0.685 | 1.460 |
| GEN | 0.782 | 1.279 | 0.781 | 1.280 | 0.821 | 1.218 |
| EDU | 0.806 | 1.241 | 0.858 | 1.166 | 0.836 | 1.196 |
| ETHN | 0.499 | 2.004 | 0.500 | 2.000 | 0.495 | 2.022 |
| EXPE | 0.395 | 2.534 | 0.377 | 2.649 | 0.404 | 2.474 |
| FARM | 0.815 | 1.228 | 0.915 | 1.093 | 0.914 | 1.094 |
| LOC | 0.364 | 2.744 | 0.347 | 2.880 | 0.390 | 2.563 |
Note: Eigen values for PCSE, PCSA and PCST model are 11.645, 11.080, and 10.879 respectively.
Table A4.
Correlation matrix of residuals.
| Variable | PCSE | PCSA | PCST |
|---|---|---|---|
| PCSE | 1 | ||
| PCSA | −0.3031 | 1 | |
| PCST | −0.1583 | −0.5215 | 1 |
Breusch–Pagan test of independence: chi 2(3) = 71.171, Pr = 0.0000.
References
- Barrett, C.B. Smallholder market participation: Concepts and evidence from eastern and southern Africa. Food Policy 2008, 33, 299–317. [Google Scholar] [CrossRef]
- Williamson, O. Transaction-Cost Economics: The Governance of Contractural Relations. J. Law Econ. 1979, 22, 233–261. [Google Scholar] [CrossRef]
- Peterson, H.C.; Wysocki, A. Strategic Choice along the Vertical Coordination Continuum; Department of Agricultural, Food, and Resource Economics, Michigan State University: East Lansing, MI, USA, 1998. [Google Scholar]
- Key, N.; Runsten, D. Contract Farming, Smallholders, and Rural Development in Latin America: The Organization of Agroprocessing Firms and the Scale of Outgrower Production. World Dev. 1999, 27, 381–401. [Google Scholar] [CrossRef]
- Minot, N. Contract Farming and Its Effect on Small Farmers in Less Developed Countries; Department of Agricultural, Food, and Resource Economics, Michigan State University: East Lansing, MI, USA, 1986. [Google Scholar]
- Baker, J.L.; Grosh, M.E. Poverty reduction through geographic targeting: How well does it work? World Dev. 1994, 22, 983–995. [Google Scholar] [CrossRef]
- Arinloye, D.-D.A.A.; Pascucci, S.; Linnemann, A.R.; Coulibaly, O.N.; Hagelaar, G.; Omta, O.S.W.F. Marketing Channel Selection by Smallholder Farmers. J. Food Prod. Mark. 2015, 21, 337–357. [Google Scholar] [CrossRef]
- Sadoulet, E.; De Janvry, A. Quantitative Development Policy Analysis: Exercise Solutions; Johns Hopkins University Press: Baltimore, MD, USA, 1995. [Google Scholar]
- Cuevas, A.C. Transaction Costs of Exchange in Agriculture: A Survey. Asian J. Agric. Dev. 2014, 11, 21–38. [Google Scholar]
- Pingali, P.; Khwaja, Y.; Meijer, M. Commercializing Small Farms: Reducing Transaction Costs. Future Small Farms 2005, 61, 5–8. [Google Scholar]
- Kirsten, J.; Sartorius, K. Linking agribusiness and small-scale farmers in developing countries: Is there a new role for contract farming? Dev. South. Afr. 2002, 19, 503–529. [Google Scholar] [CrossRef] [Green Version]
- Little, P.; Watts, M. Living under Contract: Contract Farming and Agrarian Transformation in Sub-Saharan Africa; University of Wisconsin Press: Madison, WI, USA, 1994. [Google Scholar]
- Eaton, C.; Shepherd, A. Contract Farming: Partnerships for Growth; Food and Agriculture Organization of the United Nations: Rome, Italy, 2001. [Google Scholar]
- Coase, R.H. The Nature of the Firm. Economica 1937, 4, 386–405. [Google Scholar] [CrossRef]
- Williamson, O.; Wachter, M.L.; Harris, J.E. Understanding the Employment Relation: The Analysis of Idiosyncratic Exchange. Bell J. Econ. 1975, 6, 250–278. [Google Scholar] [CrossRef]
- Williamson, O. Employee ownership and internal governance: A perspective. J. Econ. Behav. Organ. 1985, 6, 243–245. [Google Scholar] [CrossRef]
- Niehans, J. Money in a Static Theory of Optimal Payment Arrangements. J. Money Credit Bank. 1969, 1, 706–726. [Google Scholar] [CrossRef]
- Arrow, K. The Organization of Economic Activity: Issues Pertinent to the Choice of Market versus Non-Market Allocation. In The Foundations of the New Institutional Economics; Edward Elgar: Northampton, MA, USA, 2004; pp. 110–124. [Google Scholar]
- Barzel, Y. Economic Analysis of Property Rights; Cambridge University Press: Cambridge, UK, 1997. [Google Scholar]
- Stavins, R.N. Transaction Costs and Tradeable Permits. J. Environ. Econ. Manag. 1995, 29, 133–148. [Google Scholar] [CrossRef]
- Wallis, J.J.; North, D. Measuring the transaction sector in the american economy, 1870–1970. In Long-Term Factors in American Economic Growth; National Bureau of Economic Research: Cambridge, MA, USA, 1986; pp. 95–162. [Google Scholar]
- Allen, D.W. What are Transaction Costs? Res. Law 1991, 14, 1–18. [Google Scholar]
- Benham, A.; Benham, L. The Costs of Exchange. In The Elgar Companion to Transaction Cost Economics; Edward Elgar Publishing: Cheltenham, UK, 2010; pp. 107–119. [Google Scholar]
- Hardt, Ł. The history of transaction cost economics and its recent developments. Erasmus J. Econ. Philos. 2009, 2, 29–51. [Google Scholar] [CrossRef] [Green Version]
- Singh, N. Transaction costs, information technology and development. Indian Growth Dev. Rev. 2008, 1, 212–236. [Google Scholar] [CrossRef]
- Shelanski, H.A.; Klein, P. Empirical research in transaction cost economics: A review and assessment. J. Law Econ. Organ. 1995, 11, 335–361. [Google Scholar]
- Hobbs, J. Measuring the importance of transaction costs in cattle marketing. Am. J. Agric. Econ. 1997, 79, 1083–1095. [Google Scholar] [CrossRef]
- Holloway, G.; Nicholson, C.; Delgado, C.; Staal, S.; Ehui, S. Agroindustrialization through institutional innovation Transaction costs, cooperatives and milk-market development in the east-African highlands. Agric. Econ. 2000, 23, 279–288. [Google Scholar] [CrossRef]
- Key, N.; Sadoulet, E.; de Janvry, A. Transactions Costs and Agricultural Household Supply Response. Am. J. Agric. Econ. 2000, 82, 245–259. [Google Scholar] [CrossRef]
- Furubotn, E.; Richter, R.; Lozano, J. Institutions and Economic Theory—The Contribution of the New Institutional Economics; University of Michigan Press: Ann Arbor, MI, USA, 1997. [Google Scholar]
- Den Butter, F.; Mosch, R. Trade, Trust and Transaction Cost; Tinbergen Institute: Amsterdam, The Netherlands, 2003. [Google Scholar]
- Krugman, P. Scale Economies, Product Differentiation, and the Pattern of Trade. Am. Econ. Rev. 1980, 70, 950–959. [Google Scholar]
- Macher, J.T.; Richman, B.D. Transaction Cost Economics: An Assessment of Empirical Research in the Social Sciences. Bus. Politics 2008, 10, 1–63. [Google Scholar] [CrossRef] [Green Version]
- Heltberg, R.; Tarp, F. Agricultural supply response and poverty in Mozambique. Food Policy 2002, 27, 103–124. [Google Scholar] [CrossRef] [Green Version]
- Xaba, B.G.; Masuku, M. Factors affecting the choice of marketing channel by vegetable farmers in Swaziland. Sustain. Agric. Res. 2013, 2, 112–123. [Google Scholar] [CrossRef]
- Hoffman, S.D.; Duncan, G. Multinomial and conditional logit discrete-choice models in demography. Demography 1988, 25, 415–427. [Google Scholar] [CrossRef]
- Gatoni Innocent, S.; Mulyungi, P.; Kinyuru, J.; Nsengiyumva, A. Analysis of institutional factors influencing farmer’s choice of milk marketing channel in Rwanda. Int. J. Res. Appl. Sci. Eng. Technol. 2018, 6, 2321–9653. [Google Scholar]
- Gelaw, F.; Speelman, S.; Van Huylenbroeck, G. Farmers’ marketing preferences in local coffee markets: Evidence from a choice experiment in Ethiopia. Food Policy 2016, 61, 92–102. [Google Scholar] [CrossRef]
- Belderbos, R.; Carree, M.; Diederen, B.; Lokshin, B.; Veugelers, R. Heterogeneity in R&D cooperation strategies. Int. J. Ind. Organ. 2004, 22, 1237–1263. [Google Scholar] [Green Version]
- Greene, W. Marginal Effects in the Bivariate Probit Model; Leonard, N., Ed.; Stern School of Business, Department of Economics, New York University: New York, NY, USA, 1996. [Google Scholar]
- Honja, E.G.A.M.T. Determinants of Market Outlet Choice of the Smallholder Mango Producers: The Case of Boloso Bombe Woreda, Wolaita Zone, Southern Ethiopia: A Multivariate Probit Approach. Glob. J. Sci. Front. Res. 2017, 17, 23–29. [Google Scholar]
- Cappellari, L.; Jenkins, S. Multivariate probit regression using simulated maximum likelihood. Stata J. 2003, 3, 278–294. [Google Scholar] [CrossRef]
- Bailey, D.; Hunnicutt, L. The role of transaction costs in market selection: Market selection in commercial feeder cattle operations. In Proceedings of the Livestock Production/Industries Marketing, Long Beach, CA, USA, 28–31 July 2002. [Google Scholar]
- Paudel, K.P.; Park, T.A.; Pandit, M.U.S. Farmers’ Decision to Choose Direct Sales Channel: A Fractional Seemingly Unrelated Semiparametric Model. In Proceedings of the 2017 Annual Meeting, Chicago, IL, USA, 30 July–1 August 2017. [Google Scholar]
- Lajili, K.; Barry, P.J.; Sonka, S.T.; Mahoney, J.T. Farmers’ Preferences for Crop Contracts. J. Agric. Resour. Econ. 1997, 22, 264–280. [Google Scholar]
- Wardman, M. A Comparison of Revealed Preference and Stated Preference Models of Travel Behaviour. J. Transp. Econ. Policy 1988, 22, 71–91. [Google Scholar]
- Zellner, A. An Efficient Method of Estimating Seemingly Unrelated Regressions and Tests for Aggregation Bias. J. Am. Stat. Assoc. 1962, 57, 348–368. [Google Scholar] [CrossRef]
- Zellner, A.; Huang, D.S. Further Properties of Efficient Estimators for Seemingly Unrelated Regression Equations. Int. Econ. Rev. 1962, 3, 300–313. [Google Scholar] [CrossRef]
- Yahya, W.B.; Adebayo, S.B.; Jolayemi, E.T.; Oyejola, B.; Sanni, O. Effects of Non-orthogonality on the Efficiency of Seemingly Unrelated Regression (SUR) Models. InterStat J. 2008, 1–29. Available online: https://www.researchgate.net/profile/Waheed_Babatunde_Yahya/publication/216601512_Effects_of_Non-orthogonality_on_the_Efficiency_of_Seemingly_Unrelated_Regression_SUR_Models/links/0912f50a6e53169372000000.pdf (accessed on 22 May 2019).
- Cameron, A.; Trivedi, P. Microeconometrics Using Stata, Revised Edition; StataCorp LP: College Station, TX, USA, 2010. [Google Scholar]
- De Fontenay, P.; Leung, S. Managing Commodity Price Fluctuations in Vietnam’s Coffee Industry. Available online: https://openresearch-repository.anu.edu.au/bitstream/10440/1224/1/Fontenay_Managing2002.pdf (accessed on 22 May 2019).
- Cadot, O.; Dutoit, L.; Olarreaga, M. How Costly Is It for Poor Farmers to Lift Themselves out of Poverty? World Bank: Washington, DC, USA, 2006. [Google Scholar]
- Alene, A.; Manyong, V.; Omanya, G.; Mignouna, H.D.; Bokanga, M.; Odhiambo, G. Smallholder market participation under transaction costs: Maize supply and fertilizer demand in Kenya. Food Policy 2008, 33, 318–328. [Google Scholar] [CrossRef]
- Tadesse, G.; Shively, G. Repeated Transaction in Rural Grain Markets of Ethiopia. J. Dev. Stud. 2013, 49, 1172–1187. [Google Scholar] [CrossRef]
- Jari, B.; Fraser, G.C. An Analysis of Institutional and Technical Factors Influencing Agricultural Marketing amongst Smallholder Farmers in the Rift Valley, Eastern Cape Province, South Africa. Afr. J. Agric. Res. 2009, 4, 1129–1137. [Google Scholar]
- Hobbs, J. A Transaction cost analysis of finished beef marketing in the United Kingdom. Ph.D. Thesis, University of Aberdeen, Aberdeen, Scotland, 1995. [Google Scholar]
- Chitika, R.J. Marketing Channel Choice: Its Determinants and Evaluation of Transaction Costs in Smallholder Dairy Farming in Lilongwe Milkshed Area, Malawi. Master’s Thesis, Makerere University, Kampala, Uganda, 2008. [Google Scholar]
- Vaast, P.; Kanten, R.; Siles, P.; Dzib, B.; Franck, N.; Harmand, J.-M. Shade: A key factor for coffee sustainability and quality. Assoc. Sci. Inf. Coffee 2006, 20, 887–896. [Google Scholar]
Figure 1.
Study area.

Figure 2.
Coffee supply chain of Dak Lak. Source: Own observation.

Table 1.
Explanatory variables hypothesized to influence a farmer’s market preference.
| Variable | Definition | Unit | Questionnaire/Variable Specification | Hypothesis |
|---|---|---|---|---|
| UCER | Price uncertainty | dummy | Are you certain about your coffee prices (i.e., price levels guarantee your satisfied profit, reflect quality of your coffee, and represent fair exchange, etc.) given to buyer in each selling method? 1 = yes, 0 otherwise | + |
| INFO | Market information | dummy | Do you have sufficient market information (i.e., coffee yield, coffee bean qualification, harvest situation input expenses of other farmers, local market demand and supply, etc.) before selling your coffee to buyer in each selling method? 1 = yes, 0 otherwise | + |
| COM | Competitive market | dummy | Is there more than one buyer in each selling method that ensures competitive market? 1 = yes, 0 otherwise | + |
| PORT | Transport | dummy | Do you have to ship your coffee to buyer location in each selling method? 1 = yes, 0 otherwise | − |
| GRAD | Grading | dummy | Does buyer require coffee classification in each selling method? 1 = yes, 0 otherwise | +/− |
| PAY | Payment | dummy | Does buyer in each selling method make payment within a week after delivery or longer? 1 = within a week, 0 otherwise | + |
| DELI | Delivery frequency | dummy | Does buyer in each selling method schedule the delivery before harvest? 1 = yes, 0 otherwise | + |
| QUAN | Quantity | dummy | Is the sale volume agreed and fixed before harvest with buyer in each selling method? 1 = yes, 0 otherwise | + |
| TRUS | Trust | dummy | Do you think that your transaction with buyer in each selling method is carried out honestly, accurately and fairly? 1 = yes, 0 otherwise | + |
| AGE | Age | years | Age of respondent | +/− |
| GEN | Gender | dummy | 1 = male, 0 = female | +/− |
| EDU | Education | years | Number of years in school | + |
| ETHN | Ethnic | dummy | 1 if respondent is Kinh, 0 other ethnic minorities | +/− |
| EXPE | Farming experience | years | Number of years in coffee farming | + |
| FARM | Farm size | ha | Number of hectares for coffee production | +/− |
| LOC | Location | dummy | 1 if respondent bases in Cu M’gar (CMG), 0 if respondent bases in Krong Pak (KRP) | +/− |
Table 2.
Descriptive statistics.
| Variable | Mean | Std. Dev. | Min | Max | Obs |
|---|---|---|---|---|---|
| Age | 44.60109 | 10.03452 | 20 | 67 | 183 |
| Education | 9.661202 | 2.452846 | 5 | 16 | 183 |
| Experience | 8.743169 | 4.177996 | 2 | 15 | 183 |
| Household size | 4.699454 | 1.187087 | 2 | 8 | 183 |
| Farm size | 1.401661 | 0.6462252 | 0.3 | 4 | 183 |
| Productivity | 3215.765 | 805.0977 | 1200 | 5400 | 183 |
Table 3.
Descriptive statistics.
| Variable | CMG | KRP | Total | Chi-square | |
|---|---|---|---|---|---|
| Gender | Female | 18 (9.8) | 43 (23.5) | 61 (33.3) | 12.652 a |
| Male | 70 (38.3) | 52 (28.4) | 122 (66.7) | ||
| Ethnicity | Kinh | 76 (41.5) | 63 (34.5) | 139 (76.0) | 10.054 b |
| Others | 12 (6.6) | 32 (17.4) | 44 (24.0) | ||
| Certificate | 4C | 13 (7.1) | 0 (0.0) | 13 (7.1) | 130.991 c |
| UTZ | 0 (0.0) | 76 (41.5) | 76 (41.5) | ||
| RFA | 34 (18.6) | 0 (0.0) | 34 (18.6) | ||
| Fair trade | 41 (22.4) | 19 (10.4) | 60 (32.8) |
Note: a,b,c indicates zero cells (0.0%) have expected count less than 5. The minimum expected count is 29.33, 21.16, and 6.25 respectively. Figures within the parenthesis are percentages. 4.3. Transaction Cost Attributes.
Table 4.
Descriptive statistics of variables influencing market preference.
| Variable | Processor/Exporter | Buying Agent | Local Trader | ||||||
|---|---|---|---|---|---|---|---|---|---|
| CMG | KRP | Chi-Square | CMG | KRP | Chi-Square | CMG | KRP | Chi-Square | |
| UCER | 25.00 (0.137) | 40.00 (0.219) | 3.742 * | 66.00 (0.361) | 73.00 (0.399) | 0.085 | 38.00 (0.208) | 30.00 (0.164) | 2.634 |
| INFO | 26.00 (0.142) | 14.00 (0.077) | 5.865 ** | 57.00 (0.311) | 70.00 (0.383) | 1.708 | 36.00 (0.197) | 32.00 (0.175) | 1.021 |
| COM | 0.00 (0.000) | 21.00 (0.115) | 21.97 *** | 50.00 (0.273) | 60.00 (0.328) | 0.766 | 70.00 (0.383) | 76.00 (0.415) | 0.006 |
| PORT | 63.00 (0.344) | 84.00 (0.459) | 8.189 *** | 45.00 (0.246) | 95.00 (0.519) | 60.68 *** | 50.00 (0.273) | 61.00 (0.333) | 1.046 |
| GRAD | 32.00 (0.175) | 51.00 (0.279) | 5.530 ** | 25.00 (0.137) | 41.00 (0.224) | 4.310 ** | 24.00 (0.131) | 38.00 (0.208) | 3.303 * |
| PAY | 58.00 (0.317) | 41.00 (0.224) | 9.523 *** | 68.00 (0.372) | 81.00 (0.443) | 1.928 | 60.00 (0.328) | 59.00 (0.322) | 0.742 |
| DELI | 44.00 (0.240) | 53.00 (0.290) | 0.615 | 26.00 (0.142) | 23.00 (0.126) | 0.663 | 15.00 (0.082) | 33.00 (0.180) | 7.389 *** |
| QUAN | 50.00 (0.273) | 53.00 (0.290) | 0.020 | 23.00 (0.126) | 21.00 (0.115) | 0.406 | 24.00 (0.131) | 19.00 (0.104) | 1.344 |
| TRUS | 67.00 (0.366) | 80.00 (0.437) | 1.885 | 19.00 (0.104) | 47.00 (0.257) | 15.40 *** | 37.00 (0.202) | 30.00 (0.164) | 2.156 |
Note: *, **, and *** indicates statistically significant at 0.10, 0.05, and 0.01 level respectively. Figures within the parenthesis are percentages.
Table 5.
Seemingly Unrelated Regression (SUR) parameter estimates for the farmers’ market preference.
Table 5.
Seemingly Unrelated Regression (SUR) parameter estimates for the farmers’ market preference.
| Variable | Processor/Exporter | Buying Agent | Local Trader | |||
|---|---|---|---|---|---|---|
| Coef. | Std. Err. | Coef. | Std. Err. | Coef. | Std. Err. | |
| Constant | 0.501 *** | 0.073 | 0.439 *** | 0.077 | 0.066 | 0.071 |
| UCER | −0.004 | 0.018 | 0.050 ** | 0.025 | 0.116 *** | 0.022 |
| INFO | −0.004 | 0.021 | 0.035 | 0.023 | −0.030 | 0.021 |
| COM | 0.021 | 0.031 | 0.044 ** | 0.017 | −0.019 | 0.020 |
| PORT | −0.030 | 0.026 | −0.097 *** | 0.025 | −0.021 | 0.017 |
| GRAD | 0.005 | 0.018 | −0.002 | 0.017 | −0.012 | 0.018 |
| PAY | 0.035 * | 0.018 | 0.005 | 0.021 | −0.003 | 0.017 |
| DELI | 0.001 | 0.021 | −0.001 | 0.020 | −0.015 | 0.019 |
| QUAN | 0.037 ** | 0.017 | 0.092 *** | 0.020 | 0.074 *** | 0.020 |
| TRUS | −0.002 | 0.023 | −0.011 | 0.018 | 0.039 ** | 0.018 |
| AGE | −0.002 * | 0.001 | 0.002 * | 0.001 | 0.001 | 0.001 |
| GEN | −0.017 | 0.022 | 0.037 | 0.024 | −0.016 | 0.023 |
| EDU | −0.009 ** | 0.004 | 0.000 | 0.005 | 0.006 | 0.004 |
| ETHN | 0.096 *** | 0.031 | −0.073 ** | 0.034 | −0.046 | 0.032 |
| EXPE | 0.000 | 0.004 | −0.002 | 0.004 | −0.001 | 0.004 |
| FARM | −0.075 *** | 0.016 | 0.036 ** | 0.016 | 0.036 ** | 0.016 |
| LOC | −0.036 | 0.031 | −0.071 | 0.034 | 0.012 | 0.031 |
| RMSE | 0.127 | 0.149 | 0.140 | |||
| R-sq | 0.247 | 0.393 | 0.392 | |||
| Chi-square | 56.88 *** | 94.25 *** | 95.39 *** | |||
Note: *, **, and *** indicates statistically significant at 0.10, 0.05, and 0.01 level respectively.
© 2019 by the authors. Licensee MDPI, Basel, Switzerland. This article is an open access article distributed under the terms and conditions of the Creative Commons Attribution (CC BY) license (http://creativecommons.org/licenses/by/4.0/).
Share and Cite
MDPI and ACS Style
Hung Anh, N.; Bokelmann, W. Determinants of Smallholders’ Market Preferences: The Case of Sustainable Certified Coffee Farmers in Vietnam. Sustainability 2019, 11, 2897. https://doi.org/10.3390/su11102897
AMA Style
Hung Anh N, Bokelmann W. Determinants of Smallholders’ Market Preferences: The Case of Sustainable Certified Coffee Farmers in Vietnam. Sustainability. 2019; 11(10):2897. https://doi.org/10.3390/su11102897
Chicago/Turabian StyleHung Anh, Nguyen, and Wolfgang Bokelmann. 2019. "Determinants of Smallholders’ Market Preferences: The Case of Sustainable Certified Coffee Farmers in Vietnam" Sustainability 11, no. 10: 2897. https://doi.org/10.3390/su11102897
Note that from the first issue of 2016, this journal uses article numbers instead of page numbers. See further details here.