Electric Charging Demand Location Model—A User- and Destination-Based Locating Approach for Electric Vehicle Charging Stations


1
Institute for Applied Informatics, Deggendorf Institute of Technology, Grafenauer Straße 22, 94078 Freyung, Germany
2
Interfaculty Department of Geoinformatics Z_GIS, University of Salzburg, Schillerstraße 50, 5020 Salzburg, Austria
*
Author to whom correspondence should be addressed.
Sustainability 2019, 11(8), 2301; https://doi.org/10.3390/su11082301
Submission received: 21 February 2019
/
Revised: 11 April 2019
/
Accepted: 11 April 2019
/
Published: 17 April 2019
(This article belongs to the Special Issue Sustainable Transport: Transport, Environment, and Development)
Abstract
:In recent years, with the increased focus on climate protection, electric vehicles (EVs) have become a relevant alternative to conventional motorized vehicles. Even though the market share of EVs is still comparatively low, there are ongoing considerations for integrating EVs in transportation systems. Along with pushing EV sales numbers, the installation of charging infrastructure is necessary. This paper presents a user- and destination-based approach for locating charging stations (CSs) for EVs—the electric charging demand location (ECDL) model. With regard to the daily activities of potential EV users, potential positions for CSs are derived on a micro-location level in public and semipublic spaces using geographic information systems (GIS). Depending on the vehicle users’ dwell times and visiting frequencies at potential points of interest (POIs), the charging demand at such locations is calculated. The model is mainly based on a survey analyzing the average time spent per daily activity, regional data about driver and vehicle ownership numbers, and the georeferenced localization of regularly visited POIs. Optimal sites for parking and charging EVs within the POIs neighborhood are selected based on walking distance calculations, including spatial neighborhood effects, such as the density of POIs. In a case study in southeastern Germany, the model identifies concrete places with the highest overall demand for CSs, resulting in an extensive coverage of the electric energy demand while considering as many destinations within the acceptable walking distance threshold as possible.
1. Introduction
As a political strategy for fighting climate change by reducing CO2 emissions, national governments in the EU promote electric vehicles (EVs), along with the required charging infrastructure, by providing a range of subsidies for EV users. Although registered EVs still account for less than one percent of the total number of vehicles in most countries, several governments have declared their intention to entirely ban conventionally fueled cars by 2030, 2040, or 2050 [1]. While Germany is attempting to boost the e-mobility market penetration by subsidizing EV purchases and the United Kingdom offers grants to support the wider use of low emission vehicles, northern countries like Norway exempt EV owners from several tax obligations. In Norway and the Netherlands, about 11,000 and 20,000 new EVs, respectively, were registered from 2011 to 2013. These are the highest EV sales in both absolute and relative numbers in Europe. Additionally, countries like Germany or France have recorded a yearly growth rate of around 50% in the last few years [2,3]. From the view of sustainability, EVs can only be the ultimate goal of driving systems when it becomes possible that EVs actually cause less carbon dioxide than conventional vehicles, including the entire life cycle from manufacturing process to charging [4]. The local electricity for charging as well as battery production must at least get greener for sustainability reasons. Regardless of whether EVs will be an interim solution or the ultimate goal in times of mobility changes, the transportation infrastructure has to be transformed in the most sustainable way as possible, not only from the political point of view, for instance, in terms of governmental subsidies, but also from the standpoint of infrastructure and energy suppliers, automotive manufacturers (industry development), and users (awareness).
According to surveys [5], besides the high costs and range anxiety in terms of how far the vehicle will drive with one charge, one barrier for car buyers to purchase an EV is the poorly developed charging infrastructure for EVs. At the same time, the small number of EVs and the thin spatial density of EV owners result in a low utilization rate of charging stations (CSs). This low utilization rate means that most CSs are not profitable, which hinders significant growth in the spread of CSs [6]. This chicken and egg situation begs the question of which aspect—the development of charging infrastructure or the number of EVs—requires the most effort at this early stage of market development. Regardless of whether CSs play the main role in promoting electrically powered mobility or not, it is indispensable to determine convenient locations for CS, especially in public and semipublic areas [1]. With CSs situated at popular public places, infrastructure capacities for slow-charging can be increased profitably [7]. Sensible CS positioning adds to the convenience of driving an EV and reduces range anxiety, which may lead to a higher user frequency of CSs [8]. As a consequence, the CS infrastructure may provide the groundwork for increasing the market share of EV in the mobility sector.
In the present paper, the electric charging demand location (ECDL) model for identifying optimal CS locations based on an EV charging demand calculation is introduced. The model pursues the approach of including EV users’ behaviors, their dwell times at destinations, and the optimal positioning of CSs by considering minimal walking distances for the drivers. First, a brief overview of current research and the predominantly used modeling approaches in the domain of CS localization is given. Subsequently, the ECDL model is explained in theory, and the calculation process in geographic information systems (GIS) is demonstrated. To prove the model’s applicability, a case study in the southeast of Bavaria, Germany, is described. Next, the benefits of the ECDL model as well as its limitations are discussed. Finally, its transferability and the possibility for extension in future work are outlined.
2. State of the Art of CS Location Models
Several research projects have aimed to identifying ideal places for situating CSs using different emphases and targets, e.g., using optimization algorithms [9,10,11] or more spatially based, geostatistical approaches [12,13]. The minimization of trip length or travel times [14,15] is a widely used target criterion for CS location models. Another target is to locate CSs at hotspots of charging demand following population distributions or driving path densities [16,17,18]. A microscale analysis of parking and walking from CS to destinations is also a proposed approach [19]. Several studies have targeted more than one criterion by considering user-, destination-, and route-oriented approaches in a combined model [15,20,21].
Pagany et al. [22] gave a broad and systematic overview of publications in the domain of CS localization for EVs. The review categorized 661 studies based on their structure (user, destination, or route orientation), overarching objectives (like demand density, trip length, or queuing), and data sources (statistics, measured travel data, simulations or surveys) and discussed the advantages and limitations of the applied data and methods. Some studies, for instance, Ahn and Yeo [23], Tu et al. [15], and Wagner et al. [18], are based on real data from existing CSs or travel data from tracked EVs. However, the number of EV fleets is still at a low level [1], making the validity of results and overall transferability possibly uncertain. Other studies have evaluated tracking data from conventional, fossil-fueled vehicles for the analysis of optimal charging locations while assuming that driving behavior and trajectories remain the same when using EVs [11,12,24]. For both cases of movement data, the limited knowledge on potential driving behavior, which may change in the face of higher EV market penetration and further development of CS infrastructure, is a constraining factor.
Other models are based on statistics, such as census data about family status, income, and number of vehicles per inhabitant [17,25], resulting in lower spatial resolutions as they constitute total values for a whole district (e.g., number of vehicles per household). Questionnaire-based surveys complement the list of data sources for CS location analysis by assessing the activities, opinions, and expectations of potential participants [10,26], also assuming that travel paths and driver behaviors remain the same in spite of changes in traffic technology.
In some other studies with a focus on geospatial process integration, aspects such as interconnectivity of regional patches or the neighborhood of several destination points are observed [15,18,24]. Namdeo et al. applied a multidimensional spatial analysis that included socioeconomic factors and combined commuting, vehicle, and household numbers using different GIS layers [17]. A spatial plot showed the outputs from weighted overlay statistics for public charging locations. Efthymiou et al. [25], Gkatzoflias et al. [27], and Wirges [13] used similar approaches by transferring statistical data into the spatial dimension to identify areas with high charging demand in GIS. Brost et al. [28] combined traffic modeling with aspects such as public transport accessibility to define CS sites. Andrenacci et al. [12] adopted a distance-based approach by calculating the charging demand for EVs from tracking data.
Approaches like these have the advantage of being easily transferable to municipal planning processes and allowing zoomed-in spatial siting for CSs. Moreover, identified CSs could also be used for alternative recharging of, for instance, electric bikes or speedelecs as electric light vehicles, the manufacture of which emits less CO2.
Pagany et al. [22] concluded that a more integrated process should be the aim of further research on CS localization. Based on this, our study pursues a more holistic CS localization model, including EV drivers’ dwelling times and destinations as well as the points of interest (POIs) as the model’s key aspects. The crucial combination is the spatial dispersion of POIs, the temporal duration of EV users’ dwelling at the POIs, the minimum distances between POIs, and the minimum walking distance between a parking or, rather, a charging point and the POI. This ensures that the model provides a more efficient and sustainable approach for a whole region as the planning is not only for a single site but also simultaneously considers neighborhood relations, preventing an oversupply through overlapping of planning in the same area. (Only the CS development without the linkage to energy supply per se is part of this model presentation).
3. Materials and Methods
In this section, the ECDL model is first explained, i.e., the demand calculation for each destination point within the case study area. Next, spatial modeling is carried out by importing data from the previous step into the GIS environment and calculating EV users’ minimum walking distance between destinations and the nearest CS. Afterward, a case study undertaken in a region in southeastern Germany offers results for the scenario of a 50% EV market penetration and visualizes the spatial distribution of CSs in a zoomed-in map section.
3.1. Data Analysis
The general idea of the ECDL model is to analyze potential charging locations in public and semipublic areas where people usually drive to. (The model focuses mainly on short-distance driving, which is typical for inhabitants or tourists moving within a specific region, and less on long, supraregional trips aiming for fast charging and high loading rates.) The end points of their travel paths are the destinations where they spend a certain amount of time depending on their daily activities. The aim is to place CSs within the drivers’ daily activity environment in such a way that they have the opportunity to charge their EVs while staying at the destination points. The proximity to POIs, such as public institutions or supermarkets, is a prerequisite as EV drivers need to park and charge within walkable distance to the destinations.
3.1.1. Destinations
POIs from Open Street Map (OSM) are used as basic data for the destination points. The dataset is divided into various classes (shopping, leisure, etc.) and subclasses (supermarket, bakery, clothes shop, etc.). For the demand analysis of charging near a destination, the classes are grouped into four destination categories: living, working, shopping, and recreation (see Table 1). In the present work, private households have been excluded from the destination category “living” because private charging is possible at home and is often used in single-family houses, which are common in rural regions, such as the case study area (see Section 4) [29,30]. However, public and semipublic CS sites have a high relevance for this category in urban areas, where multifamily houses and apartment blocks are predominant. Touristic accommodations are categorized into the group “living” as it is assumed that the duration of stays at accommodations, and thus the time for charging, are similar to staying at home (i.e., overnight).
3.1.2. User Groups and Their Dwell Time
The destination categorization is done depending on the dwell time of people visiting the place. The dwell time is determined according to a comprehensive survey about the personal time spending concept, published by the German Federal Statistical Office [31] for 2012 and 2013. With a quota sample, individuals in over 5000 households all over Germany were asked to document their daily time spending in a diary. On the basis of nearly 34,000 diary days, average values for the different forms of time spending were assessed. As people have heterogeneous ways of life, they not only drive in different travel patterns but also stay at different location types for various lengths of time. Consequently, the charging demand at a specific location depends on the destination type and on the user group. A certain lifestyle may be characterized by family status, income, or age, as pointed out by [16], [26], and [32]. Based on these studies, the essential criterion of age is used to determine user groups. Hence, the inhabitants of a region are classified according to their age, with the time spending concept used for calculating the dwell time at the POI in daily averages.
Four user groups are defined (see Table 2) as they differ in their activities and driving behaviors. For example, the silver agers use their time for activities in the category “living” and less for working as most people in this group are retired. The ECDL method does not focus on travel time but on the time sequences when the vehicle is stationary at different locations, which determine the average charging time per place. Combining user and destination orientation, the various activities are assigned to one of the four POI categories depending on the time spent. Personal duties, such as basic needs (sleeping, washing, and dressing), housekeeping (without grocery shopping), and family support are included in the activities that take place in the categorized places for “living”. Working time is the time spent for full and part-time jobs, qualification, and education at schools or universities. Shopping time comprises all activities in supermarkets and clothes shops but also other services like visits to official agencies or medical services (doctors or pharmacies). Recreational time includes social life and meetings, sports, hobbies, and volunteer work. The activity time is an average of all persons (practicing and non-practicing).
With regard to the different user groups and their daily activities, which are distributed over time and space, the CS demand at each location within an activity area is predetermined. Census statistics of the respective municipality deliver data about the number of inhabitants belonging to one defined user group, the vehicle share per person, and tourist numbers.
3.2. Electric Demand Analysis
The POI dataset and statistical characteristics comprise information for the demand calculation of a CS. Therefore, each POI is weighted according to the share of users of one user group in the total number of inhabitants, the share of vehicle owners, and the share of potential EVs (see Equation (1)). For touristic accommodations, the number of tourist vehicles is used as specific regional data input. In this work, the number is based on the average value of 1.9 persons per vehicle for recreational trips in Germany [33]. The more frequently and the longer a user group stays at one location, and the higher the share of vehicles in that group, the higher is the electric demand for a CS at the location.
The driving distance of around 43 km per day and person on German average [33] is converted into the electric energy needed for the daily travel. Afterward, the demand of energy is distributed across the different destinations. On the one hand, this division depends on the relative share of the total dwell time of the vehicles near the destination. On the other hand, the demand is weighted equally over the distribution of all POIs in one category as there was no detailed information on utilization rates or capacities (number of visitors, employees) available. Thus, for each POI, the yearly electric demand is calculated by extrapolating daily energy consumption for one year. The objective is to calculate the charging demand under the consideration of the following influencing parameters:
where Eg,p is the average electric demand for charging EVs per year at one POI of the type p for the user group g. The charging demand depends on the electric energy demand K [kWh] needed by one EV for the driving distance extrapolated for one year. The energy demand K is multiplied with the share of potential EVs Fg (penetration rate in %) in total vehicles for the user group g, the share of vehicle owners Og with the number of inhabitants Ig belonging to the user group g to consider the whole electric demand for a user group g at a destination of type p with regard to the number of EVs derived from the current number of vehicles in a specific region. Additionally, variable Dg,p contains the average dwell time (% of dwell time at POI of type p in relation to total time use) of a user group g at a destination point of type p. In the last step, the charging demand for every single destination is calculated. This depends on the amount Ap of all POIs of the type p within the investigation area. The charging sum is divided by the number of Ap, which leads to an equal distribution within the same destination type in the region. By multiplying all the mentioned factors, the charging demand at each POI for each user group is calculated and the groups’ demand summed up to a total demand value at each POI as the basis for the subsequent spatial modeling.
3.3. Walking Distance Assumptions
In the next step, different walking distances between the parking spot or charging point and the destinations are defined according to the location type and user group. Other CS-locating studies have proposed a uniform walking distance, e.g., for a 1 × 1 mile grid cell [7] or assumed desirable and acceptable walking distances between 400 and 600 m [16]. Studies about walking behavior [34,35] have determined that distances up to 400 to 800 m are seen as being justified. Another frequently mentioned factor is the walking time. A walking duration of 10 to 15 min is considered acceptable [36,37], which is comparable to the abovementioned length specifications. As the lifestyle patterns and walking behaviors may be similar in all industrialized countries, the maximum acceptable walking distance between the parking spot for charging and the destinations is defined based on these studies, which were mainly conducted in medium-sized cities in industrialized research areas. However, lower distances are assumed according to user and destination groups (see Table 3). Walking distances for the silver agers are assumed to be shorter than for the other groups for health and mobility reasons. A relatively short walking distance of 100 m is chosen for the POI type “shopping” because people usually carry bags between shopping places and their vehicle. It is assumed that this distance is also acceptable for downtown shopping, even if the acceptable distance for this activity is usually longer (see conclusions).
3.4. Spatial Modeling
3.4.1. Overlay Analysis of Demand-Weighted Walking Areas
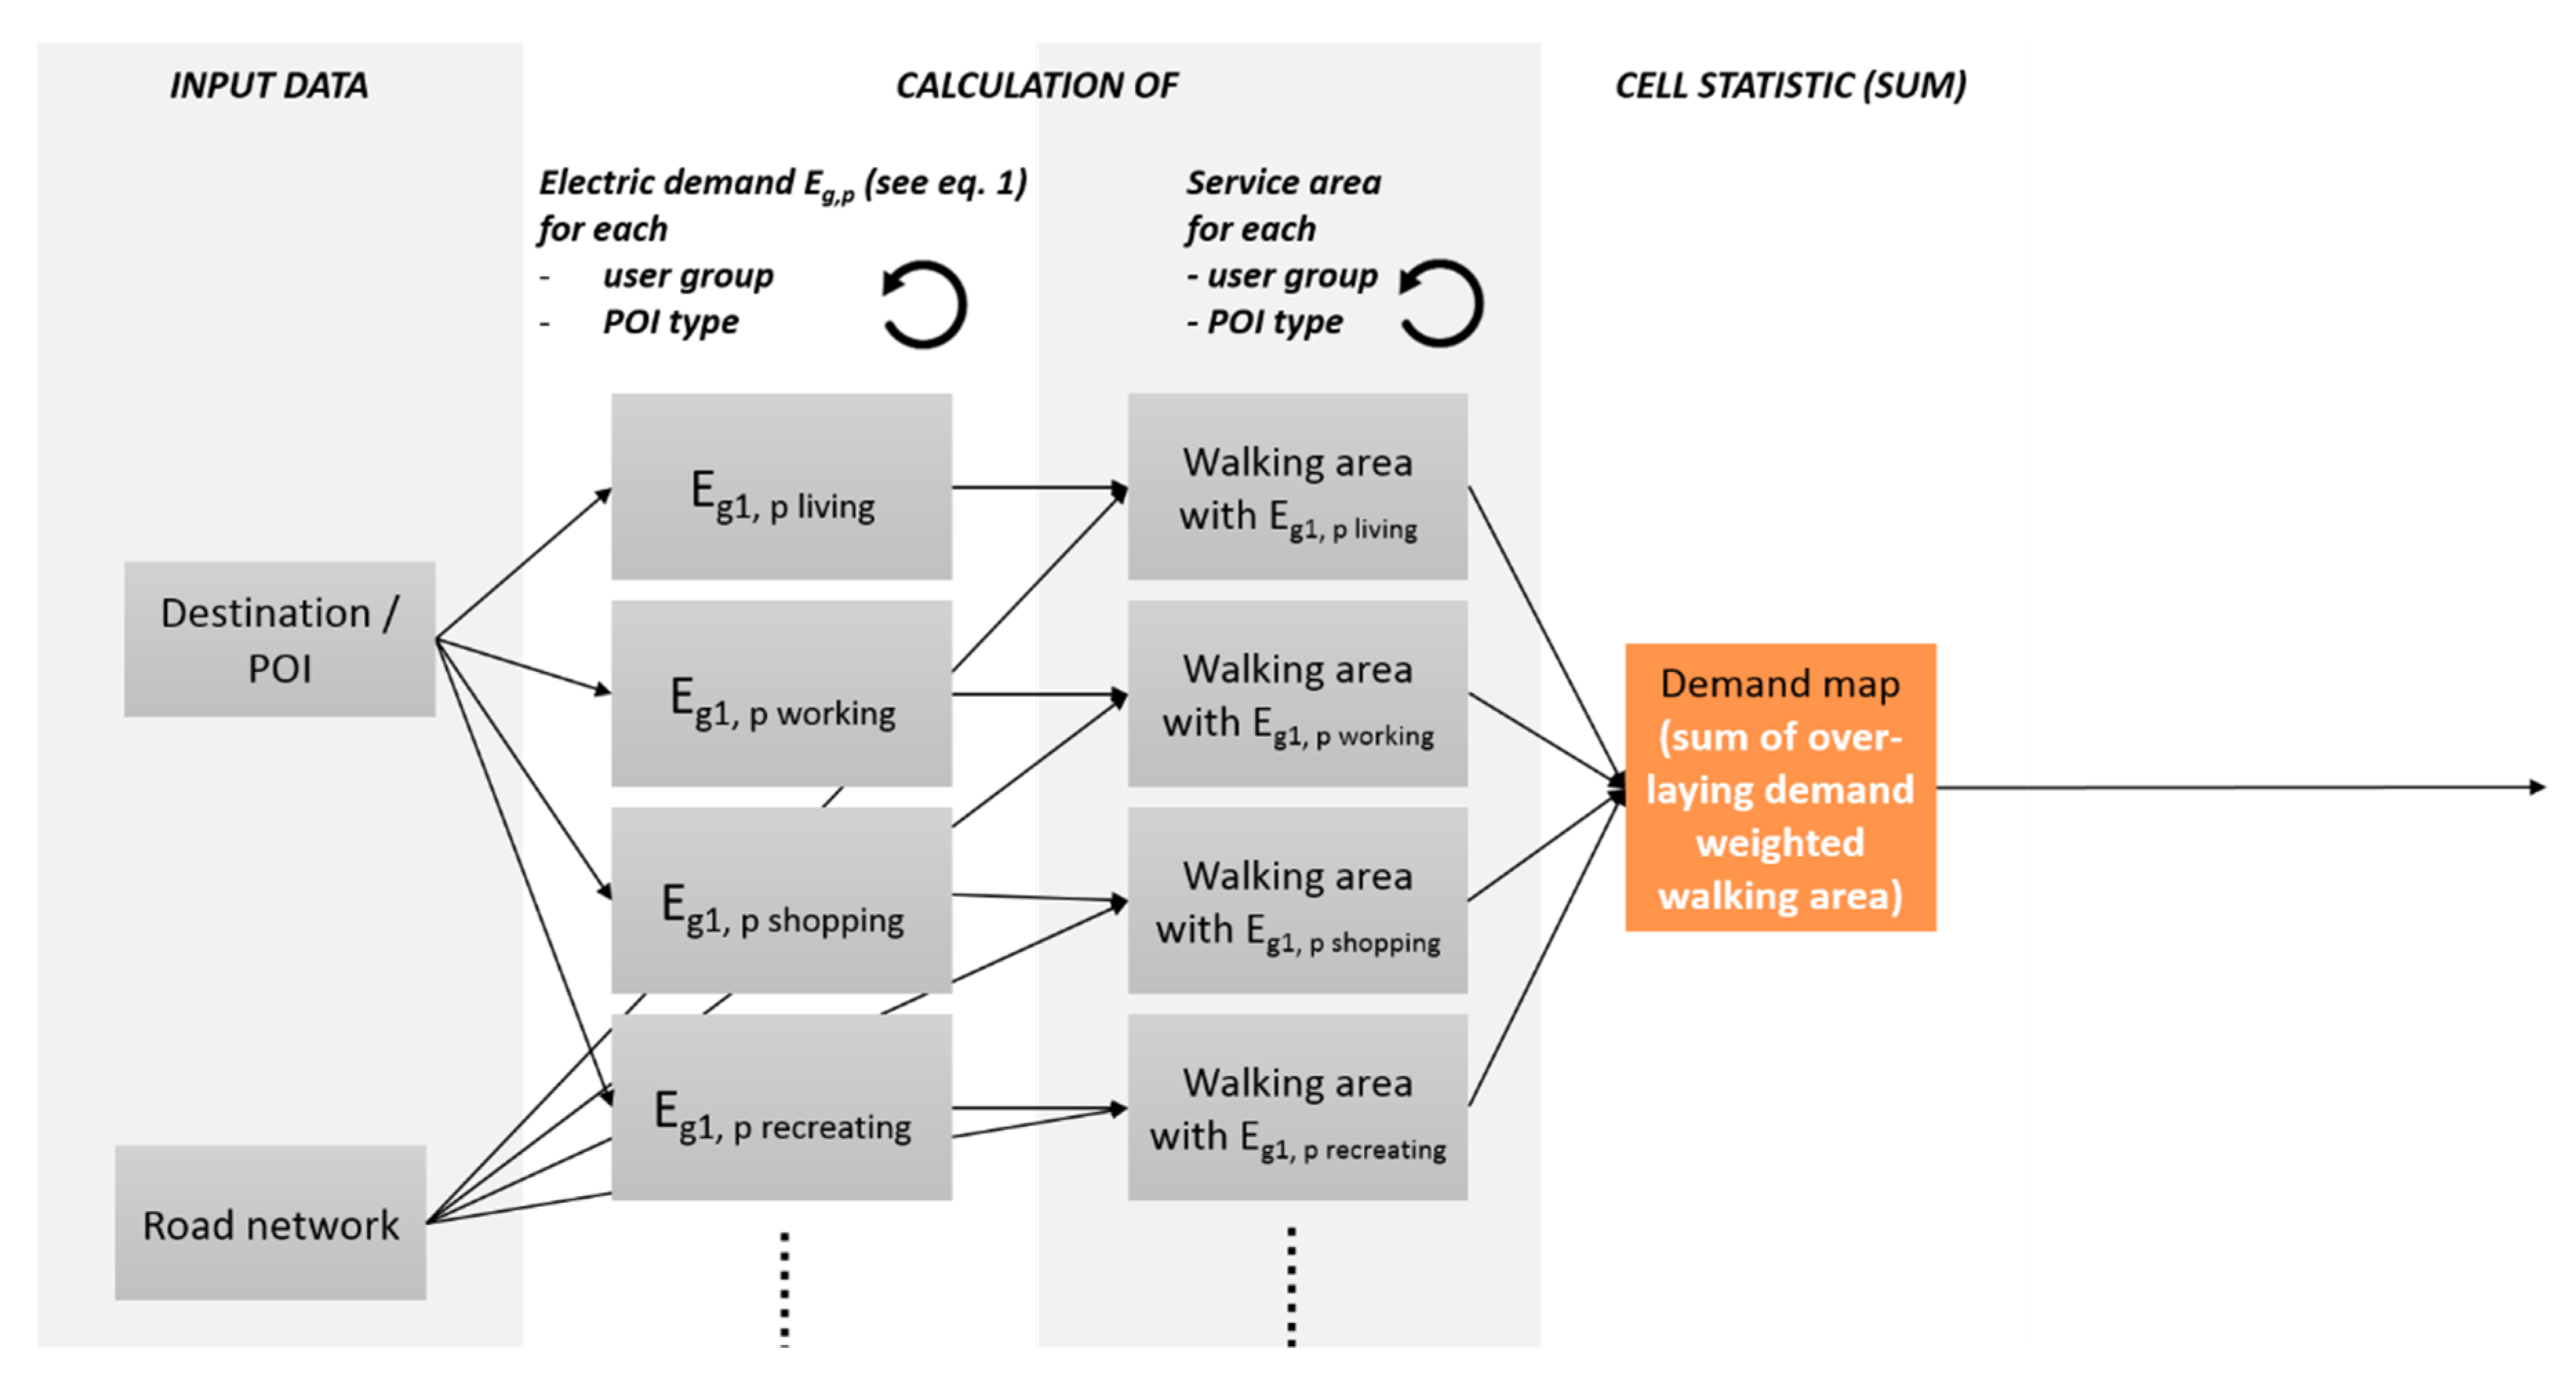
The calculated electric demand of each POI (Eg,p) is transferred to a GIS to model the CS location analysis with spatial reference (Figure 1). A service area along the road network is calculated for each destination based on its type and the maximum walking distance of the respective user group. The service area defines the area in which EVs can be parked and charged while the driver walks to and dwells at the destination. The service areas are derived from the OSM road network data as it is assumed that people normally follow the street or path and do not cross a private, unpaved area. The demand in the POI area is assigned to the whole service area within walking distance, originating from the POI. Within the relevant walking distances, the overlaying charging demands of the different user groups are summed up into the demand map (sum of overlaying demand-weighted area). Hence, sections with high charging demand can be selected.
3.4.2. Selection Process of CS Locations
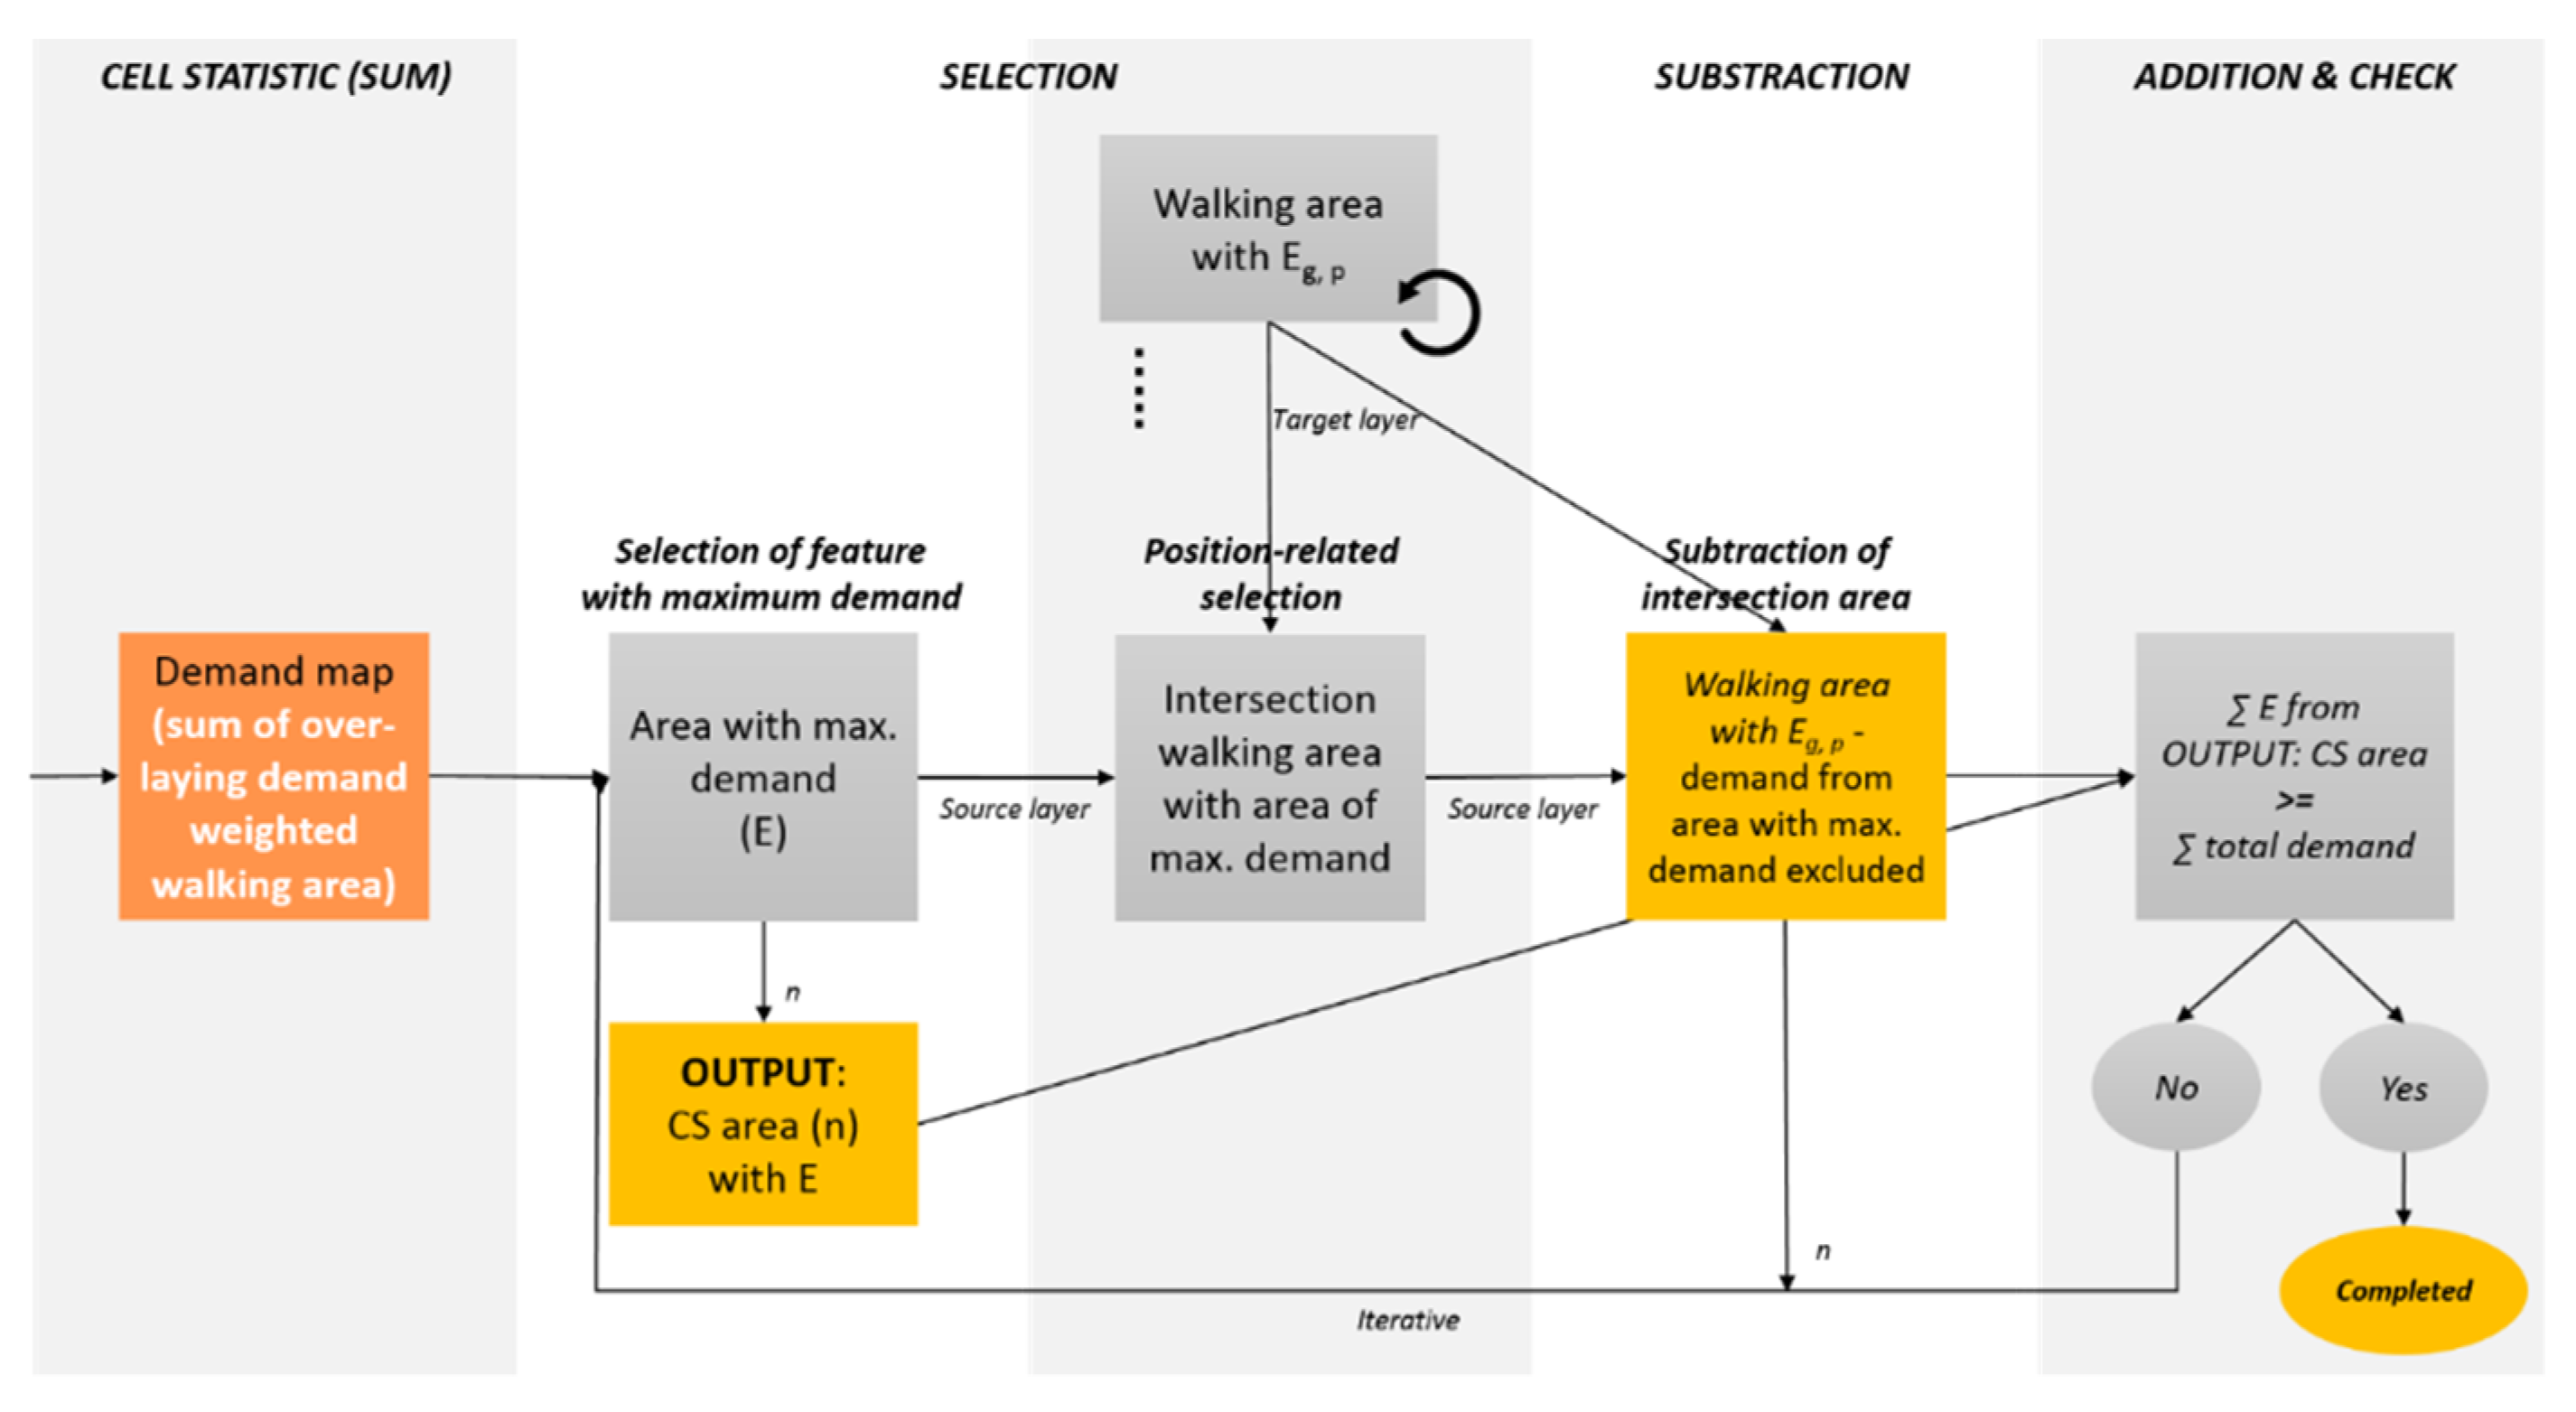
Next, the section of maximum demand can be selected as the location of the first CS (CS 1). The further selection of CS areas requires an iterative process (Figure 2). A position-related selection of all walking areas intersecting the maximum demand area (area for CS 1) from the demand-weighted walking areas is carried out. The selected features are subtracted from the demand-weighted walking areas as these POIs with their walking areas are already supplied by CS 1. The feature with the maximum value of remaining demand areas is selected as the second CS. Then, the selection process is run through again until the energy sum of selected maximum demand areas covers the total electric energy demand of the area. Hence, it is also possible to determine the maximum number of CSs or the percentage of demand coverage (i.e., top 10% of energy demand) according to the planning conditions or financial limitations.
3.4.3. Alternative Considerations of Walking Distance Optimization
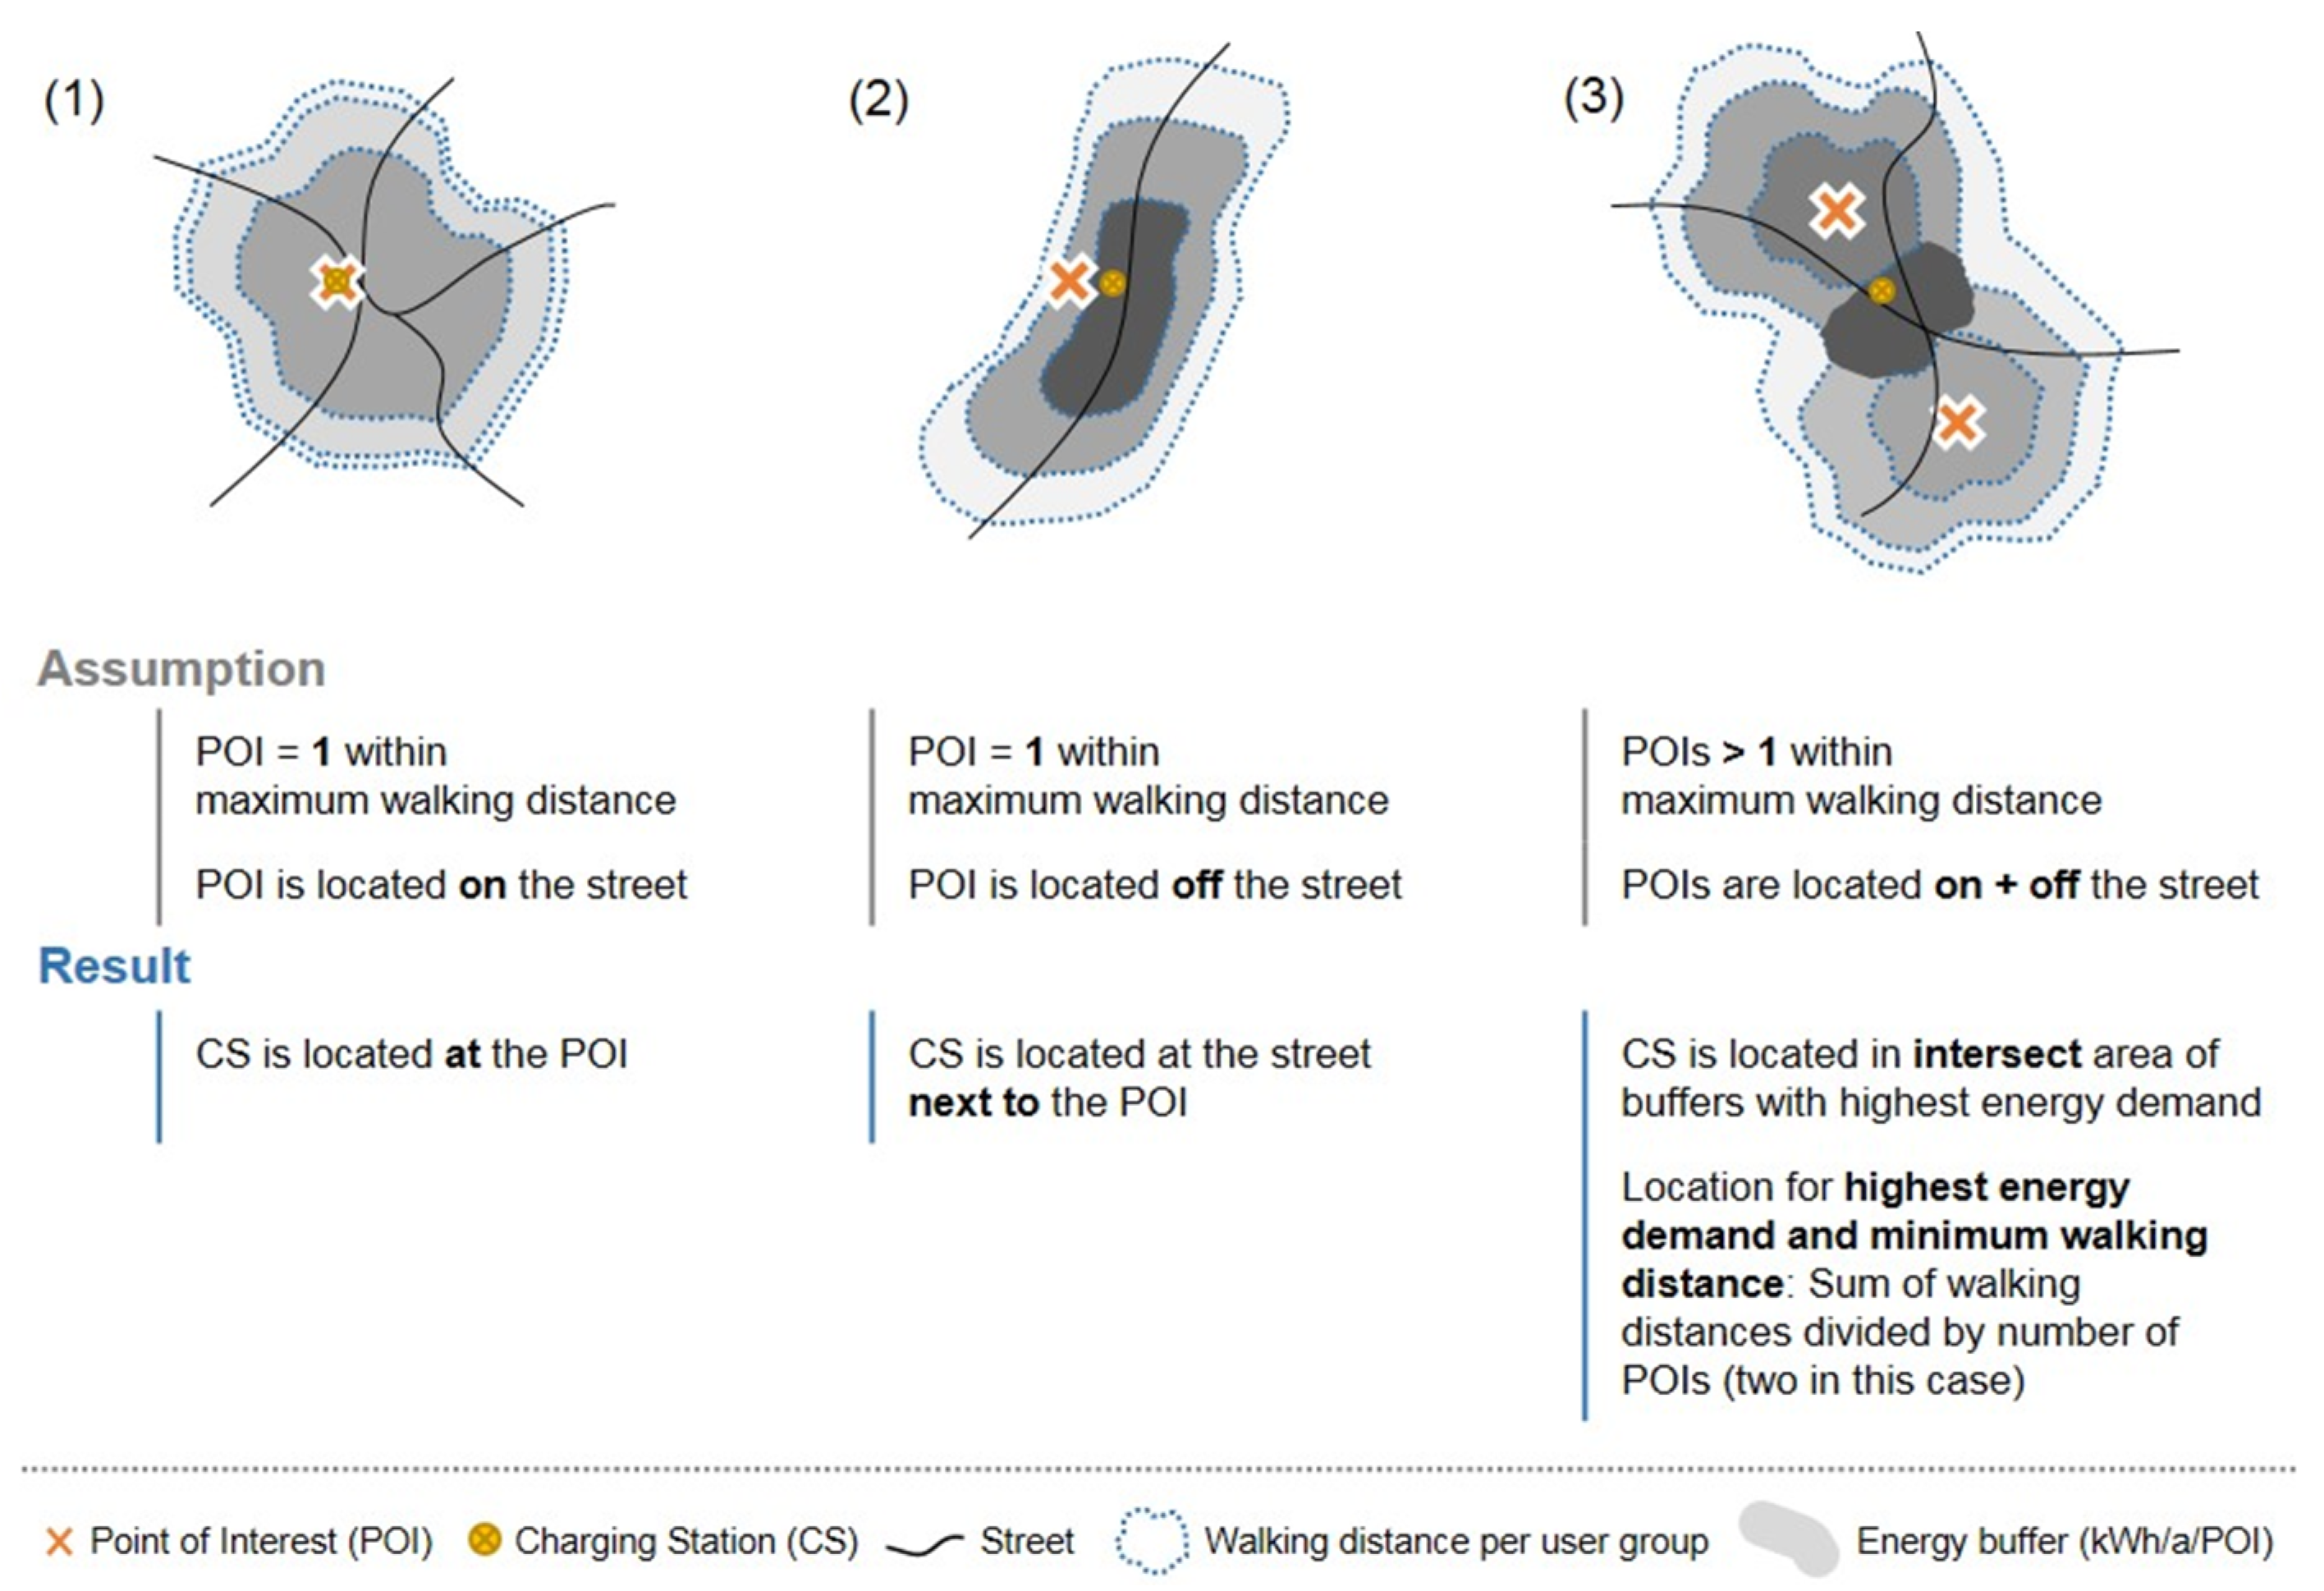
Alternative considerations for optimizing the walking distance within the sections with high charging demands are explained in this section, even when the optimization is not included in the case study. With the optimization process, a specific place for a CS can be selected within these demand hot spots, as Figure 3 shows. For each POI, service areas with intervals of 25 m and the maximum walking distance corresponding to Table 3 are calculated. In order to be added up, the polygons are converted into a grid with a resolution of 5 m and the attribute of the distance value assigned to the destination point. For the determination of the optimized walking distance, the summed-up walking distance is divided by the number of POIs taken into account. If there is only one destination located within the maximum walking distance, the average walking distance is equal to the absolute walking distance, and the optimal CS location is as close as possible to the POI. However, if two or more POIs are closer than the maximum upper limit, the totalized raster provides the absolute sum of the distances to all POIs. Then, the average walking distance is again calculated by dividing the number of POIs within the service areas. The result is the average distance to all nearby POIs. Finally, the CS is located inside the region with the highest demand and at the location where the average walking distance to the POIs is minimized. This very zoomed-in modeling scale allows a detailed spatial analysis with an output of optimized CS locations.
4. Case Study and Results
The applicability of the ECDL model is demonstrated in the E-WALD project area covering 7200 km2 in the southeast of Germany, including eight administrative districts (NUTS-3): Cham, Deggendorf, Freyung-Grafenau, Passau, city of Passau, Regen, city of Straubing, and Straubing-Bogen. Although 150 sites for charging have already been set up as part of the E-WALD project, the existing CS are not considered in this case study as the sites are mostly in the centers of the municipalities and not necessarily positioned at high demand places.
4.1. Data and Case Study Area
The case study is based on an area with a total population of nearly 800,000. Among them, about 600,000 are potential EV drivers, which are divided into the four user groups: 102,000 young agers, 143,000 mid agers, 224,000 best agers, 153,000 silver agers (for these and further statistic parameters about the study area, see Table 4). The case study area has 2.7 million tourist stays per year (average stay = 4 days/year and 1.9 persons per vehicle); subsequently, 15,650 tourist vehicles are considered present on any one day. In total, 6720 POIs are considered, divided into four POI types, for which the electric charging demand per user group and the appropriate walking distance are calculated. A penetration rate of 50% is assumed, meaning that 224,500 vehicles are assumed as potential EVs.
4.2. Results of CS Location Analysis
With the model, the electric demand in kWh for each POI type combined with user groups and walking distances is calculated. The demand is analyzed for each district considering the specific population, vehicle, tourist, and POI numbers. Table 5 shows the total numbers for the complete case study area. In total, an electric demand of 85.76 GWh is calculated.
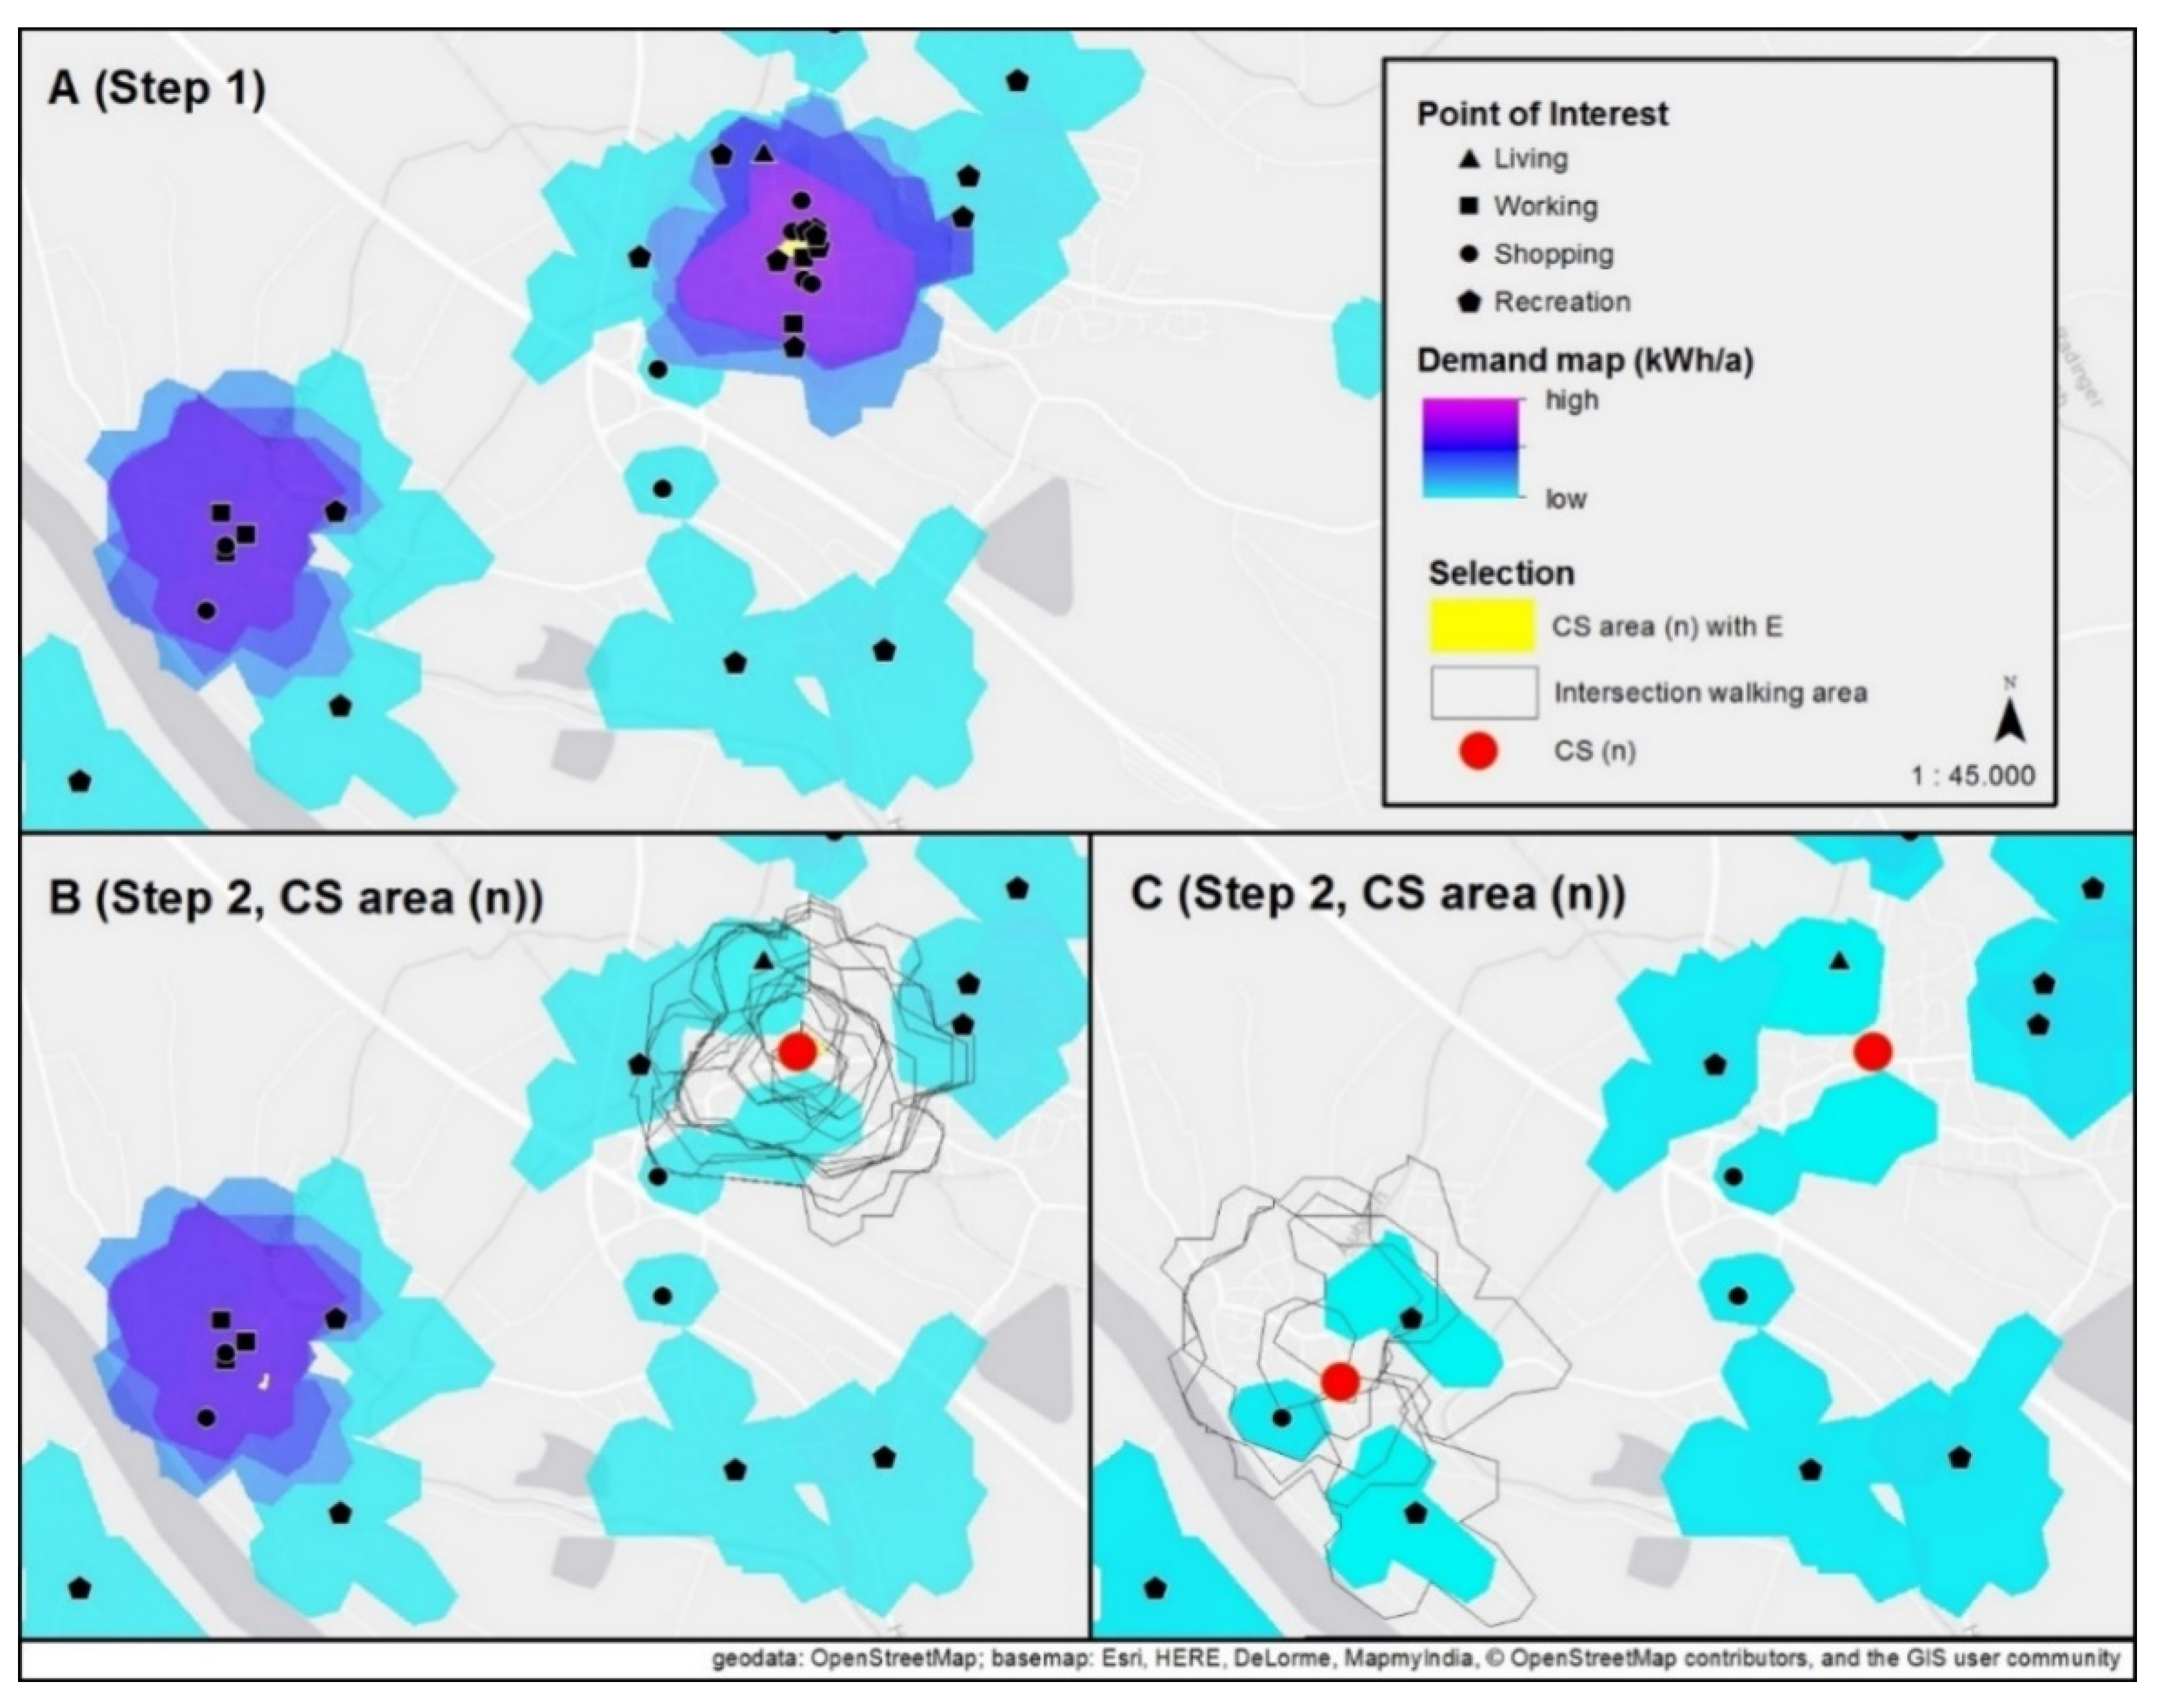
Figure 4 shows the results of the ECDL modeling process and the identified CS positions in a sample area of the case study. The optimum location is identified as appropriate for CS installation due to the addition of high demand and short walking distances. The charging demand is graded in color (demand map (kWh/a)).
The CS-locating process assumes an EV penetration rate of 50%, resulting in full coverage of electric energy supply. In the sample section shown in Figure 4, the first selected CS area (colored yellow) covers a demand of 374,000 kWh, which is 0.44% of the total electric demand for EVs. A potential CS position (colored red) is located within the CS area. In the ongoing iterative calculations, POIs lying within walking distance of CS 1 are no longer included in the maximum demand selection. This can be observed from the reduced energy values in Figure 4 (maps A–C). In the second model run, CS area 2 is identified, covering an energy demand of 302,000 kWh. Due to the EV market share, the level of demand can be calculated arbitrarily in the model. An economic valuation can determine the profitability of the potential CS sites under the consideration of the calculated charging demand.
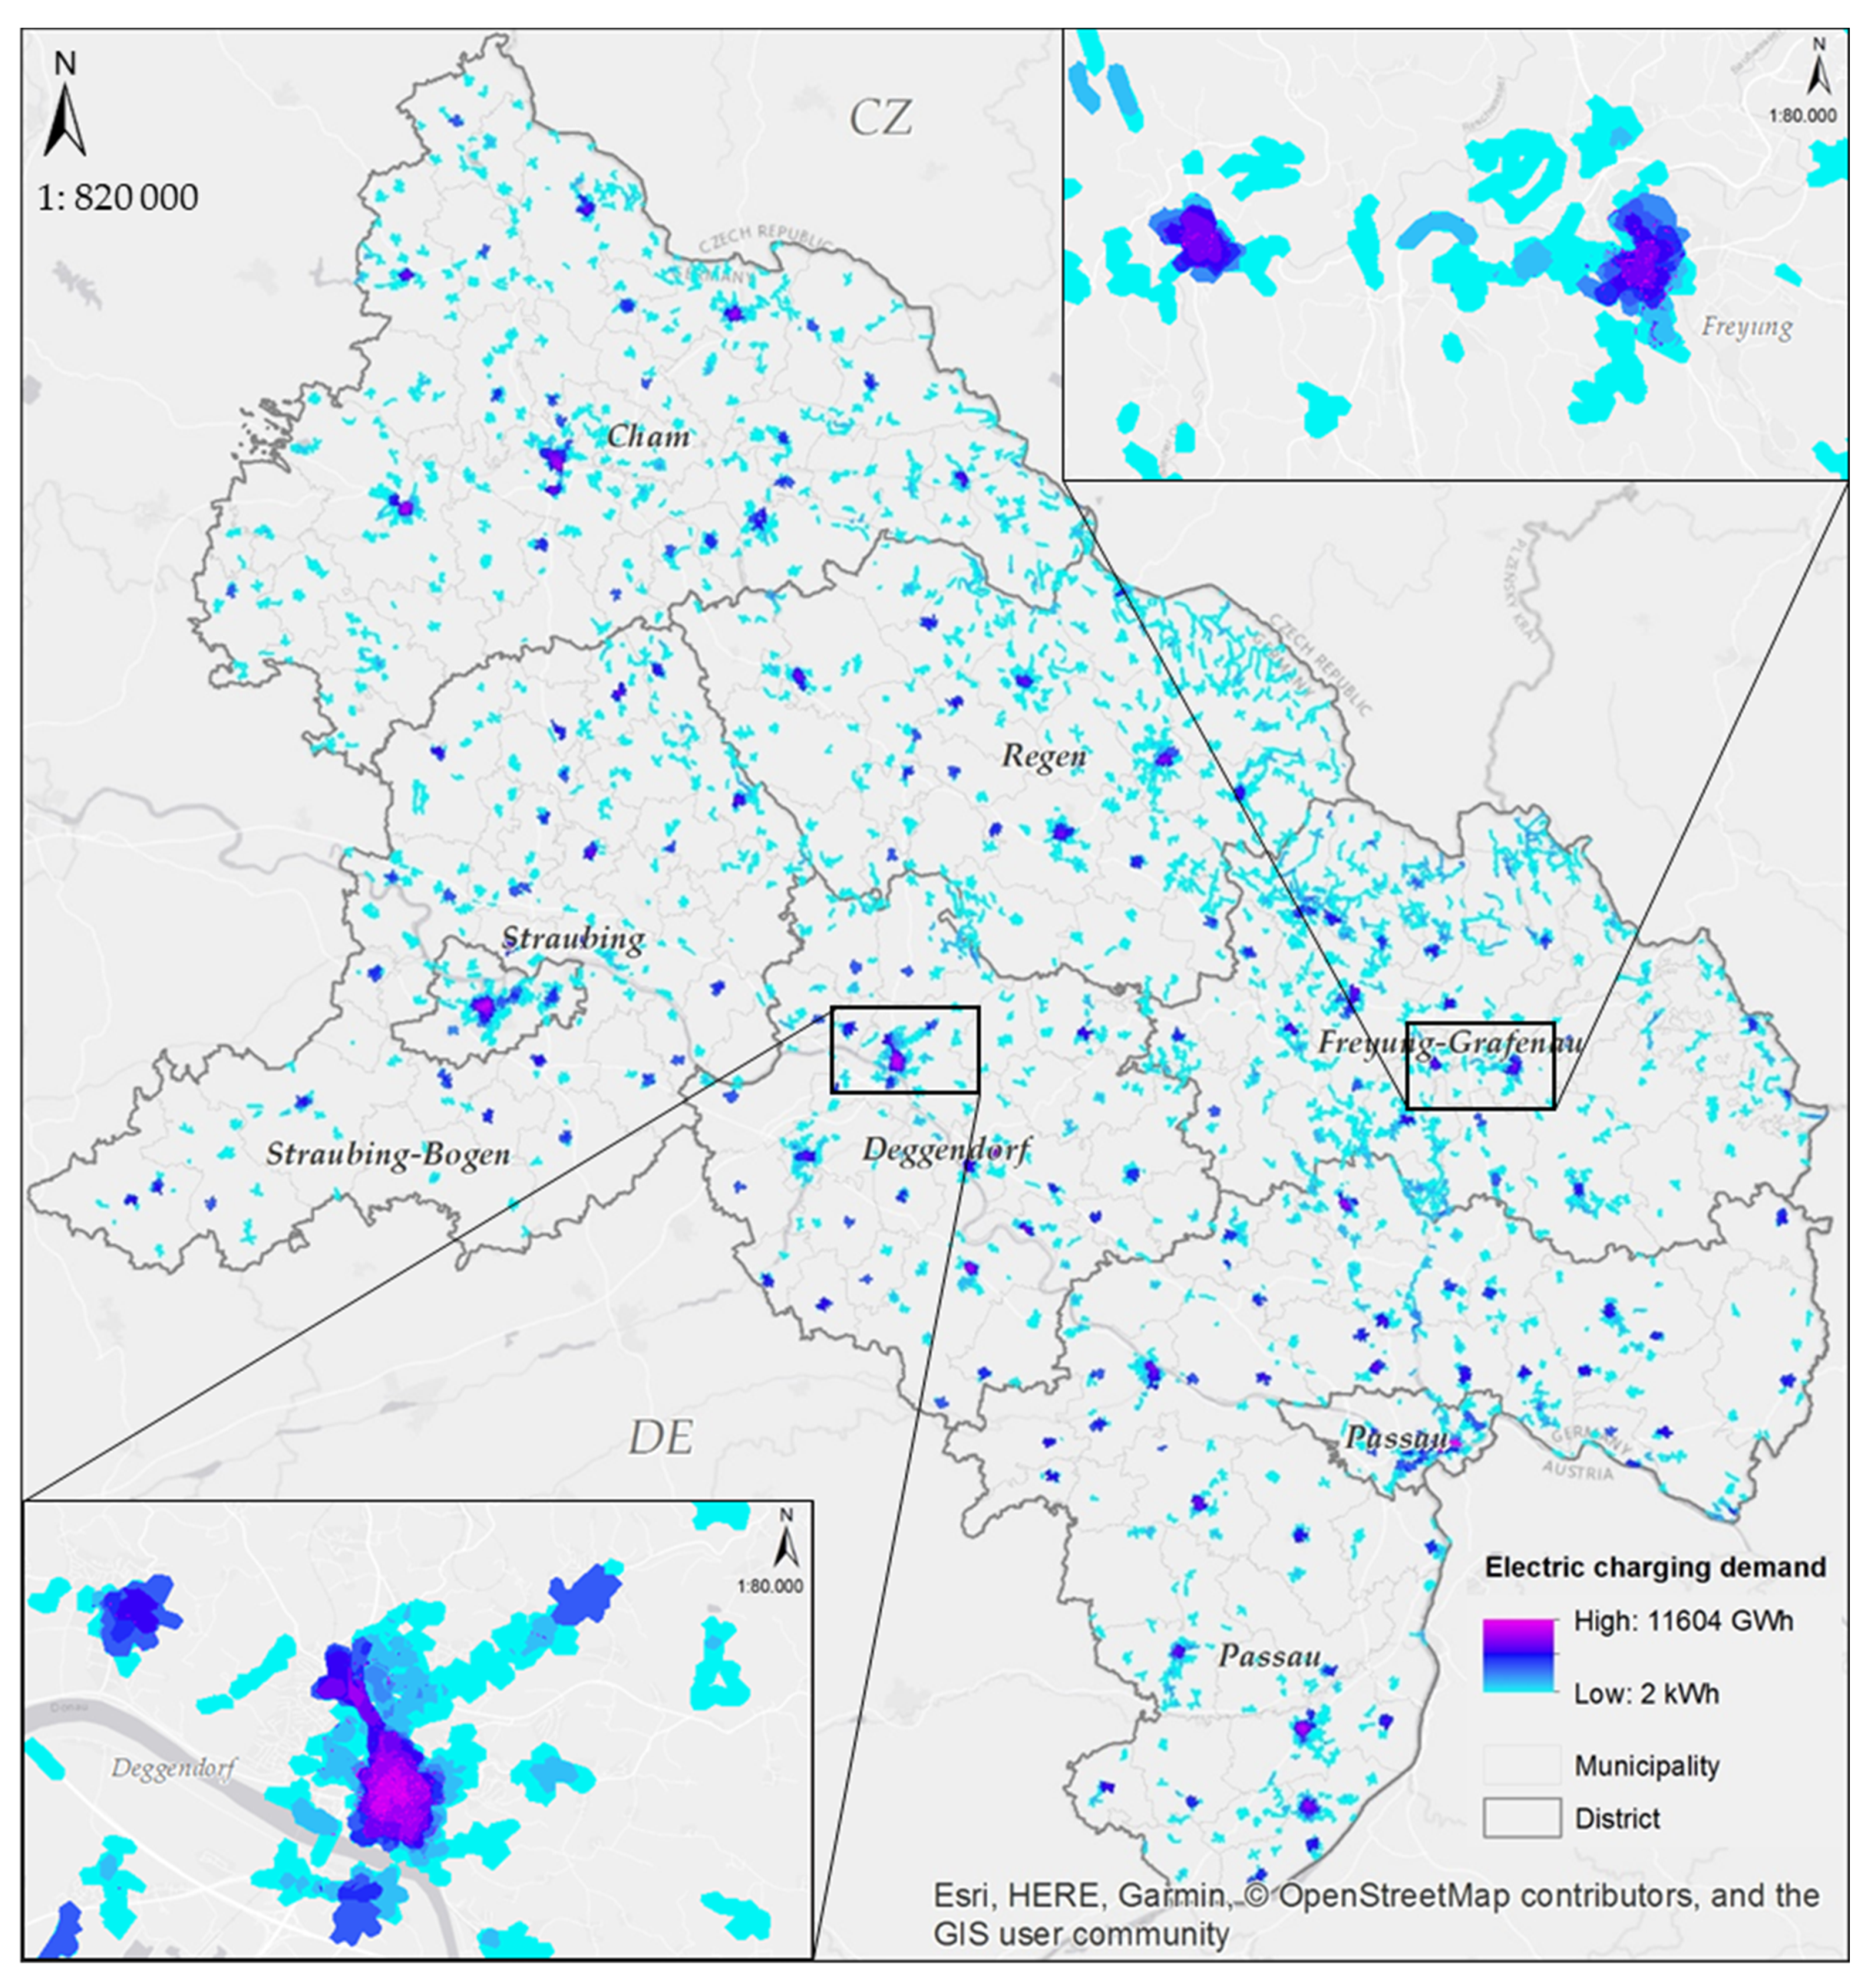
In Figure 5, the electric charging demand over the total E-WALD case study area is visualized, including two detail maps of the towns Deggendorf and Freyung. The comparison shows that the charging demand in Deggendorf is higher than in Freyung. By zooming in, it is visible that small areas with a higher demand are also located outside the city centers due to some overlapping demand areas (neighborhood effect of POIs).
Depending on the planning objective, for instance, the five most efficient CSs (highest electric demand areas) can be identified (financial reason), or a certain percentage of electric demand for EV charging could be selected.
5. Discussion
The ECDL model provides a GIS-based CS location analysis with a flexible and transferable method, but it also makes some assumptions. Questions about how long and where user groups dwell for EV charging can be answered using this modeling tool. The tool is based on the assumption that people are charging their vehicles at POIs or nearby, where they spend time anyway. The spatial and temporal dimensions of user activities not only constitute a benefit of the ECDL but also take into consideration the walking distances for potential EV users, which has an advantageous effect for zoomed-in localization. Even though the distance for each user group and destination type are estimated based on the limited information (see Section 3.1), the embedding of this parameter is seen as an improvement with regard to user requirements on the one hand and spatial planning for the whole area on the other. By calculating service areas to define walkable distance zones, intersection areas are found, where CSs can supply a charging opportunity for several destinations in the vicinity while, at the same time, guaranteeing acceptable walking distances for EV users. Instead of providing the charging option at each POI itself, this holistic approach ensures a comprehensive concept from the outset. It is also possible to restrict installation costs by implementing CSs only at the sites with the highest demand. As there is an opportunity to lower or raise the demand threshold value for a CS installment decision, this holistic kind of model can be used such that the sites with the highest demand, together with the highest number of included POIs and within optimized walking distances, are found.
Moreover, the method also prevents a surplus of CSs installed at each destination because of the short-distance effects of POIs positioned in close proximity to one another. Thus, the bundling of charging locations can minimize the costs for set-up and operation of CSs. As far as the walking distance is concerned, the limitation of the model is that it assumes equal acceptance of walking distance by each person of a user group, even if unequal willingness between group members exists. In this approach, a readjustment is carried out by calculating the average shortest paths between parking spots and all included destinations. Gaining more knowledge about the probability distributions of walking distances accepted within the user groups or the definition of additional user groups would be an aim of future work. The same applies to users’ driving distances as users cover different distances by car and, consequently, have different levels of charging demand.
The POI categorization offers the benefit of selecting destination types that are relevant for the CS localization, but an inaccuracy in the modeling still appears. The advantage of categorization is that, on the one hand, the category to be taken into account in the analysis must be determined. This means that, for instance, only shopping places can be considered if there are such limited intentions from the planning side. In the case study shown, households were not included in the search for CS locations because of the high share of single-family houses with private charging possibilities in the mainly rural case study area. However, on the other hand, some places can be associated with more than one POI category. Apart from being a recreational place for guests, a hotel, for example, could also constitute a workplace for its employees. In this case, the destination category with the strongest influencing factor, meaning the highest demand, is chosen but could be examined with a further categorical division. With the freely available data (POIs from OSM, municipal statistics, and publicly available time-spending surveys), the method can be easily transferred to any region, although it cannot provide a more subdivided demand distribution. Additional data about, for instance, the location and size of companies or visitors at recreation or tourist points would be necessary for a more precise analysis with a more detailed demand distribution. Information on the spatial characteristics and the size of companies should especially be collected because companies are only registered as POIs in OSM if they are public places, such as shopping facilities. Furthermore, the equal distribution of EVs among the number of POIs is unrealistic as the capacities of, for example, supermarkets are not identical. Thus, the completeness of the volunteered data is not necessarily given, as demonstrated by a basic data validation (see Table 6). However, if a more precise analysis is to be pursued, a more complete dataset would be required.
In a more detailed analysis, the temporal dimension should preferably also have a higher resolution as the current model only depends on sums of time use and average dwell time. The model yields a yearly sum of energy demand at CSs. Weekdays, weekends, or charging demand in hourly resolution cannot be distinguished based on this data. Data from market surveys about the temporal capacities of supermarkets may provide helpful information, especially in terms of economic profitability. Due to the time intervals, a different number of charging points has to be installed in order to cover the charging requirement, as [38] notes. As a next step, the supply side should be integrated in the locating process, for instance, in terms of installing decentralized photovoltaic systems near or at the CS sites to provide renewable electric energy for charging. This could be on neighboring roof tops, especially in cities, or on shady roof above the parking sides, for instance, at rural or recreation sites, as leisure time and solar energy production are expected to be correlated.
Lastly, the model has to be adapted for supraregional planning because the location analysis emphasizes the daily activities of the majority of persons within their home region but does not consider supraregional, long distance travels with charging at driving breaks.
6. Conclusions
The presented ECDL model calculates the electric charging demand at POIs for EVs and identifies the most appropriate sites for CSs within optimized and acceptable walking distances. Electric demand values of single POIs in this walking area are summarized, and the zoomed-in site is found by minimizing the walking distances to all relating destinations within this walking area. The interaction between the users and their environment is central to the ECDL model, which is aimed at locating an ideally positioned, central CS by determining walking distance areas while considering spatial relationships between the destination points within acceptable walking distances. Consequently, the model is, on the one hand, able to ensure a comprehensive CS supply for meeting total EV charging demand while, on the other hand, bundling CS sites with the purpose of cost optimization for set-up and operation, as, for instance, Bioly et al. [39] claim. The presented work primarily emphasizes the spatial planning approach on a street level, which facilitates the model’s implementation in municipal planning processes, as the case study confirms. In future projects, a more detailed analysis may be developed, including additional data to ensure the completeness of destination sites and more details about time usage. In urban areas, extending the model by the POI type “living” for areas with multiple-family houses would be useful as the inhabitants usually do not have home charging options. Although the study is based on several assumptions (e.g., acceptable walking distances), the model is flexible, and assumed values can be replaced by more specific values, such as the real employee numbers, resulting in more precise and qualitative studies that are adjusted to a specific district. Nevertheless, the distinction of categories according to user groups at different POI types (distinguishing between number of persons, duration, frequency in terms of charging time, and differential acceptance of walking distances) constitutes an essential approach for demand calculation. The next step in the case study area could be the implementation of CSs at optimal locations in order to test the planning results and verify them with the actual charging demand. The supply side as well as alternative mobility concepts (other electric driving systems, depending on their sustainability) should also be considered. Finally, by gaining more knowledge about real user activities and EV charging processes from the test environment, the CS location model can be adjusted and transferred to other regions.
Author Contributions
Conceptualization, R.P.; methodology, R.P., A.M., and R.Z.; writing, R.P.; visualization, A.M. and R.P.
Funding
This research was funded by the European Union European Regional Development Fund (ERDF) 2014–2020, funding number 93, in the project “e-Road Pisek—Deggendorf”, an INTERREG V ETZ project between Bavaria and the Czech Republic, and by the Bavarian Ministry of Economic Affairs and Media, Energy, and Technology and the affiliated project “Virtual power plant for supply of electro-mobility in the E-WALD project region”, funding code MOD1206-0007 (2013–2016).
Conflicts of Interest
The authors declare no conflict of interest. The funders had no role in the design of the study; in the collection, analyses, or interpretation of data; in the writing of the manuscript; or in the decision to publish the results.
References
- European Environment Agency. Electric Vehicles in Europe; European Environment Agency: Copenhagen, Denmark, 2016. [Google Scholar]
- Amsterdam Round Table and McKinsey&Company. Electric Vehicles in Europe Gearing up for a New Phase. 2014. Available online: https://www.mckinsey.com/featured-insights/europe/electric-vehicles-in-europe-gearing-up-for-a-new-phase (accessed on 16 November 2016).
- European Automobile Manufacturers Association. Overview on Tax Incentives for Electric Vehicles in the EU. 2017. Available online: https://www. acea.be/uploads/publications/EV_incentives_overview_2017.pdf (accessed on 10 August 2017).
- Deng, Y.; Li, J.; Li, T.; Gao, X.; Yuan, C. Life cycle assessment of lithium sulfur battery for electric vehicles. J. Power Sources 2017, 343, 284–295. [Google Scholar] [CrossRef]
- Kaiser, O.; Meyer, S.; Schippl, J. ITA-Monitoring Elektromobilität. 2011. Available online: http://www.itas.kit.edu/pub/v/2011/epp/kaua11-pre01.pdf (accessed on 25 November 2017).
- Beckers, T.; Gizzi, F.; Kreft, T.; Hildebrandt, J. Effiziente Bereitstellung der (öffentlich zugänglichen) Ladeinfrastruktur für die Elektromobilität in Deutschland; TU Berlin: Berlin, Germany, 2015. [Google Scholar]
- Dong, J.; Liu, C.; Lin, Z. Charging infrastructure planning for promoting battery electric vehicles: An activity-based approach using multiday travel data. Transp. Res. Part C Emerg. Technol. 2014, 38, 44–55. [Google Scholar] [CrossRef]
- Philipsen, R.; Schmidt, T.; Ziefle, M. A Charging Place to Be–Users’ Evaluation Criteria for the Positioning of Fast-charging Infrastructure for Electro Mobility. Procedia Manuf. 2015, 3, 2792–2799. [Google Scholar] [CrossRef]
- Chen, S.; Shi, Y.; Chen, X.; Qi, F. Optimal location of electric vehicle charging stations using genetic algorithm. In Proceedings of the 2015 17th Asia-Pacific Network Operations and Management Symposium (APNOMS), Busan, Korea, 19–21 August 2015; pp. 372–375. [Google Scholar]
- Hidalgo, P.A.L.; Ostendorp, M.; Lienkamp, M. Optimizing the charging station placement by considering the user’s charging behavior. In Proceedings of the 2016 IEEE International Energy Conference (ENERGYCON), Leuven, Belgium, 4–8 April 2016; pp. 1–7. [Google Scholar]
- Salmon, J. Systems optimization of charging infrastructure for electric vehicles. In Proceedings of the 2016 Annual IEEE Systems Conference (SysCon), Orlando, FL, USA, 18–21 April 2016. [Google Scholar]
- Andrenacci, N.; Ragona, R.; Valenti, G. A demand-side approach to the optimal deployment of electric vehicle charging stations in metropolitan areas. Appl. Energy 2016, 182, 39–46. [Google Scholar] [CrossRef]
- Wirges, J. Planning the Charging Infrastructure for Electric Vehicles in Cities and Regions; KIT Scientific Publishing: Karlsruhe, Germany, 2016. [Google Scholar]
- Kameda, H.; Mukai, N. Optimization of charging station placement by using taxi probe data for on-demand electrical bus system. In Proceedings of the International Conference on Knowledge-Based and Intelligent Information and Engineering Systems, Kaiserslautern, Germany, 12–14 September 2011; Volume 6883. [Google Scholar]
- Tu, W.; Li, Q.; Fang, Z.; Shaw, S.; Zhou, B.; Chang, X. Optimizing the locations of electric taxi charging stations: A spatial–temporal demand coverage approach. Transp. Res. Part C Emerg. Technol. 2016, 65, 172–189. [Google Scholar] [CrossRef] [Green Version]
- Frade, I.; Ribeiro, A.; Gonçalves, G.; Antunes, A. Optimal Location of Charging Stations for Electric Vehicles in a Neighborhood in Lisbon, Portugal. Transp. Res. Rec. 2011, 2252, 91–98. [Google Scholar] [CrossRef]
- Namdeo, A.; Tiwary, A.; Dziurla, R. Spatial planning of public charging points using multi-dimensional analysis of early adopters of electric vehicles for a city region. Technol. Forecast. Soc. Chang. 2014, 89, 188–200. [Google Scholar] [CrossRef] [Green Version]
- Wagner, S.; Brandt, T.; Neumann, D. Smart city planning—Developing an urban charging infrastructure for electric vehicles. In Proceedings of the 22nd European Conference on Information Systems (ECIS 2014), Aviv, Israel, 9–11 June 2014. [Google Scholar]
- Chen, T.; Kockelman, K.; Khan, M. Locating electric vehicle charging stations. Transp. Res. Rec. 2013, 2385, 28–36. [Google Scholar] [CrossRef]
- Spieker, H.; Hagg, A.; Gaier, A.; Meilinger, S.; Asteroth, A. Multi-stage evolution of single- and multi-objective MCLP. Soft Comput. 2016, 21, 4859–4872. [Google Scholar] [CrossRef]
- Viswanathan, V.; Zehe, D.; Ivanchev, J.; Pelzer, D.; Knoll, A.; Aydt, H. Simulation-assisted exploration of charging infrastructure requirements for electric vehicles in urban environments. J. Comput. Sci. 2016, 12, 1–10. [Google Scholar] [CrossRef]
- Pagany, R.; Camargo, L.R.; Dorner, W. A review of spatial localization methodologies for the electric vehicle charging infrastructure. Int. J. Sustain. Transp. 2018, 1–17. [Google Scholar] [CrossRef]
- Ahn, Y.; Jun, C.; Yeo, H. Analysing driving patterns of electric taxi based on the location of charging station in urban area. In Proceedings of the 2016 IEEE International Smart Cities Conference (ISC2), Trento, Italy, 12–15 September 2016. [Google Scholar]
- Asamer, J.; Reinthaler, M.; Ruthmair, M.; Straub, M.; Puchinger, J. Optimizing charging station locations for urban taxi providers. Transp. Res. Part Policy Pract. 2016, 85, 233–246. [Google Scholar] [CrossRef]
- Efthymiou, D.; Antoniou, C.; Tyrinopoylos, Y.; Mitsakis, E. Spatial Exploration of Effective Electric Vehicle Infrastructure Location. Procedia Soc. Behav. Sci. 2012, 48, 765–774. [Google Scholar] [CrossRef] [Green Version]
- Brooker, R.P.; Qin, N. Identification of potential locations of electric vehicle supply equipment. J. Power Sources 2015, 299, 76–84. [Google Scholar] [CrossRef]
- Gkatzoflias, D.; Drossinos, Y.; Zambelli, P. Optimal Allocation of Electric Vehicle Charging Infrastructure in Cities and Regions; JRC Report; Publications Office of the European Union: Luxembourg, 2016. [Google Scholar]
- Brost, W.; Funke, T.; Lembach, M. Spatial Analysis of the Public Transport Accessibility for Modelling the Modal Split in the Context of Site Identification for Charging Infrastructure. Infrastructures 2018, 3, 21. [Google Scholar] [CrossRef]
- Franke, T.; Krems, J.F. Understanding charging behaviour of electric vehicle users. Transp. Res. Part F Traffic Psychol. Behav. 2013, 21, 75–89. [Google Scholar] [CrossRef]
- Morrissey, P.; Weldon, P.; O’Mahony, M. Future standard and fast charging infrastructure planning: An analysis of electric vehicle charging behaviour. Energy Policy 2016, 89, 257–270. [Google Scholar] [CrossRef]
- Bundesamt, S. Zeitverwendungserhebung—Aktivitäten in Stunden und Minuten für Ausgewählte Personengruppen—Zeitverwendung 2012/2013; Statistisches Bundesamt (Destatis): Wiesbaden, Germany, 2015.
- Wirges, J.; Linder, S.; Kessler, A. Modelling the development of a regional charging infrastructure for electric vehicles in time and space. Eur. J. Transp. Infrastruct. Res. 2012, 12, 391–416. [Google Scholar]
- DLR. Mobilitätspanel Deutschland-Nationale Verkehrserhebungen. Available online: http://daten.clearingstelle-verkehr.de/192/ (accessed on 9 May 2016).
- Millward, H.; Spinney, J.; Scott, D. Active-transport walking behavior: Destinations, durations, distances. J. Transp. Geogr. 2013, 28, 101–110. [Google Scholar] [CrossRef]
- Gunn, L.D.; King, T.L.; Mavoa, S.; Lamb, K.E.; Giles-Corti, B.; Kavanagh, A. Identifying destination distances that support walking trips in local neighborhoods. J. Transp. Health 2017, 5, 133–141. [Google Scholar] [CrossRef]
- Yang, Y.; Diez-Roux, A.V. Walking Distance by Trip Purpose and Population Subgroups. Am. J. Prev. Med. 2012, 43, 11–19. [Google Scholar] [CrossRef] [PubMed] [Green Version]
- ILS-NRW. Sicherung von Nahversorgung und Nahmobilität: Zusammenhänge zwischen Lebensmittelversorgung und Mobilitätsverhalten. ILS-Trends Entwicklungen in NRW. February 2007. Available online: http://www.wohnen-mobilitaet.ch/fileadmin/redaktion/wohnen/Literatur_Freudenau.pdf (accessed on 20 January 2016).
- Cavadas, J.; Correia, G.; Gouveia, J. Electric Vehicles Charging Network Planning. In Computer-Based Modelling and Optimization in Transportation; de Sousa, J.F., Rossi, R., Eds.; Springer: Cham, Switzerland, 2014; Volume 262, pp. 85–100. [Google Scholar]
- Bioly, S.; Kuchshaus, V.; Klumpp, M. Elektromobilität und Ladesäulenstandortbestimmung: Eine Exemplarische Analyse Mit Dem Beispiel der Stadt Duisburg; ILD Schriftenreihe Logistikforschung: Essen, Germany, 2012. [Google Scholar]
Figure 1.
Spatial modeling schema for the identification of CS—Step 1.

Figure 2.
Spatial modeling schema for the identification of CS—Step 2.

Figure 3.
Schematic examples of CS spatial modeling scenes with different POI positions, walking distances around POIs, and the derived CS positioning.
Figure 3.
Schematic examples of CS spatial modeling scenes with different POI positions, walking distances around POIs, and the derived CS positioning.

Figure 4.
Sample extract of the case study with results of charging demand, walking distances, and CS locations. Map A with overall demand and first selected CS area (CS 1) in yellow; Map B without demand of CS 1 and second selected CS areas (CS 2) in yellow; Map C without demand of CS 1 and 2.
Figure 4.
Sample extract of the case study with results of charging demand, walking distances, and CS locations. Map A with overall demand and first selected CS area (CS 1) in yellow; Map B without demand of CS 1 and second selected CS areas (CS 2) in yellow; Map C without demand of CS 1 and 2.

Figure 5.
Case study area with two zoom-in areas (Deggendorf, bottom left, and Freyung, top right) with the distribution of electric charging demand per year and municipality.
Figure 5.
Case study area with two zoom-in areas (Deggendorf, bottom left, and Freyung, top right) with the distribution of electric charging demand per year and municipality.


Table 1.
Categories of points of interest (POIs) from Open Street Map (OSM) as the basis for the charging station (CS) modeling.
Table 1.
Categories of points of interest (POIs) from Open Street Map (OSM) as the basis for the charging station (CS) modeling.
| Destination Category | OSM Superclasses |
|---|---|
| Living | Accommodation 1 |
| Working | Education, Money |
| Shopping | Health, Shopping |
| Recreation | Leisure, Catering, Tourism, Place of worship 2 |
1 Private households are excluded because private home charging is assumed to be possible. 2 The subclass “tourist information” is excluded as dwell time is too short.
Table 2.
Average time use by user groups depending on daily activities 1 (= sum of subactivity time spent multiplied by percentage share of practicing persons); driving time is excluded [31].
Table 2.
Average time use by user groups depending on daily activities 1 (= sum of subactivity time spent multiplied by percentage share of practicing persons); driving time is excluded [31].
| Category | g 1: Young Agers (18–29 years) 2 | Practicing (%) | g 2: Mid Agers (30–44 years) | Practicing (%) | g 3: Best Agers (45–64 years) | Practicing (%) | g 4: Silver Agers (65+ years) | Practicing (%) |
|---|---|---|---|---|---|---|---|---|
| Living | 14:00:20 | 14:58:49 | 15:26:20 | 17:48:01 | ||||
| Personal duties | 10:57:00 | 100% | 10:36:00 | 100% | 10:52:00 | 100% | 11:50:00 | 100% |
| Domestic work | 0:29:00 | 79% | 1:57:00 | 94% | 1:36:00 | 94% | 2:04:00 | 96% |
| Media use | 3:04:00 | 87% | 2:48:00 | 91% | 3:19:00 | 93% | 4:07:00 | 97% |
| Working | 3:47:22 | 3:43:14 | 3:09:24 | 0:13:31 | ||||
| Working | 7:19:00 | 40% | 7:10:00 | 51% | 6:59:00 | 45% | 4:35:00 | 4% |
| Education | 3:50:00 | 23% | 3:37:00 | 3% | 2:38:00 | 2% | 1:29:00 | 2% |
| Shopping | 0:23:37 | 0:30:47 | 0:37:31 | 0:44:19 | ||||
| Shopping | 1:03:00 | 38% | 1:04:00 | 48% | 1:12:00 | 52% | 1:19:00 | 56% |
| Recreating | 5:05:08 | 4:07:17 | 4:29:20 | 6:05:51 | ||||
| Voluntary work | 1:25:00 | 11% | 1:18:00 | 14% | 1:22:00 | 18% | 1:30:00 | 23% |
| Social issues | 1:53:00 | 76% | 1:17:00 | 75% | 1:13:00 | 76% | 1:19:00 | 84% |
| Sport | 1:57:00 | 42% | 1:15:00 | 36% | 0:52:00 | 28% | 1:11:00 | 57% |
| Media use 3 | 3:04:00 | 87% | 2:48:00 | 91% | 3:19:00 | 93% | 4:07:00 | 97% |
1 All persons of a user group are included, practicing and non-practicing persons (average). 2 Conditions: Persons with a minimum age of 18 years (required minimum age for driving license in Germany). 3 Media use is not related to one category but is regularly used at living and recreating sites (double count).
Table 3.
Maximum walking distances between CS and destination (POI) depending on users and types of POI (meter unit).
Table 3.
Maximum walking distances between CS and destination (POI) depending on users and types of POI (meter unit).
| POI Type | Maximum Walking Distance (in Meters) for User Group: | |||
|---|---|---|---|---|
| Young Agers (18–29 years) | Mid Agers (30–44 years) | Best Agers (45–64 years) | Silver Agers (65+ years) | |
| Living | 300 | 300 | 300 | 150 |
| Working | 500 | 500 | 500 | 500 |
| Shopping | 100 | 100 | 100 | 100 |
| Recreation | 500 | 500 | 500 | 250 |
Table 4.
Data of case study area (own calculations) [31].
Table 4.
Data of case study area (own calculations) [31].
| Statistics Case Study Area | |
|---|---|
| Area size | 7200 km² |
| Population density | 109 per km2 |
| Number of POI per type | 560 Living 400 Working 2480 Shopping 3280 Recreation |
| Number of persons per user group | 102,000 Young ager 143,000 Mid ager 224,000 Best ager 153,000 Silver ager |
| Number of vehicle (from inhabitants) | 449,000 |
| Number of daily tourist vehicles (average stay = 4 days/year) | 15,650 |
| Assumption: penetration rate | 50% |
| Average driving distance per day and person | 43 km |
| Electric demand (total in one year)—calculated | 85.76 Gigawatt hours (GWh) |
Table 5.
Electric demand in kWh per POI type and user group for the case study area.
| POI Type | Total E (kWh) | Number of POI Per Type |
|---|---|---|
| Living | 18,577,000 | 560 |
| Working | 34,200,000 | 400 |
| Shopping | 12,530,000 | 2480 |
| Recreation | 20,454,000 | 3280 |
Table 6.
Basic validation of POI data: example of pharmacist and doctor locations in the district Deggendorf of the case study.
Table 6.
Basic validation of POI data: example of pharmacist and doctor locations in the district Deggendorf of the case study.
| District: Deggendorf | OSM | Das Örtliche (Online Telephone Book) | |
|---|---|---|---|
| Number of pharmacies | 24 | 17 | 22 |
| Number of doctors | 15 | 20 | 261 |
© 2019 by the authors. Licensee MDPI, Basel, Switzerland. This article is an open access article distributed under the terms and conditions of the Creative Commons Attribution (CC BY) license (http://creativecommons.org/licenses/by/4.0/).
Share and Cite
MDPI and ACS Style
Pagany, R.; Marquardt, A.; Zink, R. Electric Charging Demand Location Model—A User- and Destination-Based Locating Approach for Electric Vehicle Charging Stations. Sustainability 2019, 11, 2301. https://doi.org/10.3390/su11082301
AMA Style
Pagany R, Marquardt A, Zink R. Electric Charging Demand Location Model—A User- and Destination-Based Locating Approach for Electric Vehicle Charging Stations. Sustainability. 2019; 11(8):2301. https://doi.org/10.3390/su11082301
Chicago/Turabian StylePagany, Raphaela, Anna Marquardt, and Roland Zink. 2019. "Electric Charging Demand Location Model—A User- and Destination-Based Locating Approach for Electric Vehicle Charging Stations" Sustainability 11, no. 8: 2301. https://doi.org/10.3390/su11082301
Note that from the first issue of 2016, this journal uses article numbers instead of page numbers. See further details here.