Exploring a Moderate Operation Scale in China’s Grain Production: A Perspective on the Costs of Machinery Services


1
Key Laboratory of Land Surface Pattern and Simulation, Institute of Geographic Sciences and Natural Resources Research, Chinese Academy of Sciences, Beijing 100101, China
2
University of Chinese Academy of Sciences, Beijing 100049, China
3
School of Geographical Sciences, Southwest University, Chongqing 400715, China
*
Author to whom correspondence should be addressed.
Sustainability 2019, 11(8), 2213; https://doi.org/10.3390/su11082213
Submission received: 26 January 2019
/
Revised: 3 April 2019
/
Accepted: 4 April 2019
/
Published: 12 April 2019
(This article belongs to the Section Sustainable Agriculture)
Abstract
:Due to the indivisibility of agricultural machinery in production, limited farm sizes have reduced mechanization efficiency and increased the cost of grain production in China. As a result, the development of a moderate-scale farming system has been proposed by academic communities and policy makers. However, it is still hotly debated how to determine a moderate farm scale. We offer a new perspective on the costs of machinery services. This manuscript employs the threshold model and uses the nationally representative data from the 2015 China Rural Household Panel Survey (CRHPS) to investigate the role of farm size expansion relative to per area machinery services expenditures (PAMSE). The empirical results reveal that there is a nonlinear relation between the farm size and PAMSE. Specifically, farm size expansion can reduce the PAMSE by improving mechanization efficiency in all cases, while the magnitude of cost-saving is progressively reduced in the process of farm scale expansion. In particular, a 1 mu (1 mu = 1/15 ha) increase in the farm scale could only lead to a 0.3% decrease in the PAMSE when the farm size exceeded 50 mu, which indicates that 50 mu is a minimum efficient farm scale to achieve most economies of scale. Therefore, we suggest that persistent efforts should be devoted to improving farmland circulation efficiency and developing scale farms. More importantly, governmental supporting policies, such as agricultural subsidies, need to attach more importance to these large farms.
1. Introduction
Agricultural machinery commonly acts as a substitute for the labor force, due to rapidly increasing non-farming wages in the context of industrialization and urbanization. Recently, such a process has been experienced in many developed countries [1,2,3,4,5].
China is the fastest growing economy in the world, with many rural laborers joining the non-agricultural sector in the past decades and with labor migration significantly improving the income of rural households [6,7]. However, the agricultural labor shortages that result from real wage increases have seriously challenged China’s grain production. Therefore, it is crucial to enhance mechanization operations to improve grain productivity [8,9,10].
Rice, wheat, and maize are China’s staple grains, accounting for 85% of the total sown area of grain crops [11]. Grain farms are typically characterized by small-sized and family-based operations, most of the farms are unlikely to purchase professional machinery, such as a combine harvester, due to their expensive price and low usage rate; instead, farm operators tend to buy machinery services from mechanization services provider [12]. Since a widespread regional difference occurs in the farming schedule in China, service providers are able to operate several months through migration, and this model of service supply significantly improves a farm’s access to mechanization services [13]. This mechanization service mode was initially derived from cross-regional mechanized grain harvesting in the Jiangsu province [14]. Now, cross-regional mechanization services have been popularized in most of China’s rural areas, and services have been extended to most Sections of crop farming, including land preparation, sowing, and harvesting. According to the 13th Five-Year Plan for the Agricultural Mechanization Development of China, the comprehensive level of mechanization for wheat production, rice production, and maize production are 93.7%, 78.1%, and 81.2%, respectively [15].
Under the Household Responsibility System (HRS), initiated in the 1980s, a rural household was allocated multiple plots that are small and spatially dispersed, based on a principle of egalitarianism [16], and these small plots seriously hinder the application of large-scale machinery. Hence, agricultural machinery is still dominated by medium and small-scale machinery in most of China, and with the increase of non-agricultural wages, machinery service providers also call for a larger farm size to improve the efficiency of mechanization and thus increase income.
Increasing the labor productivity of the grain industry is critical for sustainable food production and supply [17], given the extremely low per capita land resource endowment in China [18]. For this purpose, an important strategy is to enlarge farm size to improve mechanization efficiency. However, until now, few studies have estimated a moderate farm scale from the perspective of machinery utilization, even though many scholars have highlighted that a considerable increase in farm size is the key to efficient mechanization [19,20]. Indeed, an appropriate operation scale exists for achieving the optimal efficiency of machinery utilization when this machinery is only for private use [21,22].
Obviously, this situation is not applicable in the case of Chinese farmers because most of the family farms realize mechanization through the prevailing machinery services. As a result, the scale economies on machinery are mainly coming from savings on machinery service expenditures. Several studies have found an increasing cost advantage of large farms in mechanized farming. For example, an increase in farm size and reduction in land fragmentation contributes to reduced production cost and improved technical efficiency [23,24]. Moreover, a negative relation between plot size and average cost also has been found more recently, indicating the presence of a scale economy within a plot [25]. In general, these studies mainly examine the cost advantage of large farms derived from scale-dependent mechanization. Specific to machinery services cost, Gu et al. [26] assumed a linear relation between the machinery services cost and farm size and estimated this relation with a linear model. Indeed, because of the presence of diminishing marginal utility, the potential nonlinear relation between the farm size and per area machinery services expenditures (PAMSE) was largely neglected in the previous study.
How large a grain farm is appropriate in China? This issue has aroused hot debates in the academic community. The literature provides diverse results based on different evaluation standards. A representative consideration is that the agricultural income of professional farmers should be roughly equal to the social average income in the urban non-agricultural sector, and a correspondingly appropriate farm size is generated following this principle. According to this principle, Songjiang, a suburban area of Shanghai, was estimated to be a moderate size of 100 mu in 2014 [27]. Further, because of remarkable regional differences, the literature suggested that a moderate-scale operation should be different according to land resource endowment and local economic development levels [28]. In addition, other studies contributed to this issue from multiple analysis perspectives and objectives, including the maximization of land productivity [29], per area profit maximization [30], and optimum technical efficiency [31,32], in accordance with different standards, various results can be obtained.
To summarize, although previous studies have found a negative relation between the farm scale and machinery costs owing to the presence of scale economies, the nonlinear relation between them has been largely neglected. More importantly, few studies have paid attention to an estimation of moderate farm scale from the perspective of mechanization supply cost, particularly in Chinese grain production, which has a socialized service system in mechanization supply. Therefore, this study contributes to the literature in two ways. First, using the database from the 2015 China Rural Household Panel Survey (CRHPS), we tested the nonlinear impact of the farm size on the PAMSE based on the threshold model, and second, we further focused on the potential moderate operational scale when the marginal effect of the farm size expansion on the PAMSE is fairly small. The result can enhance our understanding of the influence of farm size on mechanization efficiency and offer policymakers a new method to formulate land policy to promote moderate-scale operation and improve grain production efficiency, which can provide new insights into food security and agricultural sustainability.
The rest of this paper is structured as follows. The next section introduces the theoretical hypothesis and model specification; Section 3 presents data resources and statistical description; the fourth section reports the empirical results; the following section discusses the results, and in the last section, the conclusions and policy implications are illustrated.
2. Research Methodology
2.1. Theoretical Hypothesis
Theoretically, scale economies are defined by a long-term cost reduction along with increased yield [33]. Namely, scale economies lower the unit fixed cost of products by expanding production scale [34]. In the case of the agriculture sector, due to the indivisibility of mechanized operation [25], farm size enlargement can obtain scale economies for the following reasons. Small-scale farmers typically owned multiple small and dispersed plots. Small plots often lead to a lower speed and efficiency of machinery, the machinery needs to use more time to frequently change directions to suit a small plot, and an increase in time to move the machinery among dispersed plots is inevitable [35]. Thus, the limitations of small farms make mechanization services costly. However, farm size enlargement can reduce land fragmentation and increase plot size, thereby significantly mitigating the limitations for mechanization and leading to considerable cost savings in machinery services. Thus, we hypothesize:
H1.
Expanding farm size contributes to cost reduction in machinery use by improving mechanization efficiency.
This cost-saving effect of farm size expansion should not be constant due to China’s farmland system and agricultural technology level. First, plot size directly affects the working efficiency of the machinery, but lessees cannot infinitely enlarge plot size through the land circulation market in the face of high transaction costs under the HRS. Second, due to the prevailing small farms, the machinery hiring market is still dominated by small- and medium-scale machinery. In this case, the improvement of mechanization efficiency could progressively decrease along with farm scale expansion, and thus, the cost-saving effect of expanding farm scale will decay gradually. Thus, we hypothesize:
H2.
The magnitude of the cost-saving effect is progressively reduced in the process of farm scale expansion.
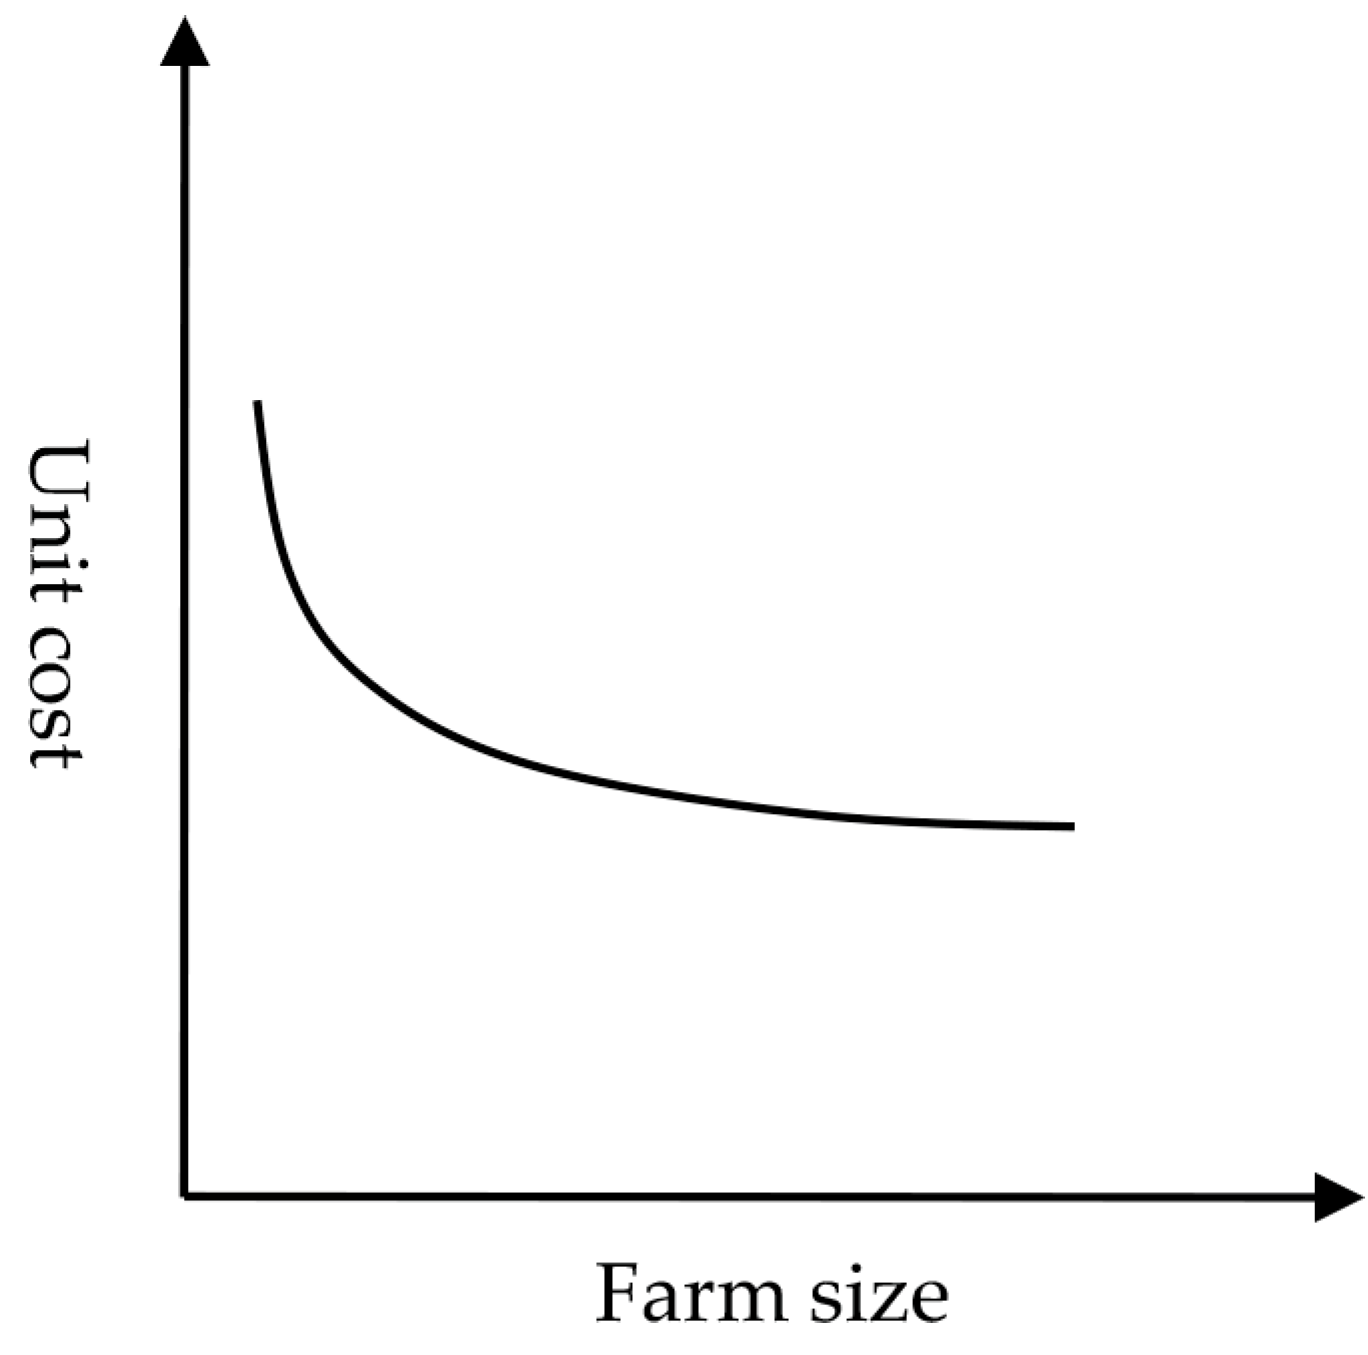
From the above analysis, a nonlinear relation likely exists between the farm size and PAMSE, and this relation can be viewed as the curve introduced in Figure 1. As illustrated, the PAMSE keeps declining with the expansion of the farm size, but the decreasing rate progressively slows, and more importantly, the minimum efficient operation scale can likely be estimated when the impact of the farm size on the PAMSE becomes extremely small.
2.2. Model Specification
The aim of this study was to investigate the relation between farm size and PAMSE by first considering the following linear equation:
where subscripts indicate household ; indicates the logarithm of the PAMSE, which is defined as the per area expenditures for purchasing agricultural machinery services, including land preparation, sowing, plant protection, irrigation, harvesting, and transportation services; indicates the farm size, which is a measure of the amount of planted area in the proceeding four seasons before the survey; and is a parameter to be estimated, based the theoretic analysis, and a negative sign of is expected. In addition, indicates a series of other controlled variables that may affect mechanization costs, such as farm characteristics, characteristics of the head in each household, family characteristics, and regional differences. Specifically, the farm characteristics include the number of land parcels; suitability of the land for mechanization; accessibility to tractor road, land quality, and plant type; the characteristics of the household head, including age, education level, and health status; family characteristics, including agricultural labor force and agricultural labor force; and regional characteristics, including terrain and economic location.
According to the theoretic analysis, we argue that the impact of the farm size on the PAMSE may decline gradually with continuous farm expansion; that is, the economies of the farm scale would decrease in the process of farm consolidation. Thus, the adoption of an identical estimate Equation across all farms with a different scale is insufficient to capture the clear relation between the farm size and machinery services cost. Consequently, we employ the threshold regression model introduced by Hansen [36] to examine the nonlinear effect of the farm size and try to simultaneously extract the potential optimal farm scale. A single threshold model can be indicated according to the following equation:
where is a series of explanatory variables that include the farm size and other controlled variables; is the indicator function; is the farm size, which is defined as a threshold variable; and is an endogenous threshold value that divides the sample into two regimes. Then, strict tests need to be implemented to allow an examination of the threshold effect of the farm size. Thus, we set up the null hypothesis, specified as: . However, under the null hypothesis, the likelihood test does not follow a normal distribution without a given value for the threshold ; therefore, we utilize the heteroscedasticity consistent Lagrange Multiplier (LM) bootstrap procedure proposed by Hansen [37] to test the hypothesis. If the null hypothesis is rejected, the sample may possibly be further divided into two subsamples; otherwise, the threshold effect does not exist in the sample.
To ensure that the threshold effect is reliable, we employed the Chow test to further examine the robustness of the likely threshold value . The Chow test is run in a multivariate regression model setting to examine whether its coefficients differ across different farm groups at a statistically significant level. Thus, according to the sample division based on the estimated threshold value , a dummy variable of the farm size was created, with the interaction term of the dummy variable and farm size being created as well. This process enabled us to use the F test to check the structural heterogenicity of the regression coefficients in the two regimes. The Chow test implemented in Equation (1) can be specified as follows:
where indicates a dummy variable that equals 1 if the farm size is larger than the threshold value; indicates an interaction term between the farm size and the dummy farm size variable. , , and are parameters to be estimated.
Additionally, the above procedures are available for repeating when double or multiple threshold effects are being examined. For example, we can obtain the following structural equation in the case of the double threshold:
where and represent the threshold value and follow . This model can be easily extended to a form of multiple thresholds ().
3. Data and Statistical Description
3.1. Data and Samples
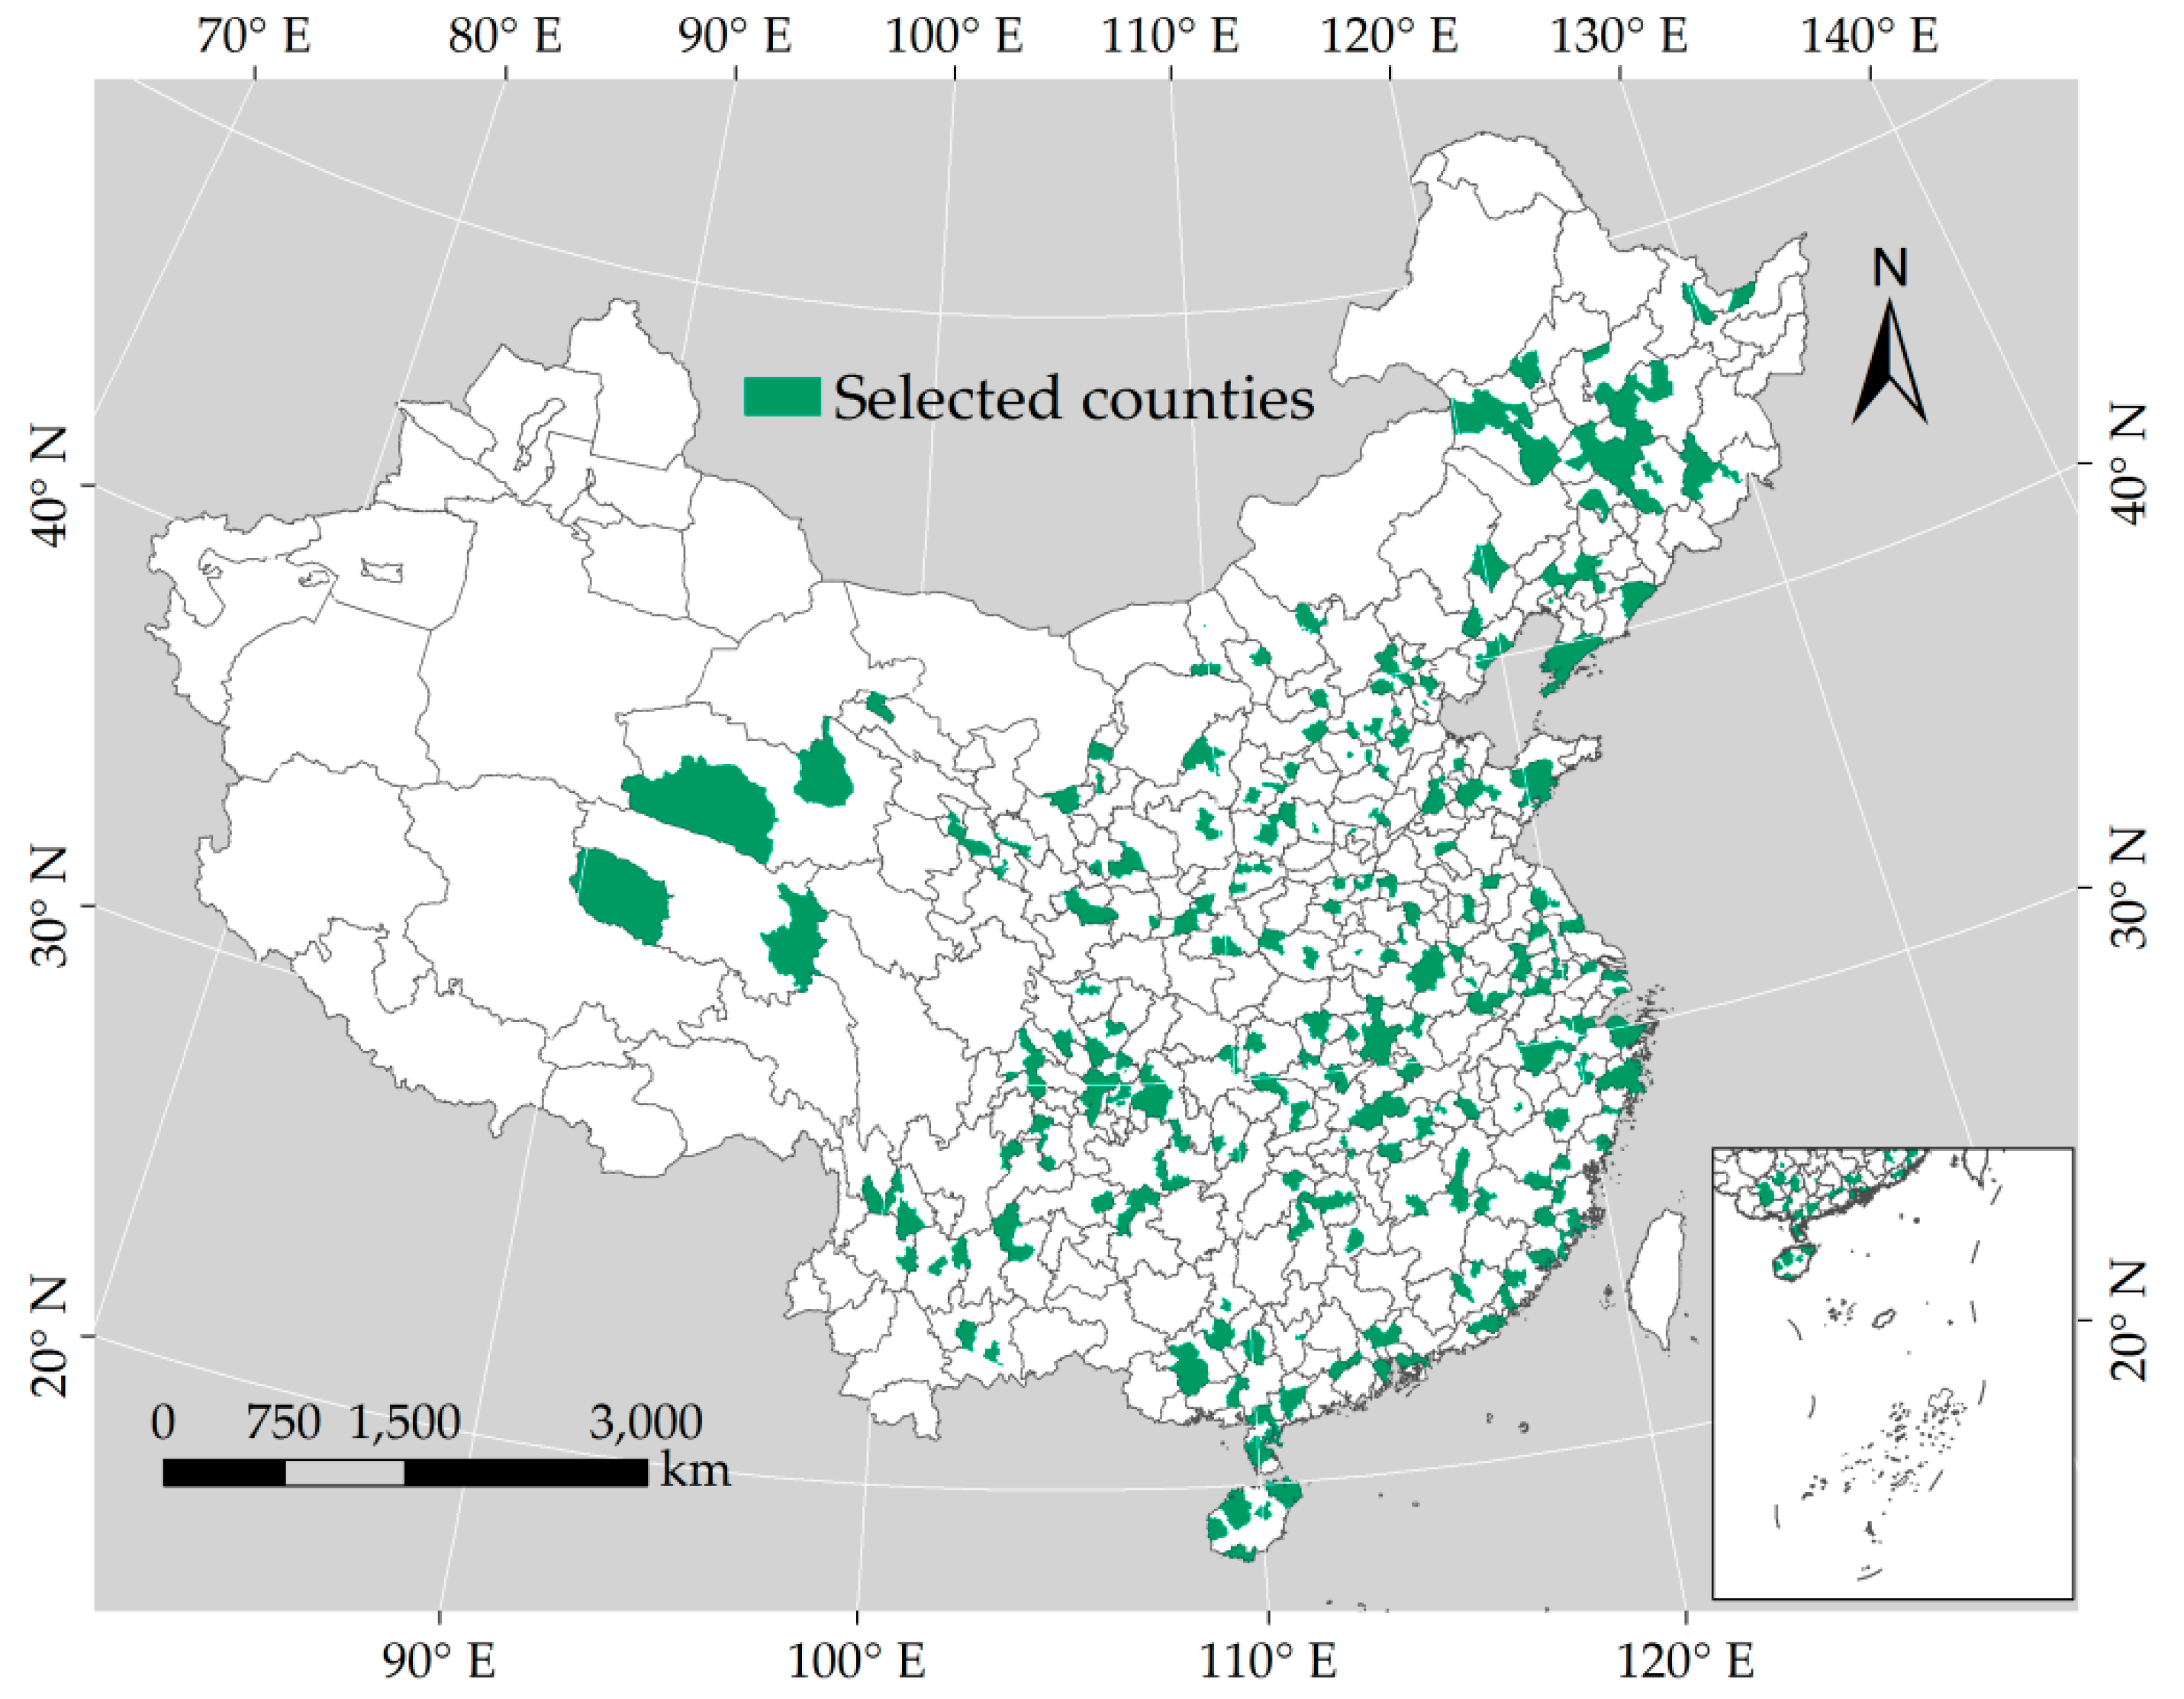
Data used in this research were obtained from the CRHPS conducted by Zhejiang University in 2015; this source is a nationally representative survey comprising all provinces on mainland China, except for Xinjiang and Tibet. In the sampling process, a three-stage (county or district, village, and household) sampling design was implemented to ensure a representative database. In the first stage, the whole counties were split into ten groups based on the per capita gross domestic product, which was specified as a stratified index, and then 363 counties or districts were randomly selected from 29 provinces (Figure 2). Furthermore, 22,535 households from 1439 villages or residential committees were randomly extracted as respondents in the above counties or districts. In this survey, household information on demographic features, agricultural production, family assets, family incomes, and expenditures were collected.
Since our objective was to investigate the relationship between the farm size and PAMSE, we imposed a series of restrictions on the full sample to generate a more accurate household database. First, given the backward mechanization of the cash crop industry, we included only grain farms, on which rice, wheat, or maize are grown; second, the samples with a zero farm size (measured by sowing area) or machinery services expenditures were excluded, and then we excluded the bottom and top 2.5% machinery services expenditures, which may result from low-level mechanization or statistical problems; third, we further removed some observations with missing values in other important variables. After the above-described data cleaning procedures were complete, the samples used in this study consisted of 2133 grain farm observations.
3.2. Statistical Description
The sample was divided into 27 groups according to the farm size and sample size, and the PAMSE was examined in every size group; the results are presented in Table 1. Note that for 72% of the sample the farm size was less than 10 mu, and approximately 90% of the households operated a grain farm of less than 20 mu in our sample; moreover, the farm size averaged 11.36 mu. The data showed remarkable differences in the PAMSE among the different groups of farm sizes. For example, the PAMSE averaged 370.30 Yuan/mu when the farm size is less than 1 mu, whereas the cost was reduced to 37.45 Yuan/mu when the farm scale is larger than 100 mu. In general, these data show a decreasing tendency of the PAMSE with an expansion in the farm scale; specifically, the cost reduction occurred at a higher rate when the farm scale was small, and this rate declined as the farm size increased. That is, the cost reductions in machinery services become progressively smaller with the continuous expansion of farm scale. However, this phenomenon calls for a strictly causal identification test.
Table 2 present the definitions and descriptive statistics of the controlled variables analyzed in this research. In terms of farm characteristics, the data shows that 77% of the households operated more than one parcel of cropland, indicating widespread land fragmentation in rural China. Regarding the attributes of the largest household parcels, 76% of the respondents reported that their largest parcel was supportive for large-scale mechanization; 71% of the households reported that their largest land was adjacent to the tractor road, and the quality of the largest parcel ranged between fair to good on average. In addition, the data revealed that 17%, 5%, and 28% of the households only grew rice, wheat or maize, respectively, and 50% of the farmers in the sample planted a mixture of these crops. For the head of the household, the average age was approximately 53, and the average education level ranged from primary education to secondary education, with 79% of the head of household believing themselves to be healthy. In terms of family characteristics, on average, approximately two adult labors were engaged in agricultural production in a household, and the total values of agricultural machinery and equipment in a household averaged 2711.86 Yuan.
In terms of regional characteristics, 52% of the households are located in a county on the plains, where the proportion of mountainous area is less than 30%; moreover, according to the combination of geographic location and economic development, our sample can be subdivided into 4 province groups: east China (Beijing, Tianjin, Hebei, Shandong, Jiangsu, Shanghai, Zhejiang, Fujian, Guangdong, Hainan), central China (Shanxi, Henan, Hubei, Hunan, Jiangxi, Anhui), west China (Sichuan, Guangxi, Guizhou, Yunnan, Chongqing, Shaanxi, Gansu, Inner Mongolia, Ningxia, Qinghai), and northeast China (Liaoning, Jilin, Heilongjiang). Thus, the proportions of our sample from east China, central China, west China, and northeast China were 29%, 35%, 23%, and 13%, respectively.
4. Results
4.1. Endogenous Problem Test
As mentioned above, the data used in this research are nationally representative, and the endogeneity problem caused by a sampling bias can be largely ignored; in addition, to ensure a pure estimated result, our models take into account control variables related to the region, family, household head, farm, and land parcel to solve the problem of missing variables. However, we still cannot rule out the existence of mutual causality between the dependent variable and the core explanatory variable (i.e., operators increasing the farm scale motivated by reducing mechanization cost). We, therefore, employ an instrumental variable (IV) approach to address this problem, and the size of cropland contracted by family is used as the instrumental variable according to Wu’s experience [38]. In China, under the HRS, rural cropland is collectively owned, and rural households obtain the use rights of land by signing a long-term contract with the collective organization, with the contractual size of the cropland being based on household size. Furthermore, the last wave of land contracts was mostly signed before 2000, which means no relation exists between the contractual size of the land and the current machinery service market. Given the limited land circulation market participation due to various reasons [39], the current farm scale is still shaped based on the contractual size before 2000 (correlation coefficient = 0.6).
The two-stage least squares estimation (2SLS) methods based IV approach is applied in Equation (1), and we also run the equation using the ordinary least squares (OLS) method to make a comparison. These estimated results are reported in Table 3. In the first stage of the 2SLS regression, the partial R2 is 0.272, and the robust F is 21.943; these two indicators mean the contractual size of cropland would not be a weak instrument. Table 3 shows that the IV estimation result is highly consistent with that based on the OLS approach; additionally, the Durbin-Wu-Hausman test (p = 0.2523) also indicates that the core independent variable is exogenous. Therefore, the endogenous problem of the farm size can be neglected, and the OLS method is appropriate for our research.
4.2. Threshold Effect Test
Before threshold regression, we needed to determine the number of thresholds and their values. We determined the threshold values for the farm size using procedures similar to those introduced by Hansen [36]. The results are presented in Table 4. A brief process of threshold estimation is as follows. First, using the full sample, the LM-test suggests that a threshold effect (γ1 = 16) exists for the farm size at a significance level of 1%; this result indicates that the sample can be divided into two subsamples. Furthermore, we employed the LM-test to search for potential threshold effects in these two subsamples, and the LM statistics show the existence of another two thresholds (γ2 = 6, γ3 = 24), which are significant at 1% and 5%, respectively. Thus, our sample can be further split into four regimes. In the same way, the minimum threshold (γ4 = 3.1) and the maximum threshold (γ5 = 50) are estimated with a significance at 1% and 5% levels, respectively, and no significant threshold effect was found in the further sample divisions.
Additionally, to check the accuracy of each estimated threshold value, we utilized the Chow-test to determine whether the slope of the coefficients differs between adjacent regimes at a statistically significant level. The results in Table 4 show that four thresholds (γ1 = 16, γ2 =6, γ4 =3.1, γ5 =50) pass the test with a p value of at least 0.07, indicating that a significant change occurs in the cost of machinery service when farm expansion to these threshold value. However, the Chow test also shows that no significant difference in the coefficients between the two adjacent regimes when given a threshold value of 24. Consequently, according to the above four robust thresholds, our sample can be divided into five groups (i.e., <3.1 mu, 3.1–6 mu, 6–16 mu, 16–50 mu, and >50 mu) based on the household’s farm size.
4.3. Threshold Regression Results
The relation between the farm size and PAMSE is examined in each farm group. Table 5 reports the results of threshold regression, and the regression result from the full sample in Table 3 is used in the analysis as a comparison. As expected, the farm size exerts a significantly negative effect on the PAMSE in all cases, and the coefficients of the farm size range from −0.201 to −0.003. This finding confirms that scale economies in farm mechanization are ubiquitous in the range of the farm sizes covered by this survey (less than 400 mu). However, the variations in the relation between the farm size and the PAMSE deserve more attention. Specifically, when the farm scale is less than 3.1 mu, a 1 mu increase causes a 20.1% decrease in the PAMSE, which can be viewed as a considerable cost saving; this economy of scale fell to 6.2% when the farm size ranged from 3.1 mu to 6 mu, and as the farm size further increased to a range of 6 mu to 16 mu, a 3.9% decrease in the PAMSE was caused by a 1mu increase in the farm scale. Moreover, the marginal effect of farm scale expansion was further reduced to 1.5% when the farm size ranged from 16 mu to 50 mu; additionally, when the farm size exceeded 50 m, a 1 mu expansion in the farm size was associated with a 0.3% decrease in the PAMSE.
Generally speaking, consistent with theoretical analysis, the impact of the farm size on the PAMSE presents a gradual decline with continued expansion in farm size. By contrast, as shown by the linear regression result reported in Table 3, the data simply show that a 1 mu expansion in the farm size leads to a 0.9% decrease in mechanization cost on average. Obviously, the threshold model enables us to clearly understand the nonlinear impact of the farm size on the mechanization cost.
This study also reveals some interesting results for the control variables used in the regression. Regarding the characteristics of the largest parcel, we find that households operating more than one parcel tend to increase machinery services expenditures when the farm size exceeds 50 mu, indicating a higher mechanization cost if farm size expansion fails to merge the fragmented parcel into an integrated farm.
Regarding land condition for mechanization, the variable provides mixed results, and better suitability for mechanization leads to higher machinery service expenditures when the farm size ranges between 6 mu and 16 mu. In contrast, this variable causes a significant decrease in the PAMSE when the farm size is larger than 16 mu and less than 50 mu. A possible explanation is as follows. In most of China, where a household operates a relatively small grain farm, large-scale mechanization is often limited, and, therefore, better suitability for mechanization provides an opportunity for smallholders to increase labor-saving input, such as hiring machinery services. However, for the scale farm with a relatively high level of mechanization, suitability for large-scale mechanization means a more efficient mechanized production, and this leads to cost savings of machinery services. Additionally, another control variable providing support for this claim is accessibility to a tractor road, which serves as a proxy for the transportation condition of the land parcel and was positively associated with the PAMSE when the farm size ranged between 3.1 mu and 6 mu, suggesting a 17.7% increase in the PAMSE when the parcel is adjacent to tractor road.
In terms of the characteristics of the head of household, an elderly farm operator is negatively associated with the PAMSE when the farm size ranged between 16 mu to 50 mu, indicating a lower level of acceptation and adoption of new agricultural technology [40,41]. In addition, the educational level of the head of household exerts a positive impact on the PAMSE in general. Our result is consistent with Lin [42], who suggested that the educational level positively influences the adoption of technology.
Regarding family characteristics, data show a mixed result for the agricultural labor force. For a grain farm larger than 50 mu, having more laborers participating in agricultural production was negatively associated with the PAMSE. Surprisingly, labor force has a positive impact on machinery input when the farm size is less than 3.1 mu, which is opposite to the result from the larger scale households (>50 mu). We argue that this confusing finding may be caused by differentiation in smallholders in rural China. Specifically, to realize family utility maximization, elderly laborers are often allocated to the agricultural sector according to the comparative advantage of the household’s labor force [43]. Older farmers prefer to extensively operate a grain farm (i.e., lower unit input) and seek basic livelihood security. Therefore, the input intensity, including machinery input of this farm, is significantly lower than the professional farms, which were typically highly intensive in labor and capital. Our data support this inference, as well. The PAMSE for the farms with only one laborer averaged 224 Yuan/mu, and the age of the head of household in this farm group averaged 55. In contrast, the farms with more than one laborer presented a significantly higher PAMSE, which averaged 280 Yuan/mu. As shown in Table 3, on average, the households possessing more agricultural assets may contribute to a reduction in the PAMSE. However, for small farms (i.e., ≦ 3.1 mu), households that possess more agricultural assets are largely viewed as being more suitable for mechanization and having a more positive attitude for technology adoption; thus, these households exert a positive impact on the PAMSE.
5. Discussion
5.1. The Moderate Operation Scale for China’s Grain Production
From the variation tendency in the marginal effect of the farm size, the impact of farm size on the PAMSE presents a stable decline, and the impact approaches a relatively low level when the farm size exceeds 50 mu. Hence, we argue that a 50 mu farm can be viewed as the moderate operation scale for Chinese grain industry with current farmland system and agricultural mechanization technology, since a grain farm larger than 50 mu enables machinery to maximally improve the field operational efficiency and realize most scale economies.
Undeniably, this moderate-scale operation will change with technical progress and land system reform in the long run. In addition, when the high operating risk of scale farms and the transaction costs in farmland circulation are considered [44,45,46,47,48], the limited labor and capital in a family farm often cannot support a very large-scale operation. Thus, the estimated moderate farm scale in our research is more applicable to a family farm operating under the current mechanization supply model in China, and the professional agricultural enterprise with stronger operational capability should not be subjected to this limit.
China’s land system with tiny farms is unique, the moderate scale farm in this research is still small compared to the farm scales in North America, Europe, and Australia [49]. However, the results also carried important implications for global grain production, since small farms (less than 2 ha) are dominant in the world. The empirical results indicate that expanding farm size can lead to more efficient mechanization and cost reduction, which is also witnessed in some other developing countries, such as Indonesia and Ghana [4,5]. In response to rising wages, expanding farm scale looks like an effective way to improve grain productivity for Asian and African countries dominated by smallholders.
5.2. Further Discussion Regarding Parcel Level
So far, the discussion about the land parcels has been relatively limited in this study. Indeed, the attributes of the parcels also play significant roles in improving mechanization efficiency. In particular, the parcel area directly promotes the field working performance of machinery and thus decreases the machinery cost, which is an important incentive for the operators to expand the farm and consolidate land.
Based on the household’s largest parcel area and sample size, we divide the sample into 15 groups, and the average parcel area and the PAMSE in each group are calculated. Data in Table 6 show that the PAMSE presents a gradual decline along with a stable increase in the parcel area overall, and this result is consistent with the relation between the farm size and PAMSE. Likely, this result indicates the widespread occurrence of land consolidation in the process of farm expansion in rural China. The Person correlation coefficients between the farm size and parcel area presented in Table 7 provide support for our judgment. The data show that the largest parcel area is positively associated with the farm size in all instances; Significantly, the relation between them is strongest when the farm size is larger than 50 mu (correlation coefficient = 0.6), indicating a considerable motivation to strive for economies of scale.
Indeed, in our previous field surveys, we found that it is common for farmers to increase the land parcel area and reduce the numbers of plots through land exchange in private. In addition, we also found that some exploratory land reforms for a reduction in land fragmentation have been initiated in some places in China. For example, Huaiyuan, a plains county located in the North China plain, carried out the “one parcel for one household program” in 2014, reallocating one integrated land parcel to each household through land consolidation and land exchange at the village level. Through the land parcel union, the average production cost decreased by 60 Yuan/mu, and the household’s income from cropland farming increased by 1300 Yuan in one year on average. Additionally, similar measures are being implemented in other regions, including Henan, Jiangsu, and Hubei. Obviously, as these reforms in farmland allocation progress, the efficiency of agricultural mechanization can be further improved.
5.3. Robustness Checks
We used the national sample to investigate the impact of farm size on the PAMSE in Table 5. Given the differences in crops or regions, we generated two sub-samples, one for maize farms (one of the nationwide crops in China) and another for farms located in the North China plain (one of the main grain production regions in China). We used these two farms samples to test the variation of the coefficients of farm size with a given threshold value of 16. As shown in Table 8, farm size has a negative effect on the PAMSE as well; a nonlinear relation between farm size and the PAMSE is also witnessed in these two farms cases. This evidence suggests that our earlier findings are robust, and the model is effective.
6. Conclusions and Policy Implications
Using the database from the 2015 CRHPS conducted by Zhejiang University, this study investigates the impact of the farm size on the household’s PAMSE. In contrast to previous studies, the contributions made here are that the structural change point of farm size is estimated endogenously instead of by an empirical judgment, and a nonlinear relation between the farm size and PAMSE is examined using a threshold model. Furthermore, we tried to determine the moderate operation scale in China’s grain production from the perspective of mechanization cost. This study lends important insights to recent reforms for farmland systems aimed to promote moderate-scale operations and improve food production efficiency in China.
Our findings suggest that significant multiple threshold effects of farm size exist in the PAMSE, with the farm size being negatively associated with the PAMSE in all cases. Along with farm size expansion, the effect of the farm size is reduced, which follows the law of diminishing marginal utility. In particular, if the farm size exceeds the threshold of 50 mu, a 1 mu increase in the farm size can only lead to a 0.3% decrease in the PAMSE; thus, a farm scale of 50 mu can be viewed as an instructive value to develop family farms with a moderate scale under the current comprehensive mechanization level and farmland system in China. During further analysis regarding land parcels, we found that grain farms are experiencing land consolidation in the process of farm size expansion. Operators of larger farms (i.e., >50 mu), especially, are presenting strong demands to enlarge parcel areas, and this finding provides important evidence that parcel area expansion is a key source of scale economies in machinery utilization.
The results of the study provide important implications for policymaking. First, because of the ubiquitous scale economies of farm size expansion, persistent efforts should be devoted to improving farmland circulation efficiency and developing scale farms. More importantly, governmental supporting policies, such as agricultural subsidies, need to attach more importance to large-scale farms (i.e., >50 mu), because large farm operation is more rationally economic, and results in a strong inclination for land consolidation and efficient operation. Second, since the parcel area directly affects the working efficiency of machinery, full rights should be granted to farmers for the contracted farmland, to enable them to obtain higher returns from land assets. Correspondingly, this also provides lessee households more full rights to implement land consolidation and reduce land fragmentation in the process of farm size expansion.
This study only provides a preliminary discussion regarding the moderate operation scale of grain production from a national perspective. For a lack of detailed data, the moderate operation scale for regions with different terrains and for different crops are not included in this study. Moreover, because the detailed data for each kind of mechanized operation is not available in the database, the PAMSE is calculated by the unit cost for services, including all mechanized operations, which introduced uncertainties. In further research, we will carry out a more detailed survey to enhance our data sources to explore this issue more explicitly. An analysis of moderate operation scale according to local conditions will be strengthened in order to gain more tailored results. In addition, the scarcity of land resources and land fragmentation are more serious in mountainous area in China; therefore, the size of farms in mountainous areas is generally smaller than that in plain areas, and most large farms are located in plain area. The samples used in this study are in line with this regional distribution of farm size. Thus, the samples can be considered as national representatives of the characteristics of farm households, and the issue of sample bias can be ignored.
Author Contributions
Conceptualization, Y.X. and X.L.; Data curation, Y.X.; Formal analysis, Y.X. and X.L.; Funding acquisition, L.X.; Investigation, Y.X. and L.X.; Methodology, Y.X. and Y.W.; Project administration, X.L.; Resources, L.X. and M.T.; Software, Y.X. and Y.W.; Supervision, X.L.; Validation, X.L. and M.T.; Writing—original draft, Y.X.; Writing—review & editing, L.X., X.L. and M.T.
Funding
This research was funded by the National Natural Science Foundation of China (Grant No.41571095) and the Key Deployment Project of Chinese Academy of Sciences (Grant No. ZDBS-SSW-DQC).
Acknowledgments
We thank the Social Science Experiment Center of Zhejiang University for providing the CRHPS data.
Conflicts of Interest
The authors declare no conflict of interest.
References
- Mehta, C.R.; Chandel, N.S.; Senthilkumar, T. Status, Challenges and Strategies for Farm Mechanization in India. Ama-Agric. Mech. Asia Africa Latin Am. 2014, 45, 43–50. [Google Scholar]
- Khan, A.A.; Siddique, G.; Rafiq-ur-Rehman, M.; Ahmed, S.I. Farm Mechanization: Historical Developments, Present Status and Future Trends in Pakistan. Ama-Agric. Mech. Asia Africa Latin Am. 2016, 47, 44–50. [Google Scholar]
- Soni, P. Agricultural Mechanization in Thailand: Current Status and Future Outlook. Ama-Agric.Mech. Asia Afr. Lat. Am. 2016, 47, 58–66. [Google Scholar]
- Yamauchi, F. Rising real wages, mechanization and growing advantage of large farms: Evidence from Indonesia. Food Policy 2016, 58, 62–69. [Google Scholar] [CrossRef] [Green Version]
- Diao, X.S.; Cossar, F.; Houssou, N.; Kolavalli, S. Mechanization in Ghana: Emerging demand, and the search for alternative supply models. Food Policy 2014, 48, 168–181. [Google Scholar] [CrossRef] [Green Version]
- Cai, F.; Wang, M.Y. A counterfactual analysis on unlimited surplus labor in rural China. China World Econ. 2008, 16, 51–65. [Google Scholar] [CrossRef]
- Zhang, X.B.; Yang, J.; Wang, S.L. China has reached the Lewis turning point. China Econ. Rev. 2011, 22, 542–554. [Google Scholar] [CrossRef]
- Chen, Y.Q.; Li, X.B.; Tian, Y.J.; Tan, M.H. Structural change of agricultural land use intensity and its regional disparity in China. J.Geogr. Sci. 2009, 19, 545–556. [Google Scholar] [CrossRef]
- Wang, X.B.; Yamauchi, F.; Huang, J.K. Rising wages, mechanization, and the substitution between capital and labor: Evidence from small scale farm system in China. Agric. Econ. 2016, 47, 309–317. [Google Scholar] [CrossRef]
- Qiao, F.B. Increasing wage, mechanization, and agriculture production in China. China Econ. Rev. 2017, 46, 249–260. [Google Scholar] [CrossRef]
- China Statistical Yearbook. 2017. Available online: http://www.stats.gov.cn/tjsj/ndsj/2017/indexch.htm (accessed on 29 December 2018). (In Chinese)
- Huang, Z.H.; Guan, L.J.; Jin, S.S. Scale farming operations in China. Int. Food Agribus. Manag. Rev. 2017, 20, 191–200. [Google Scholar] [CrossRef]
- Wang, X.B.; Yamauchi, F.; Otsuka, K.; Huang, J. Wage Growth, Landholding, and Mechanization in Chinese Agriculture. World Dev. 2016, 86, 30–45. [Google Scholar] [CrossRef] [Green Version]
- Yang, J.; Huang, Z.H.; Zhang, X.B.; Reardon, T. The rapid rise of cross-regional agricultural mechanization services in China. Am. J. Agric. Econ. 2013, 95, 1245–1251. [Google Scholar] [CrossRef]
- MARA (Ministry of Agriculture and Rural Affairs of the People’s Republic of China). The 13th Five-Year Plan for Agricultural Mechanization Development of China. Available online: http://www.amic.agri.gov.cn/nxtwebfreamwork/detail.jsp?articleId=ff8080815943160b01596c33b8b90be1 (accessed on 29 December 2016).
- Tan, S.H.; Heerink, N.; Qu, F.T. Land fragmentation and its driving forces in China. Land Use Policy 2006, 23, 272–285. [Google Scholar] [CrossRef]
- Chen, X.W. Review of China’s agricultural and rural development: Policy changes and current issues. China Agric. Econ. Rev. 2009, 1, 121–135. [Google Scholar] [CrossRef]
- Tan, M.H.; Robinson, G.M.; Li, X.B.; Xin, L.J. Spatial and temporal variability of farm size in China in context of rapid urbanization. Chin.Geogr. Sci. 2013, 23, 607–619. [Google Scholar] [CrossRef]
- Otsuka, K. Food insecurity, income inequality, and the changing comparative advantage in world agriculture. Agric. Econ. 2013, 44, 7–18. [Google Scholar] [CrossRef]
- Huang, J.K.; Ding, J.P. Institutional innovation and policy support to facilitate small-scale farming transformation in China. Agric. Econ. 2016, 47, 227–237. [Google Scholar] [CrossRef]
- Brown, W.J.; Schoney, R.A. Calculating least-cost machinery size for grain farms using electronic spreadsheets and microcomputers. Can. J. Agric. Econ.-Rev. Can. D Econ. Rural. 1985, 33, 47–65. [Google Scholar] [CrossRef]
- Walford, N. The future size of farms—modeling the effect of change in labor and machinery. J. Agric. Econ. 1983, 34, 407–416. [Google Scholar] [CrossRef]
- Chen, Y.F.; Sun, W.L.; Xue, G.X. Literature comment and theoretical study on the optimum management scale of farmland. China Land Sci. 2015, 29, 8–15. (In Chinese) [Google Scholar] [CrossRef]
- Latruffe, L.; Piet, L. Does land fragmentation affect farm performance? A case study from Brittany, France. Agric. Syst. 2014, 129, 68–80. [Google Scholar] [CrossRef] [Green Version]
- Lu, H.; Xie, H.L.; He, Y.F.; Wu, Z.L.; Zhang, X.M. Assessing the impacts of land fragmentation and plot size on yields and costs: A translog production model and cost function approach. Agric. Syst. 2018, 161, 81–88. [Google Scholar] [CrossRef]
- Gu, T.Z.; Ji, Y.Q.; Zhong, F.N. The sources of economies of scale in China’s agricultural production. Chin. Rural. Econ. 2017, 2, 30–43. (In Chinese) [Google Scholar]
- Chen, X.W. The Reform on Hukou sYstem Will Be Launched by the State Council Soon. Available online: http://finance.sina.com.cn/china/20140614/215819414248.shtml (accessed on 16 June 2014). (In Chinese).
- Qian, K.M.; Peng, T.J. Economic analysis of the moderate scale farmers in food production. Issues Agric. Econ. 2014, 3, 4–7. (In Chinese) [Google Scholar] [CrossRef]
- Rada, N.; Wang, C.G.; Qin, L.J. Subsidy or market reform? Rethinking China’s farm consolidation strategy. Food Policy 2015, 57, 93–103. [Google Scholar] [CrossRef]
- Yang, G.Q.; Hu, L.; Wang, W.X. Moderate scale of farmers’ cultivated land management and its performance: An empirical analysis based on questionnaire survey of rural households in 6 counties in Hubei Province. Resour. Sci. 2015, 33, 505–512. (In Chinese) [Google Scholar]
- Zhang, Q.; Sun, Z.X.; Huang, W. Does land perform well for corn planting? An empirical study on land use efficiency in China. Land Use Policy 2018, 74, 273–280. [Google Scholar] [CrossRef]
- Zeng, S.Y.; Zhu, F.W.; Chen, F.; Yu, M.; Zhang, S.L.; Yang, Y.J. Assessing the Impacts of Land Consolidation on Agricultural Technical Efficiency of Producers: A Survey from Jiangsu Province, China. Sustainability 2018, 10, 2490. [Google Scholar] [CrossRef]
- Mankiw, N.G. Principles of Economics; Liang, X.M., Ed.; Peking University Press: Beijing, China, 1998. [Google Scholar]
- Mosheim, R.; Lovell, C.A.K. Scale Economies and Inefficiency of US Dairy Farms. Am. J. Agric. Econ. 2009, 91, 777–794. [Google Scholar] [CrossRef]
- He, P.F.; Li, J.; Wang, X. Wheat harvest schedule model for agricultural machinery cooperatives considering fragmental farmlands. Comput. Electron. Agric. 2018, 145, 226–234. [Google Scholar] [CrossRef]
- Hansen, B.E. Sample splitting and threshold estimation. Econometrica 2000, 68, 575–603. [Google Scholar] [CrossRef]
- Hansen, B.E. Inference when a nuisance parameter is not identified under the null hypothesis. Econometrica 1996, 64, 413–430. [Google Scholar] [CrossRef]
- Wu, Y.Y.; Xi, X.C.; Tang, X.; Luo, D.M.; Gu, B.J.; Lam, S.K.; Vitousek, P.M.; Chen, D.L. Policy distortions, farm size, and the overuse of agricultural chemicals in China. Proc. Natl. Acad. Sci. USA 2018, 115, 7010–7015. [Google Scholar] [CrossRef]
- Ju, X.T.; Gu, B.J.; Wu, Y.Y.; Galloway, J.N. Reducing China’s fertilizer use by increasing farm size. Glob. Environ. Chang.-Hum. Policy Dimens. 2016, 41, 26–32. [Google Scholar] [CrossRef]
- Watcharaanantapong, P.; Roberts, R.K.; Lambert, D.M.; Larson, J.A.; Velandia, M.; English, B.C.; Rejesus, R.M.; Wang, C.G. Timing of precision agriculture technology adoption in US cotton production. Precis. Agric. 2014, 15, 427–446. [Google Scholar] [CrossRef]
- Ashoori, D.; Allahyari, M.S.; Damalas, C.A. Adoption of conservation farming practices for sustainable rice production among small-scale paddy farmers in northern Iran. Paddy Water Environ. 2017, 15, 237–248. [Google Scholar] [CrossRef]
- Lin, J.Y. Education and innovation adoption in agriculture - evidence from hybrid rice in China. Am. J. Agric. Econ. 1991, 73, 713–721. [Google Scholar] [CrossRef]
- Li, Q.; Huang, J.K.; Luo, R.F.; Liu, C.F. China’s labor transition and the future of China’s rural wages and employment. China World Econ. 2013, 21, 4–24. [Google Scholar] [CrossRef]
- Turvey, C.G.; Kong, R. Business and financial risks of small farm households in China. China Agric. Econ. Rev. 2009, 1, 155–172. [Google Scholar] [CrossRef]
- Huang, J.K.; Wang, Y.J.; Wang, J.X. Farmers’ adaptation to extreme weather events through farm management and its impacts on the mean and risk of rice yield in China. Am. J. Agric. Econ. 2015, 97, 602–617. [Google Scholar] [CrossRef]
- Yang, Z.H.; Mugera, A.W.; Zhang, F. Investigating Yield Variability and Inefficiency in Rice Production: A Case Study in Central China. Sustainability 2016, 8, 787. [Google Scholar] [CrossRef]
- Deininger, K.; Jin, S.Q. The potential of land rental markets in the process of economic development: Evidence from China. J. Dev. Econ. 2005, 78, 241–270. [Google Scholar] [CrossRef]
- Ito, J.; Bao, Z.S.; Ni, J. Land rental development via institutional innovation in rural Jiangsu, China. Food Policy 2016, 59, 1–11. [Google Scholar] [CrossRef]
- Lowder, S.K.; Skoet, J.; Raney, T. The Number, Size, and Distribution of Farms, Smallholder Farms, and Family Farms Worldwide. World Dev. 2016, 87, 16–29. [Google Scholar] [CrossRef] [Green Version]
Figure 1.
Relation between farm size and unit mechanization cost based on theoretical analysis.

Figure 2.
Selected counties in the 2015 China Rural Household Panel Survey.


Table 1.
Per area machinery services expenditures in each farm group.
| Group Range (mua) | Sample Size | Cumulative Percentage (%) | Average Group Size (mu) | The PAMSE (Yuanb/mu) | |||
|---|---|---|---|---|---|---|---|
| Mean | SD | Min | Max | ||||
| (0,1) | 99 | 4.64 | 0.88 | 370.30 | 280.41 | 20.00 | 1000.00 |
| (1,2) | 192 | 13.64 | 1.79 | 272.61 | 182.17 | 20.00 | 750.00 |
| (2,3) | 232 | 24.52 | 2.86 | 204.70 | 149.19 | 19.05 | 666.67 |
| (3,4) | 184 | 33.15 | 3.86 | 170.42 | 119.16 | 20.00 | 500.00 |
| (4,5) | 169 | 41.07 | 4.87 | 162.98 | 106.92 | 20.00 | 460.00 |
| (5,6) | 179 | 49.46 | 5.91 | 139.30 | 93.63 | 25.00 | 416.67 |
| (6,7) | 100 | 54.15 | 6.89 | 148.43 | 91.06 | 21.43 | 414.29 |
| (7,8) | 144 | 60.90 | 7.89 | 152.07 | 111.93 | 20.00 | 500.00 |
| (8,9) | 60 | 63.71 | 8.90 | 114.79 | 77.85 | 22.22 | 333.33 |
| (9,10) | 179 | 72.11 | 9.95 | 133.19 | 90.55 | 20.00 | 400.00 |
| (10,11) | 36 | 73.79 | 10.95 | 117.61 | 68.69 | 18.18 | 272.73 |
| (11,12) | 69 | 77.03 | 11.96 | 110.73 | 69.32 | 20.00 | 291.67 |
| (12,13) | 34 | 78.62 | 12.92 | 148.61 | 74.11 | 43.75 | 307.69 |
| (13,14) | 40 | 80.50 | 13.93 | 103.41 | 55.92 | 25.00 | 229.01 |
| (14,15) | 42 | 82.47 | 14.94 | 104.95 | 61.13 | 20.00 | 281.69 |
| (15,16) | 42 | 84.44 | 15.97 | 92.53 | 69.65 | 18.75 | 290.32 |
| (16,17) | 15 | 85.14 | 16.95 | 103.00 | 55.21 | 29.41 | 181.82 |
| (17,18) | 26 | 86.36 | 17.94 | 130.64 | 82.26 | 27.78 | 333.33 |
| (18,19) | 7 | 86.69 | 18.87 | 105.20 | 46.83 | 43.96 | 157.89 |
| (19,20) | 67 | 89.83 | 20.00 | 101.28 | 66.89 | 20.00 | 300.00 |
| (20,25) | 45 | 91.94 | 23.14 | 85.23 | 46.99 | 20.83 | 222.22 |
| (25,30) | 55 | 94.51 | 28.91 | 91.51 | 60.42 | 20.00 | 266.67 |
| (30,40) | 35 | 96.16 | 37.10 | 87.10 | 38.89 | 25.00 | 175.00 |
| (40,50) | 22 | 97.19 | 47.68 | 62.46 | 31.94 | 20.00 | 130.00 |
| (50,60) | 20 | 98.12 | 58.40 | 64.27 | 37.37 | 18.87 | 150.00 |
| (60,100) | 28 | 99.44 | 79.87 | 72.51 | 40.10 | 26.67 | 200.00 |
| (100,400) | 12 | 100.00 | 192.33 | 37.45 | 10.76 | 18.75 | 55.05 |
| Total | 2133 | 100.00 | 11.36 | 162.53 | 140.23 | 18.18 | 1000.00 |
Notes: a 15 mu = 1 ha; 6.07 mu = 1 acre. b 1 US$ ≈ 6.49 Yuan (31 December 2015).
Table 2.
Definitions and descriptive statistics of explanatory variables.
| Variables | Definition and Measure | Mean | SD |
|---|---|---|---|
| Farm characteristics | |||
| Farm size | Measured by household’s sowing area (mu) | 11.36 | 19.80 |
| Land parcels | Household has more than one parcel of arable land (yes = 1; otherwise = 0) | 0.77 | 0.42 |
| Suitability for machinery | The largest parcel supported large scale mechanical operation (yes = 1; otherwise = 0) | 0.76 | 0.43 |
| Accessibility to tractor road | The largest parcel adjacent to tractor road (yes = 1; otherwise = 0) | 0.71 | 0.45 |
| Land quality | Subjective valuation on the fertility of the household’s largest parcel (very good = 1; good = 2; fair = 3; poor = 4; very poor = 5) | 2.58 | 0.97 |
| Plant type_1 | Household grows rice = 1; otherwise = 0 | 0.17 | 0.38 |
| Plant type_2 | Household grows wheat = 1; otherwise = 0 | 0.05 | 0.21 |
| Plant type_3 | Household grows Maize = 1; otherwise = 0 | 0.28 | 0.45 |
| Plant type_4 | Household grows rice & wheat = 1; otherwise = 0 | 0.03 | 0.17 |
| Plant type_5 | Household grows rice & maize = 1; otherwise = 0 | 0.09 | 0.29 |
| Plant type_6 | Household grows wheat & maize = 1; otherwise = 0 (base group) | 0.36 | 0.48 |
| Plant type_7 | Household grows rice & wheat & Maize = 1; otherwise = 0 | 0.02 | 0.14 |
| Household head characteristics | |||
| Age of head | Age of household head (years) | 53.39 | 10.86 |
| Education of head | Education level of head (1 = Illiterate; 2 = Primary education; 3 = Secondary education; 4 = High school education; 5 = Undergraduate education and above) | 2.69 | 0.91 |
| Health status of head | Self-valuation on body health (healthy = 1; otherwise = 0) | 0.79 | 0.41 |
| Family characteristics | |||
| Agricultural labor force | Agricultural labor force in household (person) | 1.96 | 0.81 |
| Agricultural assets | Total value of agricultural machinery (Yuan) | 2711.86 | 12560.78 |
| Region characteristics | |||
| Terrain | Located in plain county (yes = 1; otherwise = 0) | 0.52 | 0.5 |
| Region_1 | Located in east China (yes = 1; otherwise = 0) (base group) | 0.29 | 0.45 |
| Region_2 | Located in central China (yes = 1; otherwise = 0) | 0.35 | 0.48 |
| Region_3 | Located in west China (yes = 1; otherwise = 0) | 0.23 | 0.42 |
| Region_4 | Located in northeast China (yes = 1; otherwise = 0) | 0.13 | 0.34 |
Table 3.
Endogenous problem test of the farm size using instrumental variable (IV) approach.
| Variable | Log(Per Area Machinery Services Expenditures) | |
|---|---|---|
| OLS | IV | |
| Farm size | −0.009 ***(−5.16) | −0.007 ***(−4.11) |
| Land parcels | −0.008 (−0.20) | −0.011 (−0.29) |
| Suitability for machinery | −0.004 (−0.09) | −0.008 (−0.19) |
| Accessibility to tractor road | 0.042 (1.06) | 0.043 (1.08) |
| Land quality | −0.018 (−1.04) | −0.016 (−0.94) |
| Age of head | −0.001 (−0.51) | −0.001 (−0.47) |
| Education of head | 0.072 ***(4.07) | 0.070 ***(3.93) |
| Health status of head | −0.041 (−1.00) | −0.044 (−1.06) |
| Agricultural labor force | −0.004 (−0.19) | −0.006 (−0.25) |
| Agricultural assets | −0.011 **(−2.31) | −0.014 *** (−2.79) |
| Terrain | −0.016 (−0.44) | −0.019 (−0.54) |
| Region | YES | YES |
| Constant | 4.612 ***(29.54) | 4.609 *** (29.45) |
| Adjusted R2 | 0.152 | 0.150 |
| F | 16.684 | 16.400 |
| Observations | 2133 | 2133 |
| Summary statistics of the first-stage | ||
| Contracted land area | 0.783 ***(4.68) | |
| Robust F | 21.943 | |
| Partial R2 | 0.272 | |
Note: ***, ** indicate significance at 1 and 5 percent respectively. Robust standard errors are shown in parenthesis.
Table 4.
Heteroscedasticity consistent Lagrange Multiplier (LM) test and Chow-test for thresholds.
| LM-Test | Chow-Test | |||
|---|---|---|---|---|
| Threshold Estimate | LM-Test | Bootstrap p-Value | F | Prob> F |
| 3.10 | 45.77 *** | 0.00 | 5.92 ** | 0.02 |
| 6.00 | 78.76 *** | 0.00 | 28.80 *** | 0.00 |
| 16.00 | 148.97 *** | 0.00 | 113.24 *** | 0.00 |
| 24.00 | 38.74 *** | 0.02 | 1.37 | 0.24 |
| 50.00 | 32.74 *** | 0.04 | 3.31 * | 0.07 |
Note: ***, **, * indicate significance at 1, 5, and 10 percent, respectively. Numbers of bootstrap replications are 500 times.
Table 5.
Impact of the farm size on the PAMSE in the different size groups. FS, farm size.
| Variable | Dependent Variable: Log (Per Area Machinery Services Expenditures) | ||||
|---|---|---|---|---|---|
| FS ≦ 3.1 | 3.1 < FS ≦ 6 | 6 < FS ≦ 16 | 16 < FS ≦ 50 | FS > 50 | |
| Farm size | −0.201 *** | −0.062 * | −0.039 *** | −0.015 *** | −0.003 *** |
| (−4.60) | (−1.74) | (−4.17) | (−3.77) | (−3.46) | |
| Land parcels | 0.064 | 0.104 | −0.013 | −0.107 | 0.558 ** |
| (0.80) | (1.43) | (−0.21) | (−1.03) | (2.55) | |
| Suitability for machinery | 0.080 | 0.037 | 0.130 * | −0.222 *** | 0.004 |
| (1.06) | (0.46) | (1.76) | (−1.97) | (−0.01) | |
| Accessibility to tractor road | −0.053 | 0.177 ** | 0.106 | −0.064 | −0.037 |
| (−0.71) | (2.14) | (1.57) | (−0.71) | (−0.23) | |
| Land quality | 0.018 | −0.042 | −0.006 | −0.027 | −0.064 |
| (0.52) | (−1.35) | (−0.21) | (−0.66) | (−0.66) | |
| Age of head | 0.002 | −0.004 | 0.001 | −0.011 *** | −0.001 |
| (0.60) | (−1.44) | (0.35) | (−2.79) | (−0.15) | |
| Education of head | 0.070 ** | 0.090 *** | 0.046 * | 0.020 | 0.089 * |
| (1.98) | (2.74) | (1.67) | (0.42) | (1.85) | |
| Health status of head | −0.108 | 0.046 | 0.016 | −0.115 | 0.271 |
| (−1.32) | (0.65) | (0.24) | (−1.13) | (0.85) | |
| Agricultural labor force | 0.137 *** | 0.023 | −0.022 | −0.056 | −0.211 *** |
| (3.39) | (0.55) | (−0.64) | (−1.27) | (−2.76) | |
| Agricultural assets | 0.027 ** | 0.007 | −0.005 | −0.002 | 0.012 |
| (1.98) | (0.77) | (−0.75) | (−0.26) | (0.60) | |
| Terrain | 0.041 | 0.101 | 0.022 | 0.129 | −0.033 |
| (0.56) | (1.52) | (0.36) | (1.39) | (−0.21) | |
| Plant type | YES | YES | YES | YES | YES |
| Region | YES | YES | YES | YES | YES |
| Constant | 4.783 *** | 4.714 *** | 4.592 *** | 5.713 *** | 4.192 *** |
| (14.12) | (14.53) | (16.93) | (13.43) | (6.33) | |
| Adjusted R2 | 0.120 | 0.064 | 0.042 | 0.101 | 0.278 |
| F | 4.933 | 2.938 | 2.762 | 2.627 | 6.375 |
| Observations | 525 | 530 | 746 | 272 | 60 |
Note: ***,**,* indicate significance at 1, 5, and 10 percent respectively. Robust standard errors are shown in parenthesis. FS represents farm size measured by sowing area.
Table 6.
Statistics of the household’s largest parcel area and the PAMSE in each group.
| Group Range (mua) | Sample Size | Cumulative Percentage (%) | Average Group Size (mu) | The PAMSE (Yuanb/mu) |
|---|---|---|---|---|
| (0,1) | 425 | 19.92 | 0.83 | 238.66 |
| (1,2) | 580 | 47.12 | 1.72 | 162.77 |
| (2,3) | 382 | 65.03 | 2.83 | 151.08 |
| (3,4) | 218 | 75.25 | 3.84 | 139.35 |
| (4,5) | 178 | 83.59 | 4.89 | 122.88 |
| (5,6) | 96 | 88.09 | 5.9 | 135.88 |
| (6,7) | 55 | 90.67 | 6.92 | 132.93 |
| (7,8) | 43 | 92.69 | 7.92 | 121.76 |
| (8,9) | 17 | 93.48 | 8.95 | 96.16 |
| (9,10) | 49 | 95.78 | 9.97 | 101.62 |
| (10,15) | 48 | 98.03 | 12.9 | 112.53 |
| (15,20) | 23 | 99.11 | 18.53 | 75.23 |
| (20,25) | 8 | 99.48 | 23.99 | 85.24 |
| (25,30) | 4 | 99.67 | 29 | 89.58 |
| (30,360) | 7 | 100 | 107.14 | 70.53 |
| Total | 2133 | 100 | 3.83 | 162.53 |
Notes: a 15 mu = 1 ha; 6.07 mu = 1 acre. b 1 US$ ≈ 6.49 Yuan (31December 2015).
Table 7.
Correlation coefficient between the farm size and household’s largest parcel area in each regime.
Table 7.
Correlation coefficient between the farm size and household’s largest parcel area in each regime.
| Farm Size | |||||
|---|---|---|---|---|---|
| Group range | (0,3.1] | (3.1,6] | (6,16] | (16,50] | (50,400] |
| Area of the largest parcel | 0.5134 *** | 0.2843 *** | 0.2623 *** | 0.2551 *** | 0.5837 *** |
Note: *** indicates significance at 1 percent.
Table 8.
Impact of farm size on the PAMSE for representative crop or area.
| Variable | Dependent Variable: Log (Per Area Machinery Services Expenditures) | |||||
|---|---|---|---|---|---|---|
| Maize | Wheat & Maize in North China Plain | |||||
| FS ≦ 16 | FS > 16 | Full Sample | FS ≦ 16 | FS > 16 | Full Sample | |
| Farm size | −0.074 *** | −0.004 *** | −0.007 *** | −0.053 *** | −0.006 *** | −0.012 *** |
| (−6.87) | (−3.03) | (−3.27) | (−5.92) | (−2.29) | (−3.93) | |
| R2_adj | 0.098 | 0.152 | 0.122 | 0.075 | 0.035 | 0.063 |
| F | 4.557 | 28.83 | 5.158 | 4.67 | 2.092 | 3.391 |
| Observations | 474 | 120 | 594 | 477 | 80 | 557 |
Note: *** indicates significance at 1 percent. Robust standard errors are shown in parenthesis. FS represents farm size measured by sowing area. Note that the controlled variables described in Equation 1 are also added into these models; however, the controlled variables are not included in Table 8 due to space limitation.
© 2019 by the authors. Licensee MDPI, Basel, Switzerland. This article is an open access article distributed under the terms and conditions of the Creative Commons Attribution (CC BY) license (http://creativecommons.org/licenses/by/4.0/).
Share and Cite
MDPI and ACS Style
Xu, Y.; Xin, L.; Li, X.; Tan, M.; Wang, Y. Exploring a Moderate Operation Scale in China’s Grain Production: A Perspective on the Costs of Machinery Services. Sustainability 2019, 11, 2213. https://doi.org/10.3390/su11082213
AMA Style
Xu Y, Xin L, Li X, Tan M, Wang Y. Exploring a Moderate Operation Scale in China’s Grain Production: A Perspective on the Costs of Machinery Services. Sustainability. 2019; 11(8):2213. https://doi.org/10.3390/su11082213
Chicago/Turabian StyleXu, Yu, Liangjie Xin, Xiubin Li, Minghong Tan, and Yahui Wang. 2019. "Exploring a Moderate Operation Scale in China’s Grain Production: A Perspective on the Costs of Machinery Services" Sustainability 11, no. 8: 2213. https://doi.org/10.3390/su11082213
Note that from the first issue of 2016, this journal uses article numbers instead of page numbers. See further details here.