Socio-Economic Drivers of Adoption of Small-Scale Aquaculture in Indonesia
by
 , , and
Amy Diedrich
1,2,*, 
Jessica Blythe
3,
Elizabeth Petersen
4,
Epsi Euriga
5,
Anna Fatchiya
6,
Takahiro Shimada
1,7,8 and
Clive Jones
2 1
College of Science and Engineering, James Cook University, Townsville, QLD 4811, Australia
2
Centre for Sustainable Tropical Fisheries and Aquaculture, James Cook University, Townsville, QLD 4811, Australia
3
Environmental Sustainability Research Centre, Brock University, St. Catherine’s, ON L2S 3A1, Canada
4
School of Agriculture and Environment, University of Western Australia, Crawley, WA 6009, Australia
5
Yogyakarta—Magelang Polytechnic in Agricultural Development, Ministry of Agriculture, Jalan Kusumanegara No.2, Yogyakarta 55167, Indonesia
6
Department of Communication and Community Development Sciences, Faculty of Human Ecology IPB, Jalan Kamper Babakan Dramaga, Bogor 16680, Indonesia
7
Queensland Department of Environment and Science, Brisbane, QLD 4102, Australia
8
Australian Institute of Marine Science, Perth, WA 6009, Australia
*
Author to whom correspondence should be addressed.
Sustainability 2019, 11(6), 1543; https://doi.org/10.3390/su11061543
Submission received: 8 February 2019
/
Revised: 9 March 2019
/
Accepted: 11 March 2019
/
Published: 14 March 2019
(This article belongs to the Section Sustainable Agriculture)
Abstract
:Aquaculture has a critical role in achieving the UN’s Sustainable Development Goals of increasing benefits that low-income and least-developed countries derive from marine resources. Its capacity to deliver these outcomes is challenging, particularly for marginalized groups. This is especially true if the introduction of novel technologies is applied with incomplete understanding of socio-economic and bio-physical contexts. We examined what socio-economic factors affect people’s perceptions of adoption of lobster aquaculture in rural households in Indonesia. We used multiple linear regression with model averaging to test the influence of five capital assets (human, social, natural, physical, and financial), including agency, equity, and household sensitivity, on people’s perceived ability to adopt lobster aquaculture. Agency and sensitivity had the greatest influence on the dependent variable. We then used correlation analysis to develop a heuristic model of potential indirect causal mechanisms affecting people’s perceptions of adoption. Our results point to the existence of a ‘sensitivity trap’, where more sensitive or marginalized households are less likely to engage in new economic opportunities. We emphasize the value of multifaceted programs for improving livelihoods, particularly for poorer, more vulnerable households as one way to support the UN’s commitment to using aquaculture as a pathway to achieving sustainable development.
1. Introduction
The global community has committed to increasing the economic benefit that Small Island Developing States and less developed countries derive from marine resources by 2030 [1]. In this context, aquaculture has a critical role to play in the achievement of the UN’s Sustainable Development Goals (SDGs, [2]). In addition to contributing directly to the economic wellbeing of coastal communities (SDG 14), sustainable aquaculture has the potential to help achieve other goals including ending poverty (SDG 1), achieving food security and improved nutrition (SDG 2), promoting sustained, inclusive and sustainable economic growth (SDG 8), and reducing inequalities (SDG 10) [2,3].
Yet, the capacity of aquaculture development to deliver these outcomes is not without challenges, particularly for the marginalized groups often cited as the target of these programs [4]. For small-scale aquaculture programs that aim to benefit the rural poor, socio-economic dynamics shape the potential of aquaculture to deliver on its promised development outcomes [5]. Socio-economic dynamics influence, for example, what aquaculture technologies are available in which communities and to whom [3], how pond products are used or consumed [6,7], and how the decision-making processes related to adoption unfold within communities and households [8]. When ‘one-size-fits-all’ aquaculture projects are implemented by external actors (e.g., donor agencies, non-governmental organizations (NGOs)) with inadequate consideration of the complexity of the socio-economic contexts into which the technologies are inserted, the introduction of aquaculture is likely to be suboptimal, potentially leading to uneven distribution of benefits, a disconnection between benefits and local needs, and disillusionment with the aquaculture industry [9]. To maximize potential benefits for local communities, socio-economic dynamics must become a central component of aquaculture development. Importantly, we argue that engaging with farmers’ perceptions and priorities before projects are designed and implemented is critical [5].
Our research focused on the development of tropical rock lobster aquaculture, which has proven to be a successful and sustainable aquaculture enterprise for coastal communities in central and southern Vietnam [10]. Lobster farming has unique characteristics that provide socio-economic advantages relative to farming of other species. The technology involved is quite simple, as naturally settling post-larval lobsters (pueruli) are captured as the ‘seed’ for farming, and they are nurtured in simple, floating sea cages fabricated with relatively cheap materials [11]. Thus, the capital costs are low. Operating costs are moderate, with relatively high costs for the seed lobsters and the food (primarily fresh seafood), but this is more than offset by the very high value of on-grown lobsters. On this basis, lobster farming represents a low-technology, low-capital option for coastal communities.
Interventions based on the introduction of novel technologies can be prone to malfunction if project implementers lack sufficient understanding of the context into which new innovations are inserted. For example, in Thailand, integrated duck and fish aquaculture was promoted following trials, which suggested it was a technically and economically viable activity [12]. However, the practice was rejected once support for the purchase of poultry feed was withdrawn, because farmers could not afford to purchase feed and the large numbers of eggs produced proved difficult to market locally. Thus, the analysis of the local context conducted during the trials was flawed, leading to a mismatch between the project and the local conditions which ultimately resulted in its collapse [12]. In contrast, when complex socio-ecological contexts inform the design of small-scale aquaculture, these operations can make positive contributions to rural households. For example, in Northwest Bangladesh, the NGO supported Adivasi Fisheries Project, asked project participants to choose one of seven aquaculture options based on their unique contexts and needs [13]. Socially marginalized, landless farmers tended to adopt aquaculture value-chain activities (such as pond-netting or fish/fingerling trading), which led to increased income and food security [13]. Thus, designing locally relevant aquaculture interventions, through close consultation with local farmers, underpins successful programs.
The sustainable livelihoods framework is an established tool that offers a nuanced way of understanding complex rural dynamics [14]. The framework evolved in reaction to rural livelihood evaluations that focused solely on income to encompass basic needs and human rights, and finally to reflect more qualitative understandings that capture peoples’ experiences of poverty and insecurity [15]. The livelihood framework suggests that rural livelihoods are built through five core asset capitals (human, social, natural, physical, and financial) mediated by vulnerability contexts, including shocks, trends, seasonality, and transforming structures such as laws, culture, and institutions [14]. The livelihoods framework has been used to design programs that seek to enhance the contribution of small-scale aquaculture to poverty reduction and improved livelihoods and food security in coastal communities [13].
To date, engagement with the sustainable livelihoods framework has focused largely on the five core assets (human, social, natural, physical, and financial) and less on transforming structures and processes as determinants of livelihood outcomes. While assets offer an important entry point, it is precisely the nuanced engagement with these processes that give the framework its unique explanatory power [16]. Similarly, aquaculture research on the influence of variables such as human agency, perceptions of equity, and social sensitivity has received limited attention in comparison to other socio-economic indicators. An emerging literature highlights these factors as critical barriers to, or enablers of, successful aquaculture development. For example, research shows that inequity can undermine successful aquaculture outcomes when better-off farmers who have the capability to adopt new practices and technologies obtain the majority of benefits [17]. Human agency has been defined in the human development context as the capacity of individuals to exert power over their choices and future [18]. In the context of aquaculture adoption, understanding agency is important because people engage in action (or in this case adoption) if they believe they have the capacity to influence the process and outcomes [19]. On the other hand, people may be reluctant to participate in activities if they perceive their agency to be limited. For example, small-scale aquaculture producers in many parts of the world have found it difficult to participate in formal value chains due to their weak bargaining power with traders [20]. Agency has been identified as important for increasing livelihood resilience [21]. Finally, evidence also shows that intensification of aquaculture could more heavily impact households that are more dependent on natural resources if it increases risks of environmental degradation [22]. Moreover, such households, which have been defined as ‘sensitive’ from a vulnerability perspective, may be less adaptive and therefore less able to engage in emerging opportunities [23]. Thus, we argue that questions regarding the influence of agency, equity, and sensitivity on adoption behaviour remain critical, and largely unanswered.
Given the potential contributions of aquaculture to the realization of multiple SDGs, questions concerning the socio-economic determinants of aquaculture adoption are timely. Understanding adoption behaviour is particularly relevant, since projects that engage new entrants, as opposed to interventions designed to improve existing practices, have the potential to address the exclusion of lower-income and marginalized groups with limited assets [3]. We argue that the success or failure of aquaculture development is predicated on local support, acceptance, and willingness to adopt, which are strongly influenced by perceptions of the activity held by community members. In particular, although the majority of people may perceive a new economic opportunity as attractive, barriers may exist that impede their ability or interest in adopting new activities. Therefore, this paper examines how local households in Indonesia perceive lobster aquaculture. In particular, we ask: What socio-economic factors affect people’s perceptions of the adoption of lobster aquaculture in rural households in Indonesia? We hypothesize that, in addition to the five core assets (human, social, natural, physical, and financial), including agency, equity, and sensitivity adds to our understanding people’s perceived ability to adopt smallholder aquaculture. This study is one of only few that evaluate local perceptions of aquaculture adoption in the context of household access to capital assets, and is novel in its proactive approach (e.g., prior to the entry of a new aquaculture venture). Its novelty also lies in the inclusion of three additional predictor variables within the standard capital-centric sustainable livelihoods model; agency, equity, and sensitivity.
2. Materials and Methods
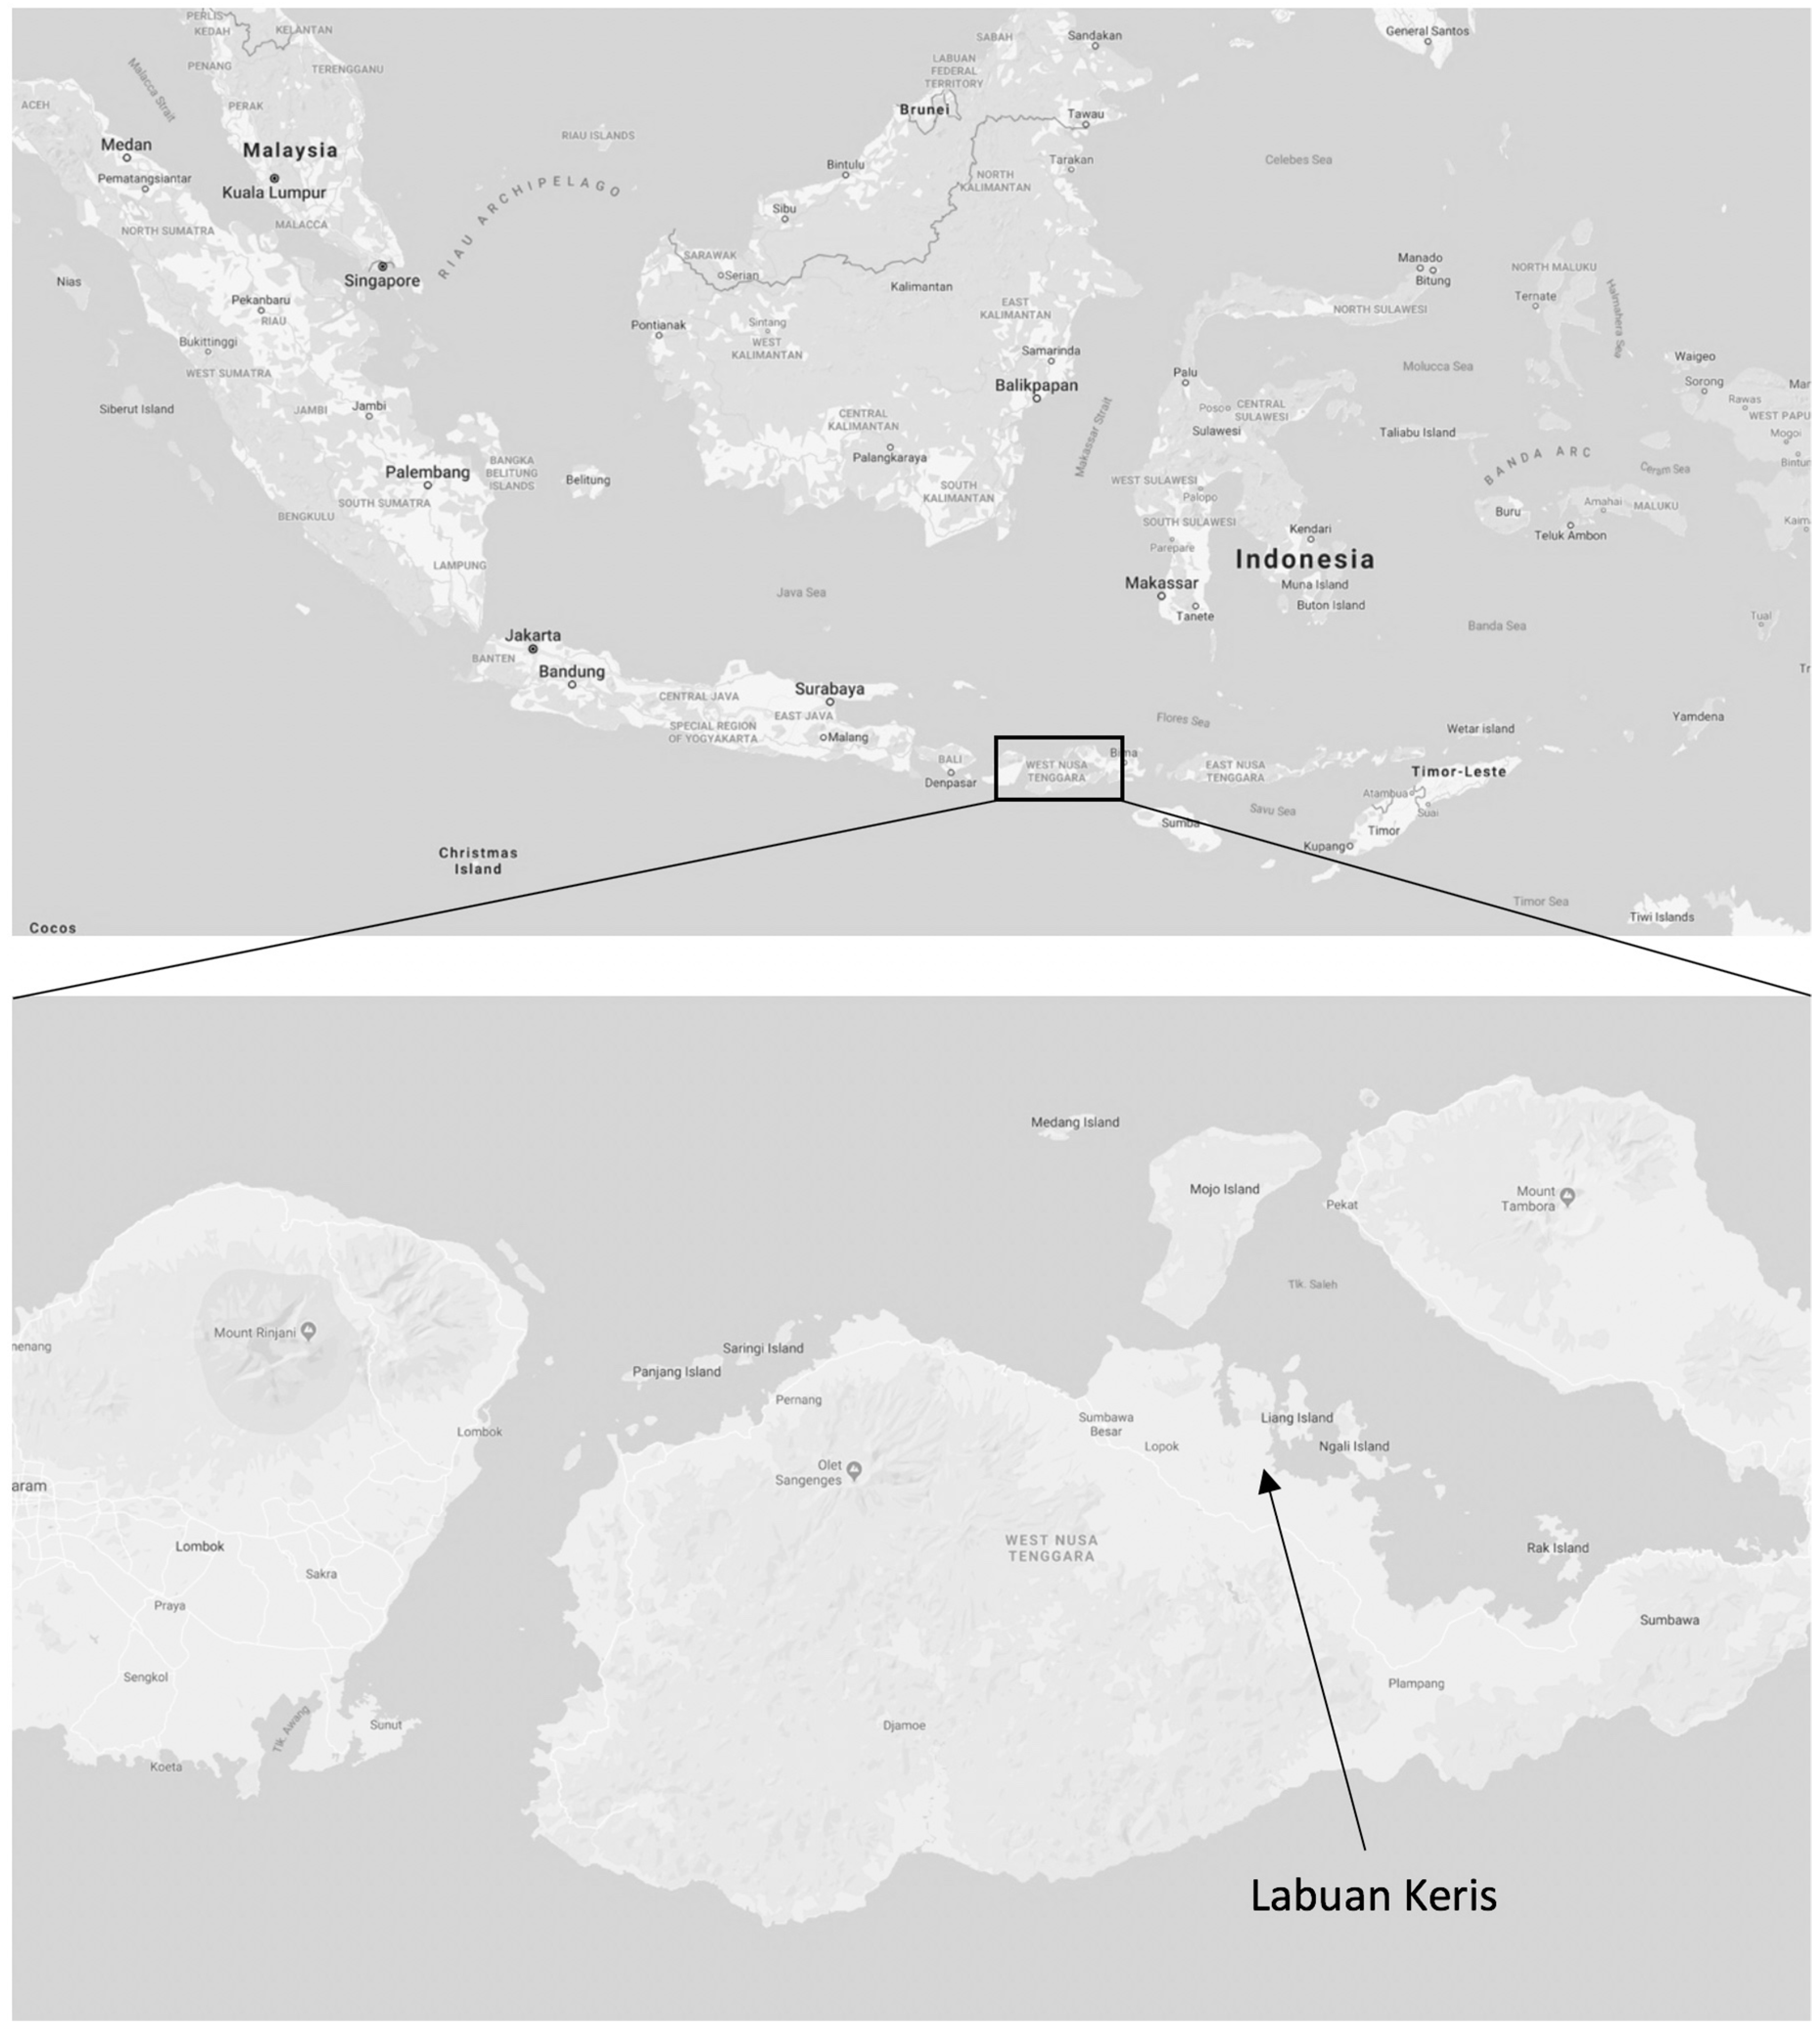
We conducted household-level surveys in December 2016 in Labuan Terata sub-village of Kuris Village (8°33′48.1″ S 117°36′53.5″ E) of the Lape District on Sumbawa Island of Indonesia. The community of Labuan is located close to the proposed lobster farming site in the area between the islands of Pulau Liang and Pulau Ngali in the western part of Teluk Saleh Bay in western Sumbawa (Figure 1). This community was chosen for the study as the most likely to benefit from the establishment of the lobster farm. All subjects gave their informed consent for inclusion before they participated in the study. The study was conducted in accordance with the Declaration of Helsinki, and the protocol was approved by the Ethics Committee of Bogor Agricultural University (IPB), Indonesia, in December 2016.
2.1. Study Site Context: Barriers and Opportunities for Rock Lobster Aquaculture in Indonesia
Aquaculture of rock lobsters (Palinuridae) is a relatively new industry, driven by high demand from the market and very high prices [24]. Almost all rock lobster fisheries across the world are fully exploited or in decline and the only opportunity to increase production is from aquaculture. Although hatchery technology for rock lobsters has not yet been established, natural supply of seed is in some locations sufficient to support farming, in which the naturally settling seed lobsters (pueruli) are captured and then on-grown in sea cages until they reach marketable size [10].
Such rock lobster aquaculture has been successfully established in Vietnam, and the success of that industry has prompted other countries in south-east Asia to attempt to emulate. The on-growing of the ornate lobster, Panulirus ornatus (Fabricius, 1798), has been a successful village-based industry along the central south coast of Vietnam since 1995, based on an abundance of naturally settling lobster seed and the establishment of up to 49,000 lobster sea cages [25]. Production of rock lobster from aquaculture is significant, providing a valuable source of income for small-holders. In 2016, it was estimated to be about 1600 tonnes, worth more than $US120 M [26].
Lobster farming first began in Indonesia around 2004 as a derivative of seaweed and fish culture. In the southeast of the central Indonesian island of Lombok, farmers growing seaweed or grouper noticed pueruli settling on their apparatus. Realizing these were small lobsters, they stocked them in cages to on-grow, and thus the Indonesian lobster farming industry began. Despite relatively high abundance of the naturally settling lobster seed, in the five years to 2009, no more than 50 tonnes of lobster were produced each year due to limited farming skills and nutritionally deficient feed. The primary species in Indonesia is Panulirus homarus (Linnaeus, 1758), and it was typically on-grown (i.e., grown to market size) for less than 12 months to a mean size of around 100 g, fetching a price of around 35,000 Indonesian Rupiah per kg, less than $US30.
Lobster farming in Indonesia continues to develop and evolve, and there is demonstrable evidence that significant expansion through increased production and productivity is possible with appropriate support. Nevertheless, Indonesian lobster farming remains at a developmental stage only, constrained by lack of farming skills and knowledge, limited access to support networks and credit, and incompatible policy and regulatory settings. In particular, the Regulation of the Minister of Maritime Affairs and Fisheries no. 56 of 2016 banned the catch and export of lobster (Panulirus spp.) with the exception of lobster that are (a) not in laying condition, or (b) have a carapace length of above 8 cm or weigh more than 200 g.
In Vietnam, the return per lobster seed captured is >$65 at point of harvest of market-sized lobsters, while in Indonesia this is <$3 because of poor survival, low growth rates and small harvest size [27]. In part this is due to the different species, as P. homarus is of lower market value. Nevertheless, the opportunity for Indonesia remains comparatively strong as P. homarus can be marketed at economically viable price of >$50 at smaller harvest size than that of P. ornatus. Smaller size equates to shorter production time and the potential cash flow and profitability are attractive [28]. Despite this potential, in recent years, Indonesian lobster farmers have largely abandoned grow-out (i.e., grown to market size) altogether in favour of fishing and sale of the seed lobsters, which provides a more immediate cash flow and lower risk.
Lobster farming is a particularly attractive opportunity for Indonesia because capture of seed lobsters and their grow-out involves simple technology, minimal capital and is ideally suited to village-based enterprises. Developing lobster farming in Indonesia will require a focused program to train farmers, transfer technology and provide a support framework that will enable commercial viability and social cohesion. To better understand the requirements and constraints to achieve this, a study was conceived of a community in Sumbawa Besar, adjacent to a proposed lobster farming enterprise. The proposed lobster farm was to be funded by private investors, engaging with the local communities for provision of labour and support services. The concept was that a viable lobster farming business would be established, profitable in its own right, while stimulating further locally owned lobster farming operations in the area, that could feed from and into the central business.
2.2. Survey Instrument
The household-level survey was designed to capture a broad range of socio-economic factors related to people’s livelihoods and, more specifically, their perceptions of the potential adoption of lobster aquaculture. Variables were used to capture objective and subjective data related to people’s access to five capital assets (e.g., physical, financial, natural, social, human), in addition to their perceptions of equity in the community, agency, and household sensitivity. We also collected basic demographic data (e.g., age, education level, gender, main livelihoods) and a checklist of household items and facilities (e.g., electricity, roof material, piped water, etc.) designed to measure the households’ Material Style of Life (MSL).
The survey design was informed by a scoping study conducted in the study community June 2016 [29]. It was translated into the local language, Bahasa, by the research team using a back-translation method and was piloted in the community in July 2016. Bilingual researchers conducted data collection in December 2016. Surveys were implemented face-to-face with heads of households using a convenience sample method (e.g., approaching as many people as possible in their households or in other parts of the village). Our final sample was 64 households (Table 1), which accounted for 16% of the total number of households in the sub-village (n = 400). We distributed 75 surveys in total, which resulted in an 85% response rate.
2.3. Analysis
The data were formatted and analysed using SPSS v.20. In addition to running general exploratory statistics on the survey data, we used R software [30] to model the perceptions of adoption of aquaculture (ADOPT, Table 2) in multiple linear regression as functions of eight composite independent variables (i.e., the five capital assets, agency, equity, and sensitivity, Table 2). Normality, homogeneity of variance and linearity were checked using diagnostic plots. Variance inflation factors (VIF) were calculated among covariates using the R package car [31], and no issue in collinearity was detected: VIF < 2 [32]. We investigated the relative importance of each explanatory variable on the predictability using the model averaging technique [33,34]. First, we used the R package MuMIn [35] to fit and rank all combinations of models based on Akaike Information Criterion (AIC) corrected for small sample sizes (AICc). The models within 6 AICc units of the best-ranked model were considered having some support [36,37] and retained for model averaging. The relative variable importance values (RVI), calculated through model averaging, were then used to estimate the relative importance of each predictor on the response. Our regression analysis achieved a power of 0.91 to detect a large effect (effect size: f2 = 0.35 [38]. There is 50% or greater chance that medium (f2 = 0.15) to small (f2 = 0.02) effects were not detected by our regression analysis due to the small sample size.
3. Results
3.1. Village Livelihoods and Material Style of Life
Sixty-one percent of household heads were engaged in more than one income-generating activity. The most important household activities were farming (48% of households) and fishing (34% of households), indicating a relatively high dependence on natural resources in the village. The average net income per household in Indonesia is IDR22.7 million/year (approximately equivalent to USD1680/year at the time this paper was written. Income averages obtained from Bank of Indonesia, 2017 averages). Table 3 shows the most common income-generating activities of all family members including adults and children. Raising fish in ponds, fishing, farming and trading are the most lucrative of these activities, with net annual income of IDR25 million/year, IDR17 million/year, IDR16 million/year and IDR15 million/year, respectively. The net annual income of farm workers was substantially lower than that of these activities at IDR9.6 million/year. All these activities compared poorly with the average net wage in Indonesia (IDR32 million/year) and the average net wage of agricultural sector employees (IDR21 million/year). Survey data suggested that farm workers worked on average 30 days/year for a total of IDR1.1 million/year. Hence, it is a secondary off-farm income-generating activity. Depending on other income-generating commitments, they may be flexible and provide time for a new enterprise such as an aquaculture activity.
Village livelihoods show moderate levels of subsistence, as shown in Table 4, where 10% of households consume more than 50% of their production. Thirteen percent of the respondents were from households that owned land (average of 0.7 ha, SD 1.0) and 47% rented land (average 0.1 ha, SD 0.3). The average number of people in respondent’s household was 4 (SD 1.59). The survey included a checklist of household items and facilities (e.g., electricity, roof material, piped water, etc.) designed to measure material style of life (MSL) of each household. All households had access to electricity, while only 38% had piped water. Seventy percent had access to a motorcycle for transportation and 33% had access to a boat. Thirty-seven percent of households were constructed from brick or cement, with the remainder consisting of more traditional materials such as bamboo or wood.
With low current earnings, moderate levels of subsistence, and low levels of land ownership and infrastructure, any new profitable business opportunity would be of economic benefit to local community members. Furthermore, the profit threshold for any business opportunity to be viable in this local economy is likely to be low.
3.2. Perceptions of Aquaculture
Just over half of respondents (53%) strongly agreed that at least one person in their household would like to be involved in lobster farming in their village, with the remainder (all except one person who slightly disagreed) expressing some level of agreement (40%) or neutrality (6%). The most commonly desired roles associated with the activity were aquaculture (44%) and nursing (21%). Fifty-one percent of respondents thought it would be ‘easy’ or ‘very easy’ to become involved. Those who thought it would be difficult said it was because of lack of experience, lack of natural resource support, low education, and time management, but were confident that these difficulties could be overcome with training. Eighty-three percent of the respondents agreed (range from strongly agree to slightly agree) that the benefits of lobster farming would be shared equally in their community, with the remainder expressing a neutral response as opposed to disagreement. For those who less than strongly agreed (49%), they mostly perceived the main beneficiaries would be fishers, people who were directly involved in the venture, unemployed people, and the village government.
When asked what could be done to ensure the most positive outcomes for lobster farming in the community, the main activities that were cited (e.g., >10% of respondents) were engagement of community members in planning new developments, and awareness raising and capacity building where required (53%), and making businesses socially accountable in their activities (e.g., Corporate Social Responsibility, 13%). Other less frequently cited measures included profitability and high salary, market availability, financial security, and making it attainable to people in the village.
3.3. Influence of the Independent Variables on Perceptions of Ease of Adoption (ADOPT)
Mean values for our ordinal response variables (10-point scale) were 7.8 for social capital (range 4–10, SD 1.6), 7.7 for agency (range 5–10, SD 1.3), and 6.9 (range 3–10, SD 1.8). The model selection process generated the following equation: (ADOPT) = 0.128 + 0.679(AGENCY) − 0.425(SENS) + 0.217(EQUITY) + 0.317(FINCAP) − 0.114(SOCAP) − 0.218(HUMCAP) + 0.514(NATCAP) + 0.059(PHYCAP). The process ranked a total of 256 combinations of models by AICc and resulted in 55 candidate models. Most of the candidate models included Agency and Sensitivity as covariates (Table 5). The model that only used the five capital assets was ranked on the 255th and was 19.86 AICc units greater than the best ranked model. Through model averaging, the highest RVI values were estimated for Agency (0.94) followed by Sensitivity (0.81). Higher ADOPT was related to higher Agency, while lower Sensitivity was associated with higher ADOPT. The other explanatory variables had much lower RVI values (Table 5), indicating very small influence to predict ADOPT.
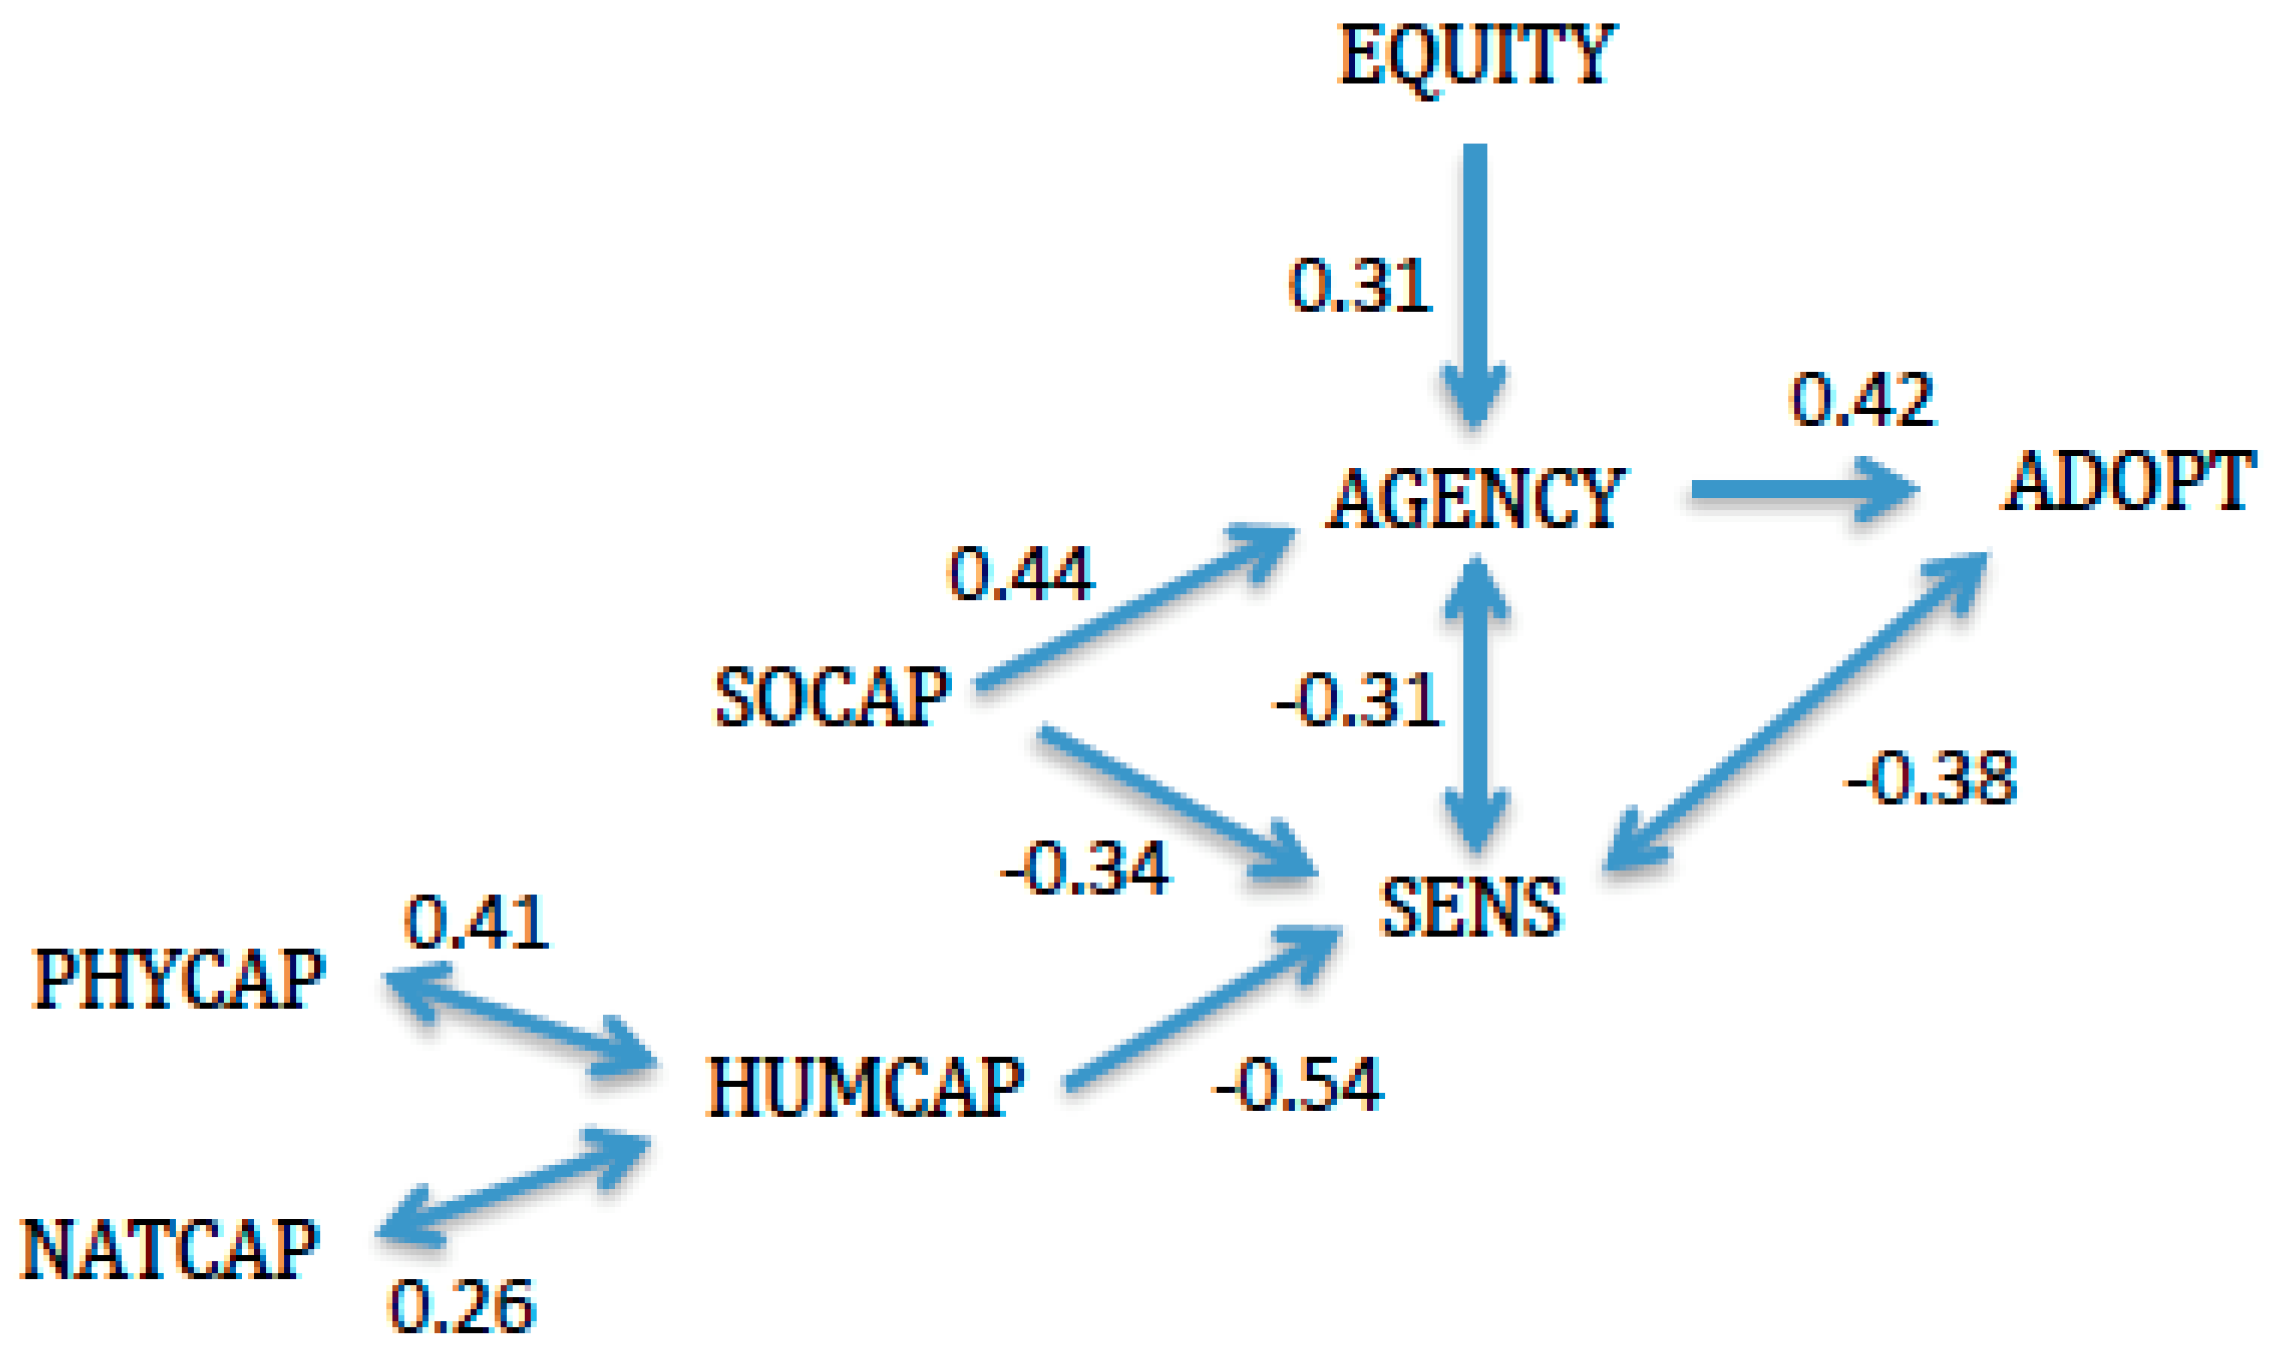
We developed a heuristic, causal model to that shows the indirect or proximal drivers of ADOPT using the correlations in Table 6 (Figure 2). In the following section, we draw on the scientific literature and our experience of the research setting to discuss potential mechanisms to explain the proposed model (e.g., [44]).
4. Discussion and Conclusions
As one would expect in a village with relatively low material assets and limited access to new economic opportunities, the vast majority of households indicated they would be interested in taking up lobster farming. Involvement in lobster farming represents a new economic and livelihood diversification opportunity, which is likely to be an attractive prospect for most people. Despite their interest, however, barriers exist that limit adoption prospects for some households. We explored the influence of the five capital assets commonly used to evaluate sustainable livelihoods, in addition to agency, equity, and household sensitivity in predicting how easy (or difficult) people perceived the adoption of lobster aquaculture (ADOPT) in a rural village in Sumbawa, Indonesia. Roughly half of the sampled households considered that it would be relatively easy, and the results of the model averaging exercise showed that sensitivity and agency had the strongest relationship with ADOPT (negative and positive correlations respectively). The other independent variables also featured in the model, albeit with much lower levels of ‘importance’ from a statistical perspective (Table 5). This suggests the potential that more complex, indirect mechanisms affected the influence of less ‘important’ variables on the independent variable. We proposed a heuristic model based on observed correlations between the variables that may help to identify these indirect relationships (Figure 2). In the following paragraphs, we explain potential theoretical mechanisms driving the linear and heuristic models, including their applied relevance for small-scale aquaculture development.
4.1. Understanding the Role of Agency and the ‘Sensitivity Trap’
Logically, it makes sense that people’s perceived ability to pursue valued goals (i.e., agency) influenced how easy they thought the uptake of lobster farming would be. Agency has been identified as a mediating factor for the conversion of household assets to new livelihoods [45] and has been a central focus of households-scale livelihoods approaches [16]. Agency has also been identified as a key characteristic of livelihood resilience [21]. Although its importance is well established, less is known about the household-level mechanisms that reinforce or restrict agency in the livelihood transformation process. Our heuristic model suggests three key mechanisms influenced perceptions of agency and, hence, perceptions of adoption: (1) More sensitive households tended to have lower agency, making it harder for them to adopt; (2) those who perceived a more equitable community had higher agency, making it easier for them to adopt; and (3) households with higher social capital had higher agency and may also be less sensitive, making it easier for them to adopt.
Household sensitivity was negatively correlated with ADOPT, and the pathways illustrated in our heuristic model reflect an inherent ‘sensitivity trap’, or negative feedback loop. Conceptually, this aligns with the notion of a ‘poverty trap’, a self-reinforcing mechanism that keeps people, households, or communities below a certain asset threshold [46]. More sensitive households are more dependent on natural resources and generally have lower economic diversification, making them more vulnerable to environmental degradation [23]. Our results suggest that these households are also likely to possess lower human and social capitals, which further limits their potential to adopt, both directly and via a limited sense of agency. The ‘trap’ exists in that failure to gain agency and adopt new economic opportunities is likely to maintain them in a sensitive and vulnerable state. Furthermore, in our model, the influence of equity on agency also suggests that more marginalized households are less likely to feel empowered to adopt, further exacerbating the issue that those households with potentially the greatest need for livelihood diversification are the least likely to engage in new opportunities. It has been established that inequality can perpetuate poverty [47] and the literature also points to the co-occurrence of lack of alternative livelihoods with inequality [46]. Thus, there is a paradox in that if not accessible to more marginalized members of communities, new economic opportunities can create issues of inequality (thus undermining social resilience) while also having the potential to build resilience through diversifying livelihoods and increasing financial capital [48]. A sense of agency can help overcome this paradox by allowing more sensitive or marginalized households to channel assets into new economic opportunities [45].
It has been established that asset levels alone do not define the more vulnerable households in a community [45]. Where the negative relationship between human capital and sensitivity, including its mutually reinforcing relationship with physical and natural capitals supports asset-driven approaches to economic development, there is also an important mediating role for social capital in increasing the agency of sensitive households (Figure 2). The importance of social capital for livelihoods can be accentuated for populations with limited or negligible access to physical and financial capital [49,50] and our results correspond with a growing body of literature suggesting that social capital is crucial in early stages of development, as it helps to facilitate livelihood adaptation [51,52,53]. It is also important to note that our financial capital variable is absent from the heuristic model because, despite being the fourth most ‘important’ variable in the liner model, it did not correlate directly with any other variables. This suggests the presence of other mediating factors that we failed to measure in our model and presents an important facet to be explored in future research. Moreover, our models did not account for external, broader-scale threats to successful lobster farming. Given that our heuristic causal model was developed post facto, it does not lend itself to further statistical tests. However, this model could be further developed through further research using additional datasets and tested statistically using methods such structural equation modelling [54]. This would allow for more concrete conclusions and complexity related to out hypothesized causal pathways. It is also important that future research in this area takes into account higher-scale political, economic and governance processes that have an impact on adoption at the local scale [16].
4.2. Implications for Small-Scale Lobster Aquaculture Development
Engaging more vulnerable households in aquaculture development is a complex process that requires a potentially longer-term commitment than traditional asset-driven approaches. In addition, it requires a detailed understanding of community social dynamics, including issues of equity, prior to the introduction of aquaculture or any other livelihood opportunity. Furthermore, the community’s emphasis on engagement and social responsibility as being more important than the potential for financial gains for achieving local benefits from aquaculture indicates a recognition within the community that participation and equity are important. The need for capacity building to increase human capital was also expressed by those individuals who perceived lack of training as a potential barrier to adoption. However, studies have pointed out that more subsistence level households may be limited in the amount of time that skilled laborers can dedicate to new economic activities, meaning that simply providing them with training and material assets may not be enough to pull them out of the sensitivity trap [45,55]. It has even been suggested that increasing assets without considering other facets of poverty can actually lead to degradation of natural and cultural resources [22]. In addition, although the poverty-equity connection is complex and non-linear, paying attention to the distribution of power, assets in new aquaculture initiatives is particularly crucial to ensuring adoption and long-term sustainability in rural communities [43].
Our results point to the value of multifaceted programs for improving livelihoods, particularly for poorer, more vulnerable households. Banerjee et al. [56] suggested the potential that providing extra support to such households could also have more nuanced psychological benefit, whereby households felt supported by society, hence providing them with more confidence in their ability to control their future wellbeing. Thus, complementing asset building with extra measures to ensure sensitive and marginalized households are involved in community discussions and training activities could help to mitigate damaging negative feedbacks that maintain them in a state of sensitivity. Maintaining strong local cohesion and social dynamics will contribute to the long-term sustainability of lobster aquaculture in our study community and other comparable locations [4], given the critical role of social capital in collective management of natural resources [57].
Although our results are limited, in that they pertain to a relatively small sample of households in one community, they demonstrate a theoretically grounded argument for incorporating socio-economic considerations, and specific consideration of marginalized households, when developing aquaculture in vulnerable resource dependent populations. If left unchecked, failure to consider the specific limitations that more vulnerable members of communities have in accessing new economic opportunities, including the potential for these limitations to maintain them in a state of vulnerability is likely to jeopardize the UN commitment to using aquaculture as a pathway to achieving sustainable development.
Author Contributions
Conceptualization A.D., E.P., J.B., A.F., E.E., T.S., C.J.; methodology, A.D., E.P., J.B., A.F., E.E.; formal analysis, E.E., A.D., T.S.; investigation, E.E., A.F.; data curation, E.E., A.D.; writing—original draft preparation, A.D., J.B., E.P., C.J.; writing—review and editing, A.D., J.B., E.P., C.J.; funding acquisition, C.J.
Funding
This research was funded by the Australian Centre for International Agricultural Research (ACIAR) project (FIS/2014/059).
Acknowledgments
We extend sincere appreciation to the residents of Labuan Kuris Village for their participation in the survey, Samsul Bahrawi for his support in the scoping and implementation of the fieldwork, and to the late Rina Oktaviani for her contributions to the conceptual development of this research.
Conflicts of Interest
The authors declare no conflict of interest. The funders had no role in the design of the study; in the collection, analyses, or interpretation of data; in the writing of the manuscript, or in the decision to publish the results.
References
- United Nations. Transforming Our World: The 2030 Agenda for Sustainable Development; A/RES/70/1, 21 October; United Nations: San Francisco, CA, USA, 2015. [Google Scholar]
- Food and Agricultural Organization (FAO). The 2030 Agenda and the Sustainable Development Goals: The Challenge for Aquaculture Development and Management; Food and Agricultural Organization: Rome, Italy, 2017. [Google Scholar]
- Belton, B.; Little, D.C. Immanent and interventionist inland Asian aquaculture development and its outcomes. Dev. Policy Rev. 2011, 29, 459–484. [Google Scholar] [CrossRef]
- Krause, G.; Brugere, C.; Diedrich, A.; Ebeling, M.W.; Ferse, S.; Mikkelsen, E.; Perez, J.; Stead, S.; Stybel, N.; Troell, M. A revolution without people? Closing the people-policy gap in aquaculture development. Aquaculture 2015, 447, 44–55. [Google Scholar] [CrossRef]
- Morgan, M.; Terry, G.; Rajaratnam, S.; Pant, J. Socio-cultural dynamics shaping the potential of aquaculture to deliver development outcomes. Rev. Aquacult. 2017, 9, 317–325. [Google Scholar] [CrossRef]
- Kawarazuka, N.; Béné, C. The potential role of small fish species in improving micronutrient deficiencies in developing countries: Building evidence. Public Health Nutr. 2011, 14, 1927–1938. [Google Scholar] [CrossRef] [PubMed]
- Golden, C.D.; Seto, K.L.; Dey, M.M.; Chen, O.L.; Gephart, J.A.; Myers, S.S.; Smith, M.; Vaitla, B.; Allison, E.H. Does Aquaculture Support the Needs of Nutritionally Vulnerable Nations? Front. Mar. Sci. 2017, 4, 159. [Google Scholar] [CrossRef]
- Blythe, J.; Sulu, R.; Harohau, D.; Week, R.; Schwarz, A.M.; Mills, D.; Phillips, M. Social dynamics shaping the diffusion of sustainable aquaculture innovations in the Solomon Islands. Sustainability 2017, 9, 126. [Google Scholar] [CrossRef]
- High Level Panel of Experts (HLPE). Sustainable Fisheries and Aquaculture for Food Security and Nutrition. A Report by the High Level Panel of Experts on Food Security and Nutrition of the Committee on World Food Security; Food and Agricultural Organization: Rome, Italy, 2014. [Google Scholar]
- Jones, C.M. Tropical rock lobster aquaculture development in Vietnam, Indonesia and Australia. J. Mar. Biol. Assoc. India 2010, 52, 304–315. [Google Scholar]
- Petersen, E.H.; Phuong, T.H. Tropical spiny lobster (Panulirus ornatus) farming in Vietnam—Bioeconomics and perceived constraints to development. Aquacult. Res. 2010, 41, 634–642. [Google Scholar] [CrossRef]
- Little, D.C.; Edwards, P. Integrated Livestock-Fish Farming Systems. Inland Water Resources and Aquaculture Service Animal Production Service; Food and Agricultural Organization: Rome, Italy, 2005. [Google Scholar]
- Pant, J.; Barman, B.K.; Murshed-E-Jahan, K.; Belton, B.; Beveridge, M. Can aquaculture benefit the extreme poor? A case study of landless and socially marginalized Adivasi (ethnic) communities in Bangladesh. Aquaculture 2014, 418, 1–10. [Google Scholar] [CrossRef] [Green Version]
- Scoones, I. Sustainable Rural Livelihoods: A Framework for Analysis; IDS Working Paper 72; Institute for Development Studies: Sussex, UK, 1998. [Google Scholar]
- Allison, E.H.; Horemans, B. Putting the principles of the sustainable livelihoods approach into fisheries development policy and practice. Mar. Policy 2006, 30, 757–766. [Google Scholar] [CrossRef]
- Scoones, I. Livelihoods perspectives and rural development. J. Peasant Stud. 2009, 36, 171–196. [Google Scholar] [CrossRef] [Green Version]
- Belton, B.; Haque, M.M.; Little, D.C. Certifying catfish in Vietnam and Bangladesh: Who will make the grade and will it matter? Food Policy 2011, 36, 289–299. [Google Scholar] [CrossRef]
- Brown, K.; Westaway, E. Agency, capacity, and resilience to environmental change: Lessons from human development, well-being, and disasters. Annu. Rev. Environ. Resour. 2011, 36, 321–342. [Google Scholar] [CrossRef]
- Van Zomeren, M.; Postmes, T.; Spears, R. Toward an integrative social identity model of collective action: A quantitative research synthesis of three socio-psychological perspectives. Psychol. Bull. 2008, 134, 504–535. [Google Scholar] [CrossRef] [PubMed]
- Pomeroy, R.; Navy, H.; Ferrer, A.J.; Purnomo, A.H. Linkages and Trust in the Value Chain for Small-scale Aquaculture in Asia. J. World Aquacult. Soc. 2017, 48, 542–554. [Google Scholar] [CrossRef]
- Tanner, T.; Lewis, D.; Wrathall, D.; Bronen, R.; Cradock-Henry, N.; Huq, S.; Lawless, C.; Nawrotzki, R.; Prasad, V.; Rahman, M.A.; et al. Livelihood resilience in the face of climate change. Nat. Clim. Chang. 2014, 5, 23–26. [Google Scholar] [CrossRef]
- Blythe, J.; Flaherty, M.; Murray, G. Vulnerability of coastal livelihoods to shrimp farming: Insights from Mozambique. Ambio 2015, 44, 275–284. [Google Scholar] [CrossRef]
- Cinner, J.E.; Huchery, C.; Darling, E.S.; Humphries, A.T.; Graham, N.A.J.; Hicks, C.C.; Marshall, N.; McClanahan, T.R. Evaluating social and ecological vulnerability of coral reef fisheries to climate change. PLoS ONE 2013, 8, e74321. [Google Scholar] [CrossRef] [PubMed]
- Jones, C.M. Progress and obstacles in establishing rock lobster aquaculture in Indonesia. Bull. Mar. Sci. 2018, 94, 1223–1233. [Google Scholar] [CrossRef]
- Hung, L.V.; Tuan, L.A. Lobster seacage culture in Vietnam. In Spiny lobster aquaculture in the Asia-Pacific region, Proceedings of the an International Symposium, Nha Trang, Vietnam, 9–10 December 2008; Williams, K.C., Ed.; Australian Centre for International Agricultural Research: Canberra, Australia, 2009; pp. 10–17. [Google Scholar]
- Anh Tuan, L.; Nha Trang University, Vietnam. Personal communication, 2017.
- Jones, C.M. Spiny lobster Aquaculture Development in Indonesia, Vietnam and Australia. In Proceedings of the International Lobster Aquaculture Symposium, Lombok, Indonesia, 22–25 April 2014; Australian Centre for International Agricultural Research (ACIAR): Canberra, Australia, 2015. [Google Scholar]
- Petersen, E.H.; Jones, C.; Priyambodo, B. Bioeconomics of spiny lobster farming in Indonesia. Asian J. Agric. Dev. 2013, 10, 25–39. [Google Scholar]
- Arksey, H.; O’Malley, L. Scoping studies: Towards a Methodological Framework. Int. J. Soc. Res. Methodol. 2005, 8, 19–32. [Google Scholar] [CrossRef]
- R Core Team. R: A Language and Environment for Statistical Computing (Version v. 3.4.3); R Foundation for Statistical Computing: Vienna, Austria, 2017. [Google Scholar]
- Fox, J.; Weisberg, S. An R Companion to Applied Regression, 2nd ed.; SAGE Publications, Inc.: Thousand Oaks, CA, USA, 2011. [Google Scholar]
- Zuur, A.F.; Ieno, E.N.; Elphick, C.S. A protocol for data exploration to avoid common statistical problems. Methods Ecol. Evol. 2010, 1, 3–14. [Google Scholar] [CrossRef]
- Richards, S.; Whittingham, M.; Stephens, P. Model selection and model averaging in behavioural ecology: The utility of the IT-AIC framework. Behav. Ecol. Sociobiol. 2011, 65, 77–89. [Google Scholar] [CrossRef]
- Symonds, M.E.; Moussalli, A. A brief guide to model selection, multimodel inference and model averaging in behavioural ecology using Akaike’s information criterion. Behav. Ecol. Sociobiol. 2011, 65, 13–21. [Google Scholar] [CrossRef]
- Barton, K. MuMIn: Multi-Model Inference (R Package v. 1.15.6). Available online: https://cran.r-project.org/package=MuMIn (accessed on 28 August 2018).
- Richards, S.A. Testing ecological theory using the information-theoretic approach: Examples and cautionary results. Ecology 2005, 86, 2805–2814. [Google Scholar] [CrossRef]
- Richards, S.A. Dealing with overdispersed count data in applied ecology. J. Appl. Ecol. 2008, 45, 218–227. [Google Scholar] [CrossRef]
- Cohen, J. Statistical Power Analysis for the Behavioral Sciences, 2nd ed.; Routledge: London, UK, 1988. [Google Scholar]
- Blalock, H.M. Causal Models in the Social Sciences; Aldine Publishing Company: Chicago, IL, USA, 1971. [Google Scholar]
- Asher, H.B. Causal Modeling; Sage Publications: Beverly Hills, CA, USA, 1976. [Google Scholar]
- Department for International Development (DFID). Sustainable Livelihoods Guidance Sheets; DFID: London, UK, 1999.
- Alkire, S.; Deneulin, S. A normative framework for development. In An Introduction to the Human Development and Capability Approach; Deneulin, S., Shahani, L., Eds.; Earthscan: London, UK, 2009; pp. 3–21. [Google Scholar]
- McDermott, M.; Mahanty, S.; Schreckenberg, K. Examining equity: A multidimensional framework for assessing equity in payments for ecosystem services. Environ. Sci. Policy 2013, 33, 416–427. [Google Scholar] [CrossRef] [Green Version]
- Pollnac, R.B.; Seara, T. Factors influencing the success of Marine Protected Areas in the Visayas, Philippines as related to increasing protected area coverage. Environ. Manag. 2011, 47, 584–592. [Google Scholar] [CrossRef]
- Anderson, B. Converting Asset Holdings into Livelihood: An Empirical Study on the Role of Household Agency in South Africa. World Dev. 2012, 40, 1394–1406. [Google Scholar] [CrossRef] [Green Version]
- Haider, L.J.; Boonstra, W.J.; Peterson, G.D.; Schluter, M. Traps and Sustainable Development in Rural Areas: A Review. World Dev. 2018, 101, 311–321. [Google Scholar] [CrossRef]
- Green, M.; Hulme, D. From correlates and characteristics to causes: Thinking about poverty from a chronic poverty perspective. World Dev. 2005, 33, 867–879. [Google Scholar] [CrossRef]
- Adger, W.N.; Kelly, P.M.; Winkels, A.; Quang Huy, L.; Locke, C. Migration, remittances, livelihood trajectories, and social resilience. Ambio 2002, 31, 358–366. [Google Scholar] [CrossRef]
- Allison, E.H.; Ellis, F. The livelihoods approach and management of small-scale fisheries. Mar. Policy 2001, 25, 377–388. [Google Scholar] [CrossRef]
- Blythe, J.; Murray, G.; Flaherty, M. Strengthening threatened communities through adaptation: Insights from coastal Mozambique. Ecol. Soc. 2014, 19, 6. [Google Scholar] [CrossRef]
- O’Garra, T. Supplementary Livelihood Options for Pacific Island Communities: A Review of Experiences; Foundation of the Peoples of the South Pacific International: Suva, Fiji, 2007. [Google Scholar]
- Curry, G.; Koczberski, G. Development implications of the engagement with capitalism: Improving the social returns of development. In Engaging with Capitalism: Cases from Oceania; McCormack, F., Barclay, K., Eds.; Emerald Group Publishing Ltd.: Bingley, UK, 2013; pp. 335–352. [Google Scholar]
- Diedrich, A.; Benham, C.; Pandihau, L.; Sheaves, M. Social capital plays a central role in transitions to sportfishing tourism in small-scale fishing communities in Papua New Guinea. Ambio 2018. [Google Scholar] [CrossRef]
- Loehlin, J.C.; Beaujean, A.A. Latent Variable Models: An Introduction to Factor, Path and Structural Equation Analysis; Routledge: London, UK, 2017. [Google Scholar]
- Lade, S.J.; Haider, L.J.; Engstrom, G.; Schluter, M. Resilience offers escape from trapped thinking on poverty alleviation. Sci. Adv. 2017, 3, e1603043. [Google Scholar] [CrossRef] [Green Version]
- Banerjee, A.; Duflo, E.; Goldberg, N.; Karlan, D.; Osei, R.; Pariente, W.; Shapiro, J.; Thuysbaert, B.; Udry, C. A multifaceted program causes lasting progress for the very poor: Evidence from six countries. Science 2015, 348, 6236. [Google Scholar] [CrossRef]
- Ostrom, E. A general framework for analyzing sustainability of social-ecological systems. Science 2009, 325, 419–422. [Google Scholar] [CrossRef]
Figure 1.
Location of the study village, Labuan Kuris Village, in the Lape District of Sumbawa Island in West Nusa Tenggara, Indonesia. Map image from Google Maps 2019.
Figure 1.
Location of the study village, Labuan Kuris Village, in the Lape District of Sumbawa Island in West Nusa Tenggara, Indonesia. Map image from Google Maps 2019.

Figure 2.
Heuristic model linking ADOPT to proximate variables. Lines with arrowheads indicate proposed causal relationships and feedbacks. The strength of the relationship is indicated by the correlation coefficient next to the line.
Figure 2.
Heuristic model linking ADOPT to proximate variables. Lines with arrowheads indicate proposed causal relationships and feedbacks. The strength of the relationship is indicated by the correlation coefficient next to the line.


Table 1.
Characteristics of household-level survey respondents (N = 64).
| Respondent Characteristic | Category | Percent 1 |
|---|---|---|
| Gender | Female | 23 |
| Male | 77 | |
| Age | 21–30 | 12 |
| 31–40 | 30 | |
| 41–50 | 44 | |
| >50 | 14 | |
| Education Level (years of schooling) | None | 1 |
| 1–6 years | 44 | |
| 7–9 | 11 | |
| 10–12 | 7 | |
| Bachelor | 1 |
1 Some do not add up to 100 due to missing responses.
Table 2.
Variables used in the multiple linear regression.
| Variable | Definition | Variables | Measurement |
|---|---|---|---|
| Dependent Variable | |||
| Ease of adoption (ADOPT) | Perceptions of how easy or difficult it would be to adopt lobster aquaculture activity | Ordinal | |
| Independent Variables | |||
| Human Capital (HUMCAP) | Skills, knowledge, ability to labor and good health that together enable people to pursue different livelihood strategies and achieve their livelihood objectives ([41], sheet 2.3.1). | Household education score (sum of years of schooling) Occupational multiplicity (e.g., number of distinct occupations per household as a reflection of skills base). | Composite ordinal standardized with successive interval method. |
| Social Capital (SOCAP) | Social resources upon which people draw in pursuit of their livelihood objectives ([41], sheet 2.3.2). | Perceptions of: Trust in village leaders Trust in villagers Reciprocity Villager’s ability to engage in collective action | Composite, Ordinal |
| Natural Capital (NATCAP) | Natural resource stocks from which resource flows and services (e.g., nutrient cycling, erosion protection) useful for livelihoods are derived ([41], sheet 2.3.3). | Land ownership | Continuous (hectares) |
| Physical Capital (PHYCAP) | Basic infrastructure and producer goods needed to support livelihoods ([41], sheet 2.3.4). | Presence/absence of key material assets in the respondent’s household. | Continuous (count) |
| Financial Capital (FINCAP) | Financial resources that people use to achieve their livelihood objectives ([41], sheet 2.3.5). | Total annual gross income/number of people in the household | Continuous transformed to log |
| Agency (AGENCY) | Ability to pursue goals that one values and has reason to value [42] | Perceptions of: Belief in capacity to improve quality of life Influence over community decisions Ability to continue main household activity | Composite, Ordinal |
| Equity (EQUITY) | The distribution, procedure, and the contextual disposition of capabilities, access to resources and power [43] | Perceptions of: Balance of power in the village Expectations of whether the benefits of lobster farming would be shared equitably in the community. | Composite, Ordinal |
| Sensitivity (SENS) | Household dependence on natural resources [23] | Ranked household activities dependent on natural resources relative to those that are not. | Continuous (sum all activities weight based on sensitivity) |
Table 3.
Total annual gross income, cost and net revenue for income-generating activities (million IDR/year) 1.
Table 3.
Total annual gross income, cost and net revenue for income-generating activities (million IDR/year) 1.
| Activity | Total Annual Gross Income | Total Annual Cost | Net Annual Income |
|---|---|---|---|
| Fishpond | 30.0 | 4.6 | 25.4 |
| Fishers | 25.2 | 8.6 | 16.6 |
| Farmer | 24.2 | 8.5 | 15.8 |
| Trader | 25.1 | 9.8 | 15.3 |
| Farm worker | 13.3 | 3.8 | 9.6 |
| Transportation services | 16.3 | 8.1 | 8.1 |
| Taxibike | 10.6 | 5.2 | 5.5 |
1 These numbers have been weighted by time spent on each activity, where one year is assumed to be 250 days.
Table 4.
Production consumed by households indicating subsistence levels.
| Level of Production Consumed by the Household (%) | Percentage of Households (%) |
|---|---|
| 0–10 | 38 |
| >10–30 | 30 |
| >30–50 | 22 |
| >50–70 | 3 |
| >70 | 7 |
Table 5.
Relative Variable Importance (RVI) of independent variables in the model (n = 64).
| AGENCY | SENS | EQUITY | FINCAP | HUMCAP | SOCAP | NATCAP | PHYCAP | |
|---|---|---|---|---|---|---|---|---|
| Importance | 0.94 | 0.81 | 0.36 | 0.28 | 0.20 | 0.20 | 0.19 | 0.16 |
| N containing models | 48 | 42 | 25 | 20 | 16 | 15 | 15 | 13 |
| p | 0.01 | 0.04 | 0.25 | 0.37 | 0.73 | 0.60 | 0.69 | 0.86 |
| z | 2.56 | 2.02 | 1.14 | 0.90 | 0.33 | 0.52 | 0.39 | 0.17 |
Table 6.
Spearman’s Rho Correlations between model variables (n = 64) 1.
| ADOPT | HUMCAP | SOCAP | NATCAP | PHYCAP | FINCAP | AGENCY | EQUITY | SENS | |
|---|---|---|---|---|---|---|---|---|---|
| ADOPT | 1.00 | 0.160 | 0.181 | 0.049 | 0.131 | 0.031 | 0.415 ** | 0.154 | −0.386 ** |
| HUMCAP | 1.00 | −0.049 | 0.263 * | 0.405 ** | 0.090 | 0.055 | −0.132 | −0.535 ** | |
| SOCAP | 1.00 | −0.218 | −0.146 | −0.089 | 0.429 ** | 0.118 | −0.339 ** | ||
| NATCAP | 1.00 | 0.110 | 0.176 | 0.207 | −0.012 | −0.079 | |||
| PHYCAP | 1.00 | 0.080 | 0.153 | 0.067 | −0.164 | ||||
| FINCAP | 1.00 | −0.046 | 0.077 | −0.089 | |||||
| AGENCY | 1.00 | 0.308 * | −0.305 * | ||||||
| EQUITY | 1.00 | 0.094 | |||||||
| SENS | 1.00 |
1 * p < 0.05; ** p < 0.01.
© 2019 by the authors. Licensee MDPI, Basel, Switzerland. This article is an open access article distributed under the terms and conditions of the Creative Commons Attribution (CC BY) license (http://creativecommons.org/licenses/by/4.0/).
Share and Cite
MDPI and ACS Style
Diedrich, A.; Blythe, J.; Petersen, E.; Euriga, E.; Fatchiya, A.; Shimada, T.; Jones, C. Socio-Economic Drivers of Adoption of Small-Scale Aquaculture in Indonesia. Sustainability 2019, 11, 1543. https://doi.org/10.3390/su11061543
AMA Style
Diedrich A, Blythe J, Petersen E, Euriga E, Fatchiya A, Shimada T, Jones C. Socio-Economic Drivers of Adoption of Small-Scale Aquaculture in Indonesia. Sustainability. 2019; 11(6):1543. https://doi.org/10.3390/su11061543
Chicago/Turabian StyleDiedrich, Amy, Jessica Blythe, Elizabeth Petersen, Epsi Euriga, Anna Fatchiya, Takahiro Shimada, and Clive Jones. 2019. "Socio-Economic Drivers of Adoption of Small-Scale Aquaculture in Indonesia" Sustainability 11, no. 6: 1543. https://doi.org/10.3390/su11061543
Note that from the first issue of 2016, this journal uses article numbers instead of page numbers. See further details here.