A High Precision Method for Calcium Determination in Seawater Using Ion Chromatography
 Hangqi He
 Yifan Li
 Shuyuan Wang
  Qianwei Ma
 Yiwen Pan
- Department of Marine Science, Zhejiang University, Zhoushan, China
Calcium (Ca2+) is an important major cation in seawater, which is closely related to the oceanic biogeochemistry cycle. Direct and accurate determination of Ca2+ concentration is required for a more comprehensive study of the carbonate system in seawater. Due to the high background concentration of Ca2+ in seawater and small variances of Ca2+ during CaCO3 precipitation and dissolution process, a precision of better than 0.1% (of approximately ± 10 μmol/kg) is very much desired for carbonate chemistry related studies. In this study, a simple, non-toxic and labor-saving technique using ion chromatography (IC) has been developed to determine Ca2+ in seawater with an overall precision of better than 0.1%. Due to lack of available commercial calcium standard in seawater matrix, IAPSO seawater was selected as the reference after calibration. This proposed method can get a result within 15 min and only requires a small sample volume (∼1 ml). The concentrations and flow rates of the eluent have been optimized to achieve the best chromatographic separation (20 mmol/L and 1.0 mL/min were selected in this study). Our work suggests that sample dilutions by weighing have no discernible effect on Ca2+ determinations. However, the measured Ca2+ concentration shows a linear decrease with the increasing Mg/Ca ratio in samples, which could be corrected by a derived formula to achieve high accuracy within 0.1%. This optimized method has been applied to the analysis of Ca2+ distribution in Southwest Indian Ocean and the laboratory study on the calcite precipitation in seawater.
Introduction
Calcium (Ca2+) is one of the major cations in seawater. Although Ca2+ concentration ([Ca2+]) in open ocean waters is largely considered as a conservative value with respect to salinity (approximately 10.28 mmol/kg with a salinity of 35), processes including bio- and abio- genic precipitation, carbonate sediment dissolution etc., contribute to the deviations of a constant calcium/salinity ratio.
Calcium is the main component of aragonite and calcite (CaCO3). The precipitation and dissolution of calcium carbonate is an important component of the oceanic carbon cycle. Recent estimates of both CaCO3 production and export at a global ocean scale (∼175 × 1012 mol/year) are roughly at the same order, suggesting relatively high carbon export efficiency in the form of inorganic carbon (Smith and Mackenzie, 2016). The acidification effects caused by growth in atmospheric CO2 have certainly reduced the degree of seawater CaCO3 saturation state (Ω) and thus potentially reduce marine organisms’ ability to form calcareous shells (Feely and Chen, 1982; Kleypas et al., 2001; Doney et al., 2009), and have increased the dissolution rate of dead biogenic remains (Andersson and Gledhill, 2013). When 1 mole of CaCO3 precipitates or dissolves, the corresponding variations of Ca2+, dissolved inorganic carbon (DIC) and total alkalinity (TAlk) are 1, 1, and 2 moles, respectively. Therefore, Ca2+, DIC and TAlk could be used to study CaCO3 precipitation/dissolution if a certain detection precision could be reached.
High quality DIC and TAlk data are provided by abundant studies, which form the knowledge base of present estimates of oceanic the CaCO3 flux (Chung et al., 2003; Feely et al., 2004; Barrett et al., 2014; Smith and Mackenzie, 2016). However, reports of Ca2+ distribution are less popular than reports of DIC and TAlk. Besides, the contribution of dissolved organic matter (DOM) to seawater TAlk has been demonstrated in numerous studies (Chung et al., 2003; Feely et al., 2004; Cao and Dai, 2011; Barrett et al., 2014). The nutrients released during DOM decomposition will contribute a potential impact to the titration of seawater TAlk, which indicates the potential estimation bias of the CaCO3 budget using observed TAlk and DIC data. Unlike DIC or TAlk, which is affected by both organic and inorganic carbon production and consumption, variations of Ca2+ are almost exclusively controlled by the CaCO3 precipitation and dissolution when the influence of hydrothermal inputs is ignored. Due to CaCO3 precipitation and dissolution process, the observed low ratios of calcium/salinity in surface waters and elevated ratios in deep waters have been recognized for a long time in the oceans (Riley and Tongudai, 1967; Chen, 1978; Krumgalz, 1982), and the variation of [Ca2+] is ∼1% of the total amount in seawater. Thus, accurate quantification of [Ca2+] is necessary for looking into the marine CaCO3 cycle and the advantage is also obvious.
For any analysis method, precision is the degree of proximity of multiple measured values for the same sample, which is an inherent quality of the method itself. Accuracy is the degree of conformity between the measured value and the real value, which is mainly related to the standard used. A high precision is the prerequisite of high accuracy. In the analysis of DIC and TAlk, a precision of better than 0.1% (of approximately ± 2 μmol/kg) could be routinely obtained (Sabine et al., 2002; Dickson et al., 2007; Cai et al., 2011). When using the certified Dickson seawater as the reference, the DIC and Talk analysis can achieve a high accuracy within 0.1%. Due to the high background concentration of Ca2+ in seawater and small variances of Ca2+ during CaCO3 precipitation/dissolution process, a precision of better than 0.02% (of approximately ± 2 μmol/kg) for Ca2+ analysis is required as a similar data precision level of DIC and TAlk, which is not realistic at this stage. Considering the limitation, precision of at least better than 0.1% (of approximately ± 10 μmol/kg) is very much desired for carbonate chemistry related studies (Olson and Chen, 1982; Milliman et al., 1999; Jiang et al., 2010; Millero, 2013). Thus, achieving the required precision (<0.1%) is an important basis for the accurate Ca2+ analysis. Besides, the lack of commercial calcium standard in seawater matrix is a obstacle for calcium determination in seawater at present.
Over the past decades, complexometric titration has been developed to determine Ca2+ in seawater with a high precision. Ca2+ can be selectively titrated with ethylene glycol-bis(2-aminoethylether)-N,N,N’,N’-tetraacetic acid (EGTA) in the presence of Mg2+ (Schmid and Reilley, 1957; Culkin and Cox, 1966; Tsunogai et al., 1968). Ion selective electrodes are incorporated as end-point indicators for achieving a good precision (Whitfield and Leyendekkers, 1969; Hadjiioannou and Papastathopoulous, 1970; Lebel and Poisson, 1976; Kanamori and Ikegami, 1980). Corrections of Mg2+ and Sr2+ interferences are also required to get an accuracy of better than 0.1% (Grasshoff et al., 2009). Cao and Dai (2011) modify the classic EGTA titration from Lebel and Poisson (1976) with an amalgamated silver electrode for end-point detection, which achieves a better precision of 0.06%. Despite the high precision of this method, a large amount of toxic mercuric chloride must be added into the sample before titration, which is not friendly to the operator and the environment. Besides, there are some common problems in these titration methods. For example, these methods are laborious and time consuming, meanwhile, a large sample volume (∼4 to 25 ml) is always required for a single measurement.
In recent years, ion chromatography (IC) has been developed rapidly. It has many advantages over other analytical methods in speed, selectivity, stability and simultaneous determination ability. The principle of IC is based on the reversible exchange between dissociable ions on the ion exchange column and solute ions with the same charge in the mobile phase. As a result, different components with different affinities are separated by the ion exchanger. Therefore, IC can be applied to the simultaneous separation and determination of common cations in aqueous solutions. There are many reports about the studies of Ca2+ determination using IC (Thomas et al., 2002; Garcıá-Fernández et al., 2004; Zeng et al., 2006), but the applications are restrained in samples of low ionic strength matrix and low Ca2+ concentration, such as mineral waters and drinking water. A few studies have reported that both Mg2+ and Ca2+ can be simultaneously detected in marine sediment porewaters (Melendez et al., 2013) and samples of high ionic strength matrix (Laikhtman et al., 1998) but with a low precision (1–2%). Thus, the challenge in applying the IC method in complex matrix samples and the low precision are two key factors that restrain its application in accurate Ca2+ determination in seawater.
In this study, we have described the implementation of an IC method for determining Ca2+ with required precision (<0.1%) in seawater. The main advantages of this method include all the benefits of IC method: a small sample volume (∼1 ml of seawater), elimination of complex sample interferences, and simple analyzing operation. Considering there is no available commercial calcium standard in seawater matrix, the seawater reference from International Association for the Physical Sciences of the Oceans (IAPSO) was selected as the reference for Ca2+ determination and a high accuracy can be achieved. The effects of sample dilutions, Mg2+ and Sr2+ on the Ca2+ determinations are investigated as well.
Experiment
Apparatus
A Dionex model ICS-5000 + ion chromatograph (Thermo Fisher) was employed along with a Chromeleon chromatography workstation for instrument control as well as data acquisition and processing in conductivity detection. A Dionex Ion Pac CG 12A (4 mm × 50 mm i.d.) guard column and Dionex Ion Pac CS 12A (4 mm × 250 mm i.d.) separation column were used. The equipped sample loop was 100 μL and the eluent was 20 mM Methanesulfonic acid (MSA). In cation chromatography, the ion exchange functional group of resin filled with separation column was sulfonic acid (-SO3–), and the corresponding eluent was methanesulfonic acid (MSA). After separation, the corresponding signal was obtained by the conductometric method. A Dionex CERS 500 (4 mm) cation self-regenerating suppressor was applied in the system to reduce the background conductivity and thus improved the detection limit. Column oven was set at 30°C for all separations and the conductivity cell was kept at a constant 35°C.
Reagents and Standards
Preparation of artificial seawater with known [Ca2+] is a feasible method to obtain the calcium standard, but it will greatly increase the workload and there may be some potential errors in the preparation process due to the different operators. Although IAPSO seawater is a salinity standard, the [Ca2+] of each individual IAPSO batch is stable. Thus, IAPSO seawater of the same batch can be considered as a stable calcium reference. According to the stoichiometric reference composition of the standard seawater defined by Millero et al. (2008), the average [Ca2+] calculated in seawater is 10.28 mmol/kg at a salinity of 35 and the corresponding Ca2+/Sal ratio is 293.7. Due to the preparation on the basis of Atlantic Ocean surface seawater, there is some variations of [Ca2+] in different batches of the IAPSO seawater. Several studies has reportered the Ca2+/Sal ratio in IAPSO seawater, such as Batch P61 [291.3 (Shiller and Gieskes, 1980)], Batch P79 [290.5 [(Olson and Chen, 1982)], and Batch P147 [292.3 (Cao and Dai, 2011)]. The Ca2+/Sal ratios of different batches show a range of as much as 0.3–1%, which is well outside the desired accuracy. Therefore, the calibration of IAPSO seawater is necessary. After calibration by a known Ca2+ standard or the other measurement methods (such as complexometric titration method), IAPSO seawater of the same batch can be used as the calcium standard. However, this means that every lab would have to resort to calibrating their own batch of IAPSO seawater using a secondary method that they might not be familiar with. Besides, the accuracy of this method essentially relies entirely on the calibration result, which may be the main limitation of this method.
In this study, the Batch P162 of IAPSO seawater (salinity = 34.993) was selected as the calcium standard. An artificial seawater with known Ca2+ concentrations (by weighing) was prepared to calibrate this batch of IAPSO seawater. The [Ca2+] measured was 10.168 mmol/kg and the Ca2+/Sal ratio was determined to be 290.6. Eluents were prepared by using extra pure grade Methanesulfonic acid (Acros Organics, 99%). The calcium, magnesium and strontium standard stock solutions (1000 mg/L) were bought from the Chinese National Standard Material Center (the corresponding product numbers were BW2021-1000-W-50, BW-2020-1000-W-50, and BW30023-1000-C-50), which were diluted to the designed concentrations and used as standards in recovery test. The deionized water (resistivity 18.2 MΩ⋅cm) used in both preparations of eluent and dilution of seawater samples was obtained from the Milli-Q water purification system (Millipore).
Procedures
In order to avoid overloading of the column caused by excess sodium ions in solutions, standards and seawater samples were diluted by weight with a suitable dilution factor according to the estimated [Ca2+]. After dilution, the highest peak shape of Na+ in seawater sample was not distorted, thus the peaks of Mg2+ and Ca2+ could keep their normal shapes. Considering the accuracy of the analytical balance (0.1 mg), 1 g of seawater sample or standard was weighed for dilution, which could reduce the error caused by weighing.
In order to achieve high precision, the precision of detecting part and autosampler part was tested separately. According to the test result, the uncertainty of the autosampler injection volume was of approximately 0.3%, which exceeded the required precision (<0.1%), thus the manual sample injection was used instead of autosampler injection. The connection mode of six-way valve pipeline was shown in Figure 1. The injection pipeline (2) of the six-way valve was directly connected to the sample solution, and a syringe was connected to the waste pipeline (3). Before injection, the syringe was pulled to form a vacuum and ∼2 mL diluted sample solution was thus sucked through the sample loop due to the pressure differences, that guaranteed the sample loop was cleaned and completely filled. Large volume injection was chosen by using big sample loop (100 μL) to reduce the error caused by manual injection.
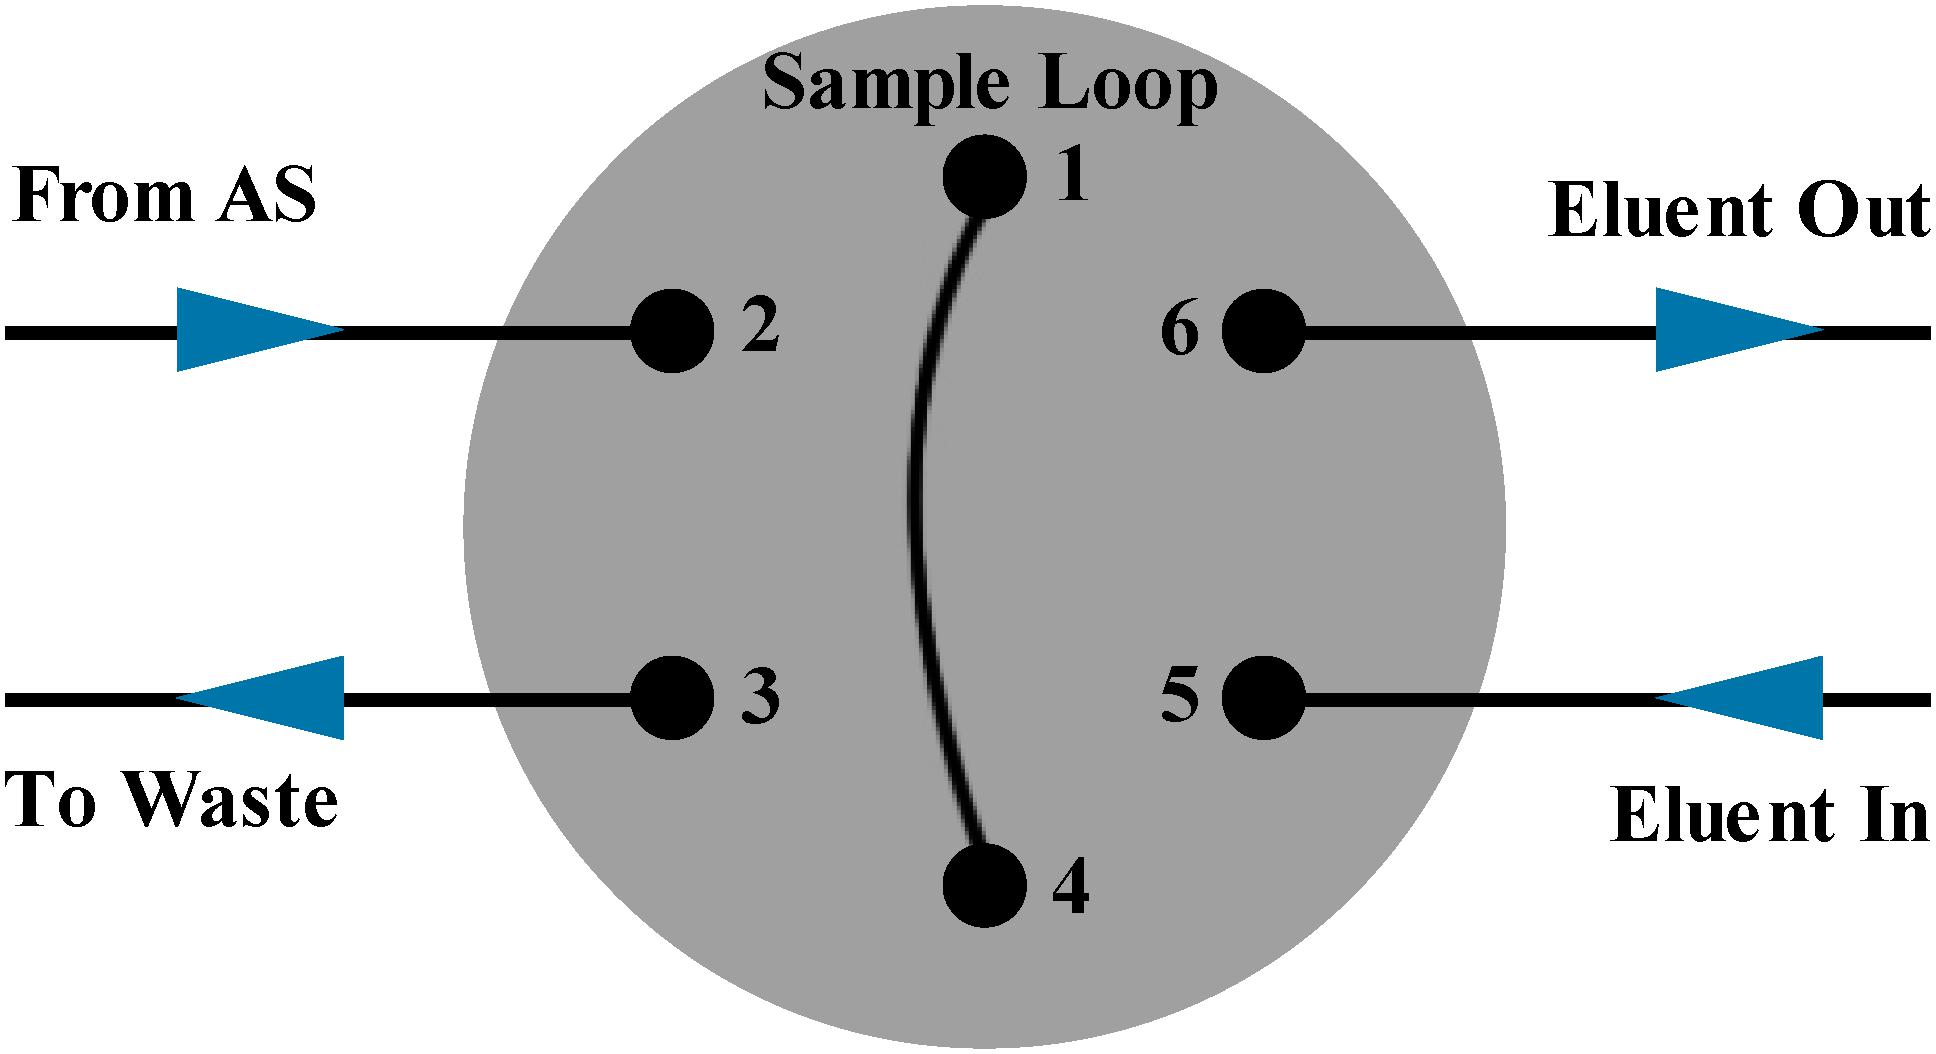
Figure 1. The six-way valve of the ion chromatography. Pipelines (1) and (4) are connected with the sample loop. The sample from autosampler is injected into pipeline (2) and the waste is removed by pipeline (3). The eluent enters from pipeline (5) and flows out from pipeline (6).
In previous IC methods, Mg2+ and Ca2+ could be separated and detected from excess sodium solution by sample solution complexation (Garcıá-Fernández et al., 2004; Melendez et al., 2013) or double pump separation system of IC (Laikhtman et al., 1998). The complex sample pretreatment and separation process might cause the loss of the detected Ca2+, reducing the precision of the analysis method. Therefore, in this study, we tried to simplify the sample pretreatment and subsequent analysis process to eliminate potential errors. There was no complex sample pretreatment except the necessary dilution, the injection and separation pipelines were also minimized in the IC analysis process. Compared with the previous methods, the precision of this method has been significantly improved.
Results and Discussion
Precision and Reproducibility
The precision of the method for Ca2+ in seawater was investigated by analyzing five runs of a sample. To compare the precision of autosampler injection method and manual injection method, reproducibility was tested using the diluted Dickson reference seawater (Batch 154) and the single calcium standard solution by manual injection and automatic injection, respectively. The retention time between these two different injection methods shows a similar pattern while the relative standard deviation (RSD) for the Ca2+ peak area exhibits some differences. The RSD is 0.05% in manual injection method while 0.45% in automatic injection method (n = 5) (Table 1). Only the manual injection method fulfills the <0.1% requirement of Ca2+ analysis in seawater. The very stable retention time in both automatic injection method and manual injection method (RSD = 0.04%) implies that the reproducibility in ion-exchange separation process (Mg2+, Ca2+, and Sr2+) is very stable. The differences in peak area reproducibility between the automatic injection and manual injection method in both seawater sample and the single calcium standard solution test indicates that it is the reproducibility in automatic injection method that limits the whole precision of IC analysis.
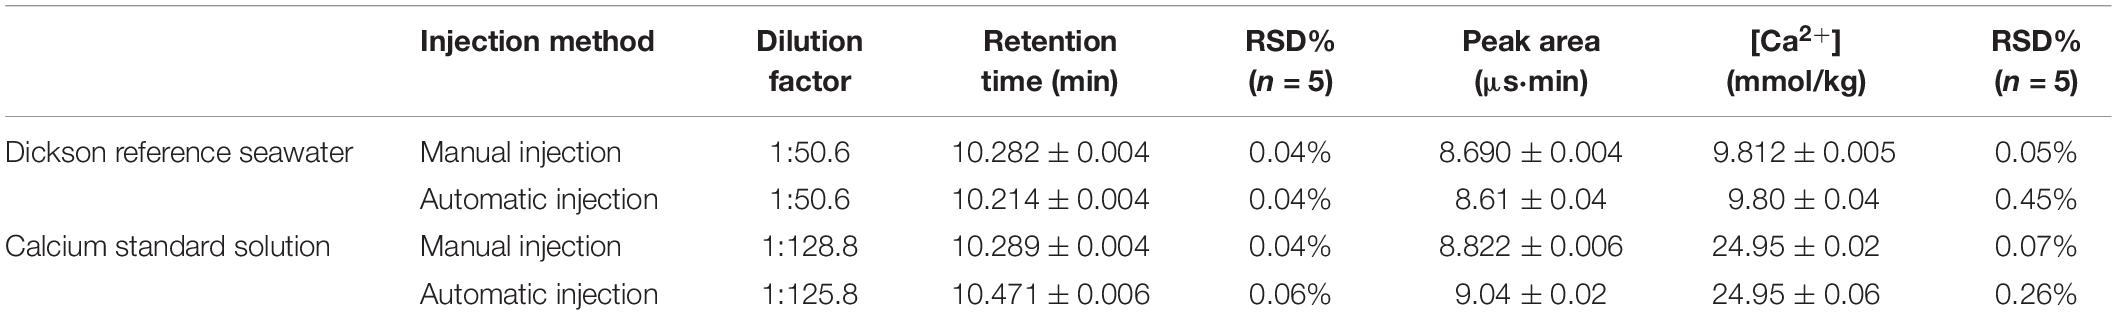
Table 1. Results of precision analysis for Ca2+ concentration in Dickson reference seawater (Batch 154, salinity = 33.347) and the single calcium standard solution using manual injection and automatic injection, respectively.
The sample injection volume should be controlled by the sample loop (100 μL) in principle. In the process of automatic injection, the sample solution was extracted into a syringe-type pump from the sample bottle through the pump and the needle moved to the injection pipeline (2) in Figure 1 to push the sample solution into the sample loop. During samples extraction and injection, small bubbles from the atmosphere might be introduced into the pipeline and stayed in the sample loop. When switching to manual injection method, a syringe-type pump, a six-way valve and some loops before sample entering through the other six-way valve (Figure 1) into the sample loop (100 μL) which were included in automatic injection method were abandoned. Instead a syringe and a short loop were connected to a six-way valve directly, and the pipeline (2) in Figure 1 was always in the sample bottle to avoid the introduction of bubbles. On the other hand, the automatic injection mode is to “push” samples into the sample loop. This mode might slightly compress the solution and small bubbles were more likely to stay in the sample loop, which would increase potential variations in the sampling volume. While the manual injection mode is to “suck” samples into the sample loop by the pressure differences, the sample loop could be filled uniformly by the sample solution and it was not easy to form bubbles. By manual injection, the sample loop could stably control the injection volume to improve the whole precision of IC analysis. Therefore, the manual injection method exhibited a much higher reproducibility than autosampler method.
Optimization of the Chromatographic Separation
The basic principle of IC is to measure ionic species’ concentrations after separating them based on their interactions with a resin column. Before detection, sample solutions pass through a pressurized chromatographic column. After first absorbing by column constituents and separating by eluents of the ions, various ions in a sample could be separated due to their different retention time. Thus, the retention time of different species not only depends on species type, size, column materials, but also is influenced by the eluent type, the concentration and the flowing rate. For seawater sample (Figure 2), which is a complex matrix medium, Li+, Na+, K+, Mg2+, Ca2+, and Sr2+ could be separated and detected in turn. The retention time of Mg2+, Ca2+, and Sr2+ are close to each other due to their similar ionic properties. In order to achieve a good separation effect of Mg2+, Ca2+, and Sr2+ in seawater, different eluent concentrations and flow rates, as well as dilution effects on samples were tested. Take the separation degree between Mg2+ and Ca2+ as an example, it can be described by the resolution of Mg2+ and Ca2+, which is expressed as:
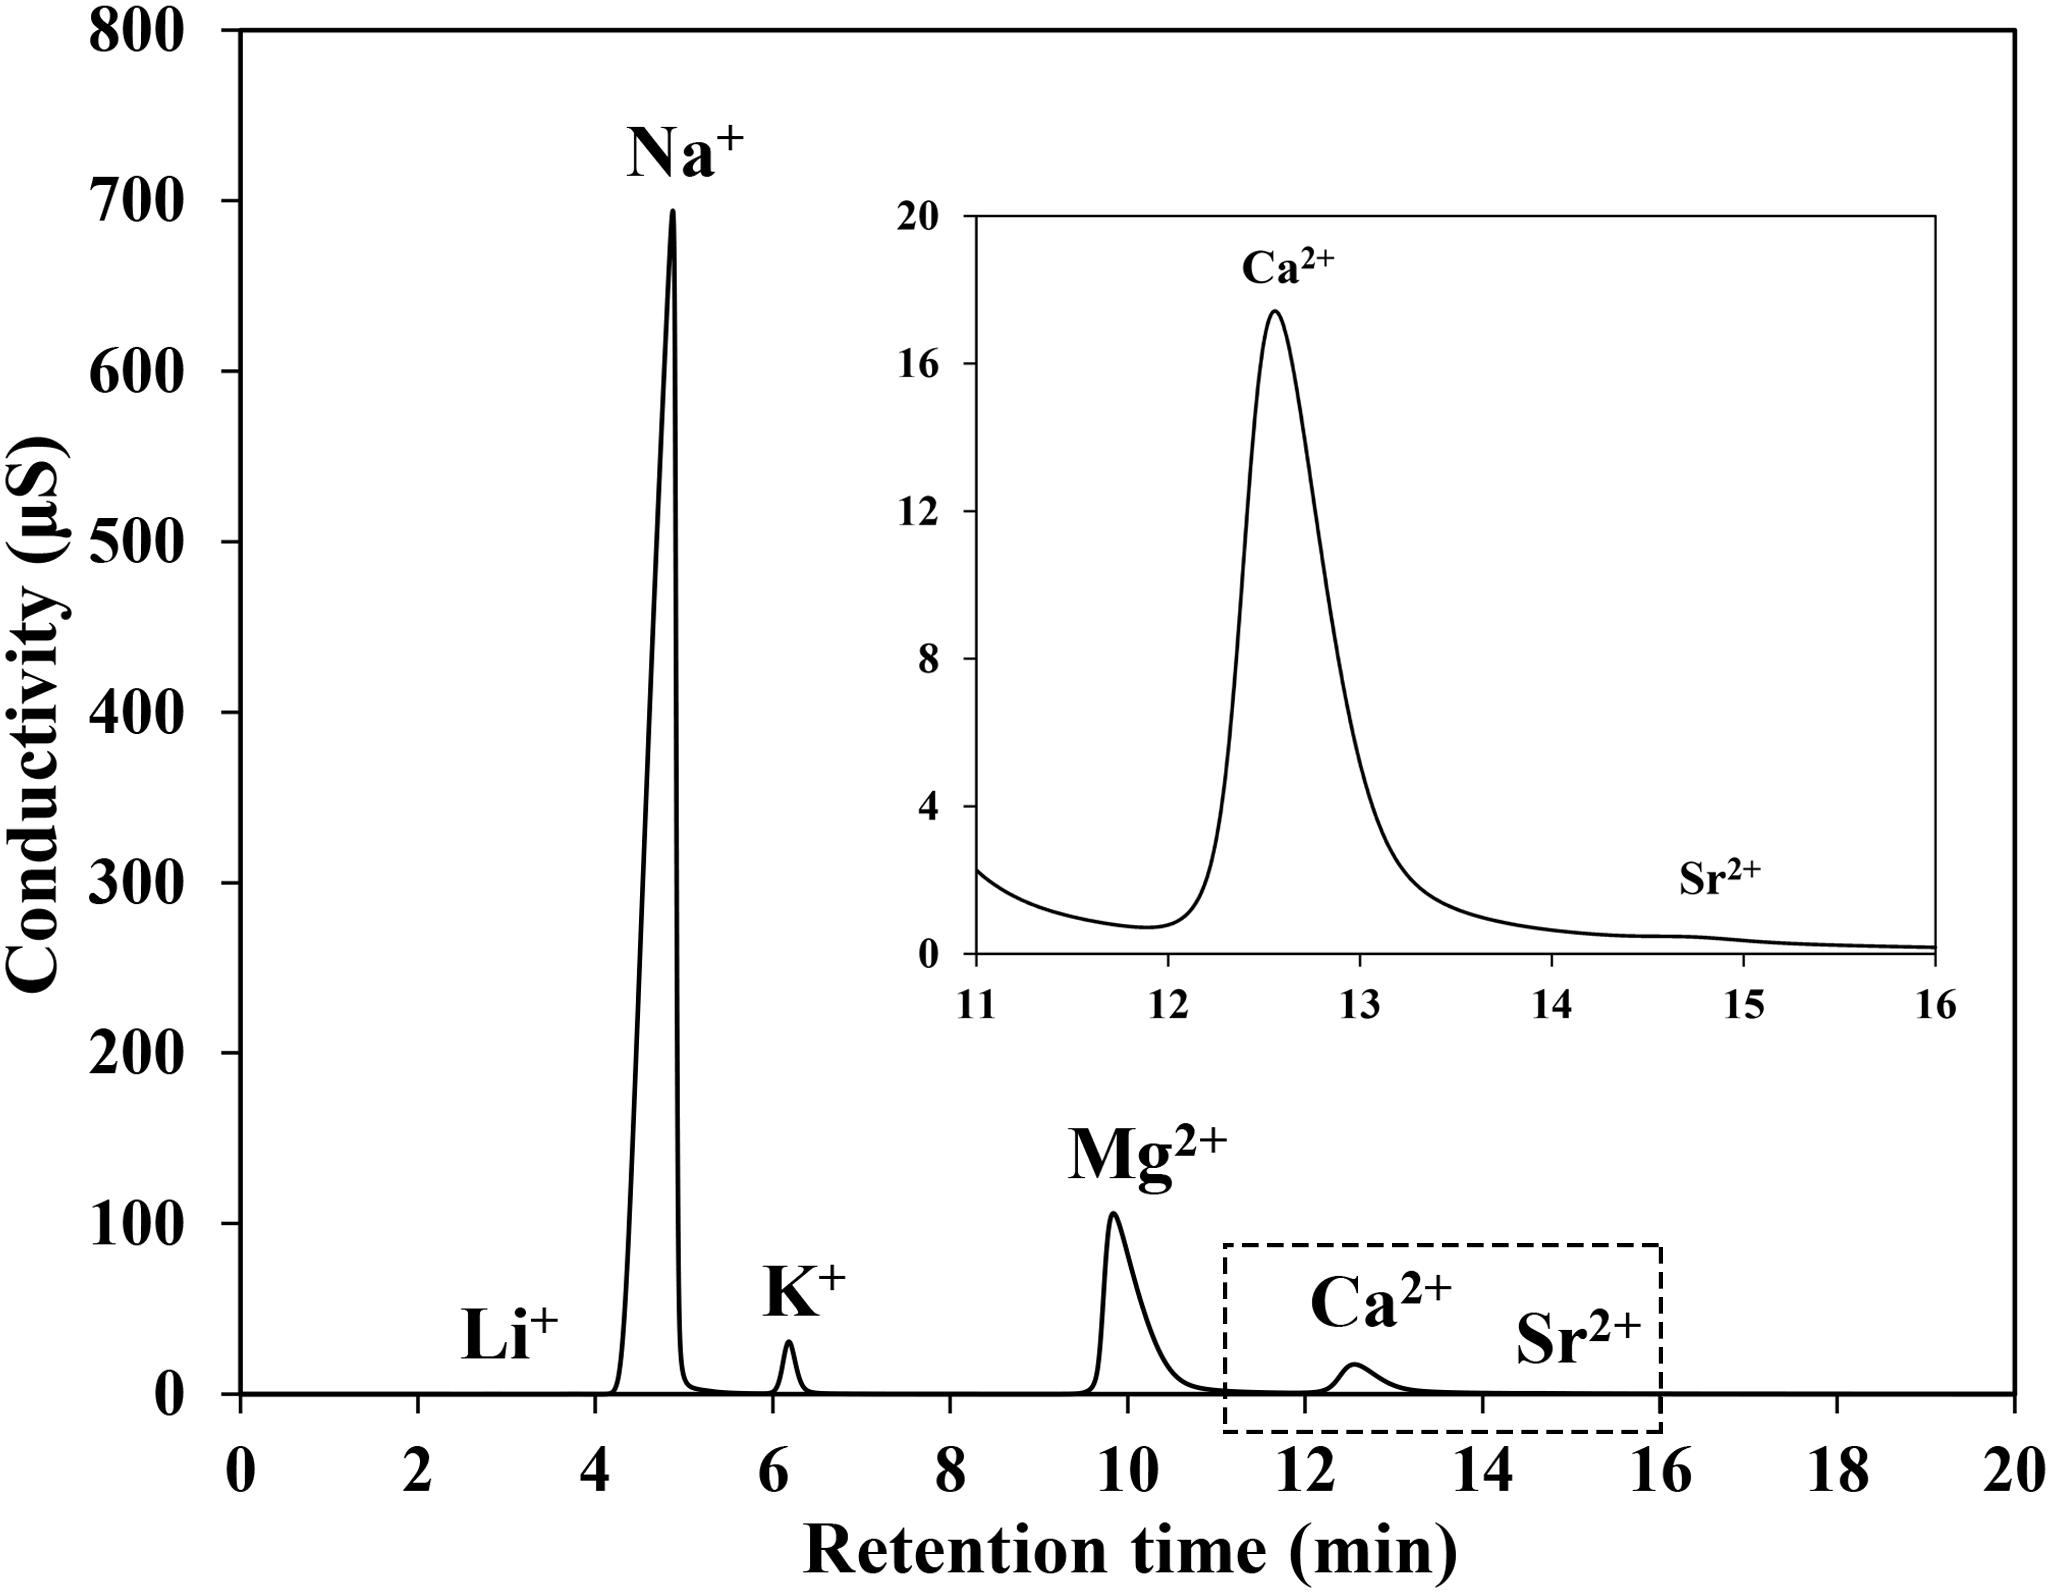
Figure 2. Chromatograms obtained for the major cations in seawater by conductivity.
where R is the resolution, tR is the retention time and W is the peak width.
The separation degree (R) under three different eluents’ concentrations and flow rates are listed in Table 2. No significant changes in retention or peak shapes were observed under all rinsing conditions (Figure 3), although cation separation degree, retention time and peak area of Mg2+ and Ca2+ were found to decrease with enhanced eluent concentrations and flow rates. In the requirement of routine IC analysis, ions can be considered to be totally separated if R is greater than 1.5. Considering the retention time and resolution, the eluent concentration of 20 mmol/L and the flow rate of 1.0 mL/min are selected in the present study. In this condition, Mg2+ and Ca2+ in seawater can be well separated in less than 15 min (Figure 3), which makes the whole measurement process time-saving.
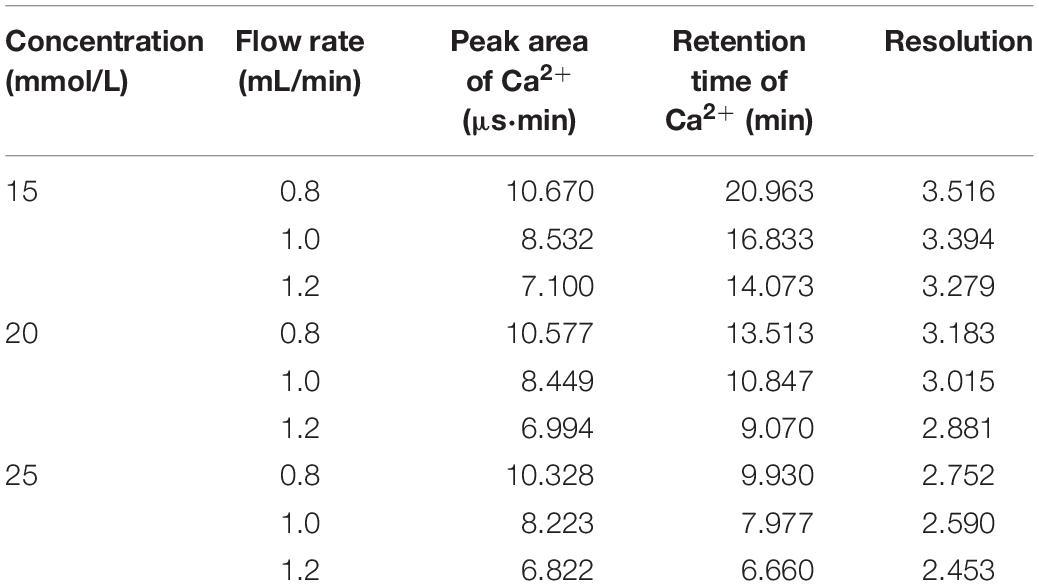
Table 2. The resolution of Mg2+ and Ca2+ in seawater with different eluent concentrations and flow rates.
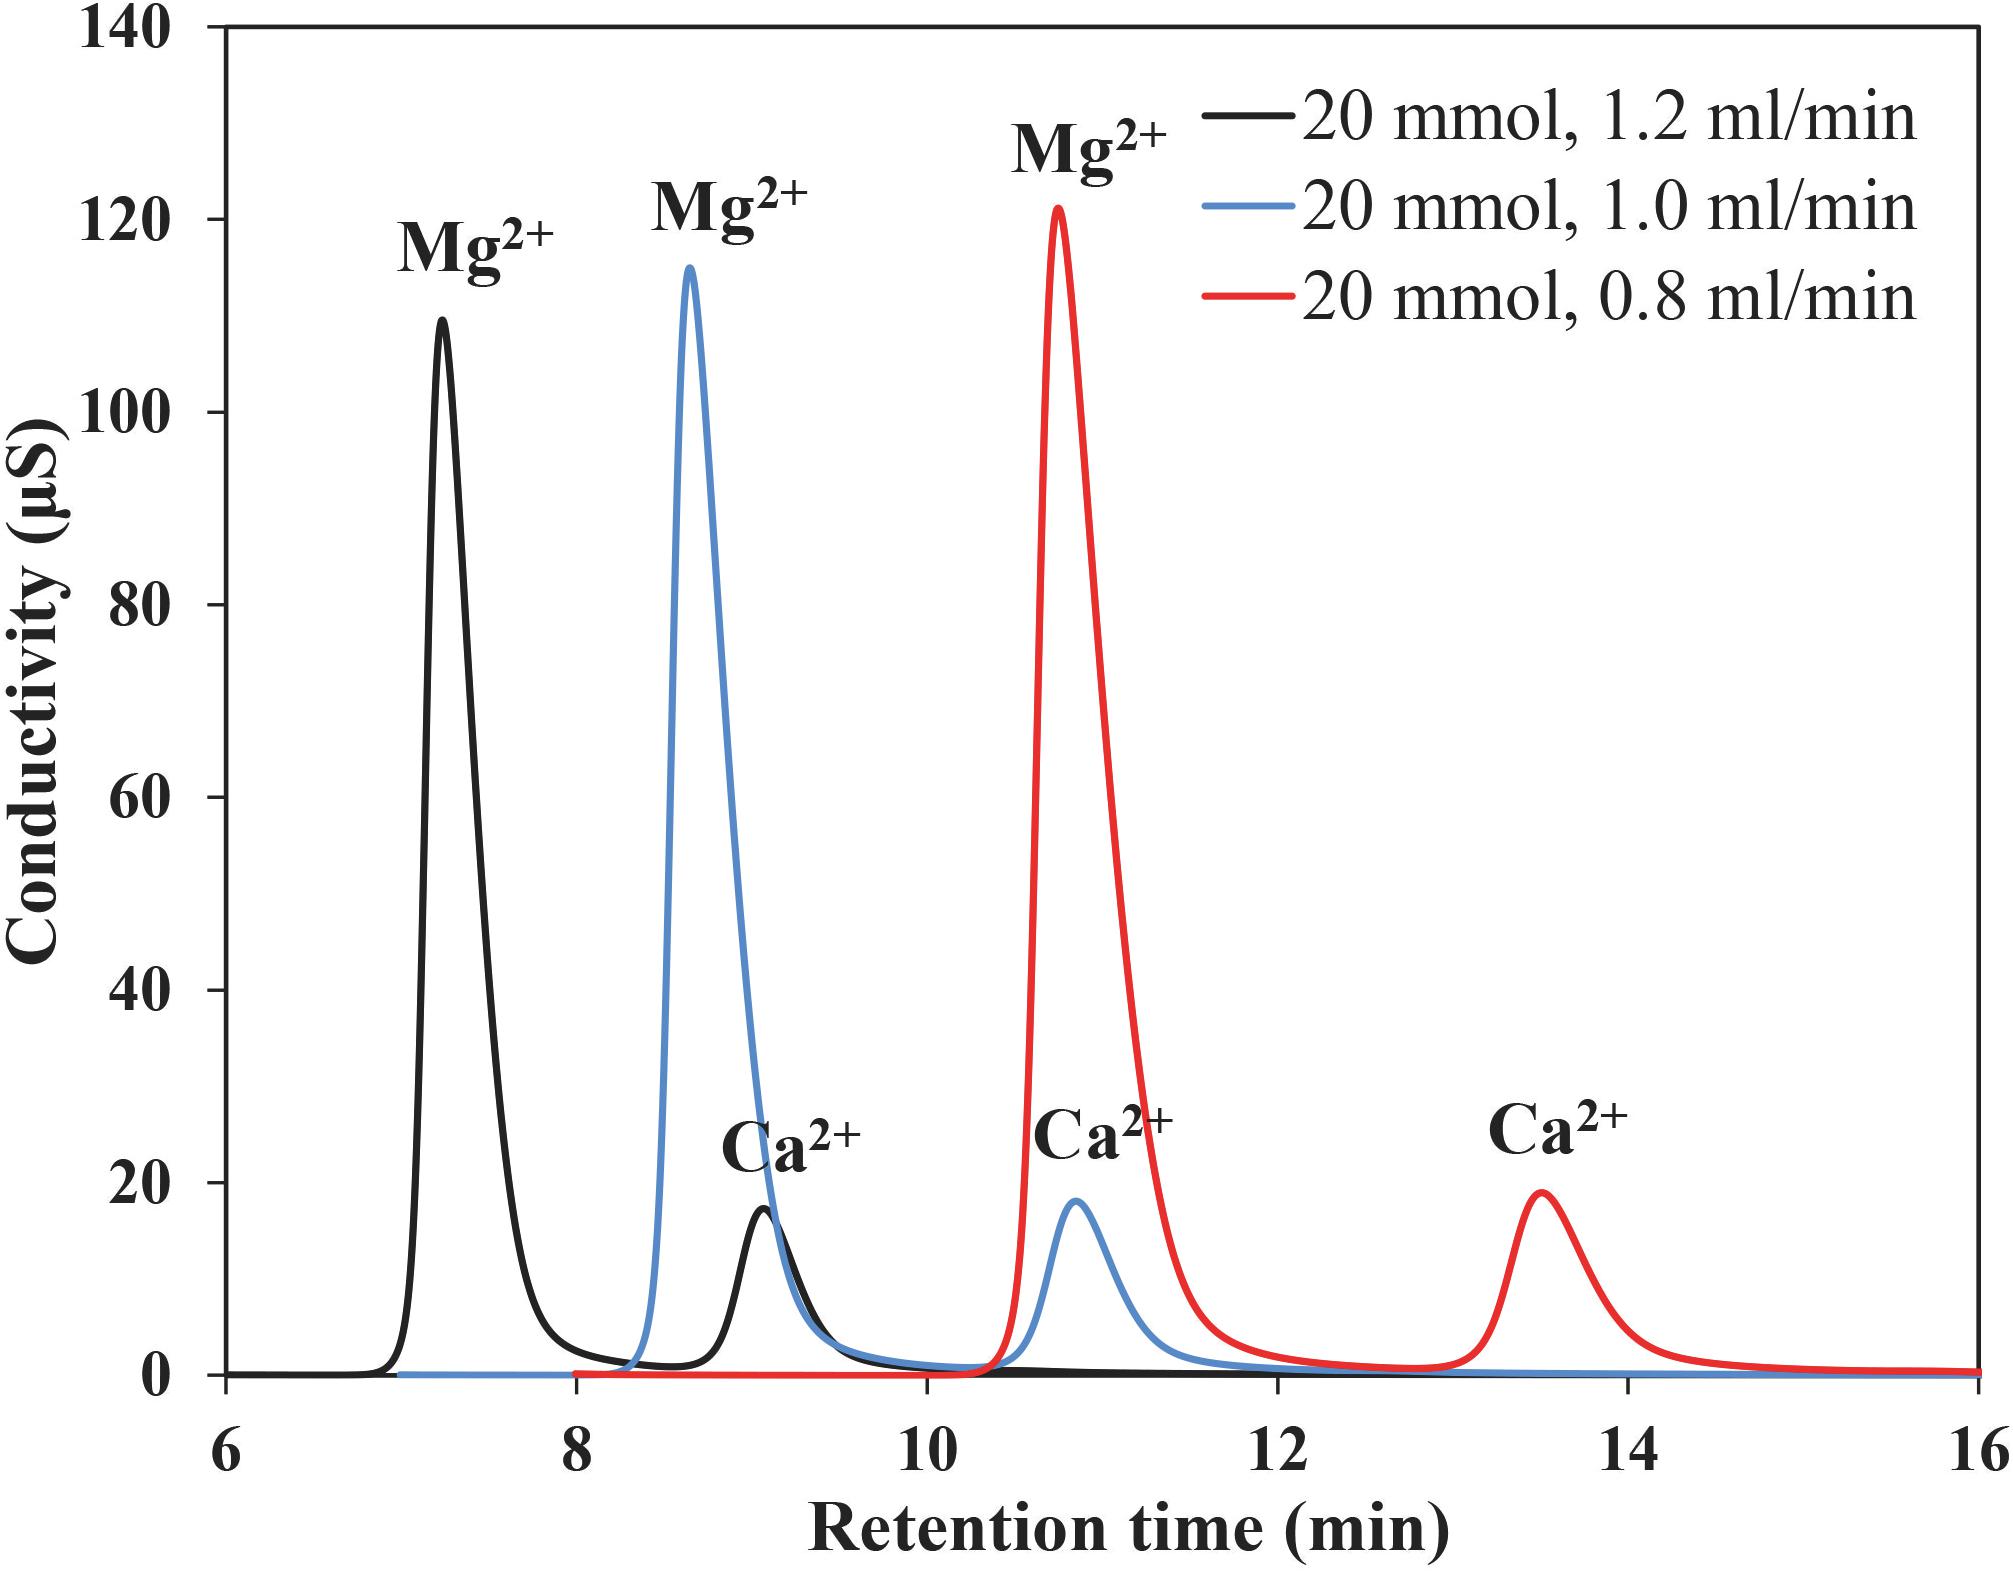
Figure 3. Chromatogram of Mg2+ and Ca2+ in IAPSO seawater obtained using eluent of 20 mM MSA, flow-rate 0.8, 1.0, and 1.2 mL/min.
Reference Solution
Due to the similar ionic properties among Mg2+, Ca2+, and Sr2+, the retention times of Mg2+, Ca2+, and Sr2+ are close to each other (Figure 2). In seawater, the concentration of Mg2+ is nearly four times higher than Ca2+, while Sr2+ is 100 times lower. Although good separation effects between Mg2+ and Ca2+ (R > 2.5) could be achieved with the eluent concentration and flow rate of 20 mmol/L and 1.0 mL/min, there are small tailing peaks of Mg2+ which cause partial overlap between Mg2+ and Ca2+ peaks, albeit only to a small degree (Figure 4). Instead, the peak area of Sr2+ is very small after separated by the IC column (Figure 2) but still has a partial overlap with Ca2+ peak. Due to the lower concentration compared with Mg2+, Sr2+ has less influence on accurately determining Ca2+ in seawater-like matrix sample by IC method. The partial overlap between Mg2+, Ca2+, and Sr2+ peaks might impair the accuracy of IC analysis, but it is hard to eliminate this phenomenon completely only by changing the separation conditions of IC. Therefore, IAPSO seawater was selected as the reference in this study, the partial overlap phenomenon existing in both standard and sample could eliminate its influence on the analysis results.
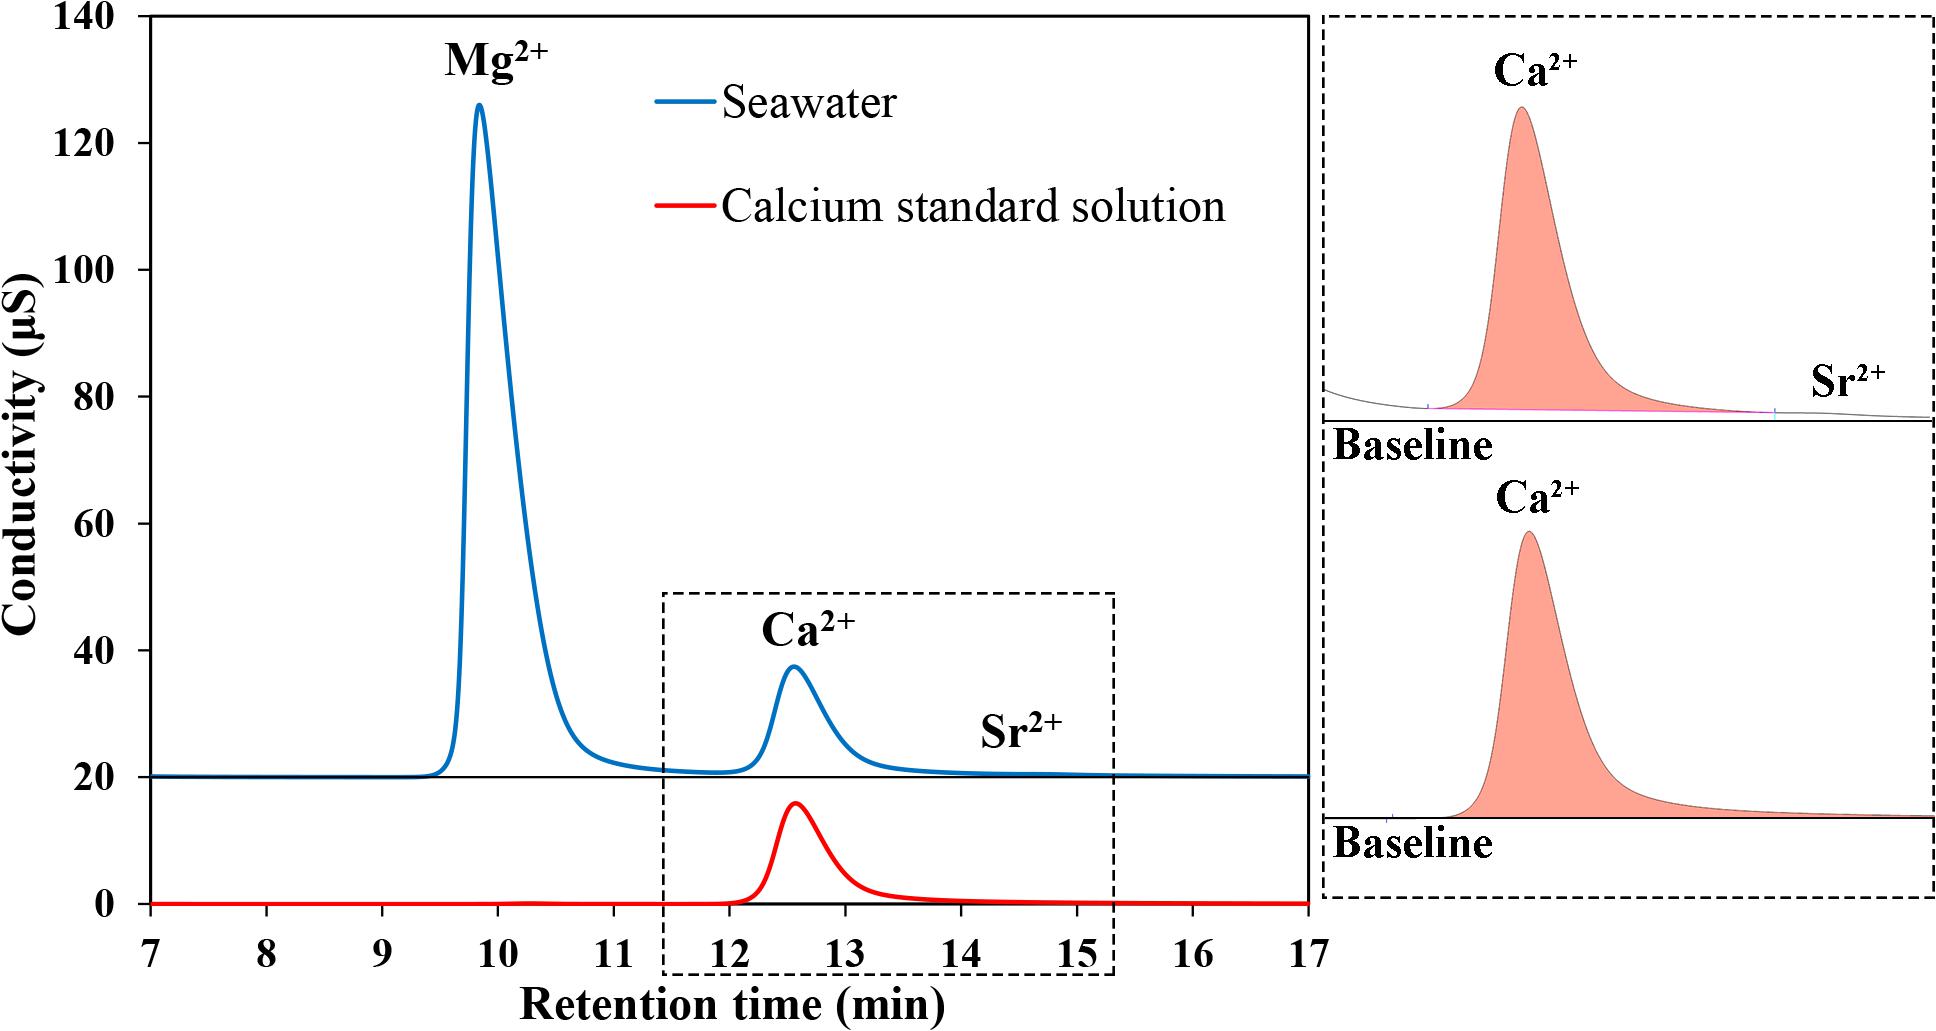
Figure 4. Chromatograms obtained for Mg2+, Ca2+, and Sr2+ in seawater samples or IAPSO seawater (Blue line) and Ca2+ in calcium standard solution (Red line).
Take the Dickson seawater (Batch 154, salinity = 33.347) as a sample, the [Ca2+] measured using IAPSO seawater and the single calcium standard solution as references were 9.812 mmol/kg and 9.697 mmol/kg, respectively. Differences (∼1%) in the measured [Ca2+] using different reference solutions could be observed. Comparing the Ca2+ peak shapes and integration areas of seawater and zero salinity Ca2+ standard (the single calcium standard solution) (Figure 4), small differences in the baseline between the two Ca2+ peak shapes could be observed. It is the tailing of Mg2+ peak that causes a little overlap with the Ca2+ peak. When using the single calcium standard solution as the reference, there is no tailing effect of Mg2+ peak. The peak shapes of the reference and the sample differ with each other, which would cause discrepancy in the measured Ca2+ value. Thus, the results obtained are not extremely accurate and would be affected by the integration method, such as the selection of the integral interval. By comparison, the similar component between IAPSO seawater and the sample would form similar peak shapes, which could potentially eliminate the influence of Mg2+ and Sr2+. And different integration methods would hardly affect the measured result. Therefore, IAPSO seawater is a better alternative than the single calcium standard solution as a reference when measuring seawater sample.
Dilution Effect and Standard Procedure
Samples like seawater need to be diluted before detecting using IC method, because high concentration of ions could casue column overloading problem without diluting. Effect of the dilution factor was tested by detecting the [Ca2+] in IAPSO seawater after being diluted by a factor of 25, 38, 50, 75, 100, 150 times by weight. A good linear relationship between the Ca2+ concentration and detected peak area (R2 = 0.9999) was observed, which indicates good responses of the Ca2+ in the diluted seawater within the range of 0.07–0.43 mmol/kg. Since the concentration of Ca2+ is relatively stable in seawater, we narrow the concentration range of the analytical curve to 0.18–0.22 mmol/kg (i.e., diluted 40–60 times), and dilute the seawater samples approximately 50 times.
A negative intercept of the calibration curve between detected Ca2+ peak area and the [Ca2+] could be observed in Figure 5. If the peak area of Mg2+ and the Mg2+ concentration was fitted, good linear fitting could also be observed with a slightly positive intercept. The phenomenon corresponds to the hypothesis that the peak area of Ca2+ in seawater may be underestimated due to the overlap between the peaks of Mg2+ and Ca2+, while the peak area of Mg2+ may be overestimated on the contrary. It should be noted that the reduced peak area is closely related to the rinsing conditions and the integration method.
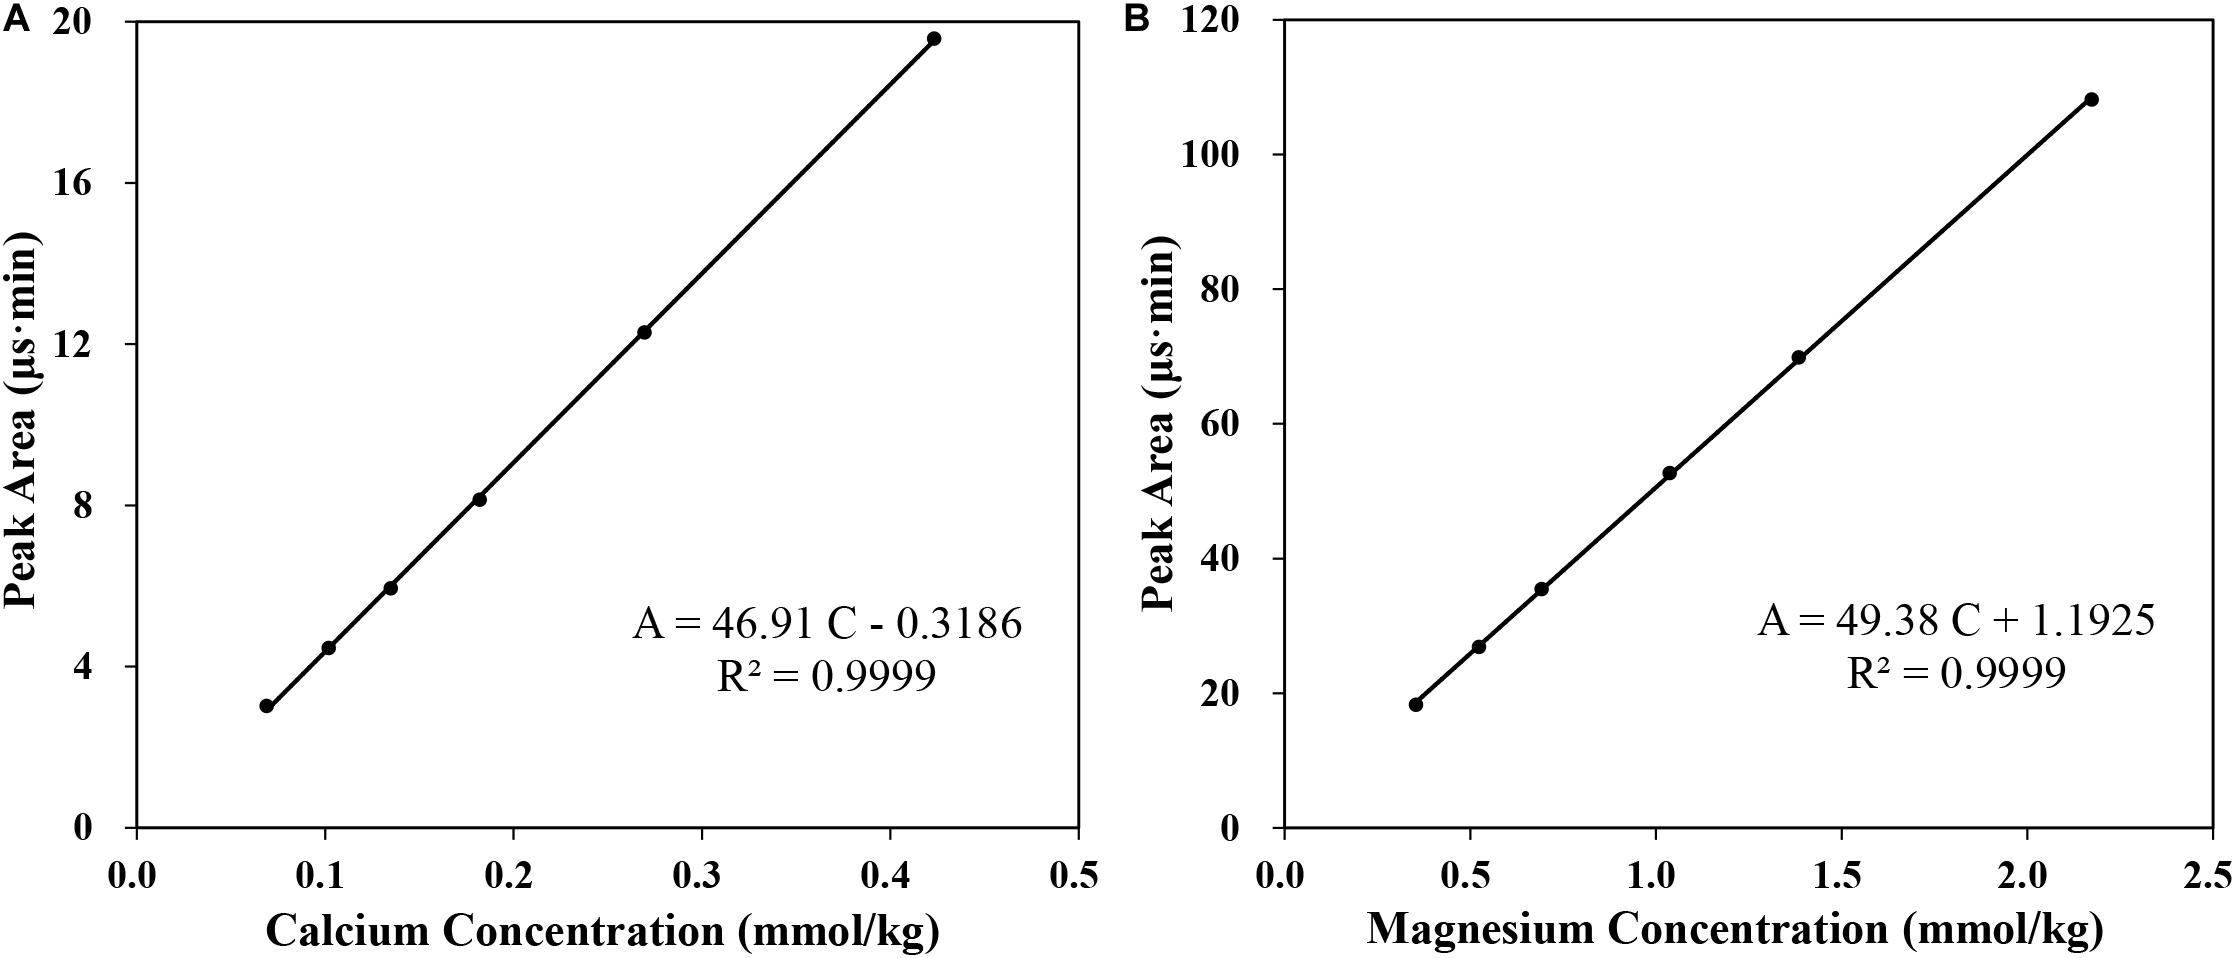
Figure 5. The analytical curve of calcium (A) and magnesium (B).
Accuracy and Interferences of Mg2+ and Sr2+
The accuracy of any method can only be determined relative to a reference standard that has been certified by several independent laboratories, typically using a number of different techniques. However, there is no such certified seawater standard for Ca2+. Therefore, in this study, the accuracy of this method was determined through the recovery test. Three calcium standards with certain concentrations were obtained by adding a certain amount of calcium standard solution to IAPSO seawater. According to the narrow variation range of [Ca2+] in seawater, the [Ca2+] of IAPSO seawater increased by 0.5, 2, and 5%, respectively, relative to the initial concentration. The density of the calcium standard solution was 1.000 g/cm3 at 25°C determined by gravimetric method. As shown in Table 3, the recovery ratio is 100 ± 0.3%, which is slightly larger than the required accuracy (100 ± 0.1%). However, comparing with the recovery test results of other IC methods, the recovery ratio of the present method is much better than that of others, whose errors are approximately 1–5% (Thomas et al., 2002; Zeng et al., 2006; Caland et al., 2012; Melendez et al., 2013). It’s worth noting that there may be some potential errors in the recovery test, such as the change of solution density and Mg/Ca ratio in standard preparation, the accurate value of [Ca2+] calculated after addition, etc. The error of recovery ratio (0.3%) is partly caused by the standard preparation. Thus, the recovery ratio cannot well represented the accuracy of this method, which may be better than 100 ± 0.3%. Nonetheless, until an independently Ca2+-certified natural seawater reference becomes widely available, the accuracy of this method remains to be further determined.
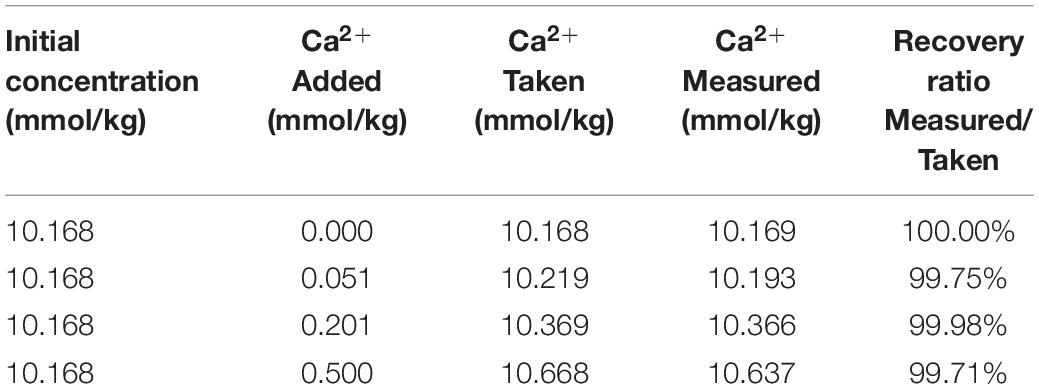
Table 3. Results of recovery test by adding known calcium standard solution to IAPSO seawater.
In order to study the effect of Mg2+ and Sr2+ concentrations on Ca2+ analysis, zero salinity Mg2+ and Sr2+ standards were separately added into IAPSO seawater to produce samples of Mg/Ca ratio from 1 to 2.01 and Sr/Ca ratio from 1 to 7.08 that of seawater ratio. In each case, Ca2+ was determined at least three times to ensure the results agreeing within 0.1%. Results of these analyses are presented in Table 4. With the increasing Mg2+ concentration, the measured [Ca2+] deviates from the real value and decreases with increasing of the Mg2+ concentration or Mg/Ca ratio in sample.
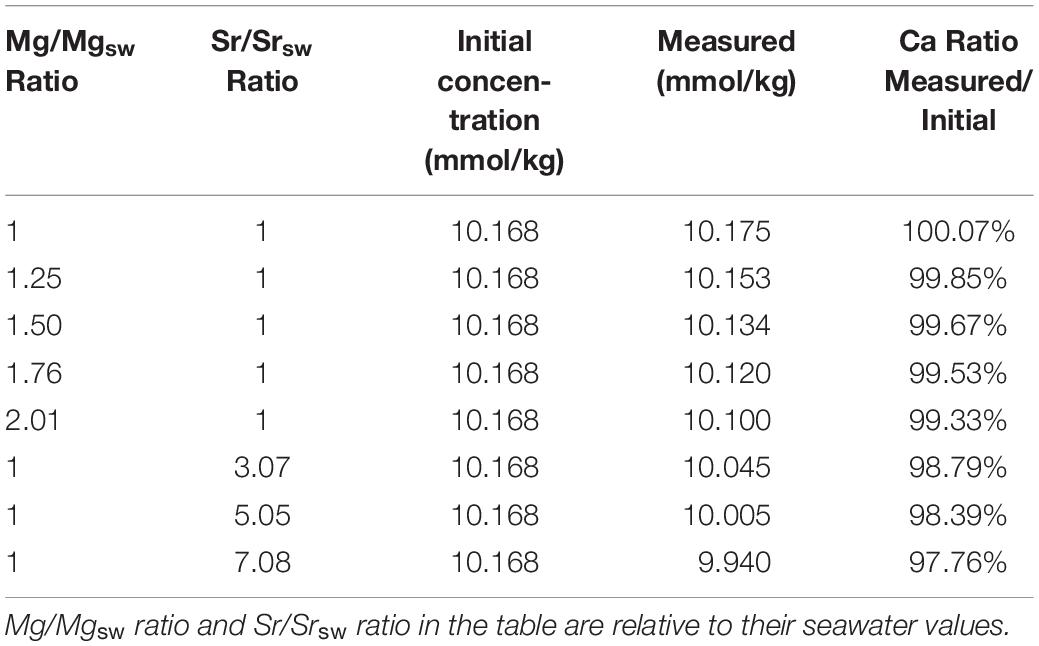
Table 4. Study of the effects of Mg2+ and Sr2+ on Ca2+ determinations.
When the measured [Ca2+] is plotted against the Mg/Ca ratio in the sample (Figure 6), a good linearity could be obtained (R2 = 0.995), which provides a method to correct the underestimate of [Ca2+] in the sample caused by deviated Mg/Ca ratios. The correction equation could be described as follows:
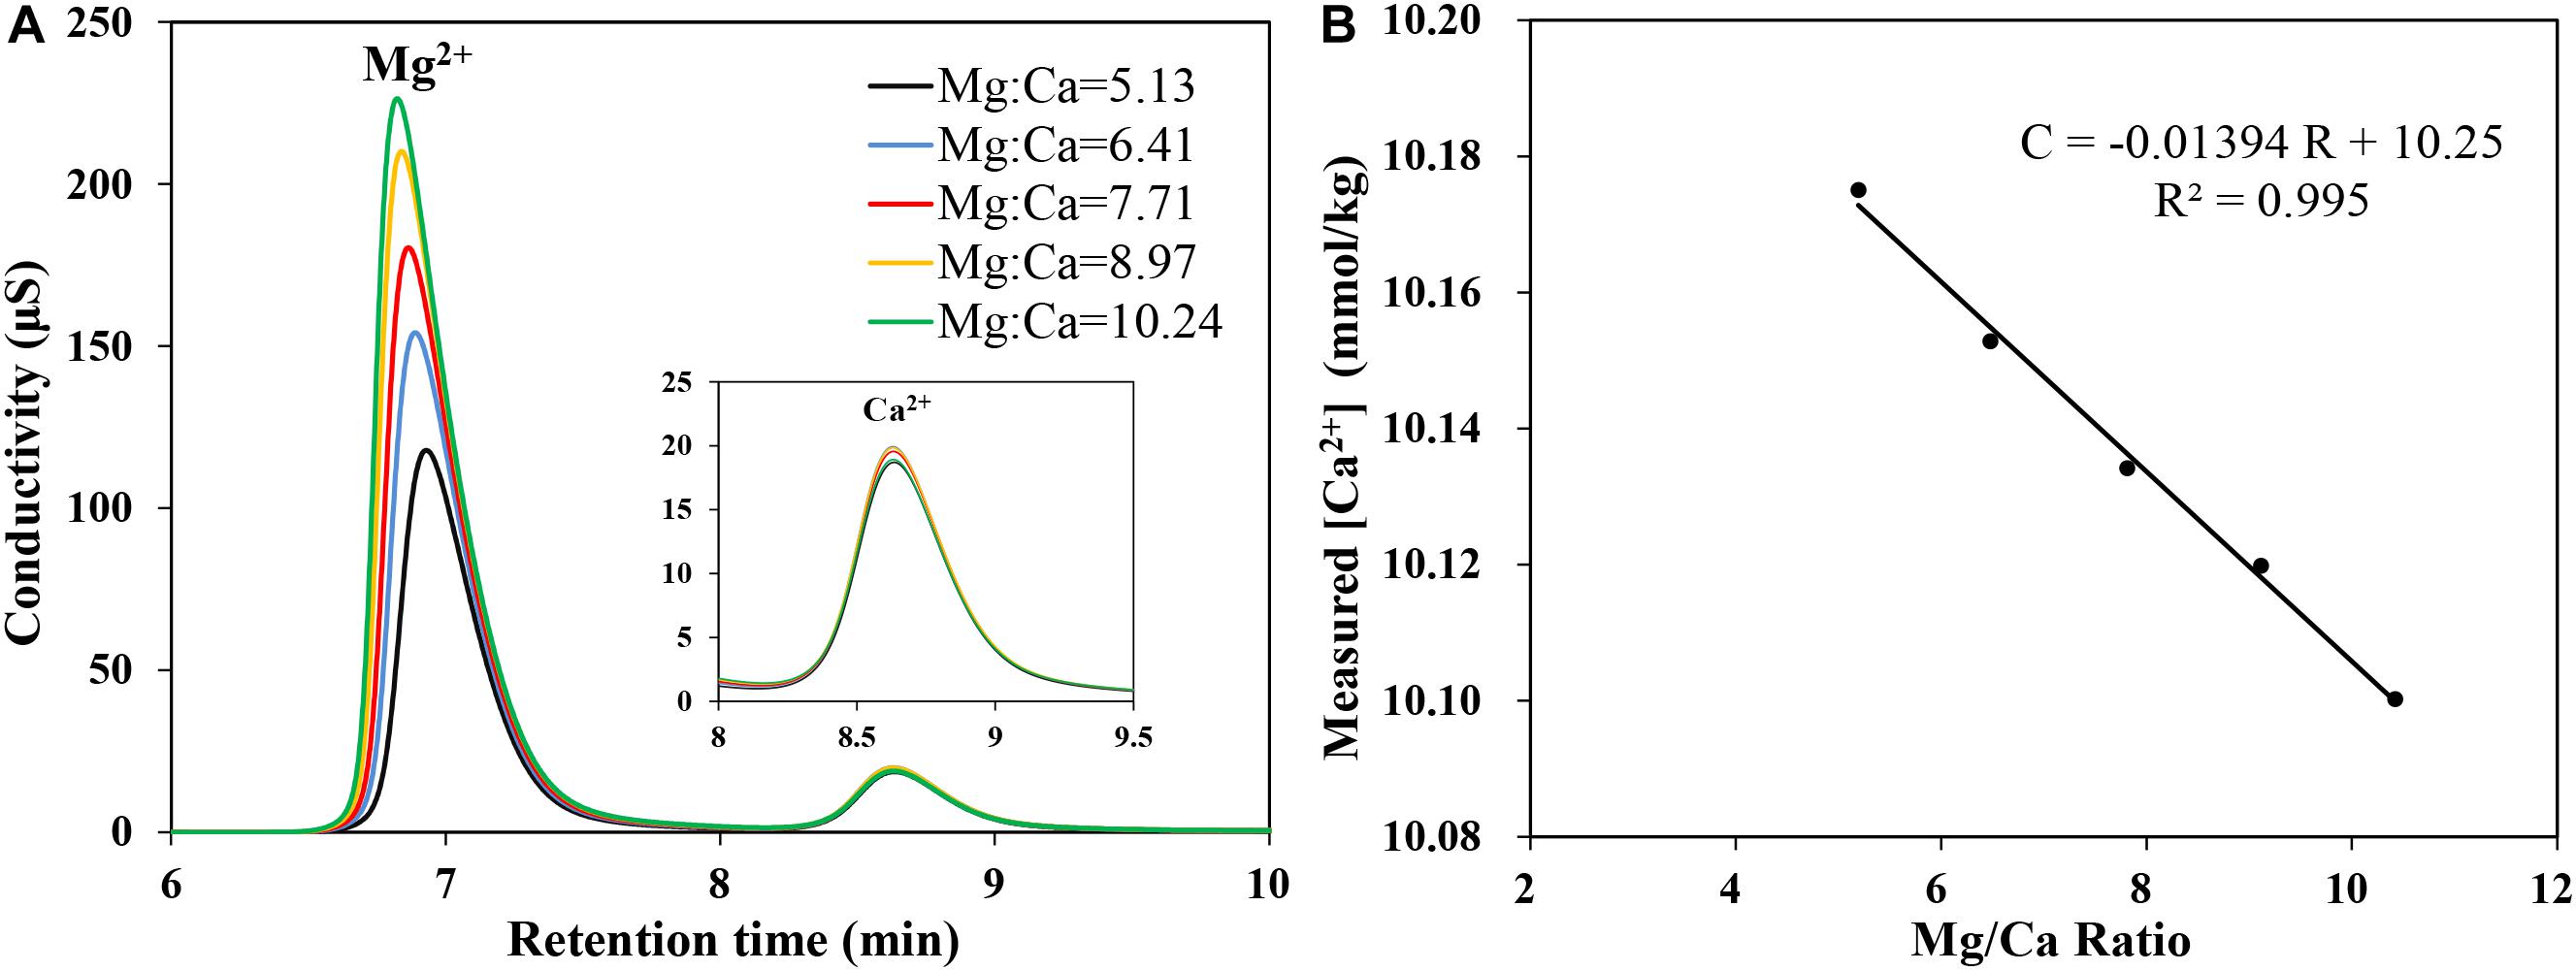
Figure 6. (A) Chromatogram obtained for Mg2+ and Ca2+ in IAPSO seawater with different Mg/Ca ratios. (B) The linear relationship between the measured Ca2+ concentration and Mg/Ca ratio (R2 = 0.995).
where [Ca2+]correcting is the Ca2+ concentration after correction; [Ca2+]measured is the Ca2+ concentration measured by IC; R is the Mg/Ca ratio, which could be obtained from measured Mg2+ and Ca2+ concentrations; K is the slope of the regression fitting equation, which relates to the parameters including the eluent concentration, flow rate, etc. According to the linear fitting equation (C = −0.01394 R + 10.25) and the Mg/Ca ratio in IAPSO seawater (5.137), Eq. 2 could be rewritten as Eq. 3.
After correction with Eq. 3, the Ca2+ concentrations of samples with different Mg/Ca ratios, listed in Table 5, show good accuracy with deviation within 0.1%. Sr2+ has a similar effect on the Ca2+ measurement and the results can also be corrected with a similar correction method. Considering that the Sr2+ concentration in seawater is extremely low and the variation of Sr/Ca ratio is only approximately 2–3% (Villiers, 1999), the influence of Sr2+ on the Ca2+ measurement can be neglected by IC method when using IAPSO seawater as a reference.
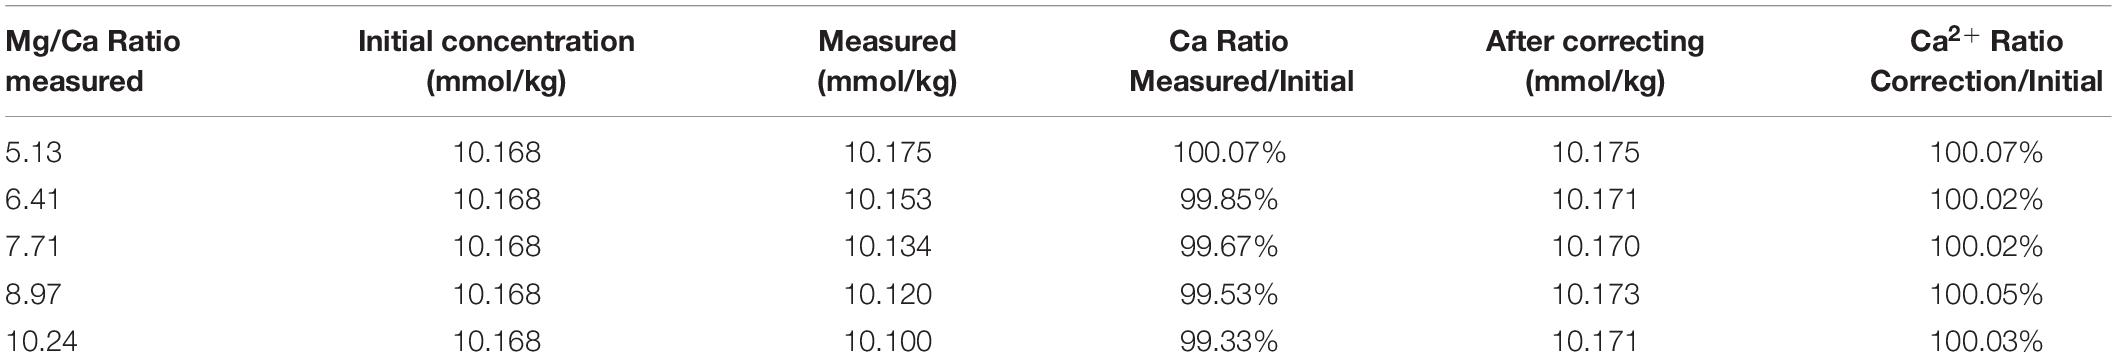
Table 5. Results of Ca2+ concentration after correction according to Mg/Ca ratio.
Application of This Method
The optimized Ca2+ determination method by IC has good sensitivity and reproducibility which enables precise analysis of small variations of [Ca2+] in high ionic strength seawater, that will contribute to a more comprehensive study of the carbonate system in seawater. We applied this method to analyze the Ca2+ distribution in natural seawater. As shown in Figure 7A, water samples were collected from two stations in Southwest Indian Ocean in November 2018. Water column samples were collected with Niskin bottles and stored in 100 mL acid-cleaned polyethylene bottles. Calcium were determined by this method and salinity were determined shipboard with the Conductivity-Temperature-Depth (CTD) recorder. Figure 7B shows the depth profiles of salinity at the sampling stations and Figure 7C shows the vertical distribution of the Ca2+ and normalized Ca2+ (NCa2+) calculated by the Eq. 4. The [Ca2+] gradually decreases from 0 to 200 m and there is a rapid decrease up to 800 m, while at higher depths is found to remain constant, which is consistent with the investigation of Naik et al. (1983). The profiles of NCa2+ indicates that the ratios of Ca2+/Sal in deep waters is higher than that in surface waters, which is the result of CaCO3 precipitation and dissolution process. It is also noted that the NCa2+ of medium-deep waters in Site 2 is lower than that in Site 1. There are more accumulations of dissolved Ca2+ in Site 1 at this depth due to the “older” Antarctic intermediate water and North Atlantic deep water. The studies of Horibe et al. (1974) and Villiers (1998) found similar variations in the NCa2+ of deep water in different ocean basins. The high resolution of sampling is needed for a detailed discussion.
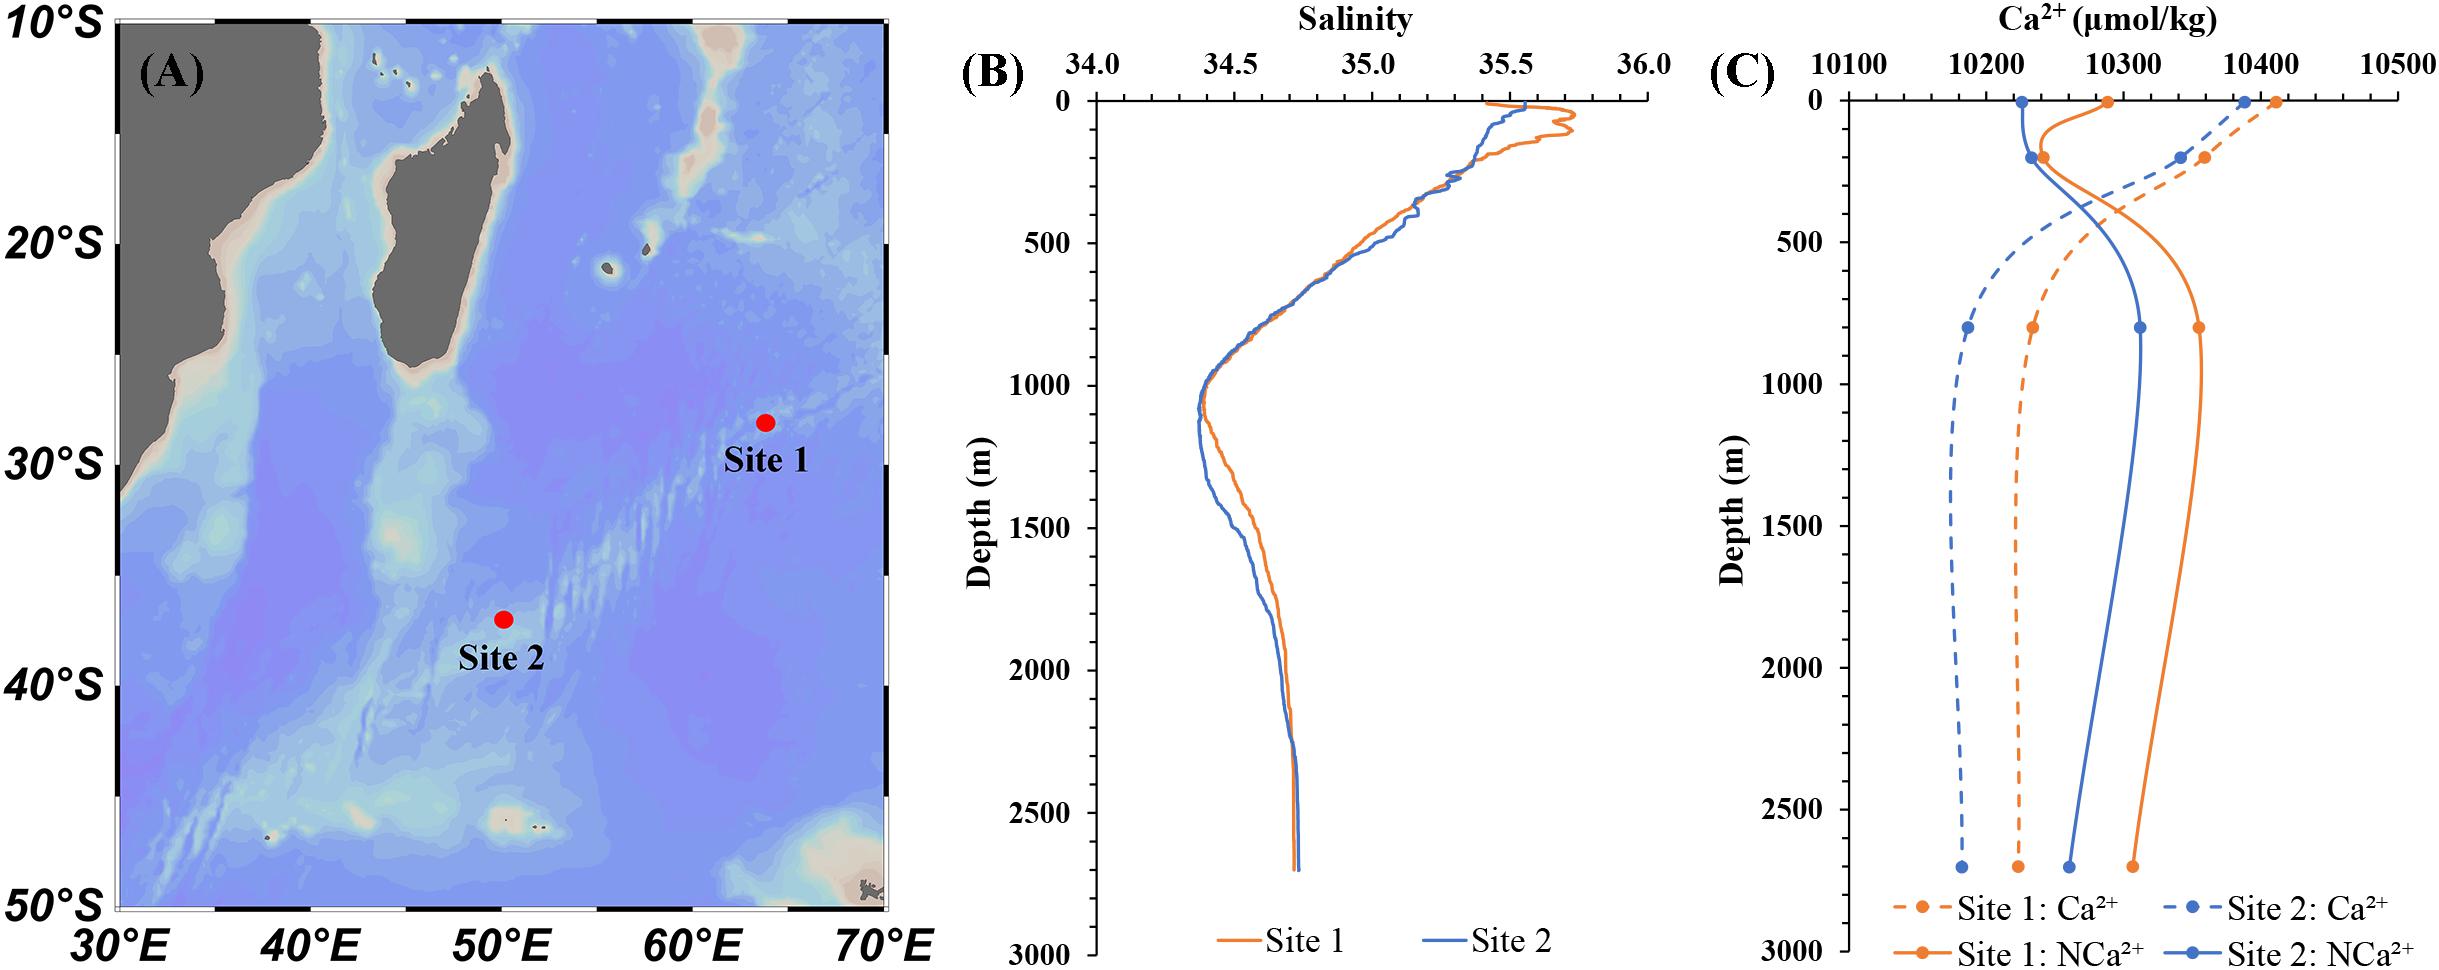
Figure 7. (A) Map showing the stations position in Southwest Indian Ocean. The vertical distribution of the salinity (B), Ca2+ and NCa2+ (C).
Benefit from the small required sample volume and the simple measurement operation, this method can also be applied to the laboratory study of calcium carbonate precipitation and dissolution, but having little effect on the reaction solution volume. In this study, we studied the precipitation rate of calcite in seawater with this method. The calcite crystal growth experiments were conducted by adding calcite seeds (0.1 g) into the sealed Duran bottles. The calcite growth would initiate after adding 500 ml artificial seawater with initial saturation (Ω) of ∼12. The artificial seawater was prepared following Kester et al. (1967). During the experiments, 10 ml aliquots of the reacting solution were sampled every 2 to 3 days, and filtered through a 0.45 μm membrane for later analysis. pH was measured at 25 ± 0.01°C with an Orion Ross combination glass pH electrode calibrated against three NIST standard buffers (4.01, 7.00, and 10.01). DIC was measured in triplicate using a DIC analyzer (Apollo Scitech, AS-C3). [Ca2+] was determined by this method. TAlk was detected by the Gran Titration (Millero et al., 1993) only for the initial and final reacting solution to save sample volume. Both DIC and TAlk were calibrated against the Dickson reference seawater and the precision was better than 0.1%. When calcite precipitated, the corresponding reduction of [Ca2+], DIC and TAlk should follow the theoretical ratio of 1: 1: 2. Comparing the variations of [Ca2+], DIC and TAlk parameters in solution before and after precipitation, the average ratio of ΔCa: ΔDIC: ΔTAlk is 0.986: 0.917: 2 (Table 6).
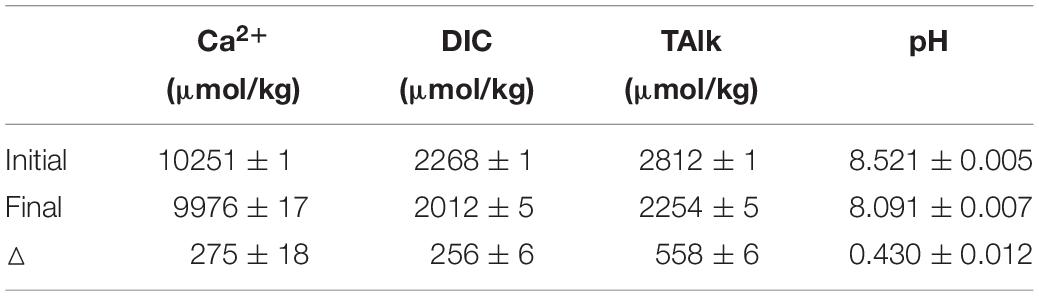
Table 6. Results of the reacting solution components (three parallel groups).
The ΔCa: ΔTAlk ratio of 0.986:2 deviates by about 1% from the theoretical ratio of 1:2, which is more than the combined precisions of the IC (Ca2+) and titrations (TAlk) methods. Because when calculate the Δ, the absolute errors of [Ca2+] and TAlk are still preserved (even larger) as shown in Table 6. Besides, the errors of ΔCa and ΔTAlk are partly caused by three parallel experiments. Thus, considering these errors, the relative error of ΔCa and ΔTAlk will be more than 1%. If we assume that the measured value of ΔTAlk (558 ± 6 μmol/kg) was absolutely accurate, then the expected value of ΔCa would be 279 ± 3 μmol/kg. In fact, the measured value of ΔCa is 275 ± 18 μmol/kg, which is consistent with the expected value. Although the ΔCa: ΔTAlk ratio is as expected, due to the large absolute error (of approximately ± 10 μmol/kg) of calcium determination, there may be some deviation when establishing the relationship between [Ca2+] and TAlk in natural seawater. This also indicates that the current precision of calcium determination (<0.1%) is not enough, which needs to reach better than 0.02% as mentioned above.
Reduction in DIC shows a relatively smaller value in comparison. When the variations of [Ca2+] is depicted against DIC reduction at a regular interval, good linearity is achieved when the least squares linear fitting algorithm is used to fit the data. The slope of the regression is close to 1.08 (Figure 8). The deviation of slope from the theoretical value 1 may be caused by the DIC data, which could be partly influenced by atmospheric CO2 during sampling. This result suggests that the optimized method for determination of [Ca2+] has a good response to the small variation of Ca2+ in seawater. More importantly, compared to DIC, which could be influenced by other carbon related process, especially CO2 interference form atmosphere, changes of Ca2+ are almost exclusively controlled by the CaCO3 precipitation.
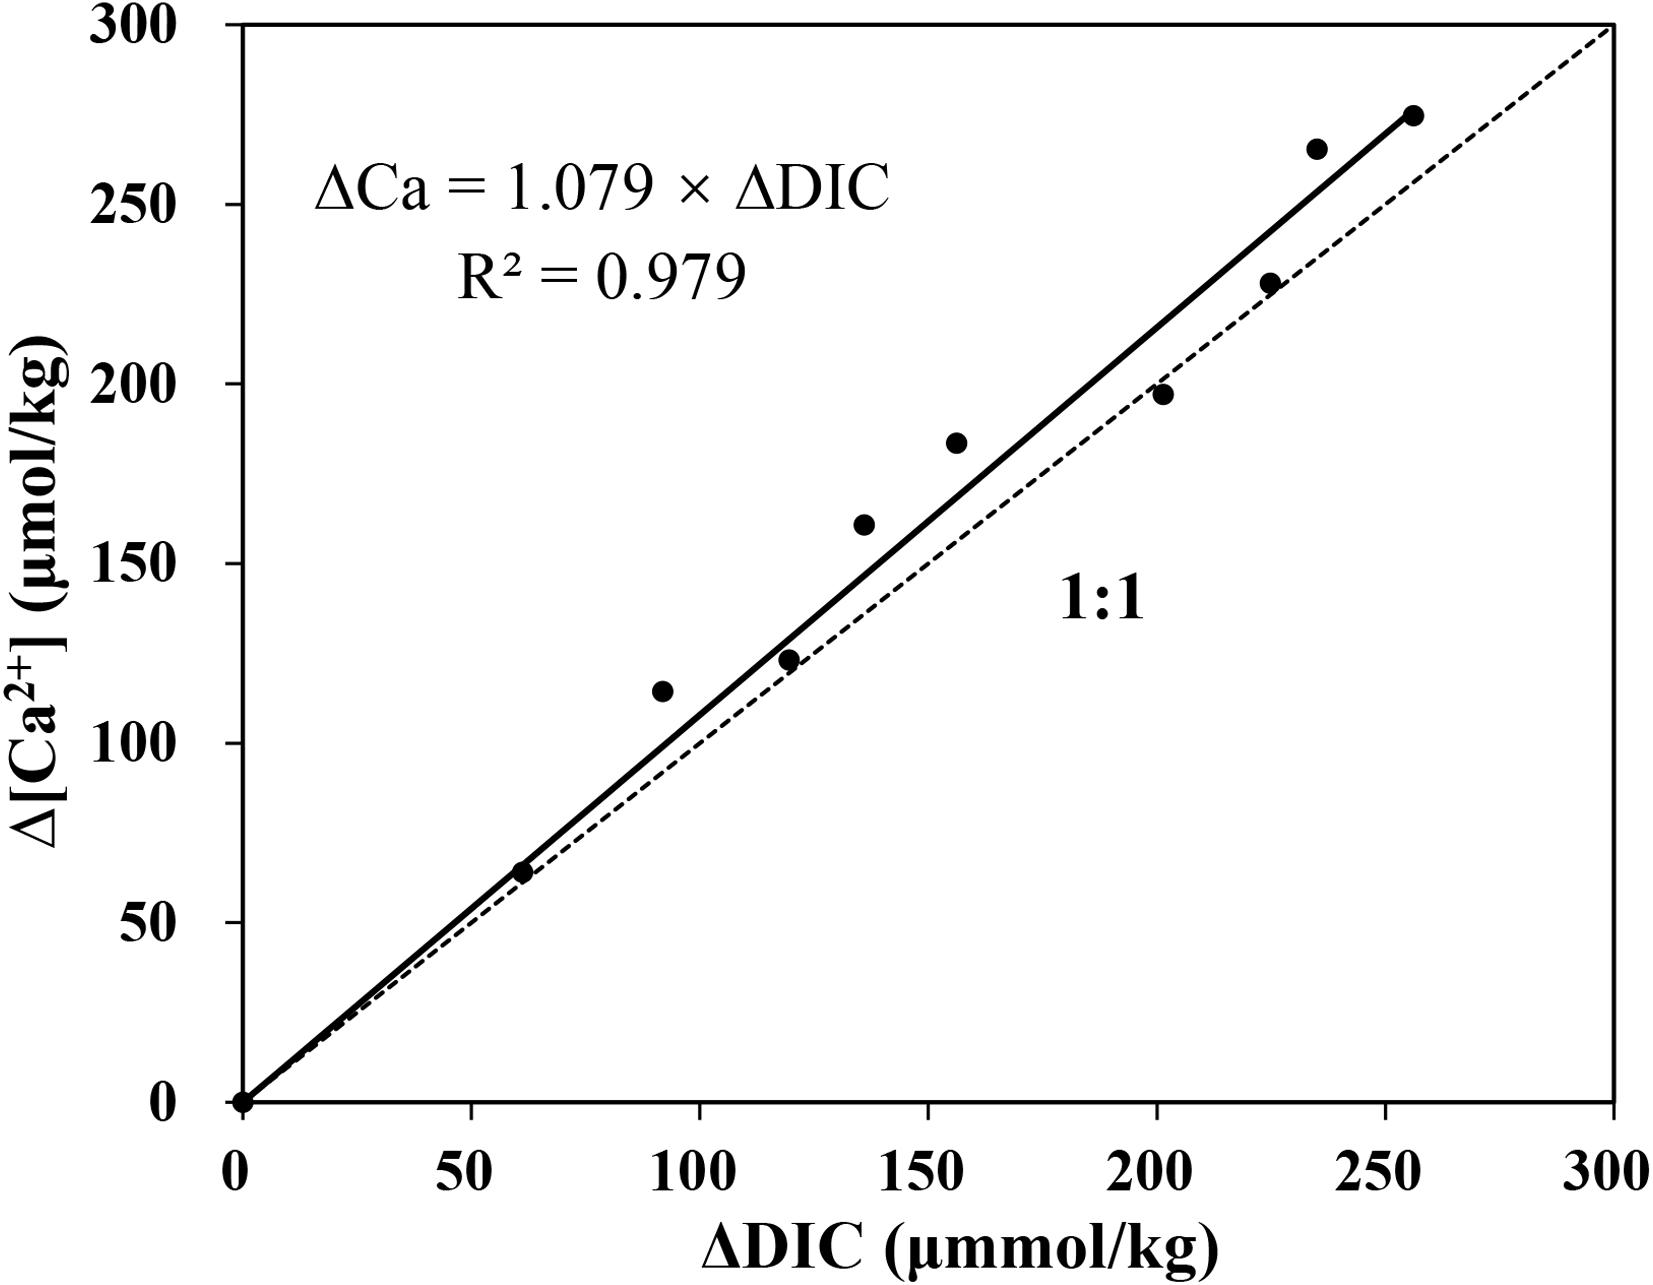
Figure 8. The variation of Ca2+ and DIC in the reacting solution. Δ[Ca2+] is well matched with ΔDIC, while the ratio of them is slightly greater than 1:1.
In summary, this method can be widely applied to the analysis of Ca2+ distribution in the ocean and the laboratory studies of calcium carbonate precipitation and dissolution in seawater. Determination of [Ca2+] in high precision can help to elucidate the precipitation/dissolution process of calcium carbonate, especially the process of being affected by biological activity. High quality Ca2+ data can also be compared with DIC and TAlk dataset to describe the carbonate system in a more comprehensive way.
Conclusion
Based on the common method, a simple, high precision, non-toxic and labor-saving technique using IC for detecting Ca2+ concentration in seawater has been developed. With the manual sample injection method, an overall precision of better than 0.1% could be achieved in Ca2+ detection in seawater. Instead of the single calcium standard solution, IAPSO seawater is used as the Ca2+ reference to achieve a higher accuracy.
Effects of sample dilutions, Mg2+ and Sr2+ on measured [Ca2+] have also been investigated. Sample dilutions have no discernible effect on the measurements. However, due to the little overlap between peaks, Mg2+ shows a linear decrease in measured [Ca2+] with the increasing Mg/Ca ratio in seawater. Thus, according to the measured Mg/Ca ratio in seawater, the measured [Ca2+] can be further corrected to reach higher accuracy with deviation within 0.1%. Sr2+ has similar effects on the Ca2+ measurements and the results can also be corrected with a similar correction method.
This method has been applied to the analysis of Ca2+ distribution in Southwest Indian Ocean and the laboratory study on the calcite precipitation in seawater. The small variations of [Ca2+] can be effectively detected in the experiment of calcite precipitation in seawater and that are consistent well with the variations of DIC and TAlk. This shows that our method offers good sensitivity for Ca2+ determinations in seawater with high precision. It will contribute to a more comprehensive study of the carbonate system in seawater with Ca2+ parameter.
Data Availability Statement
All datasets generated for this study are included in the article/supplementary material.
Author Contributions
YP directed the study and its scope. HH, YL, SW, and YP conceived and designed the experiments. HH, YL, SW, and QM performed the experiments. HH and SW compiled and processed all the field and laboratory data. HH wrote the manuscript, with edits and contributions from all co-authors.
Funding
This work was supported by the National Key Research and Development Program of China (Grant No. 2016YFC0304905), the National Natural Science Funds of China (Grant No. 41776084), and the Fundamental Research Funds for the Central Universities (Grant No. 2018QNA4048).
Conflict of Interest
The authors declare that the research was conducted in the absence of any commercial or financial relationships that could be construed as a potential conflict of interest.
Acknowledgments
We thank Prof. Wei-jun Cai, Prof. Yan Zhu, and Mr. Qi Lin for their constructive suggestions for this study. We also thank the editor, JS, along with two reviewers, ZC and ML, for their careful and thoughtful review comments on the content and organization of this article. Furthermore, thanks are due to Naifei Zhong for his help with the technical support.
References
Andersson, A. J., and Gledhill, D. (2013). Ocean acidification and coral reefs: effects on breakdown, dissolution, and net ecosystem calcification. Ann. Rev. Mar. Sci. 5, 321–348. doi: 10.1146/annurev-marine-121211-172241
Barrett, P. M., Resing, J. A., Buck, N. J., Feely, R. A., Bullister, J. L., et al. (2014). Calcium carbonate dissolution in the upper 1000 m of the eastern North Atlantic. Glob. Biogeochem. Cycles 28, 386–397. doi: 10.1002/2013gb004619
Cai, W. J., Hu, X., Huang, W. J., Murrell, M. C., Lehrter, J. C., et al. (2011). Acidification of subsurface coastal waters enhanced by eutrophication. Nat. Geosci. 4, 766–770. doi: 10.1038/ngeo1297
Caland, L. B. D., Silveira, E. L. C., and Tubino, M. (2012). Determination of sodium, potassium, calcium and magnesium cations in biodiesel by ion chromatography. Anal. Chim. Acta 718, 116–120. doi: 10.1016/j.aca.2011.12.062
Cao, Z., and Dai, M. (2011). Shallow-depth CaCO3 dissolution: evidence from excess calcium in the South China Sea and its export to the Pacific Ocean. Glob. Biogeochem. Cycles 25:GB2019.
Chen, C. A. (1978). Decomposition of calcium carbonate and organic carbon in the deep oceans. Science 201, 735–736. doi: 10.1126/science.201.4357.735
Chung, S. N., Lee, K., Feely, R. A., Sabine, C. L., Millero, F. J., et al. (2003). Calcium carbonate budget in the Atlantic Ocean based on water column inorganic carbon chemistry. Glob. Biogeochem. Cycles 17:1093.
Culkin, F., and Cox, R. A. (1966). Sodium, potassium, magnesium, calcium and strontium in sea water. Deep Sea Res. Oceanogr. Abst. 13, 789–804. doi: 10.1016/0011-7471(76)90905-0
Dickson, A. G., Sabine, C. L., and Christian, J. R. (2007). Guide to Best Practices for Ocean CO2 Measurements. Sidney: North Pacific Marine Science Organization.
Doney, S. C., Fabry, V. J., Feely, R. A., and Kleypas, J. A. (2009). Ocean acidification: the other CO2 problem. Annu. Rev. Mar. Sci. 1, 169–192.
Feely, R. A., and Chen, C. T. A. (1982). The effect of excess CO2 on the calculated calcite and aragonite saturation horizons in the northeast Pacific. Geophys. Res. Lett. 9, 1294–1297. doi: 10.1029/gl009i011p01294
Feely, R. A., Sabine, C. L., Lee, K., Berelson, W., Kleypas, J., et al. (2004). Impact of anthropogenic CO2 on the CaCO3 system in the oceans. Science 305, 362–366. doi: 10.1126/science.1097329
Garcıá-Fernández, R., Garcıá-Alonso, J. I., and Sanz-Medel, A. (2004). Simultaneous determination of inorganic anions, calcium and magnesium by suppressed ion chromatography. J. Chromatogr. A 1033, 127–133. doi: 10.1016/j.chroma.2004.01.024
Grasshoff, K., Kremling, K., and Ehrhardt, M. (2009). Methods of Seawater Analysis. Hoboken, NJ: John Wiley & Sons.
Hadjiioannou, T. P., and Papastathopoulous, D. S. (1970). EDTA titration of calcium and magnesium with a calcium-selective electrode. Talanta 17, 399–406. doi: 10.1016/0039-9140(70)80085-6
Horibe, Y., Endo, K., and Tsubota, H. (1974). Calcium in the South Pacific, and its correlation with carbonate alkalinity. Earth Planet. Sci. Lett. 23, 136–140. doi: 10.1016/0012-821x(74)90040-5
Jiang, L. Q., Cai, W. J., Feely, R. A., Wang, Y. C., Guo, X. H., et al. (2010). Carbonate mineral saturation states along the U.S. East Coast. Limnol. Oceanogr. 55, 2424–2432. doi: 10.4319/lo.2010.55.6.2424
Kanamori, S., and Ikegami, H. (1980). Computer-processed potentiometric titration for the determination of calcium and magnesium in sea water. J. Oceanogr. Soc. Jpn. 36, 177–184. doi: 10.1007/bf02070330
Kester, D. R., Duedall, I. W., Connors, D. N., and Pytkowicz, R. M. (1967). Preparation of artificial seawater. Limnol. Oceanogr. 12, 176–179.
Kleypas, J. A., Buddemeier, R. W., and Gattuso, J. P. (2001). The future of coral reefs in an age of global change. Int. J. Earth Sci. 90, 426–437. doi: 10.1007/s005310000125
Laikhtman, M., Riviello, J., and Rohrer, J. S. (1998). Determination of magnesium and calcium in 30% sodium chloride by ion chromatography with on-line matrix elimination. J. Chromatogr. A 816, 282–285. doi: 10.1016/s0021-9673(98)00530-5
Lebel, J., and Poisson, A. (1976). Potentiometric determination of calcium and magnesium in seawater. Mar. Chem. 4, 321–332. doi: 10.1016/0304-4203(76)90018-9
Melendez, M., Corredor, J. E., Nesterenko, E. P., and Nesterenko, P. N. (2013). Direct chromatographic separation and determination of calcium and magnesium in seawater and sediment porewaters. Limnol. Oceanogr. Methods 11, 466–474. doi: 10.4319/lom.2013.11.466
Millero, F. J., Feistel, R., Wright, D. G., and McDougall, T. J. (2008). The composition of standard Seawater and the definition of the reference-composition salinity scale. Deep Sea Res. I 55, 50–72. doi: 10.1016/j.dsr.2007.10.001
Millero, F. J., Zhang, J. Z., Lee, K., and Campbell, D. M. (1993). Titration alkalinity of seawater. Mar. Chem. 44, 153–165. doi: 10.1016/0304-4203(93)90200-8
Milliman, J. D., Troy, P. J., Balch, W. M., Adams, A. K., Li, Y. H., and Mackenzie, F. T. (1999). Biologically mediated dissolution of calcium carbonate above the chemical lysocline? Deep Sea Res. I Oceanogr. Res. Pap. 46, 1653–1669. doi: 10.1016/s0967-0637(99)00034-5
Naik, S., Noronha, R. J., Shirodkar, P. V., and Gupta, R. S. (1983). On the distribution of calcium, magnesium, sulphate and boron in the south-western Indian Ocean region of the Southern Ocean. Sci. Rep. First Indian Exp. Antarct. 1983, 87–94.
Olson, E. J., and Chen, C. A. (1982). Interference in the determination of calcium in seawater. Limnol. Oceanogr. 27, 375–380. doi: 10.4319/lo.1982.27.2.0375
Riley, J. P., and Tongudai, M. (1967). The major cation/chlorinity ratios in sea water. Chem. Geol. 2, 263–269. doi: 10.1016/0009-2541(67)90026-5
Sabine, C. L., Key, R. M., Feely, R. A., and Greeley, D. (2002). Inorganic carbon in the Indian Ocean: distribution and dissolution processes. Glob. Biogeochem. Cycles 16:1067.
Schmid, R. W., and Reilley, C. N. (1957). New complexon for titration of calcium in presence of magnesium. Anal. Chem. 29, 258–264.
Shiller, A. M., and Gieskes, J. M. (1980). Processes affecting the oceanic distributions of dissolved calcium and alkalinity. J. Geophys. Res. Oceans 85, 2719–2727.
Smith, S. V., and Mackenzie, F. T. (2016). The role of CaCO3 reactions in the contemporary oceanic CO2 cycle. Aquat. Geochem. 22, 153–175. doi: 10.1007/s10498-015-9282-y
Thomas, D. H., Rey, M., and Jackson, P. E. (2002). Determination of inorganic cations and ammonium in environmental waters by ion chromatography with a high-capacity cation-exchange column. J. Chromatogr. A 956, 181–186. doi: 10.1016/s0021-9673(02)00141-3
Tsunogai, S., Nishimura, M., and Nakaya, S. (1968). Calcium and magnesium in seawater and the ratio of calcium to chlorinity as a tracer of water masses. J. Oceanogr. Soc. Jpn. 24, 153–159. doi: 10.5928/kaiyou1942.24.153
Villiers, S. D. (1998). Excess dissolved Ca in the deep ocean: a hydrothermal hypothesis. Earth Planet. Sci. Lett. 164, 627–641. doi: 10.1016/s0012-821x(98)00232-5
Villiers, S. D. (1999). Seawater strontium and Sr/Ca variability in the Atlantic and Pacific oceans. Earth Planet. Sci. Lett. 171, 623–634. doi: 10.1016/s0012-821x(99)00174-0
Whitfield, M., and Leyendekkers, J. V. (1969). Liquid ion-exchange electrodes as end-point detectors in compleximetric titrations. Determination of calcium and magnesium in the presence of sodium. Anal. Chim. Acta 46, 63–70. doi: 10.1016/0003-2670(69)80042-5
Keywords: calcium concentration, seawater, ion chromatography, manual sample injection, high precision, Mg/Ca ratio
Citation: He H, Li Y, Wang S, Ma Q and Pan Y (2020) A High Precision Method for Calcium Determination in Seawater Using Ion Chromatography. Front. Mar. Sci. 7:231. doi: 10.3389/fmars.2020.00231
Received: 30 October 2019; Accepted: 25 March 2020;
Published: 17 April 2020.
Edited by:
Johan Schijf, University of Maryland Center for Environmental Science (UMCES), United StatesReviewed by:
Zhimian Cao, Xiamen University, ChinaMario Lebrato, University of California, San Diego, United States
Copyright © 2020 He, Li, Wang, Ma and Pan. This is an open-access article distributed under the terms of the Creative Commons Attribution License (CC BY). The use, distribution or reproduction in other forums is permitted, provided the original author(s) and the copyright owner(s) are credited and that the original publication in this journal is cited, in accordance with accepted academic practice. No use, distribution or reproduction is permitted which does not comply with these terms.
*Correspondence: Yiwen Pan, evelynpan@zju.edu.cn