Article

Evaluation of Popcorn Hybrids for Nitrogen Use Efficiency and Responsiveness

by
Adriano dos Santos
1,*,
Antônio Teixeira do Amaral Júnior
1,
Samuel Henrique Kamphorst
1,*,
Gabriel Moreno Bernardo Gonçalves
1,
Pedro Henrique Araújo Diniz Santos
1,
Janieli Maganha Silva Vivas
1,
Gabrielle Sousa Mafra
1,
Shahid Khan
1,
Fabio Tomaz de Oliveira
1,
Kátia Fabiane Medeiros Schmitt
1,
Divino Rosa dos Santos Junior
1 and
Freddy Mora
2
1
Plant Breeding Laboratory, Agricultural Science and Technology Center, Darcy Ribeiro State University of Northern Rio de Janeiro, Av. Alberto Lamego, 2000, Campos dos Goytacazes, RJ 28013-602, Brazil
2
Institute of Biological Sciences, University of Talca, Av. Lircay, s/n, Talca 3460000, Chile
*
Authors to whom correspondence should be addressed.
Agronomy 2020, 10(4), 485; https://doi.org/10.3390/agronomy10040485
Submission received: 3 March 2020 / Revised: 27 March 2020 / Accepted: 28 March 2020 / Published: 1 April 2020
(This article belongs to the Section Crop Breeding and Genetics)

Abstract

:
The global boom in agricultural production has been associated with the exponential increase of nitrogen (N) fertilizer application. This heavy use of nitrogen in agriculture has caused negative impacts on the environment. Therefore, new alternatives are needed to maintain or increase maize yield but reduce the environmental impact. For this purpose, one possibility is to plant N-use efficient (NUE) cultivars. In this context, the objective of this study was to identify popcorn hybrid cultivars that are highly NUE and N-responsive, bred from crosses between inbred lines with contrasting levels of N-use efficiency. For this purpose, 90 hybrids were evaluated in a 10 × 10 triple lattice design at two sites and two levels of N availability (low and ideal availability). The results indicated that for the environment with low nitrogen availability, the lack of nitrogen reduced the chlorophyll content, extended the interval between male and female flowering, and affected the performance of the tested hybrids. However, we observed the existence of hybrids with greater efficiency than the responsiveness to nitrogen and with high productivity. These can even be used on farms where the level of production inputs is low, thus contributing to ensure food security.

1. Introduction

The main direct or indirect objective of plant breeding, be it from the agronomic or the economic point of view, is an increase in crop yields [1,2]. This increase in the target yield by breeding has been accelerated mainly by the implementation of new technologies, but also by the extensive use of fertilizers [3]. Among these, nitrogen (N) is the most commonly used fertilizer in agriculture. In 2015, 112.5 million tons were used worldwide and an estimated 118.2 million tons in 2019 [4]. However, excessive applications harm the environment, for example, by soil acidification and water and air pollution [1], since the plants are able to use only 30%–40% of the applied nitrogen [5]. Thus, over 60% of soil N is lost to surface runoff, denitrification, volatilization, and microbial consumption [6].
In this sense, the use of N-use efficient cultivars is an option to ensure the maintenance of yield levels with a reduced impact on production costs and the environment. In this respect, the generation of detailed information on N-use efficient and inefficient genotypes is essential. Different strategies addressing the optimization of N fertilizer use worldwide, targeting both economic and environmental benefits, were published by Good et al. (2011) [7]. According to the review, the implementation of improved practices of N use together with adaptation to each country by breeding can substantially reduce excessive applications of N fertilizers without affecting crop yields. This will evidently result in environmental and economic benefits, since a 1% increase in nitrogen-use efficiency (NUE) of crops would save $1.1 billion annually, according to the estimation by Kant et al. (2011) [6].
In addition, the estimated population growth to 9.6 billion by 2050 will boost the demand for a substantial increase in agricultural yields. In a more visionary analysis, the required increase in grain yield to meet the future demand is projected at between 50% and 70% for 2050 [1]. As maize is the basis of many food products around the world, improving its NUE is a major step towards the establishment of sustainable agriculture [6,8]. Therefore, new varieties that require less N-based fertilizer, while maintaining high yields and grain quality, must be developed and released. For this reason, a number of public institutions and leading seed improvement companies are investing in crop genome research and applying molecular marker and transgenic techniques to identify genes that can be used to further optimize NUE [9].
Improving NUE is particularly relevant for maize, since the amounts of N required to obtain maximum yields are high, which is why maize production consumes almost one-fifth of the world’s nitrogen [1]. This clearly shows the need for research to breed genotypes with a higher NUE. In this regard, studies detected large differences among maize lines and hybrids in terms of growth and development capacity in soils with low availability of mineral nutrients, which depends on the efficiency of both N uptake and N use [8]. In this context, the objective of this study was to breed popcorn hybrids from crosses between inbred (S7) lines with contrasting NUE and to evaluate the level of adaptation of the progenies with regard to NUE and N responsiveness, with a view to releasing improved cultivars.

2. Materials and Methods

2.1. Experimental Conditions and Genotypes

The experiments were carried out at two sites: Campos dos Goytacazes, Rio de Janeiro (RJ), (21°42′48″ S, 41°20′38″ W; 14 m asl); and at the Experimental Station of Itaocara, RJ (21°38′50″ S, 42°03′46″ W; 58 m asl). These locations represent, respectively, the North and Northwest regions of the State of Rio de Janeiro. The soil of the experimental station is classified as Latosolic Dystrophic Yellow Argisol at Campos dos Goytacazes and Argisolic Dark Red Latosol at Itaocara (soil chemical properties are listed in Table 1). The climate of both environments is tropical humid (Aw), according to Köppen’s classification. Pluviometric precipitation, minimum and maximum temperature, and relative humidity during the experimental development are available in the Supplementary Material (Figure S1).
The tested genotypes were derived from 10 S7 lines with contrasting NUE crossed in a complete diallel mating design with reciprocals. The lines were previously classified as inefficient and nonresponsive (INR), efficient and responsive (ER), and intermediate for N-use efficiency and N responsiveness [10].
The 90 hybrid progenies (Table 2), together with the 10 S7 parents, were evaluated in a 10 × 10 lattice design with three replications; each experimental unit consisted of one 4.20 m plant row with a spacing of 0.25 m between plants and 0.60 m between rows. Two seeds were sown per hole and thinned to one plant per hole 21 days after emergence, resulting in a density of 18 plants per plot.

2.2. Nitrogen Availability and Studied Traits

To differentiate the experiments with regard to the N availability level, the following strategy was used: (i) for experiments with ideal N availability (high N), planting fertilization was applied, based on the soil chemical analysis, consisting of 32 kg N ha−1, and (ii) sidedressing with 128 kg N ha−1 was used for nitrogen supplementation. For the experiments with low N availability (low N), planting fertilization was similar to that of the previous experiment, and sidedressing consisted of 30% of that applied in the environment with ideal N rates (38.4 kg ha−1). In both cases, urea was used as the nitrogen source. The nitrogen fertilization was carried out on the right side of each line; afterwards, the irrigation system was turned on to decrease its volatilization.
To assess the performance of the hybrids, the following morphological and yield variables were evaluated: (i) chlorophyll content (Soil Plant Analysis Development (SPAD)), measured using a chlorophyll meter (SPAD-502) in the middle third of the ear leaf of six plants per plot during female flowering; (ii) female flowering (FF), when 50% of the plants per plot had visible style/stigma; (iii) flowering interval (FI), the period from male to female flowering; and (iv) grain yield (GY), measurement of the grain yield of each plot, adjusted to 13% moisture and extrapolated to kg ha−1.

2.3. Statistical Analysis

Initially, variance analysis was performed for each environment to test the homogeneity of the residual variance; after verifying the assumptions of the homogeneity of variances, combined variance analysis was performed, considering the effects of genotypes, locations, and N levels, with the main objective of determining possible interactions between genotypes and N availability. However, due to the difficulty of a correct interpretation of the triple interaction, we opted to evaluate the double interactions. Subsequently, the selective accuracy was estimated to be SA = (1 − 1/F)1/2, where F is the value of the F-test for genotypes. In this work, only the F1 hybrids were considered in the analysis, since the main objective was to verify the possibility of obtaining and selecting efficient popcorn hybrids and responsive to the use of nitrogen.
The GGE biplot multivariate analysis was based on phenotypic mean data, considering the following model: Y ¯ ij μ = G j + E j + GE ij , where Ȳij represents the phenotypic mean of genotype i in environment j (ideal or low N availability), μ is the general constant, Gi the effect of genotype i, Ej the effect of the environment j, and GEij the effect of the interaction between genotype i and environment j. The environments were formed by the combination of locale (Campos dos Goytacazes or Itaocra) and nitrogen availability (low or optimal availability).
The GGE biplot model does not separate the genotype effect (G) from the effect of genotype–environment interaction (GE), maintaining them together in two multiplicative terms represented by the equation: Y ij μ β j = g i 1 e 1 j + g i 2 e 2 j + ε ij ; where Yij is the expected performance of genotype i in environment j, µ is the general constant of the observations, βj the main effect of the environment j, g1i and e1j are the principal scores for genotype i in environment j, gi2 and e2j are the secondary scores for genotype i in environment j, and ɛij is the residue unexplained by both effects.
Thus, the biplot graph in the GGE model is constructed by means of the simple dispersion of g1i and gi2 for genotypes and e1j and e2j for environments, by the Singular Value Decomposition (SVD), according to the equation: Y ij μ β j = λ 1 ξ i 1 η 1 j + λ 2 ξ i 2 η 2 j + ε ij , where λ1 and λ2 are the highest eigenvalues of the first and second principal component PC1 and PC2, respectively; ξi1 and ξi2 are the eigenvector of the ith genotype for PC1 and PC2, respectively; and η1j and η2j are the eigenvectors of the jth environment for PC1 and PC2, respectively. The GGE biplot analysis was performed using packager GGBiplot [11], implemented in R software [12].
The yield stability of the hybrids was evaluated based on the average environment coordination (AEC). By this method, an ideal environment is identified by the mean of the scores of the principal components of all environments, defined by the small circle. The line passing through the origin of the biplot and the ideal environment is called the axis of the ideal environment and represents the AEC abscissa. The ordered AEC is the axis that passes through the biplot origin and is perpendicular to the AEC abscissa, and which indicates a greater effect of the genotype–environment interaction (GEI) and lower yield stability, and separates the genotypes below from those above the mean [13,14].
To evaluate the suitability of a biplot to represent the patterns of a double-entry table, the “information ratio” (IR) was calculated as proposed by Yan and Tinker (2006) [13]. The IR can be calculated for each principal component as the ratio of the total variance explained by each principal component multiplied by k. If there are no linear correlations either among the rows (genotypes) or among the columns (environments), then the proportion of the total variation explained by each PC should be exactly 1/k.
When there are some linear correlations among the rows (genotypes) or among the columns (environments), the proportion of variation explained by the first few PCs would be more than 1/k, while that for others would be less than 1/k. A principal component with IR > 1 contains patterns (associations between environments); a PC with IR = 1 contains no patterns, but may contain some independent information; and a PC with IR < 1 contains no pattern or information [14].
To assess the efficiency and responsiveness to N use, the hybrids were classified in four categories according to the yield under stress (low N availability) and under ideal N availability, as follows: (i) efficient and nonresponsive hybrids (ENR), high-yielding hybrids at low nutrient availability that do not respond to nutrient supply; (ii) efficient and responsive hybrids (ER), high-yielding hybrids at low nutrient availability levels that respond positively to nutrient supply; (iii) inefficient and responsive hybrids (InR), low-yielding hybrids under low nutrient availability that respond positively to nutrient supply; and (iv) inefficient and nonresponsive hybrids (INR), low-yielding hybrids under low nutrient availability that do not respond to nutrient supply. A line was plotted that cuts the graph diagonally, representing the limit between greater efficiency and responsiveness. For the elaboration of the line, the regression model with a = 0 and b = 1 was considered, that is, the line represents exactly the point where the ith hybrid had the same average in the both the environment with low availability of N and in the environment with ideal availability of N.

3. Results and Discussion

3.1. Analysis of Variance

The effect of location (L) was significant (p ≤ 0.01) for all analyzed variables. The conclusion can be drawn that the study locations are divergent and allow a more reliable selection of the genotypes (Table 3).
The source of variation of the hybrids (H) also had a significant effect (p ≤ 0.01) on all studied variables. The source of variation of nitrogen (N) was significant (p < 0.01) for the flowering interval, chlorophyll content, and grain yield, thus showing that the means of these traits are influenced by the different levels of N availability (Table 3). The location–nitrogen (L × N) interaction was significant (p ≤ 0.05) for all variables. The means of these variables changed according to the location and N availability. Thus, the use of environments formed by the combination of locations and rates became more informative, increasing the efficiency of selection of genotypes in contrasting environments. The L × H interaction was significant (p ≤ 0.05) for all variables (except for SPAD), indicating that the sites influence the hybrid performance. The N × H interaction was significant (p ≤ 0.05) for all the evaluated traits, suggesting that changes occurred in the ranking of the hybrids under different N availability levels. Only the flowering interval (FI) and grain yield (GY) variables had a significant effect (p ≤ 0.05) on the triple interaction (L × N × H) (Table 3).

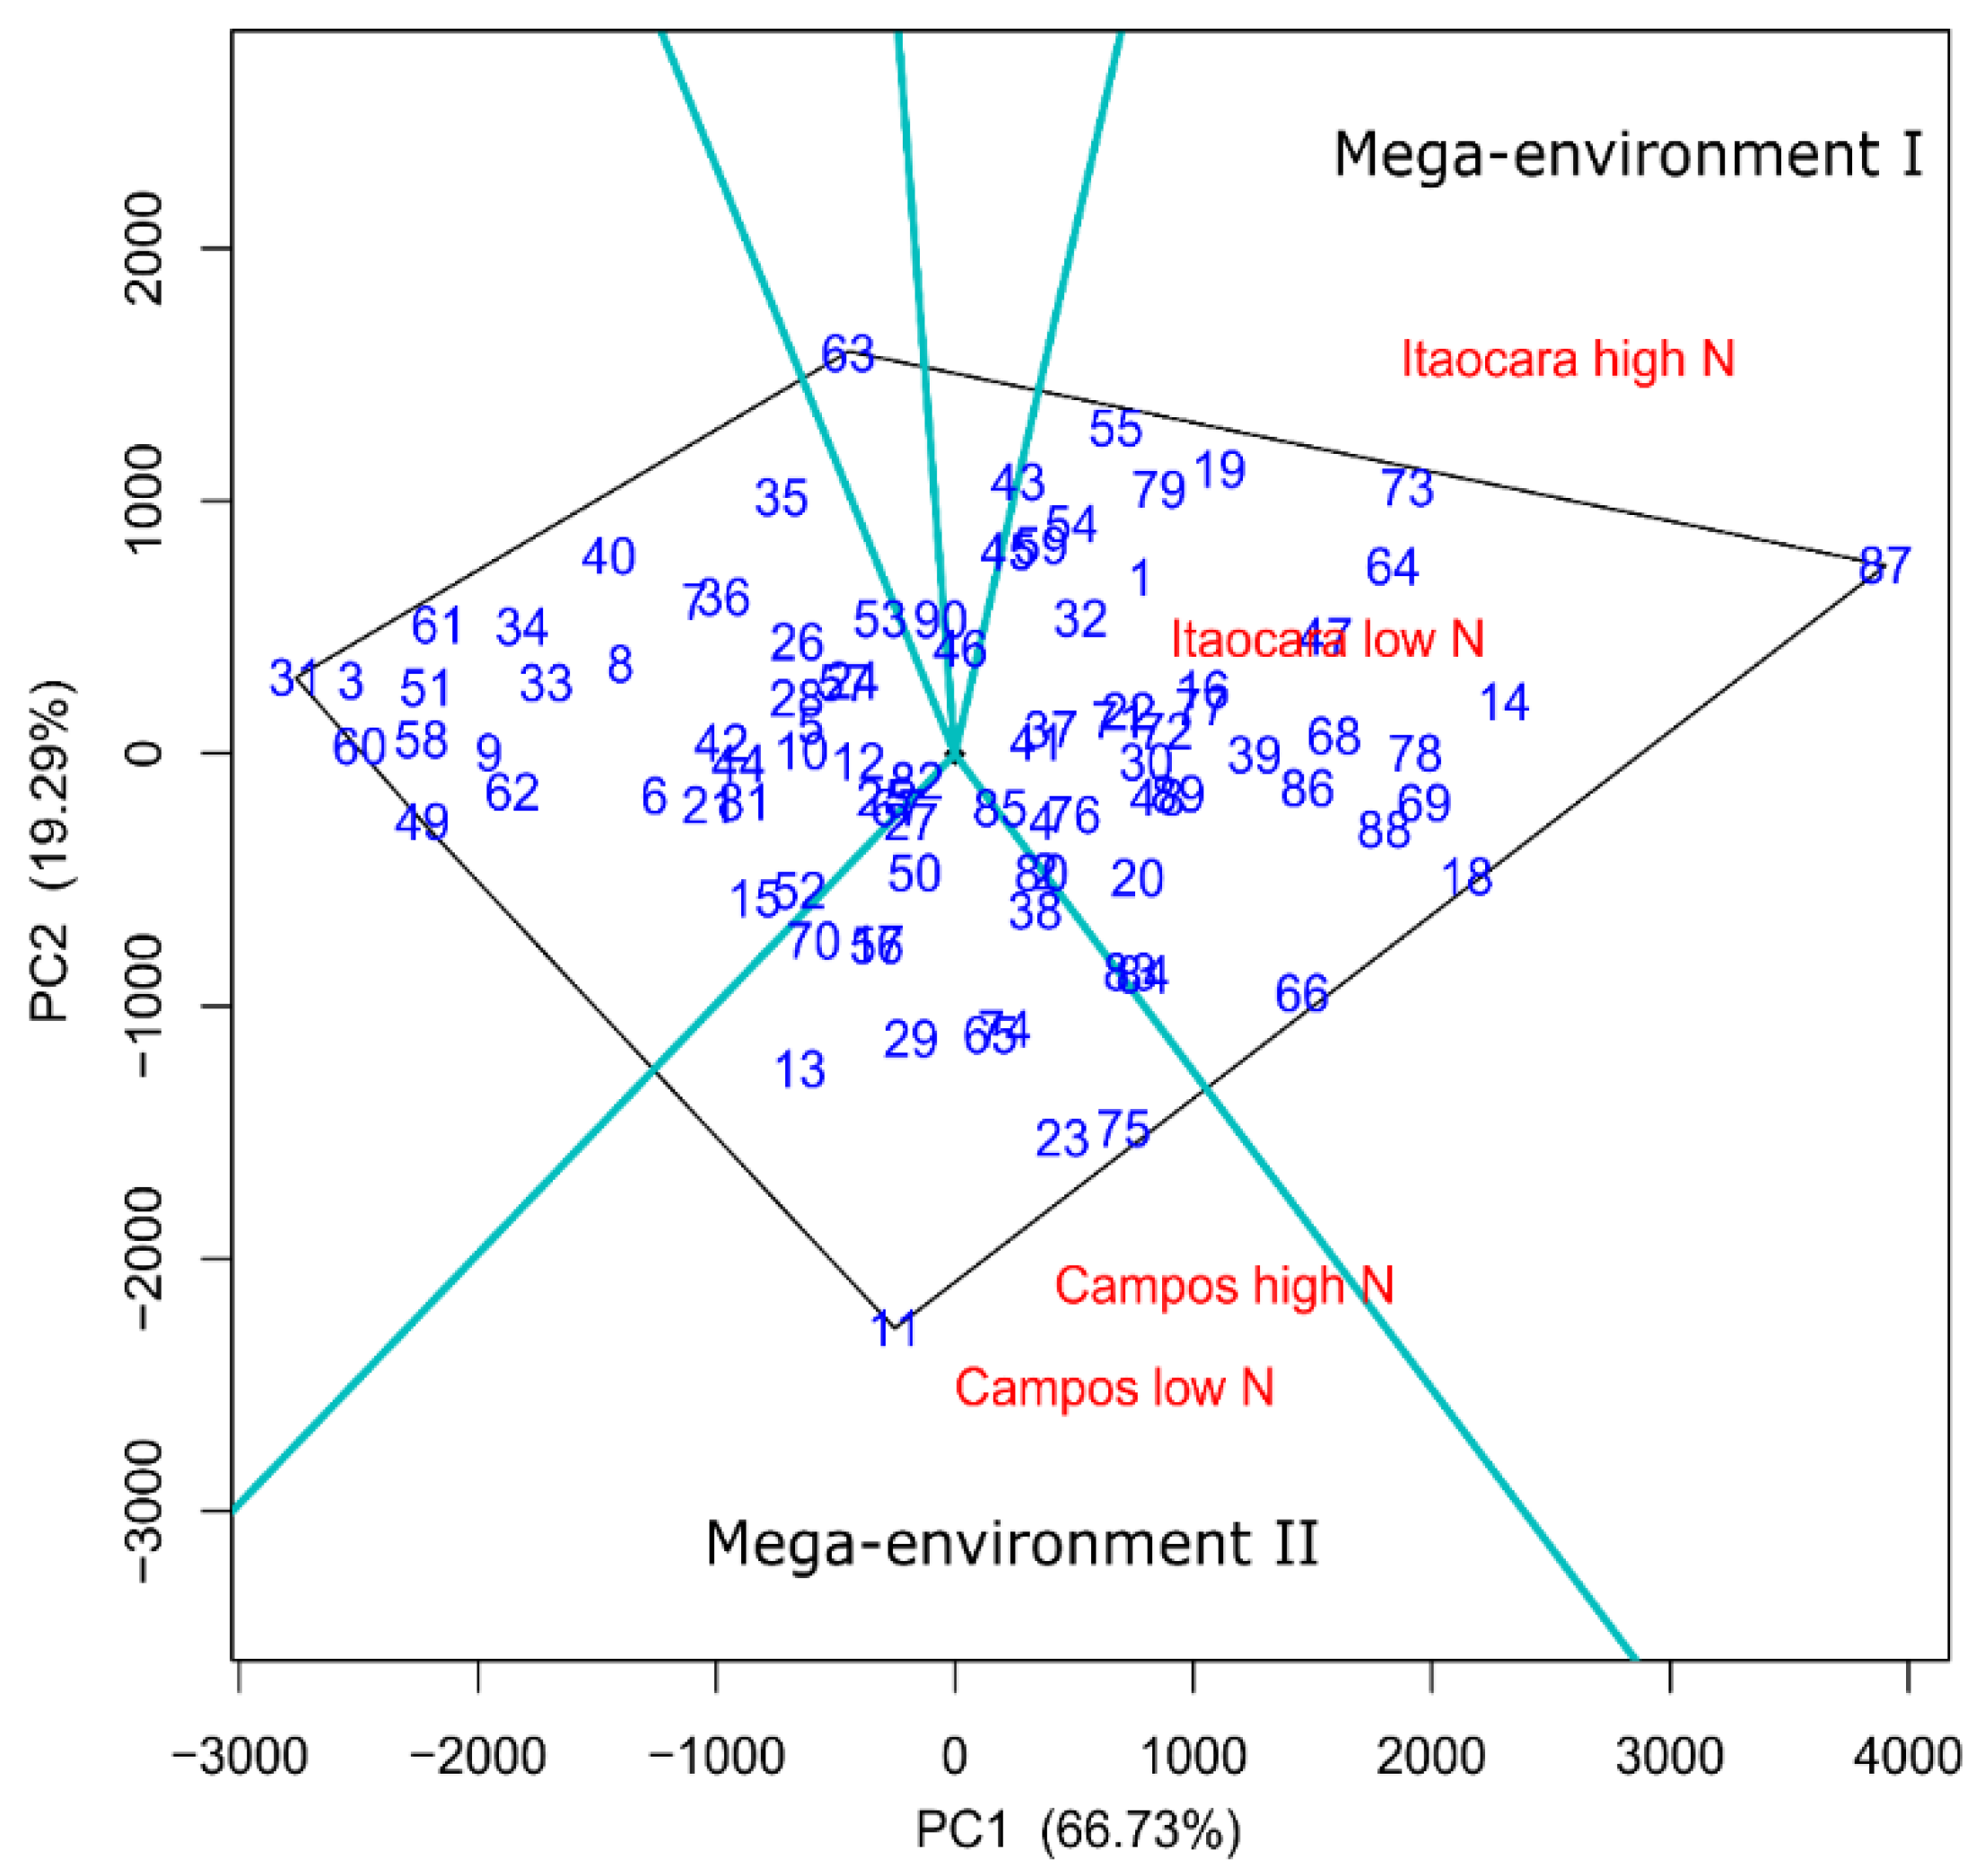
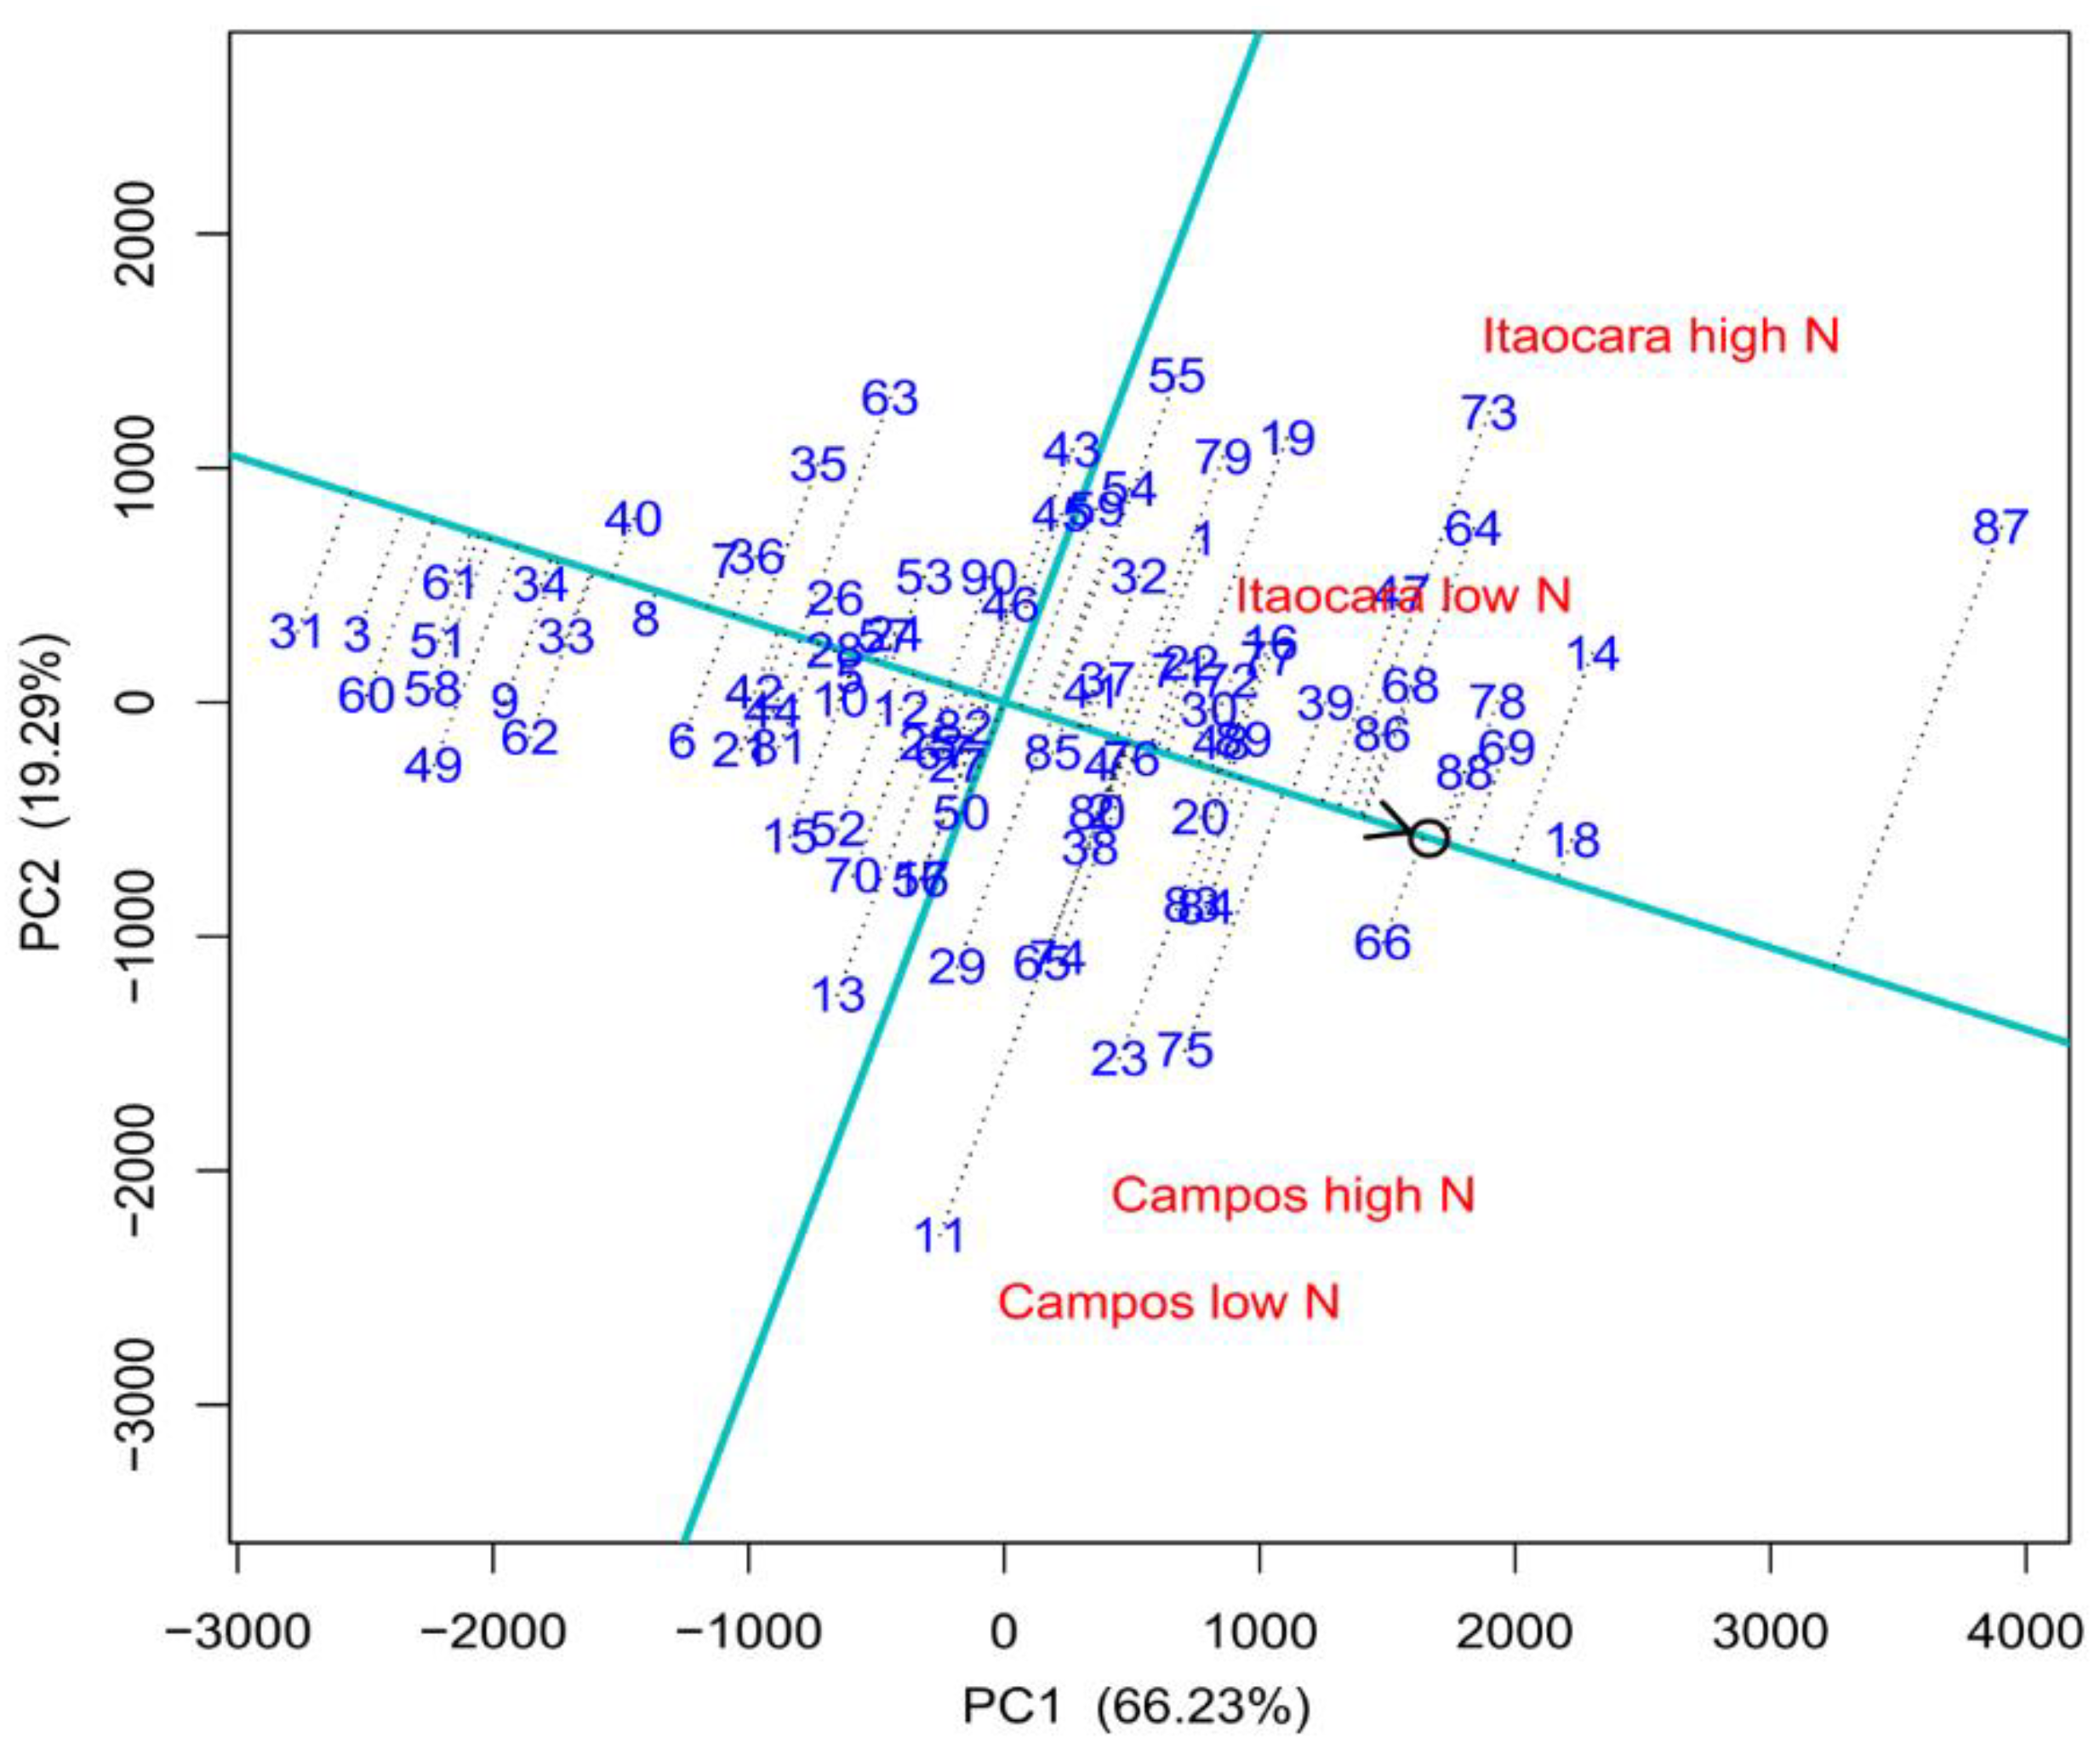
3.2. Mean Performance and Yield Stability of Genotypes

In general, a reduction in all the means of the variables in the environment with low N availability (Table 3) can be observed, although the reduction was nonsignificant for the female flowering variable, which suggests the effect of location was more important in the expression of this variable. Thus, several environments should be considered in the evaluation of female flowering. The lower means of the variables in environments with low N availability may be related, among other factors, to the reduction in the photosynthetic rate. This is confirmed by the reduction in the chlorophyll content at low N levels, since nitrogen is an essential element in the structure of the chlorophyll molecule and is a constituent of amino acids. Consequently, N deficiency can damage the protein assembly units, many of which have very important enzymatic and regulatory functions in the entire plant metabolism [1].
In the nutrient-stressed environments, the interval between male and female flowering (FI) was longer at both sites (Table 4). In maize under N-deficiency, an increase in the interval between male and female flowering was observed, hampering pollination and consequently causing a decrease in grain yield. This occurred due to the lack of pollen during style/stigma growth, reducing the number of fertilized ovules, which also causes grain abortion immediately after fertilization, thus suppressing the powerful demand of the ear during grain filling [15]. Thus, a shorter interval between male and female flowering would probably increase the tolerance to abiotic stress and would consequently result in higher grain yields. This is in agreement with the results observed in the present research, since under a lower N level the FI was higher and the grain yield was lower, at both sites.
SPAD index mean was reduced by 5.66% and 2.79% in Campos dos Goytacazes and Itaocara, respectively (Table 4). The SPAD is used to quantify the relative chlorophyll content in the plant leaves and is effective in diagnosing the N status and predicting the potential for grain yield in maize [16]. According to Miranda et al. (2005) [17], SPAD readings allow only the elimination of N-use inefficient genotypes, but are unsatisfactory in the selection of more efficient genotypes. However, Bullock and Anderson (1998) [18] reported no association between maize grain yield and SPAD readings, but concluded that these values can be used as diagnostic support for N management in maize.
On the other hand, Soares et al. (2011) [19] observed a significant and positive genetic correlation between chlorophyll content and grain yield at low N levels. The authors suggested that the evaluation of this trait could help in the elimination of low-yielding lines at lower N levels. More recently, Udo et al. (2017) [20] reported that the leaf chlorophyll concentration measured by SPAD was one of the physiological variables most closely associated with grain yield at low soil N contents, and suggested that this evaluation can be used alone or in combination with other desirable agronomic evaluations to construct a selection index of maize tolerance to low soil N contents.
In environments with low N availability, the mean grain yield decreased by 20.43% and 20.67% in Campos dos Goytacazes and Itaocara, respectively (Table 3). This reduction in the grain yield means under nitrogen-deficient environments, compared to that produced without stress, is in line with observations of Bolaños and Edmeades [21] when describing nitrogen stress. These authors suggested that the yield mean under abiotic stress is between 20% and 30% lower than that obtained by the same genetic group in an environment without abiotic stresses, for trials in the same year at the same location. It is also worth noting that this difference between grain yields was 469 kg ha−1 in Campos and 796 kg ha−1 in Itaocara, and that the difference of applied N was 90 kg ha−1, i.e., the mean response in kg of grain produced per kg of N applied was 5.21 kg and 8.84 kg, respectively.
The productive performance of the hybrids is evaluated through GGE biplot analysis. It is observed that the first two PCs explained 86.02% of the variability (Table 5), revealing the major proportion of the sum of squares due to GEI, indicating high reliability in the results obtained by GGE biplot analysis. According to Yan and Tinker (2006) [13], any principal component with an IR value substantially lower than 1.0 contains little information, whereas a principal component with an IR value >1.0, as observed for PC1, contains important patterns. Therefore, the biplot graph used here is adequate to represent the patterns related to the interaction (Table 5), allowing a reliable selection of hybrids with better performance in environments with different N availability.
In the GGE biplot analysis, the visualization of the “which-won-where” graph (Figure 1), allows the identification of possible mega-environments, summarizing the GE interaction patterns of a set of information extracted from the experimental plots. This graph consists of a polygon with perpendicular lines, called equality lines, along its sides. These lines divide the polygon into several sectors. The genotypes located at the vertices of the polygon are farther away from the origin than all the genotypes within the sector delimited by it, being classified as the most responsive. These may be the best or worst in some or all environments and can be used to identify possible mega-environments.
When connecting the markers of genotypes with the five equality lines, as shown, it is noticed that while the biplot produces five sectors, the environments are divided in two, so that the genotypes at the vertex of the sectors can be higher- or lower-yielding than the other parts in all environments [21]. The environments grouped within these sectors are considered similar in relation to the environmental influence on the genotypes. Hybrid 87 (P7 × L77) is located at one of the vertices of the polygon in mega-environment 1, being the most favorable for that group of environments, similarly to hybrid 11 (L59 × L61) in mega-environment 2. Thus, it can be stated that these genotypes produce the highest yield in at least one of the environments and are among the hybrids with the best performance in the other environments of the group. That is, hybrid 11 is the most productive in the environment with ideal N availability and is among the most productive hybrids in the environment with low N availability. Hybrid 87 is the most productive in both environments (low and ideal N availability).
The hybrids 14 (L59 × L77), 18 (L59 × P7), 73 (P6 × L54), 64 (P2 × L54), 78 (P6 × L77), 69 (P2 × L77), and 88 (P7 × L80) have good performance at mega-environment 1. While 23 (L51 × L77), 75 (P7 × L59), 13 (L59 × L76), 29 (L75 × L59), 65 (P2 × L59), and 74 (P6 × L59) have good performance at mega-environment 2, except for the hybrids 87 (P7 × L77) and 11 (L59 × L61), in mega-environment 1 and mega-environment 2, respectively. As both mega-environments are formed by environments with low and ideal N availability, it can be inferred that these hybrids are the most efficient and responsive to N use (Figure 1). This result is particularly interesting because both hybrids are derived from crosses in which one of the parents is always efficient and responsive to N use or at least intermediate [10], i.e., to obtain N-use efficient hybrids requires the use of parents with contrasting NUE and N responsiveness.
It should also be noted that when the genotypes form the vertices of the polygon, but are not associated with any environment, they are considered unfavorable for the groups of tested environments, indicating low responsiveness and yield. Thus, the genotypes located in the sectors they comprise are also unfit as parents in breeding programs addressing increases in the trait expression under stress conditions. Thus, of the 90 hybrids evaluated, 37 hybrids are located in these sectors, and can be considered nonefficient and nonresponsive to N use (Figure 1).
Therefore, the highest-yielding hybrids, projected farthest away from the origin on the positive side of the AEC abscissa are 87 (P7 × L77), 18 (L59 × P7), 14 (L59 × L77), 69 (P2 × L77), 78 (P6 × L77), 88 (P7 × L80), and 66 (P2 × L61) (Figure 2).
As pointed out, the higher the projection on the ordered MEC, the greater the instability of the genotype. Thus, it is observed that hybrid 11, followed by hybrids 87 and 73, are the least stable for grain yield, with highest MEC abscissa. However, the hybrids 18 (L59 × P7), 48 (L77 × L61), 89 (P7 × P2), 76 (P6 × L75), 57 (L80 × L61), among others, with a lower projection on the AEC abscissa, are relatively stable, since they are closer to the AEC abscissa. Of these, hybrid 18 produced the highest grain yield (Figure 2).
In hybrid 87 (P7 × L77), in spite of its excellent performance in N use, low yield stability is observed, and it is the second genotype that contributed most to the GEI. This confirmed results obviated by Santos et al. (2017) [10], Ngirazi et al. (2017) [22], Bornhofen et al. (2017) [23] and Milioli et al. (2018) [24], working with popcorn, peanut, wheat, and soybean, respectively, who also observed that the highest-yielding genotypes are not always the most stable in all environments. However, this high GEI should not be seen as a problem, but rather as an opportunity, since this genotype can be recommended as a new hybrid for specific environments, in which it proved stable and highly productive, thus being able to come to contribute to food and nutrition security on a domestic or national scale.

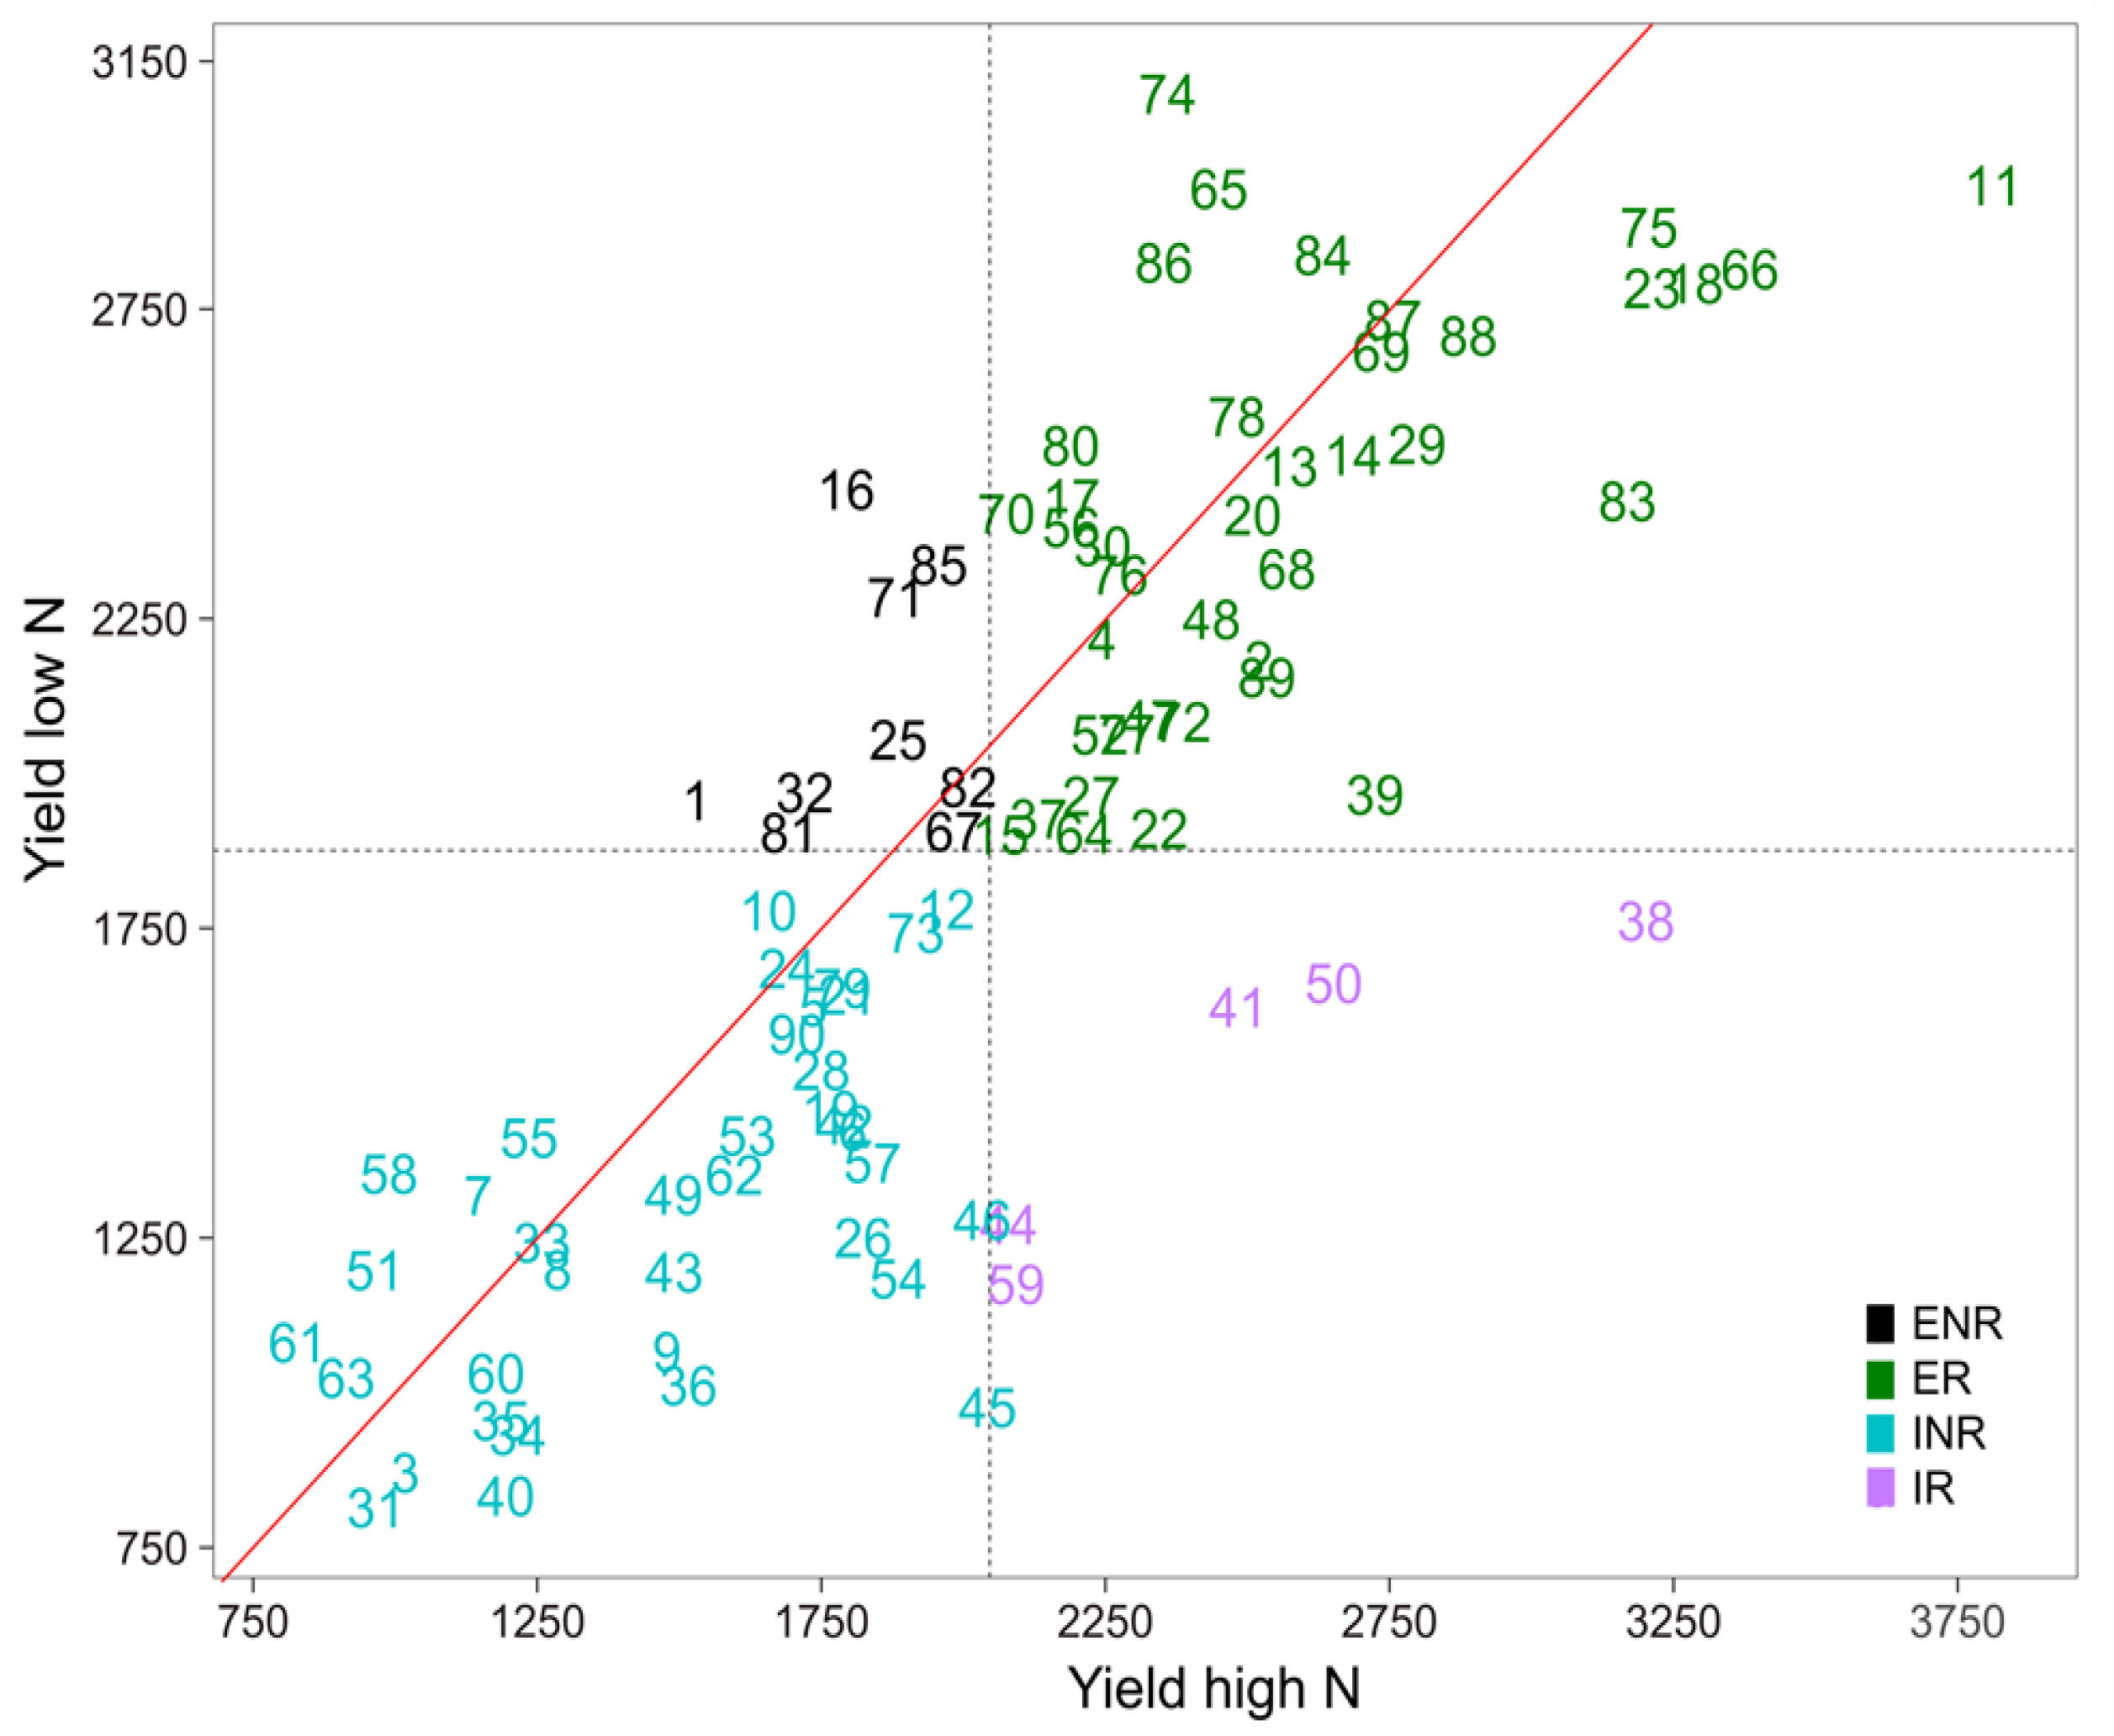
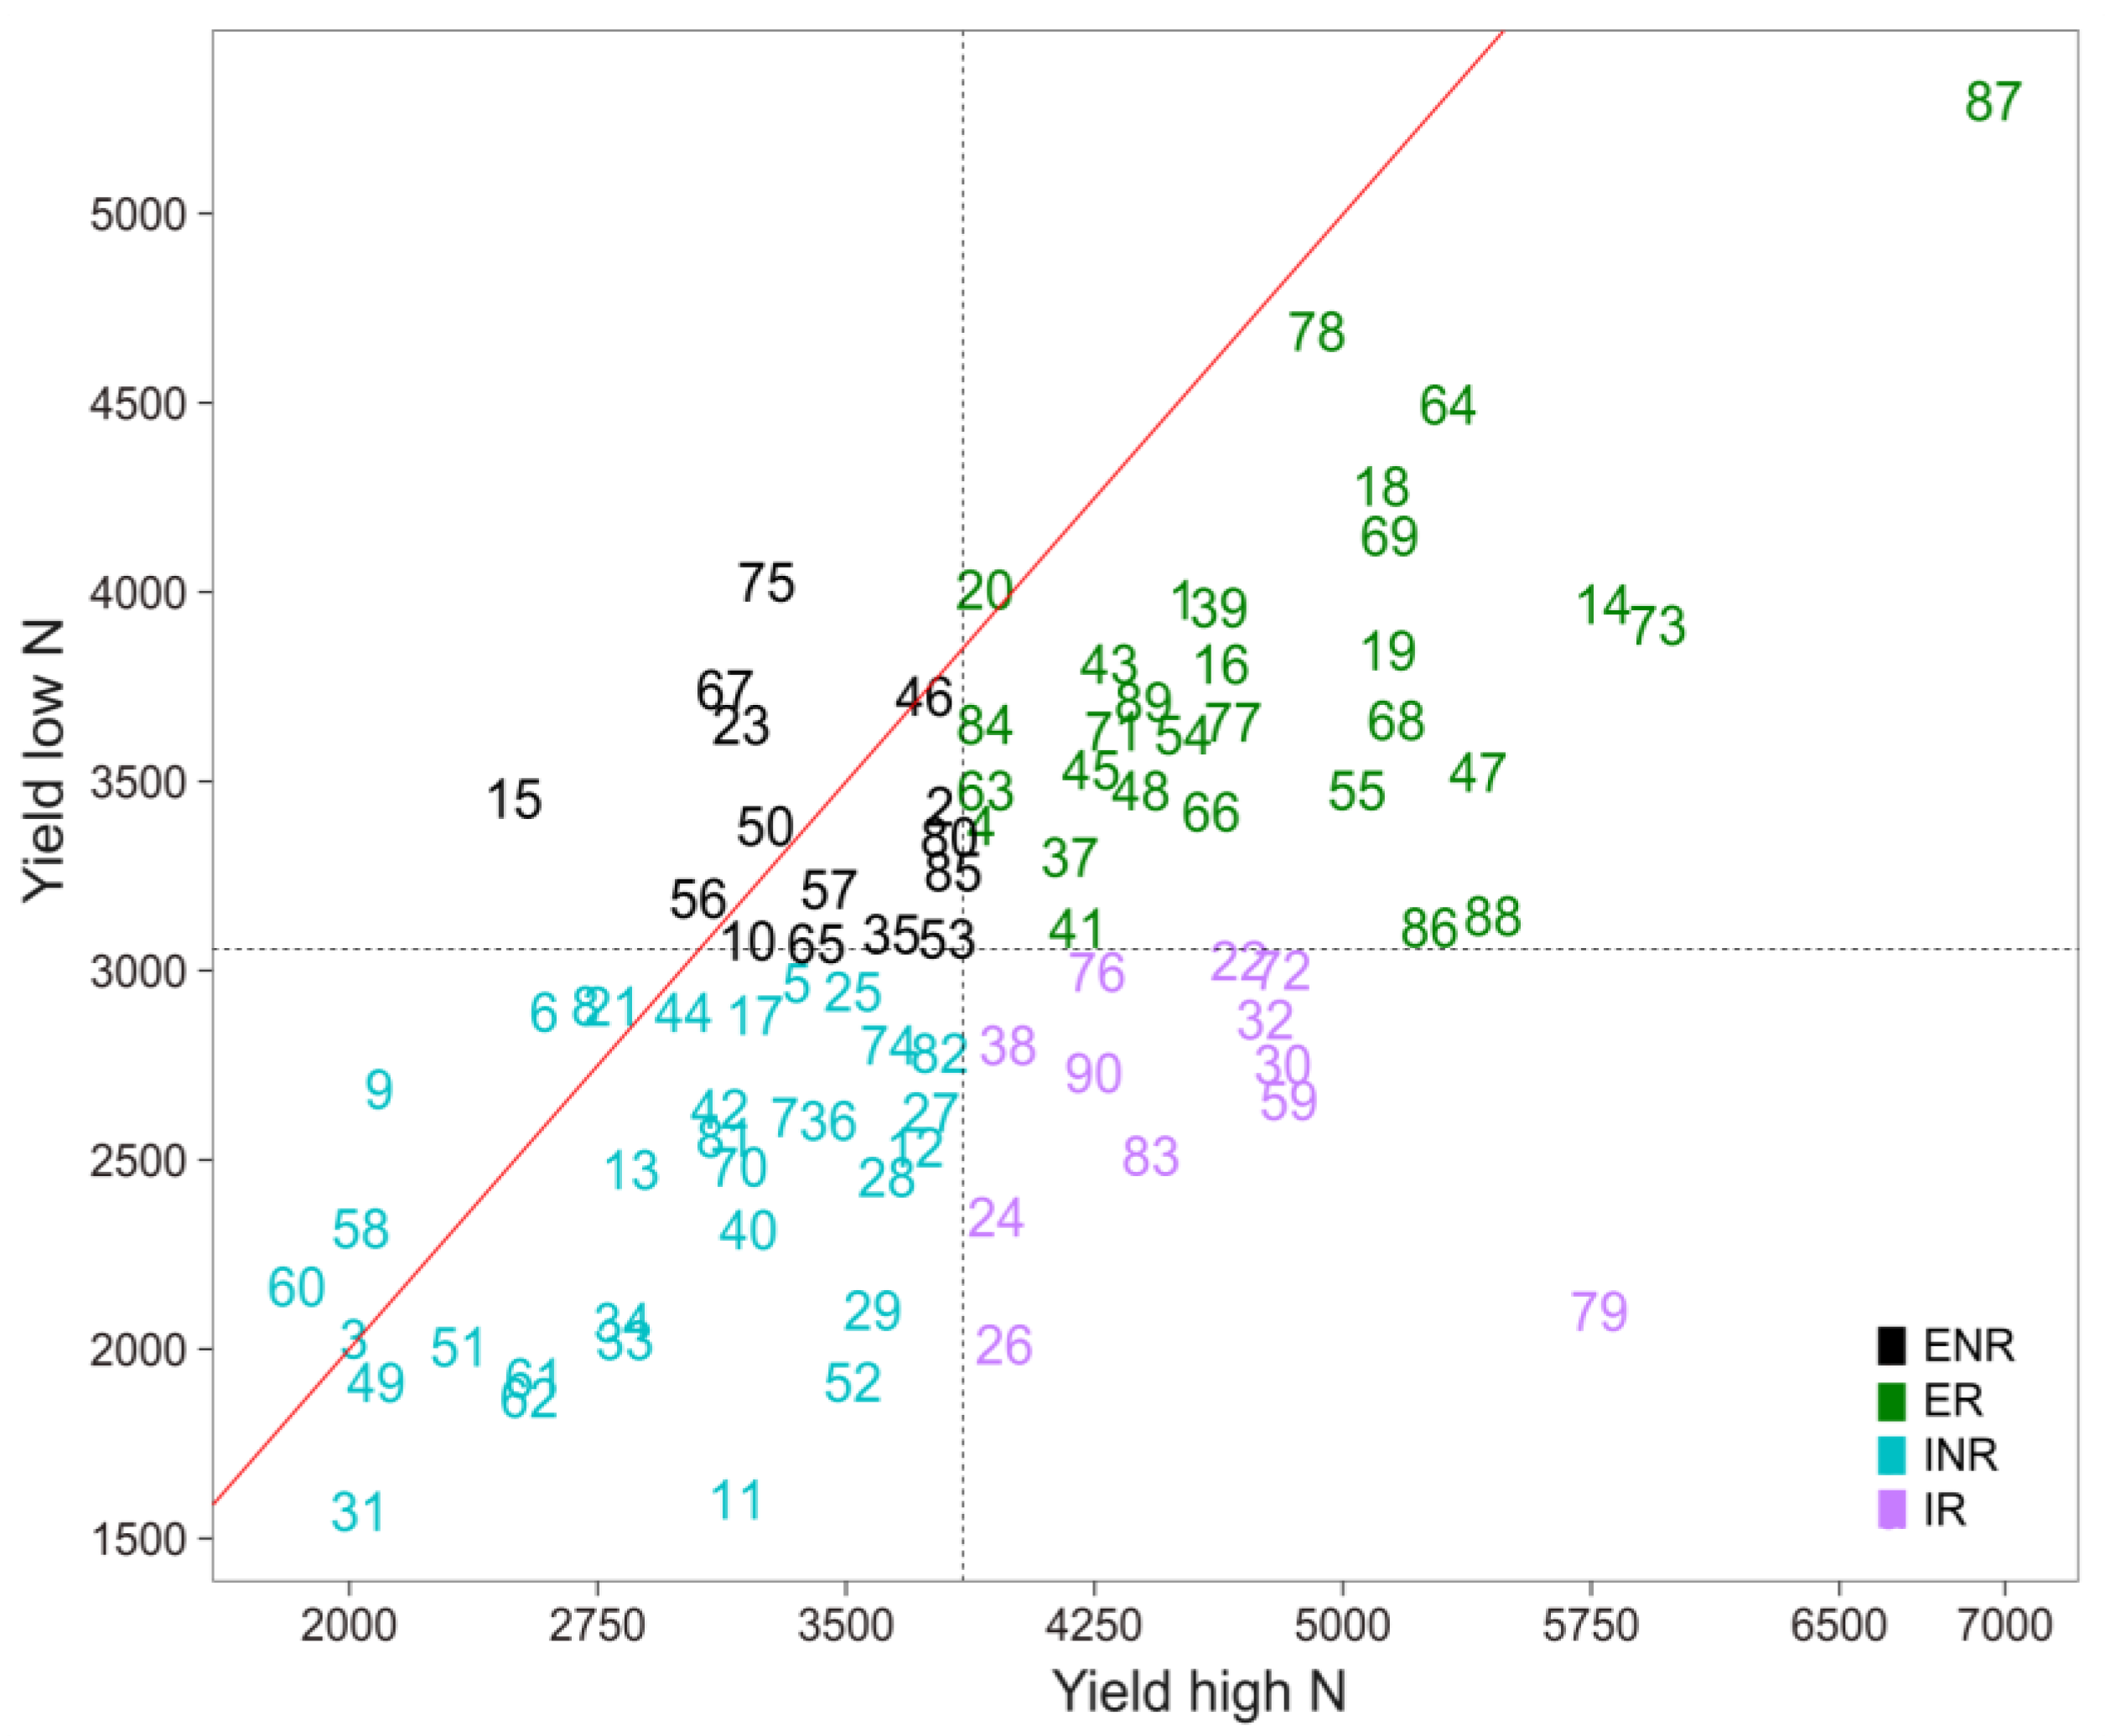
3.3. Selection for Efficient N Use

To study the performance under nitrogen stress, the hybrids are represented on a Cartesian plane by the relationship between grain yield in response to contrasting N rates (Figure 3 and Figure 4). It is noteworthy that the line that cuts the graph diagonally represents the limit between the highest efficiency and responsiveness, i.e., the hybrids below the line are more responsive than efficient in N use, whereas the hybrids above the line are more N-use efficient than N-use responsive.
At Campos de Goytacazes, 39 hybrids are allocated in the quadrant classified as efficient and responsive (ER), because their mean grain yield is higher than the mean of the environments with low and ideal N availability. Among these, the N-use efficiency of the hybrids 74 (P6 × L59), 65 (P2 × L59), 86 (P7 × L76), 84 (P7 × L61), and 78 (P6 × L77) is higher than N responsiveness (Figure 3).
Only the hybrids 38 (L76 × L59), 50 (L77 × L76), 41 (L76 × L54), 44 (L76 × P6), and 59 (L80 × L76) are classified as inefficient; however, these hybrids are N responsive. On the other hand, the yields of the hybrids 16 (L59 × P2), 85 (P7 × L75), 71 (P2 × P6), 25 (L61 × P2), 32 (L75 × L77), 82 (P7 × L54), 67 (P2 × L75), 81 (P6 × P7), and 1 (L54 × L59) exceeded the general mean in the low N availability environment, i.e., these are adapted exclusively to nutrient stress conditions (Figure 3). Thus, these hybrids mentioned above may be indicated for production on farms where the technology level is low.
At Itaocara, 30 hybrids prove efficient and responsive to N use (Figure 4); however, only hybrid 20 (L61 × L59) has a higher efficiency at the expense of responsiveness. In other words, it produces higher grain yields at low N availability than with optimal availability. Of the 90 hybrids evaluated in Itaocara, 32 are classified as inefficient and nonresponsive to N use (INR); thus, the mean yield of these hybrids is below the general mean of environments with low and ideal N availability.
Of the hybrids classified as efficient and responsive to nitrogen in the two evaluated sites (Campos dos Goytacazes and Itaocara), 15 of them are coincident (Figure 3 and Figure 4). It should be noted that among these, only the hybrids 72 (P2 × P7), 71 (P2 × P6), and 89 (P7 × P2) have a genealogy with parents that are both N-use efficient and responsive. The other hybrids are derived from crosses with at least one parent that is efficient or intermediate for efficiency and responsiveness. It can be inferred that heterosis is higher when the hybrids are synthesized among progenies of different heterotic groups with regard to N use. Thus, there are three distinct groups, namely: efficient and responsive, inefficient and nonresponsive, and intermediate. It is also observed that the female parent of these hybrids is always efficient or intermediate, once again reinforcing, the importance of the choice of the female parent in the mating blocks.
Considering this scenario, one can notice a variation in the results in relation to what is expected from the combinations involving efficient and intermediate parents. The effects of deviations of dominance or epistasis can be attributed to this result. This can be evidenced by the results obtained by Almeida et al. (2018) [25] studying the genetic control for efficiency indices in the utilization and translocation of nitrogen and phosphorus in popcorn by analyzes of means of generations. The authors conclude that nonadditive linear components are more important than the additive component. However, in view of the number of hybrids identified as efficient and responsive, the use of N efficient and responsive lines selected for their performance per se, turns out to be a good selection strategy for the development of N-use efficient and responsive hybrids.
The efficiency of these hybrids in nitrogen uptake and use for production indicates that the processes associated with uptake, translocation, assimilation, and redistribution of nitrogen are more efficient than in the other hybrids, since the N uptake rates throughout the crop cycle, N storage capacity in vegetative plant structures, efficiency of N recycling from vegetative to reproductive structures, and the extreme demand of grain for nitrogenous and carbonate compounds, are the four expressions mentioned by Stromberger et al. (1994) [26] that determine the response in maize grain yield to N availability.
In the same regard, McCullough et al. (1994) [27] demonstrated that the higher N-use efficiency of a modern compared to an old hybrid is associated with the higher N uptake rates and to the higher amount of N per unit of leaf area. According to Lithourgidis et al. (2011) [28], to produce one ton of maize, the plant must take up approximately 21 kg N ha−1, and about 75% of the absorbed amount is exported at grain harvest, confirming the superiority in the uptake, translocation, assimilation, and redistribution of nitrogen of N-use efficient hybrids.

4. Conclusions

The low nitrogen availability reduced chlorophyll content, extended the interval between male and female flowering, and affected the grain yield of the tested hybrids.
Certain high productivity hybrids are shown to have greater N-use efficiency than the responsiveness to nitrogen; these hybrids are best used in farms where the level of technology of production is low.
Predominantly, the superior hybrids regarding the nitrogen use efficiency come from contrasting parents regarding the nitrogen efficiency and responsiveness.
The hybrids 14 (L59 × L77), 18 (L59 × P7), 39 (L76 × L61), 47 (L77 × L59), 48 (L77 × L61), 66 (P2 × L61), 68 (P2 × L76), 69 (P2 × L77), 76 (P6 × L77), 84 (P7 × L61), 86 (P7 × L76), 87 (P7 × L77), 88 (P7 × 80), and 89 (P7 × P2) have high productivity and potential to be commercially used as efficient hybrids in the use of nitrogen.

Supplementary Materials

The following are available online at https://www.mdpi.com/2073-4395/10/4/485/s1, Figure S1. Pluviometric precipitation, minimum and maximum temperature, relative humidity during the experimental development. Campos dos Goytacazes (A1, A2 e A3), Itaocara (B1, B2, B3), RJ.

Author Contributions

Conceptualization, A.d.S., A.T.d.A.J., and S.H.K; methodology, A.d.S., and S.H.K; software, A.d.S.; validation, A.d.S.; formal analysis, A.d.S.; investigation, A.d.S., S.H.K., G.M.B.G., P.H.A.D.S., J.M.S.V., G.S.M., S.K., F.T.d.O., K.F.M.S., D.R.d.S.J., and F.M.; resources, A.T.d.A.J.; data curation, A.T.d.A.J.; writing—original draft preparation, A.d.S., A.T.d.A.J., S.H.K., G.M.B.G., P.H.A.D.S., J.M.S.V., G.S.M., S.K., F.T.d.O., K.F.M.S., D.R.d.S.J., and F.M.; writing—review and editing, A.d.S., A.T.d.A.J., and S.H.K; supervision, A.T.d.A.J.; project administration, A.d.S. and A.T.d.A.J.; funding acquisition, A.T.d.A.J. All authors have read and agreed to the published version of the manuscript.

Funding

This study was financed in part by the Coordenação de Aperfeiçoamento de Pessoal de Nível Superior–Brasil (CAPES)–Finance Code 001.

Conflicts of Interest

The authors declare no conflicts of interest.

References

  1. Liu, X.; Zhang, Y.; Han, W.; Tang, A.; Shen, J.; Cui, Z.; Vitousek, P.; Erisman, J.W.; Goulding, K.; Christie, P.; et al. Enhanced nitrogen deposition over China. Nature 2013, 494, 459–462. [Google Scholar] [CrossRef] [PubMed]
  2. Conant, R.T.; Berdanier, A.B.; Grace, P.R. Patterns and trends in nitrogen use and nitrogen recovery efficiency in world agriculture. Glob. Biogeochem. Cycles 2013, 27, 558–566. [Google Scholar] [CrossRef]
  3. Andrews, M.; Lea, P.J. Our nitrogen ‘footprint’: The need for increased crop nitrogen use efficiency. Ann. Appl. Biol. 2013, 163, 165–169. [Google Scholar] [CrossRef]
  4. Sharma, L.; Bali, S. A Review of Methods to Improve Nitrogen Use Efficiency in Agriculture. Sustainability 2017, 10, 51. [Google Scholar] [CrossRef] [Green Version]
  5. Raun, W.R.; Johnson, G.V. Improving Nitrogen Use Efficiency for Cereal Production. Agron. J. 1999, 91, 357. [Google Scholar] [CrossRef] [Green Version]
  6. Kant, S.; Bi, Y.-M.; Rothstein, S.J. Understanding plant response to nitrogen limitation for the improvement of crop nitrogen use efficiency. J. Exp. Bot. 2011, 62, 1499–1509. [Google Scholar] [CrossRef] [Green Version]
  7. Good, A.G.; Beatty, P.H. Fertilizing Nature: A Tragedy of Excess in the Commons. PLoS Biol. 2011, 9, e1001124. [Google Scholar] [CrossRef]
  8. Hirel, B.; Le Gouis, J.; Ney, B.; Gallais, A. The challenge of improving nitrogen use efficiency in crop plants: Towards a more central role for genetic variability and quantitative genetics within integrated approaches. J. Exp. Bot. 2007, 58, 2369–2387. [Google Scholar] [CrossRef]
  9. Fischer, J.J.; Beatty, P.H.; Good, A.G.; Muench, D.G. Manipulation of microRNA expression to improve nitrogen use efficiency. Plant Sci. 2013, 210, 70–81. [Google Scholar] [CrossRef]
  10. dos Santos, A.; do Amaral Júnior, A.T.; Kurosawa, R.d.N.F.; Gerhardt, I.F.S.; Fritsche Neto, R. GGE Biplot projection in discriminating the efficiency of popcorn lines to use nitrogen. Ciência e Agrotecnologia 2017, 41, 22–31.
  11. Frutos, E.; Galindo, M.P.; Leiva, V. An interactive biplot implementation in R for modeling genotype-by-environment interaction. Stoch. Environ. Res. Risk Assess. 2014, 28, 1629–1641. [Google Scholar] [CrossRef]
  12. R Core Team. R: A Language and Environment for Statistical Computing; R Core Team: Kingston, ON, Canada, 2014. [Google Scholar]
  13. Yan, W.; Tinker, N.A. Biplot analysis of multi-environment trial data: Principles and applications. Can. J. Plant Sci. 2006, 86, 623–645. [Google Scholar] [CrossRef] [Green Version]
  14. Yan, W.; Kang, M.S.; Ma, B.; Woods, S.; Cornelius, P.L. GGE Biplot vs. AMMI Analysis of Genotype-by-Environment Data. Crop Sci. 2007, 47, 643. [Google Scholar] [CrossRef]
  15. Rajcan, I.; Tollenaar, M. Source:sink ratio and leaf senescence in maize. Field Crop. Res. 1999, 60, 255–265. [Google Scholar] [CrossRef]
  16. Vetsch, J.A.; Randall, G.W. Corn Production as Affected by Nitrogen Application Timing and Tillage. Agron. J. 2004, 96, 502. [Google Scholar] [CrossRef] [Green Version]
  17. Miranda, G.V.; Godoy, C.L.; Galvão, J.C.C.; Santos, I.C.; Eckert, F.R.; Souza, L.V. Selection of discrepant maize genotypes for nitrogen use efficiency by a chlorophyll meter. Crop. Breed. Appl. Biotechnol. 2005, 5, 451–459. [Google Scholar] [CrossRef]
  18. Bullock, D.G.; Anderson, D.S. Evaluation of the Minolta SPAD-502 chlorophyll meter for nitrogen management in corn. J. Plant Nutr. 1998, 21, 741–755. [Google Scholar] [CrossRef]
  19. Soares, M.O.; Miranda, G.V.; Guimarães, L.J.M.; Marriel, I.E.; Guimarães, C.T. Parâmetros genéticos de uma população de milho em níveis contrastantes de nitrogênio. Rev. Ciência Agronômica 2011, 42, 168–174. [Google Scholar] [CrossRef]
  20. Udo, E.F.; Ajala, S.O.; Olaniyan, A.B. Physiological and morphological changes associated with recurrent selection for low nitrogen tolerance in maize. Euphytica 2017, 213, 140. [Google Scholar] [CrossRef]
  21. Bolaños, J.; Edmeades, G.O. The importance of the anthesis-silking interval in breeding for drought tolerance in tropical maize. Field Crop. Res. 1996, 48, 65–80. [Google Scholar] [CrossRef]
  22. Ngirazi, S.; Manjeru, P.; Ncube, O. Pod yield stability and adaptation of groundnut (Arachis hypogaea L.) genotypes evaluated in multi-environmental trials in Zimbabwe. Afr. J. Plant Sci. 2017, 11, 174–184. [Google Scholar] [CrossRef] [Green Version]
  23. Bornhofen, E.; Benin, G.; Storck, L.; Woyann, L.G.; Duarte, T.; Stoco, M.G.; Marchioro, S.V. Statistical methods to study adaptability and stability of wheat genotypes. Bragantia 2017, 76, 1–10. [Google Scholar] [CrossRef] [Green Version]
  24. Milioli, A.S.; Zdziarski, A.D.; Woyann, L.G.; dos Santos, R.; Rosa, A.C.; Madureira, A.; Benin, G. Yield stability and relationships among stability parameters in soybean genotypes across years. Chil. J. Agric. Res. 2018, 78, 299–309. [Google Scholar] [CrossRef]
  25. Almeida, V.C.; Viana, J.M.S.; Risso, L.A.; Ribeiro, C.; DeLima, R.O. Generation mean analysis for nitrogen and phosphorus uptake, utilization, and translocation indexes at vegetative stage in tropical popcorn. Euphytica 2018, 214, 103. [Google Scholar] [CrossRef]
  26. Stromberger, J.A.; Tsai, C.Y.; Huber, D.M. Interactions of potassium with nitrogen and their influence on growth and yield potential in maize. J. Plant Nutr. 1994, 17, 19–37. [Google Scholar] [CrossRef]
  27. McCullough, D.E.; Mihajlovic, M.; Aguilera, A.; Tollenaar, M.; Girardin, P. Influence of N supply on development and dry matter accumulation of an old and a new maize hybrid. Can. J. Plant Sci. 1994, 74, 471–477. [Google Scholar] [CrossRef] [Green Version]
  28. Lithourgidis, A.; Dordas, C.; Damalas, C.; Vlachostergios, D. Annual intercrops: An alternative pathway for sustainable agriculture. Aust. J. Crop Sci. 2011, 5, 396–410. [Google Scholar]
Figure 1. GGE biplot representing the “which-won-where” graph for maize grain yield, evaluated in environments under low and ideal N availability.
Agronomy 10 00485 g001
Figure 2. Adaptability and stability regarding grain yield of 90 popcorn hybrids in environments with low and ideal N availability.
Agronomy 10 00485 g002
Figure 3. Performance in relation to the nitrogen use efficiency and responsiveness to nitrogen fertilization in 90 popcorn hybrids evaluated in Campos dos Goytacazes, RJ. ER: efficient and responsive; ENR: efficient and nonresponsive; IR: inefficient and responsive; and INR: inefficient and nonresponsive.
Agronomy 10 00485 g003
Figure 4. Performance in relation to the efficiency use nitrogen and the response to nitrogen fertilization in the 90 popcorn hybrids evaluated in Itaocara, RJ. ER: efficient and responsive; ENR: efficient and nonresponsive; IR: inefficient and responsive; and INR: inefficient and nonresponsive.
Agronomy 10 00485 g004
Table 1. Soil chemical properties of experimental areas in Itaocara and Campos dos Goytacazes, in the layers 0–10 and 10–20 cm. OM: organic matter.
Itaocara, RJ
LayerpHPKCaMgAlH + AlNaCOM
H2OMg dm−3............................mmol dm−3............................g dm−3
0–10 cm5.15.03.711.98.01.218.21.18.915.3
10–20 cm4.92.01.911.97.21.817.80.69.316.0
Campos dos Goytacazes, RJ
LayerpHPKCaMgAlH + AlNaCOM
H2Omg dm−3............................mmol dm−3............................g dm−3
0–10 cm4.822.02.616.38.51.221.412.38.915.3
10–20 cm5.010.01.715.67.41.518.310.39.316.0
Table 2. Identification of the 90 hybrids and their respective parents used in the experiment.
HybridParentsHybridParentsHybridParents
1L54 × L5931L75 × L7661L80 × P2
2L54 × L6132L75 × L7762L80 × P6
3L54 × L7533L75 × L8063L80 × P7
4L54 × L7634L75 × P264P2 × L54
5L54 × L7735L75 × P665P2 × L59
6L54 × L8036L75 × P766P2 × L61
7L54 × P237L76 × L5467P2 × L75
8L54 × P638L76 × L5968P2 × L76
9L54 × P739L76 × L6169P2 × L77
10L59 × L5440L76 × L7570P2 × L80
11L59 × L6141L76 × L7771P2 × P6
12L59 × L7542L76 × L8072P2 × P7
13L59 × L7643L76 × P273P6 × L54
14L59 × L7744L76 × P674P6 × L59
15L59 × L8045L76 × P775P6 × L61
16L59 × P246L77 × L5476P6 × L75
17L59 × P647L77 × L5977P6 × L76
18L59 × P748L77 × L6178P6 × L77
19L61 × L5449L77 × L7579P6 × L80
20L61 × L5950L77 × L7680P6 × P2
21L61 × L7551L77 × L8081P6 × P7
22L61 × L7652L77 × P282P7 × L54
23L61 × L7753L77 × P683P7 × L59
24L61 × L8054L77 × P784P7 × L61
25L61 × P255L80 × L5485P7 × L75
26L61 × P656L80 × L5986P7 × L76
27L61 × P757L80 × L6187P7 × L77
28L75 × L5458L80 × L7588P7 × L80
29L75 × L5959L80 × L7689P7 × P2
30L75 × L6160L80 × L7790P7 × P6
Table 3. Summary of the combined analysis of variance for the variables female flowering (FF) in days, male to female flowering interval (FI) in days, chlorophyll content (Soil Plant Analysis Development, SPAD), and grain yield (GY) in kg ha−1, of 90 popcorn genotypes evaluated under low and ideal nitrogen availability.
SVDFMean Square
FFFISPADGY
Block/Rep/N/L1084.55.047.042,442.0
Rep/N/Location816.56.059.055,746.0
Location (L)1853.3 **3499.0 **6932.0 **603,308,664.0 **
Nitrogen (N)10.158.0 *1387.0 **62,989,885.0 **
L × N116.6 *58.0 **128.0 **26,597,501.0 **
Hybrid (H)8945.9 **15.0 **99.0 **4,222,957.0 **
L × H896.9 **7.0 **36.01,564,010.0 **
N × H895.9 **4.0 *54.0 *628,677.0 **
L × N × H893.94.0 *35.0567,165.0 **
Error6043.13.035.037,787.0
Accuracy-0.9650.8950.8030.996
* significant at p < 0.01, ** significant at p < 0.05, by the F test.
Table 4. Means and percentage of reduction between the nitrogen levels of the variables: female flowering (FF) in days, male to female flowering interval (FI) in days, chlorophyll content (SPAD), and grain yield (GY) in kg ha−1, evaluated in 90 popcorn hybrids.
Traits Campos dos GoytacazesItaocara
FF High N54.84 aA52.81 Ab
Low N54.6 aA53.07 aA
% Reduction 0.43−0.5
FIHigh N−0.70 aB−3.84 bA
Low N−0.72 aB−4.77 aA
% Reduction −2.86−24.11
SPADHigh N52.18 aB56.56 aA
Low N49.22 bB54.98 bA
% Reduction 5.662.79
GYHigh N2296.48 aB3855.16 aA
Low N1827.34 bB3058.29 bA
% Reduction 20.4320.67
Means followed by the same lowercase letter in the column and the uppercase letter in the row for each variable do not differ by Tukey’s test at (p < 0.05).
Table 5. The singular value, explained variation, cumulative ratio, and information ratio (IR) of the four principal components (PC) of the GGE biplot analysis.
Principal Component Singular Value % Cumulative% ExplainedIR
116,756.0366.7366.732.67
24843.7686.0219.290.77
32249.8794.988.960.36
41260.53100.005.020.20

