1. Introduction
The purpose of the present work is to develop a portable and autonomous device for older people to self-administer the 30-s chair–stand test (CST) at their homes. It is meant to be used by patients with the help of informal caregivers, to measure lower-limb strength according to their geriatrician’s established plan, (i.e., once or twice a week). The 30-s CST is a physical performance assessment tool; in particular, it measures lower-limb strength [
1]. It does so by quantifying the ability of older patients to repeatedly stand up from a chair, by specifically counting the number of times they stand up over thirty seconds [
1]. Poor physical performance in older patients is strongly related to undesired clinical outcomes such as disability, hospitalization, deaths [
2], and falls [
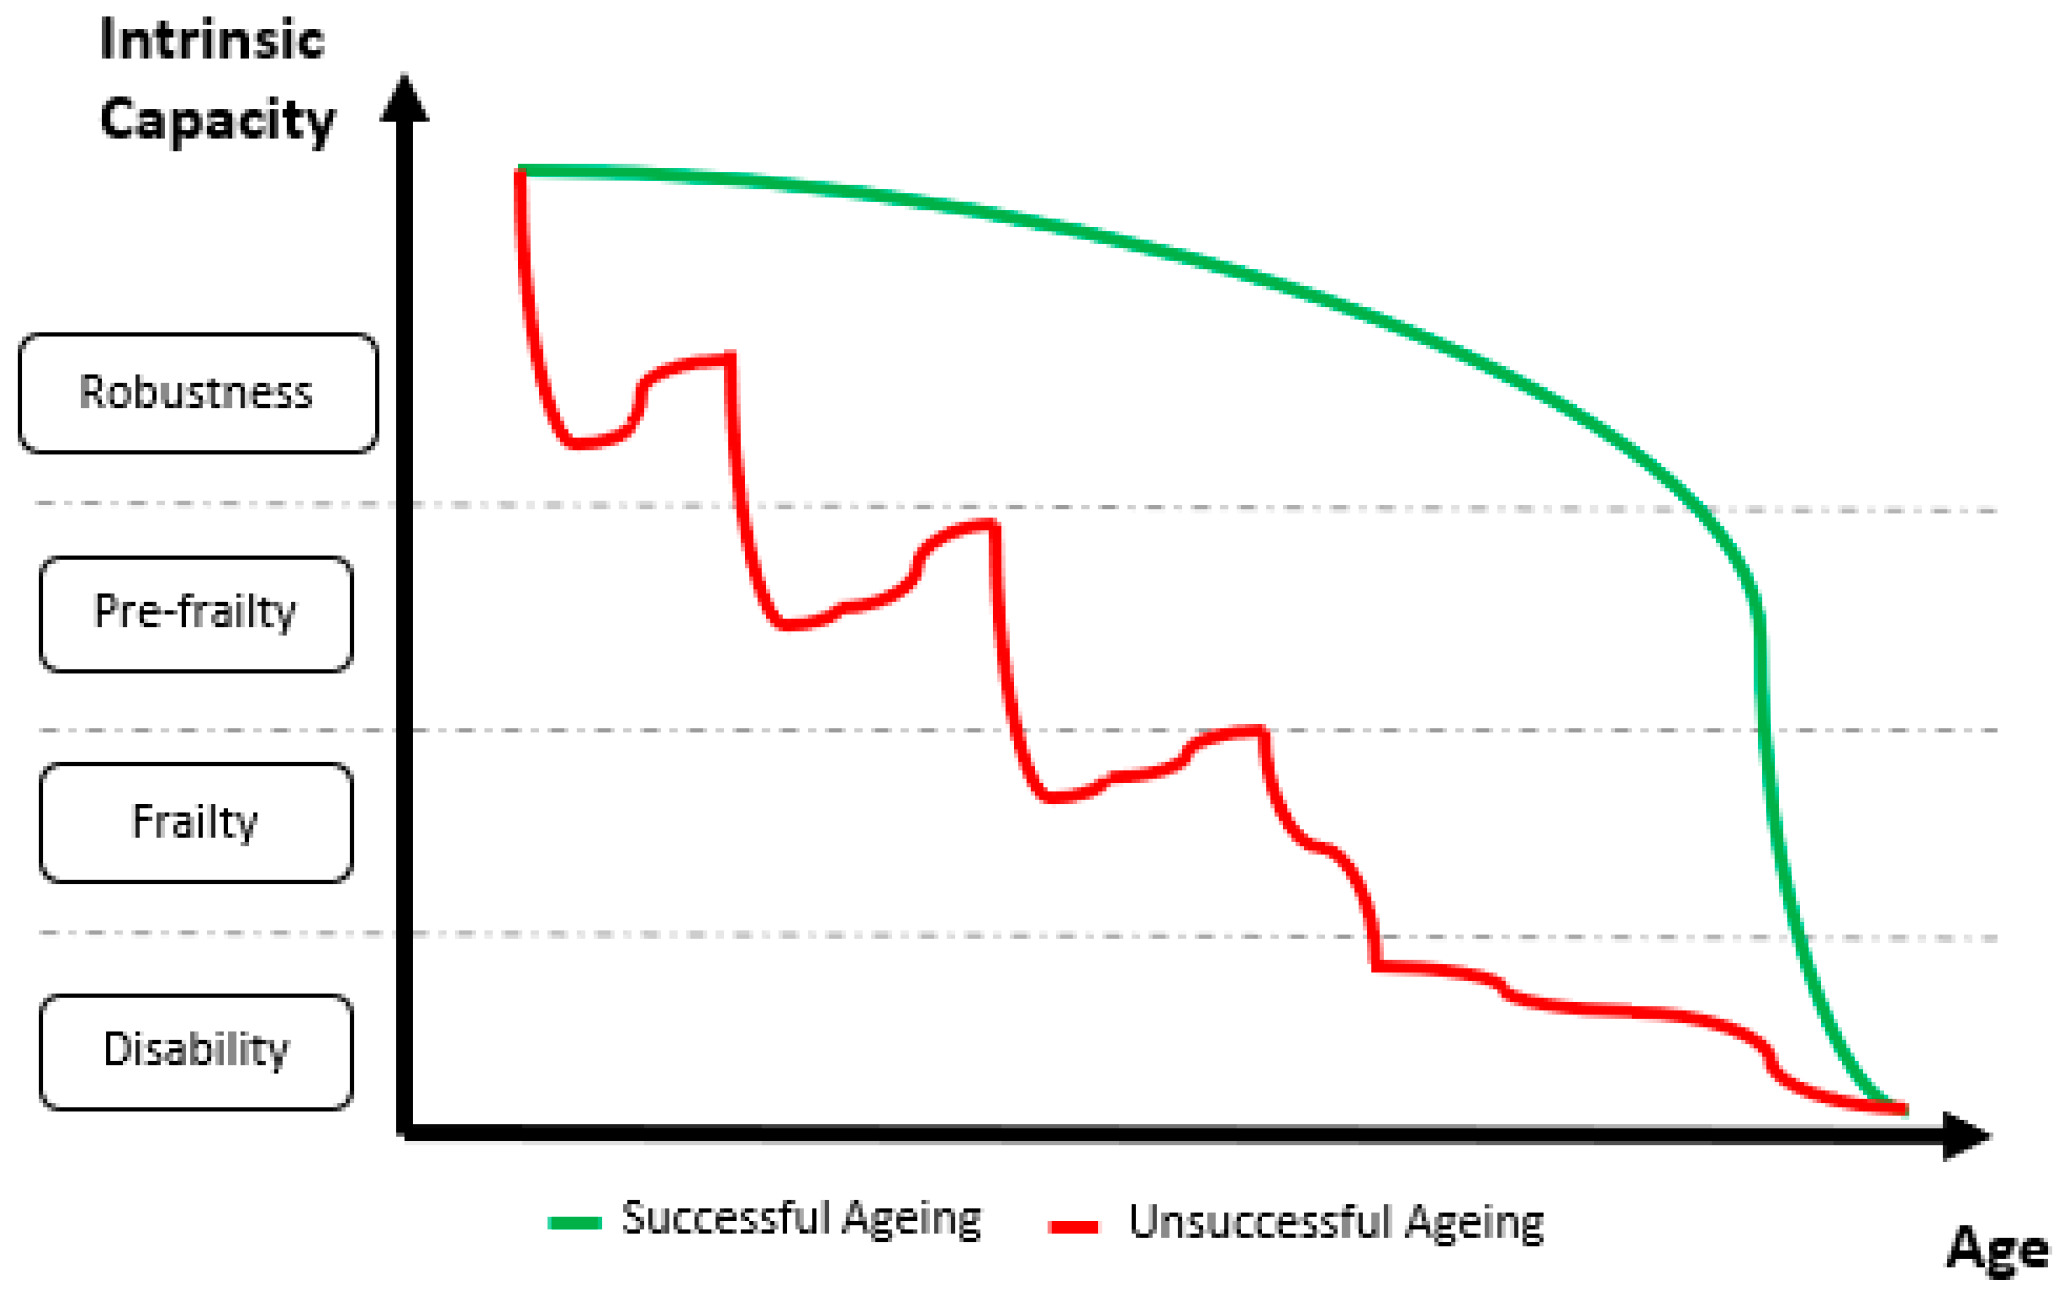
3]. Disability and all these related outcomes are the culmination of a progressive process of physiological decline [
4]. A successful aging path will delay the onset of disability as late in life as possible (green line in
Figure 1) as opposed to an unsuccessful aging path that will involve being disabled for several years (red line in
Figure 1) [
5].
Within the context of an aging population [
6], the social and the economic impacts of delaying the onset of dependency would be enormous because poor functionality has a strong impact on patients’ and relatives’ quality of life and makes them big users of health and social services [
7]. However, despite the remarkable increase in longevity enabled by healthcare systems, they do not achieve an extension of the period of good health and functionality [
7]. Fortunately, it is indeed possible to extend good health and functionality because, even though disability is not reversible, it is preceded by a reversible stage known as frailty [
8,
9,
10]. By detecting the onset of frailty at early stages, frail people can be restored back to a robust status thanks to exercise-based interventions [
8,
9,
10].
Several models were proposed to explain frailty, which is defined as a state of increased vulnerability to adverse outcomes due to a reduction in the ability to respond to stressors [
4,
11]. Of course, all of these models identify physical performance as a strong frailty marker [
4,
12]. In particular, lower-limb strength is one of the criteria for patient frailty stratification according to the frailty phenotypic model [
4]. There are multiple clinical tests to assess lower-limb strength; the most remarkable of them are based on assessing performance under repeated sit-to-stand conditions. The Short Physical Performance Battery (SPPB), for instance, is based on recording how long it takes for an older person to repeatedly stand up from a chair five times [
13]. Conversely, the 30-s CST is based on recording how many times a person stands up from a chair over 30 s [
1]. Any of them can be found in comprehensive geriatric assessment (CGA) tools, which are proposed as the most valuable tools to inquire the advance of frailty, to predict and prevent sudden adverse events, and to develop intervention plans for the delay and reversal of the onset of frailty [
14,
15,
16].
An automated version of the 30-s CST is expected to count the same number of completed cycles as a manual count would do. It requires the automatic identification and delimitation of sit–stand–sit (STS) cycles and the ability to automatically spot and dismiss failed attempts (i.e., when the subject does not reach an upright posture). Inertial sensors and inertial measurement units (IMUs) were extensively used to study sit-to-stand and stand-to-sit transitions, as well as STS cycles, over the past three decades [
17]. Some of these studies looked for relationships between different kinematic parameters and the functional status (robust, pre-frail, frail) of the experimental subjects [
18,
19,
20]. A very popular approach is based on taking advantage of the quasi-periodic nature of the trunk movement during STS cycles [
21,
22]. To do so, previous works used signals from an IMU on the subject’s lower back [
21,
22].
Van Lummel et al. used triaxial acceleration and triaxial angular velocity signals (dynaport device) to compute trunk pitch angle and vertical velocity signals [
21], while Millor et al. used the vertical acceleration signal (MTx Orientation Tracker–Xsens Technologies B.V. Enschede, the Netherlands) to compute vertical velocity and vertical position [
22]. Computing velocity from an acceleration signal requires the integration of the acceleration signal. Modern accelerometers are very small but noisy micro-electro-mechanical systems (MEMS); therefore, the integration of their noisy output results in a drifting velocity signal. They require a heavy pre-processing stage to compensate for the said drift. In particular, Millor et al. reported that, on the one hand, they applied double integration combined with fourth-level polynomial curve adjustment and cubic spline interpolation; on the other hand, they relied on the MTx onboard Kalman filter estimation for the X-orientation to identify the STS sub-phases in combination with the vertical acceleration, the vertical velocity, and the vertical position [
22].
The wearable devices described above require the IMUs to be placed on the L3 region of the subject’s lumbar spine [
17,
22]. Older people might experience some difficulties in placing them on the correct spot, especially if they do not have any help to put them on. These previous studies did not study their algorithm sensitivity to misplacing the sensor; therefore, further studies are necessary to test the usability of these kinds of systems for an older population, as well as to assess the elders’ overall user experience, especially outside controlled experimental settings.
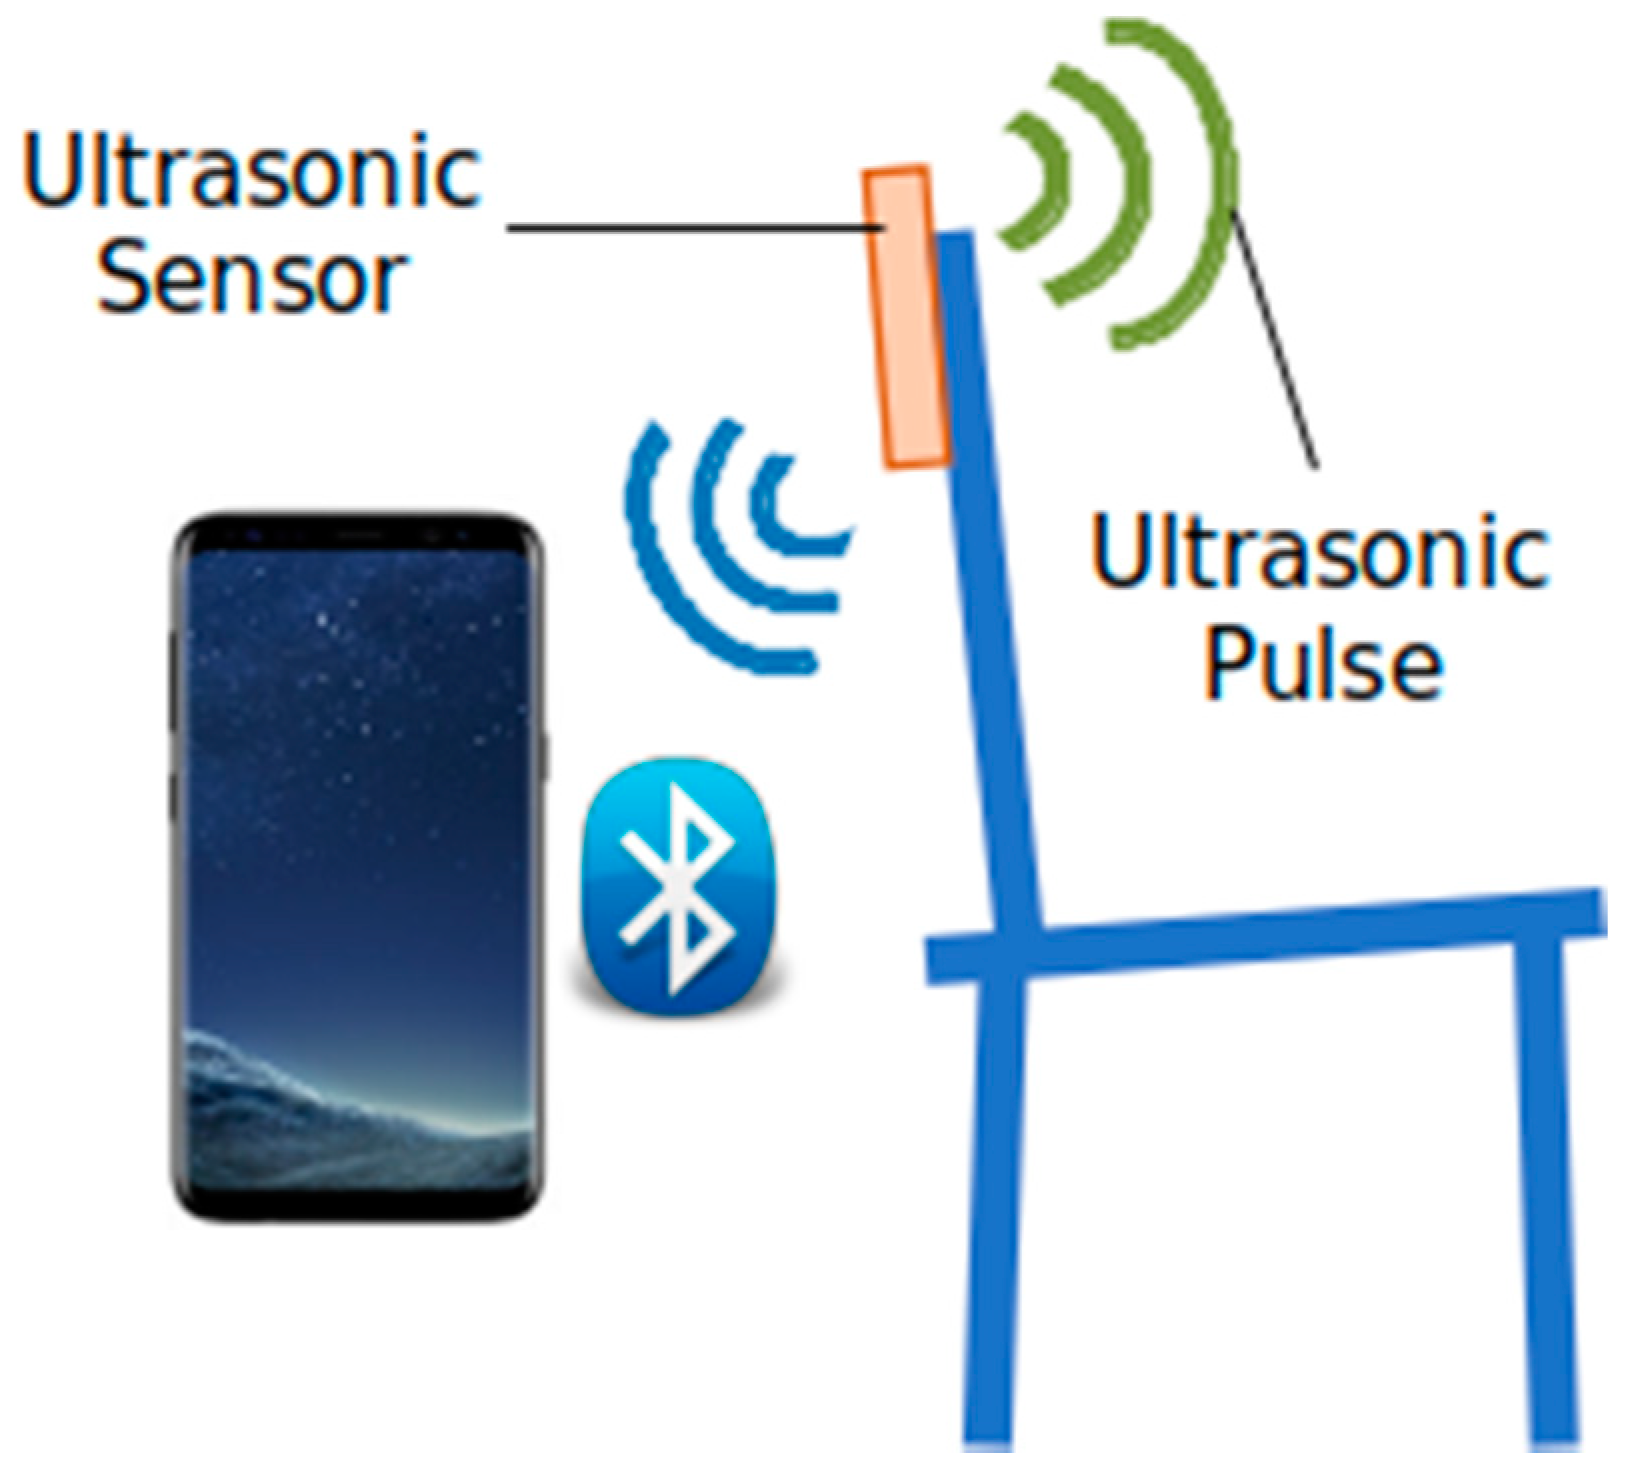
We studied the feasibility of using the quasi-periodic nature of the distance between a subject’s back and the chair backrest during a 30-s CST to carry out unsupervised measurements based on readings from a low-cost ultrasound sensor. Our search in PubMed for studies based on ultrasound sensors did not return any eligible results. We observed the feasibility of such an approach to vary depending on the age and/or functional status of the user. The target population for this kind of clinical test involves older adults. Unfortunately, we observed them to generate such noisy signals that local maxima became hard to match actual sit-to-stand transitions. Using a moving minimum filter to cancel the effects of said noise resulted in a remarkable improvement. Nevertheless, it is still not clear whether the results are good enough to make any clinical decisions based on the sensor outcomes.
3. Results
3.1. Sit-to-Stand Event Count
Table 2 shows the results of the IRR study for Algorithm-v1.
IRR between the human rater and Algorithm-v1 was excellent (ICC > 0.9) when applied to dataset A (healthy subjects). This observation was supported by all three parameters: (i) the coefficient estimate (ICC = 0.96), (ii) the 95% CI, and (iii) the significance value. This result suggests that Algorithm-v1 is equivalent to human assessment.
However, the results of Algorithm-v1 applied to dataset B (older subjects) showed poor equivalency to human assessment. When comparing the outcomes from Algorithm-v1 to the manual count of valid events, the ICC value (ICC = 0.50) showed moderate levels of correlation. However, statistical significance values were not even able to ensure ICC levels over 0.5. This result suggest that Algorithm-v1 cannot be used to identify valid sit-to-stand events from the ultrasound-based distance signal on an elderly population.
The same happened when Algorithm-v1 outcomes were compared to the manual count of total events. The ICC value (ICC = 0.50) improved a little but still showed moderate levels of correlation. Again, statistical significance values were not even able to ensure ICC levels over 0.5. Thus, correlation between the outcomes cannot be considered better than poor. This result suggest that Algorithm-v1 cannot be used to detect the total number of sit-to-stand events, regardless of them being valid or invalid, from the ultrasound-based distance signal on an elderly population.
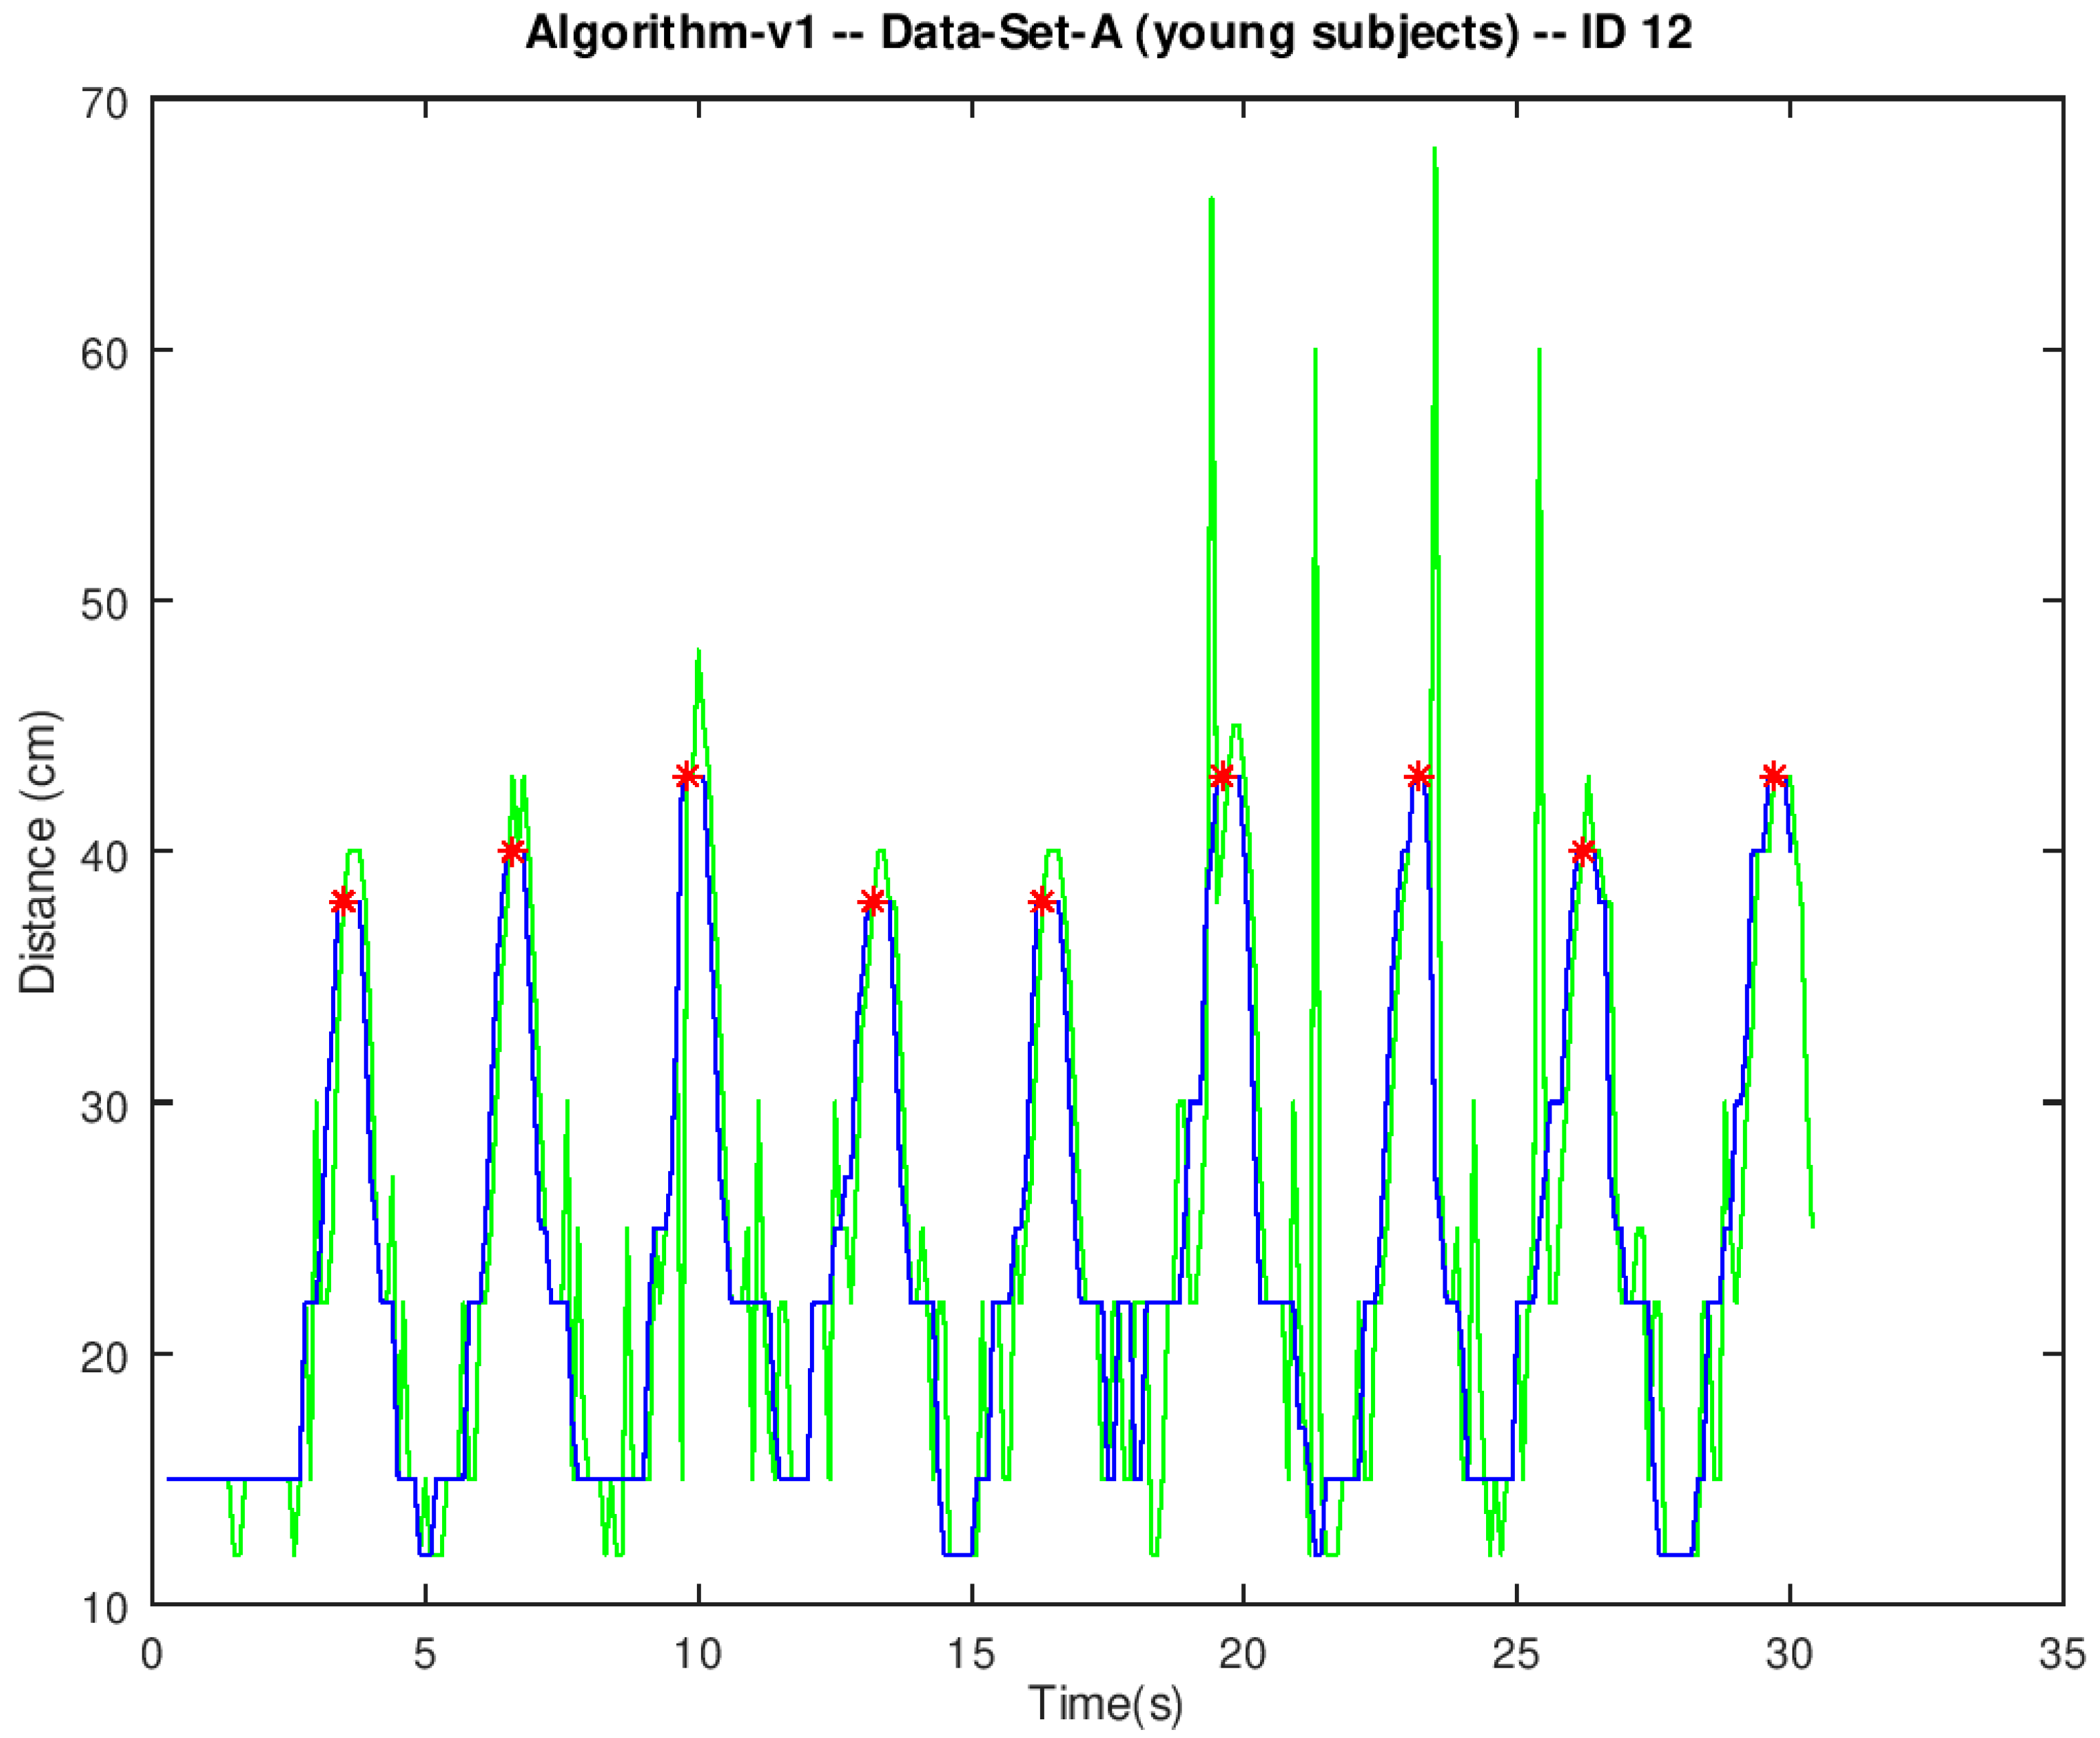
We observed the signals in dataset A to show a few spurious spikes even after removing outliers in the pre-processing stage (green line in
Figure 4). These spikes are indeed outliers that fell below the threshold in the pre-processing stage. We observed legitimate peaks up to 50 cm to be rather common within the datasets. Nevertheless, lowering the pre-processing threshold to 50 cm did not show any significant improvement. Therefore, we decided to keep the pre-processing threshold high not to make any legitimate peaks unrecognizable. Spurious spikes in dataset A were narrow, spaced wide apart, and scarce. Therefore, they did not pass through the moving median filter (blue line in
Figure 4). Even though they broke the smooth progression of the curve, they did not affect the overall shape and the quasi-periodic nature of the signal. Therefore, all peaks were correctly detected (red dots in
Figure 4).
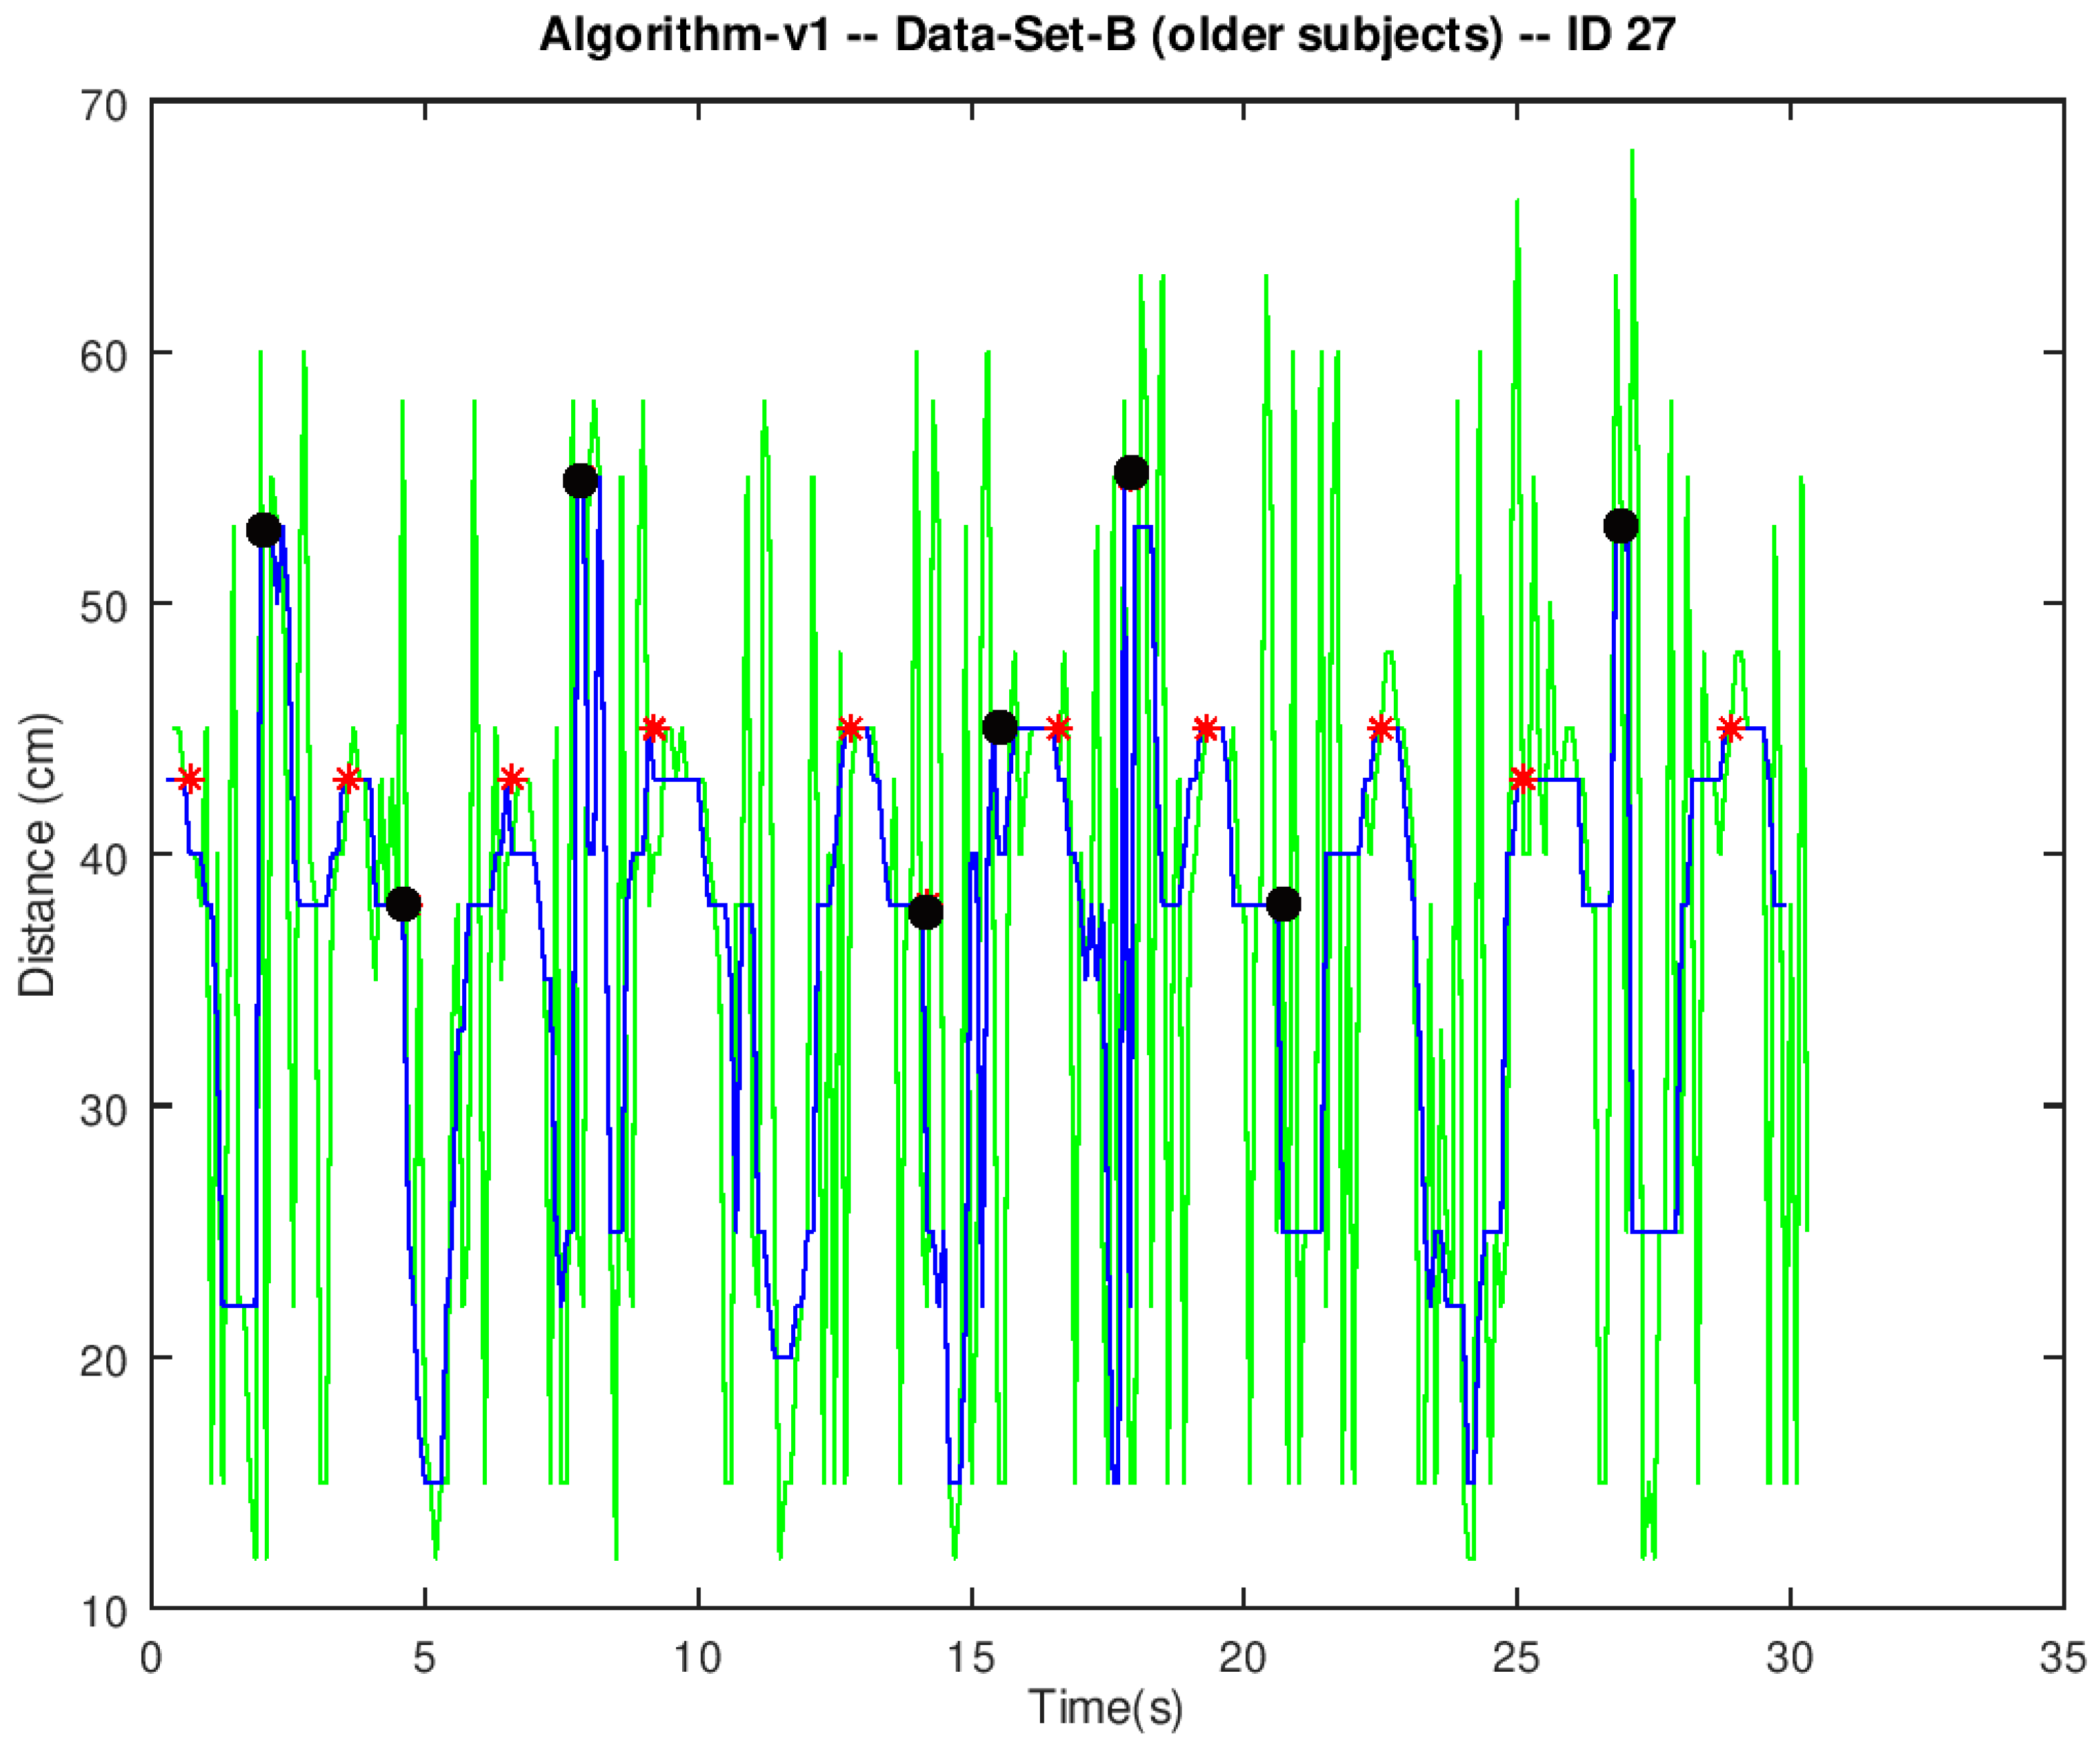
Conversely, spurious spikes in dataset B were abundant and very close to each other (green line in
Figure 5). Therefore, their contribution to the output of the moving median filter (blue line in
Figure 5) could result in such a significant distortion that the peak detection algorithm mistook it for a legitimate peak (black dots in
Figure 5).
Table 3 shows the results of the IRR study for Algorithm-v2.
Algorithm-v2 was directly applied to dataset B (older subjects). When comparing the outcomes from Algorithm-v2 to the manual count of valid events, the ICC value (ICC = 0.86) showed good levels of correlation. This observation was corroborated by the fact that statistical significance values were able to ensure ICC levels over 0.75. This result is a remarkable improvement over Algorithm-v1. In fact, the 95% CI suggests that the true ICC value could very well fall within the excellent correlation range; the question remains whether these levels of reliability are good enough to make any clinical decisions based on outcomes from the chair–stand sensor.
When the outcomes from Algorithm-v2 were compared to the manual count of total events, the ICC value (ICC = 0.89) improved a little. It remained within the range of good levels of correlation, but it could not be considered excellent. Again, statistical significance values supported that the true ICC value was over 0.75. This result suggests that the presence of invalid sit-to-stand events had very little impact on Algorithm-v2 performance. Thus, the mistakes preventing Algorithm-v2 from showing an excellent correlation with manual count did not seem to come from a systematic erroneous classification of invalid sit-to-stand transitions. Moreover, the data showed neither systematic overestimation nor underestimation of sit-to-stand transitions. Nine of the signals resulted in an overestimated count and another nine signals resulted in an underestimated count. Thus, the noise present in the distance signal seemed to be equally likely to either mask or simulate valid sit-to-stand transitions.
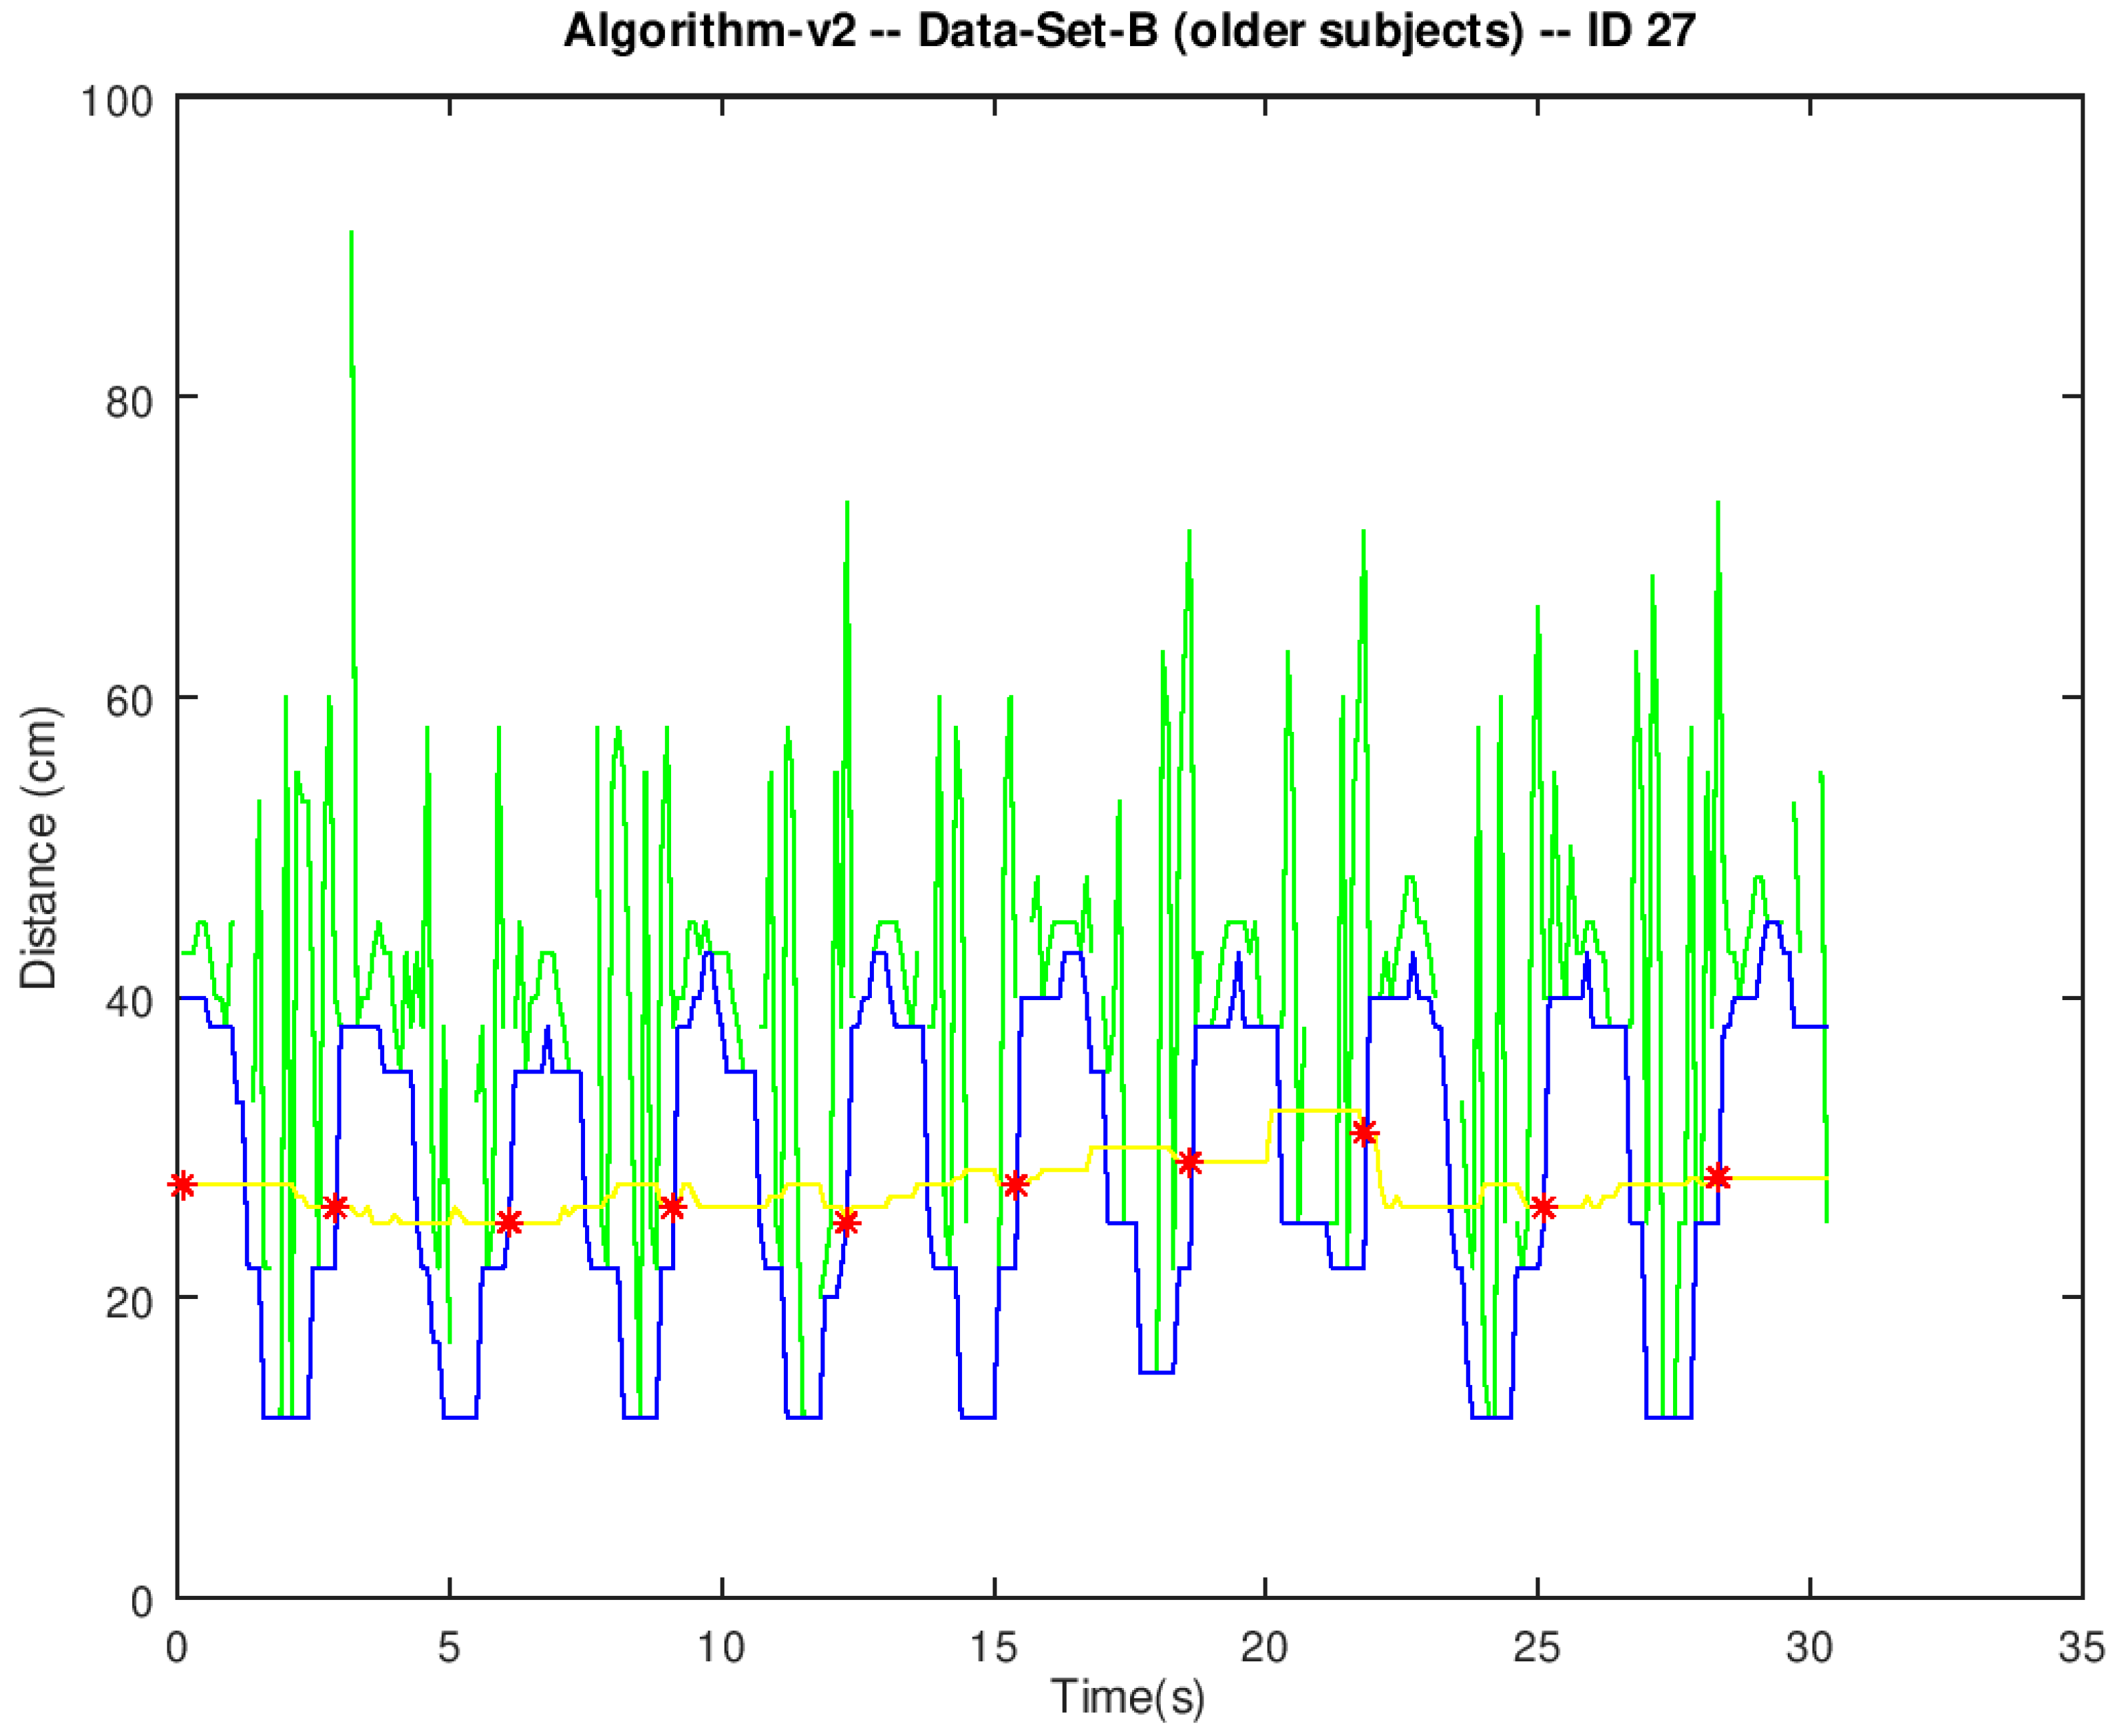
Algorithm-v2 applies a moving minimum filter to the pre-processed signal instead of the moving median filter in Algorithm-v1. The output of the moving minimum filter (blue line in
Figure 6) followed the envelope of the local minima in the pre-processed signal (green line in
Figure 6). Legitimate sit-to-stand events (red dots in
Figure 6) were easier to spot on the envelope of the local minima because such a filtered signal was freed from the rapid variations of the spurious spikes.
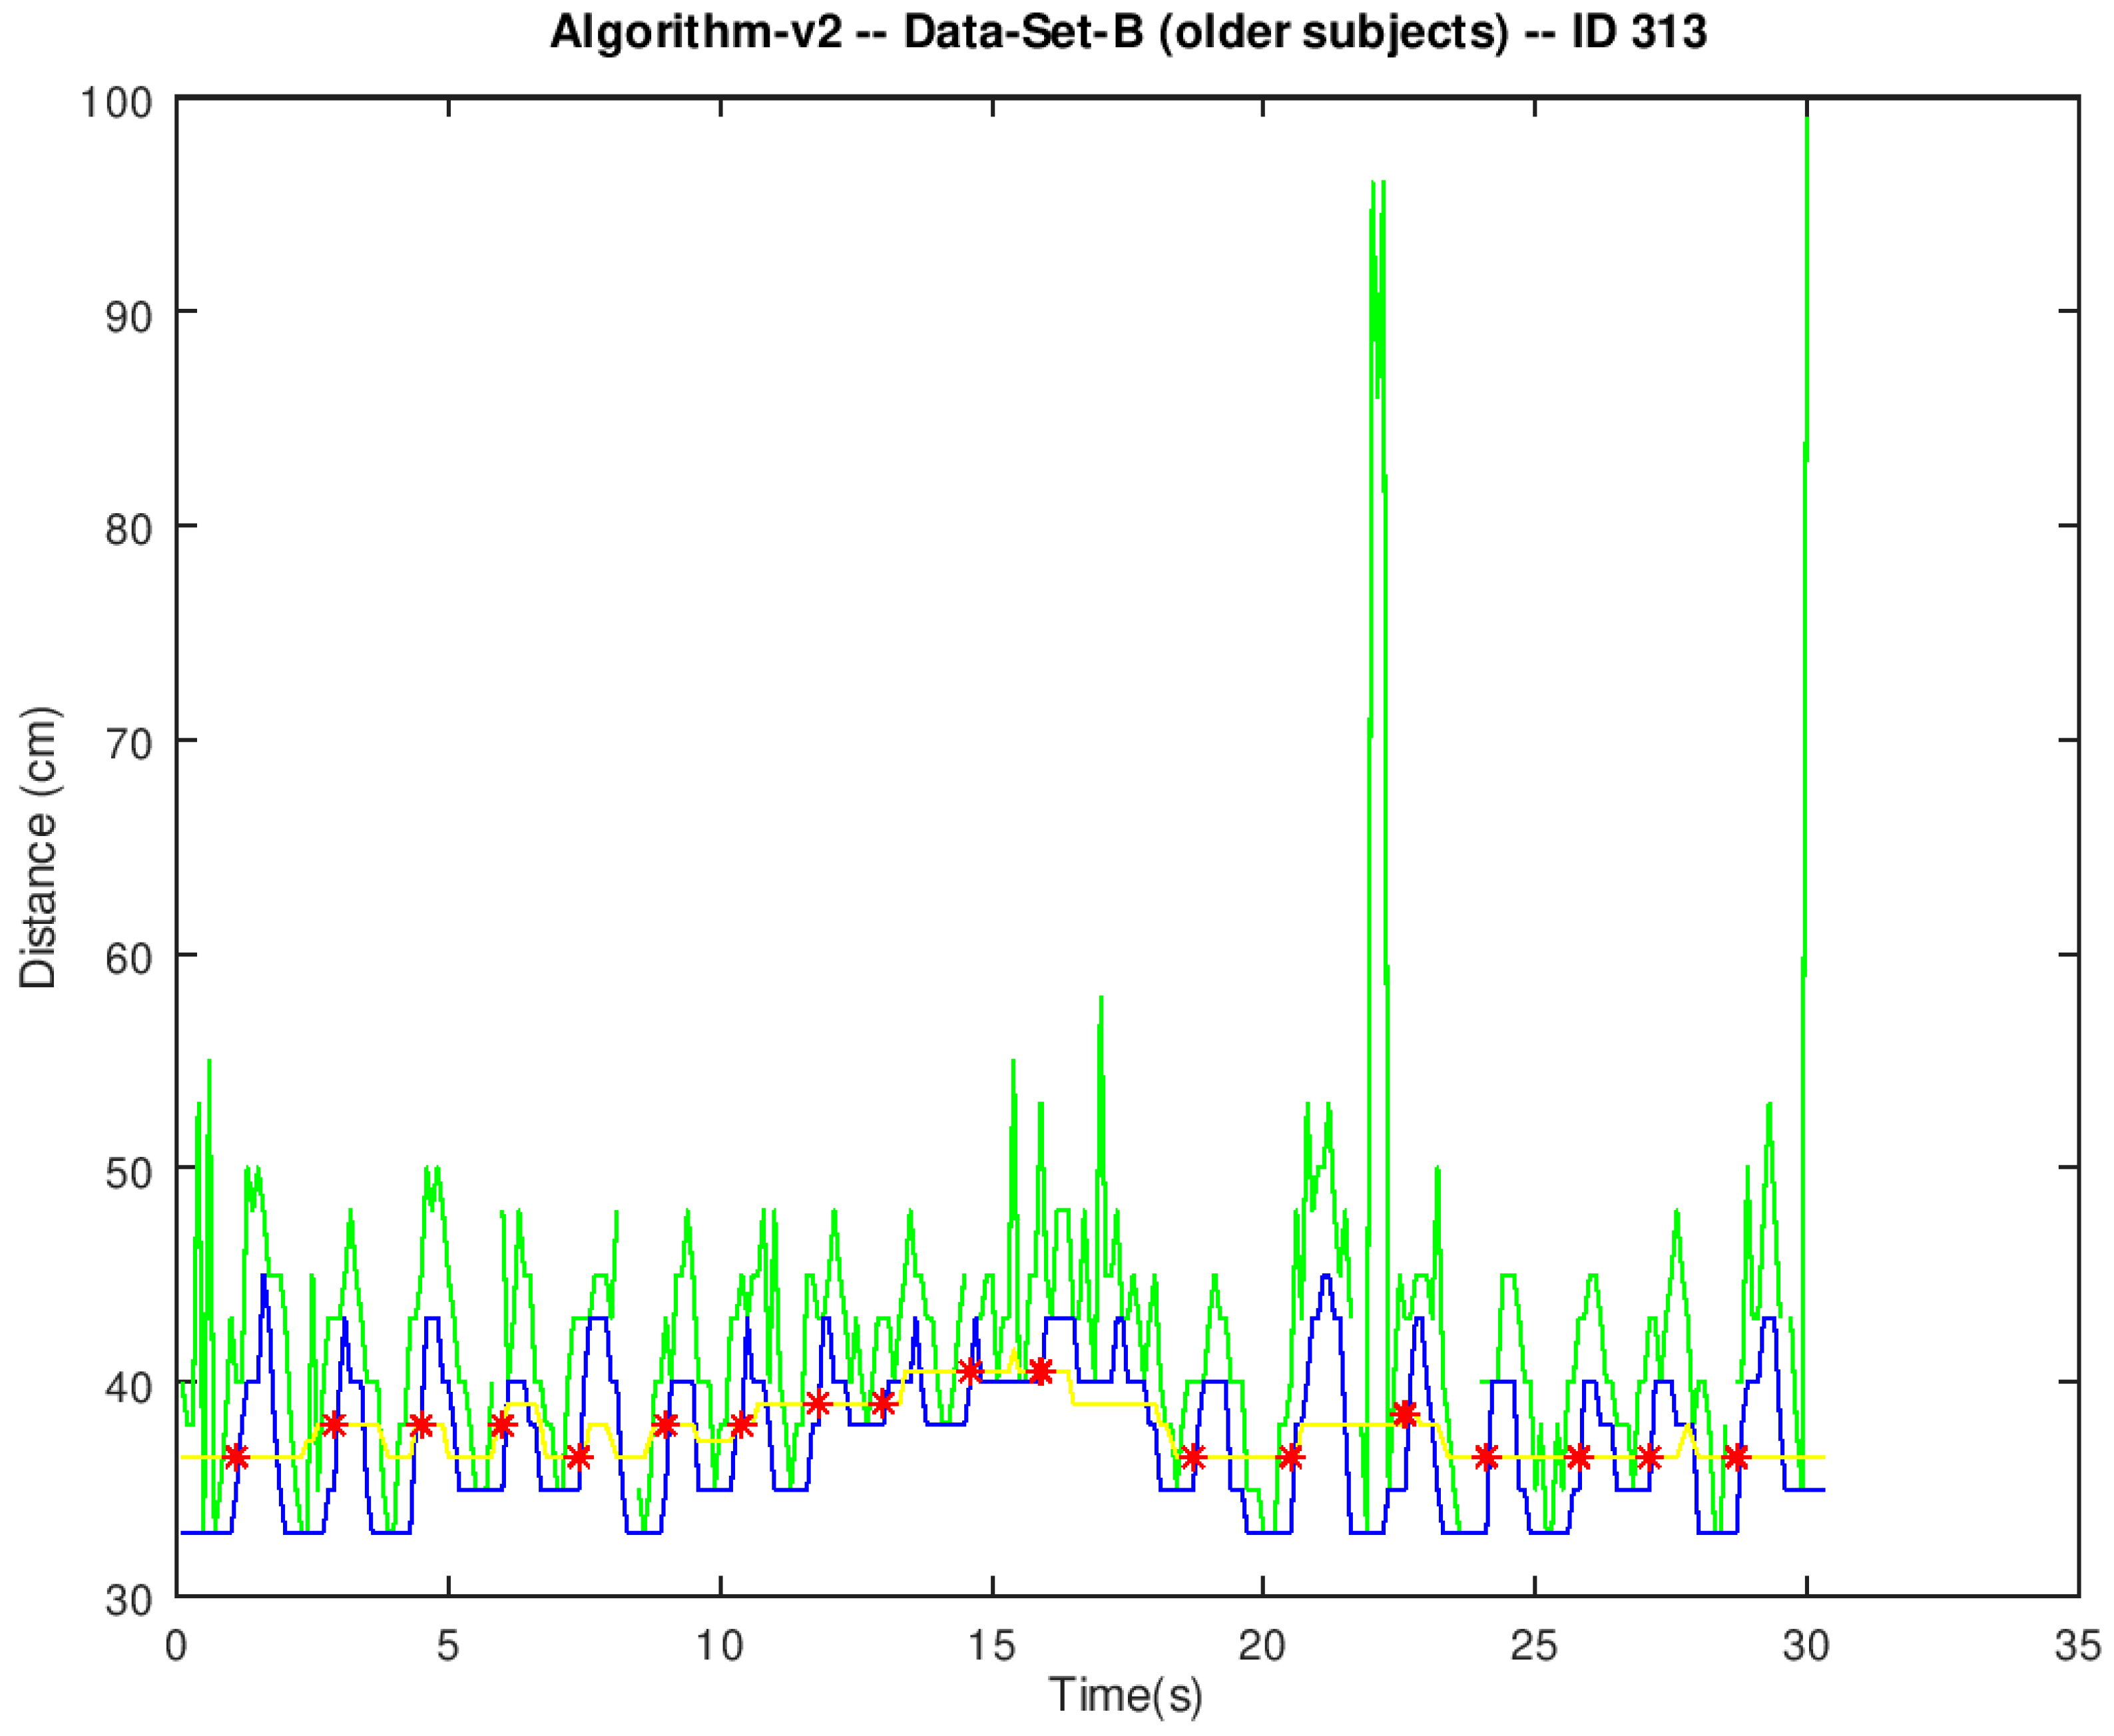
Even though Algorithm-v2 canceled the effect of the spurious spikes, it was still not fully correlated to manual count. We observed that the algorithm had difficulties in correctly spotting sit-to-stand transitions when the value of the minima in the filtered signal (blue line in
Figure 7) was greater than 30 cm. Most of them missed the correct result by one event. The example in
Figure 7 reported one fewer sit-to-stand event than the manual count. Presumably, the algorithm failed to spot the peak around t = 17 s. Other examples with minima greater than 30 cm reported more events than manual counts. It is hard to tell which were the erroneous peaks from visual inspection.
3.2. Classifier Performance
Data from two participants in dataset B were missing information about their gender and age. Since this information is essential to translate the 30-s CST numerical scores into classes of functional performance (i.e., average, below average, and above average), we had to remove their scores, and we did not to use them to assess the classifier performance.
Table 4 shows the results of the classifier performance assessment.
The results of the classifier performance assessment were not conclusive. The estimate for the classifier accuracy was greater than the NIR. However, the binomial test was not significant; thus, we could not guarantee that the actual accuracy of the classifier was really greater than the NIR. The 95% CI was consistent with this observation. In any case, the low power of the analysis did not allow us to firmly state that the accuracy was not greater than the NIR either.
4. Discussion
The excellent IRR results obtained for Algorithm-v1 on dataset A (young healthy subjects) were very promising. However, a subsequent IRR analysis showed Algorithm-v1 to be useless when applied to dataset B (older subjects). The subset of signals in dataset A used in adjusting Algorithm-v1 parameters were also used in performance testing. Thus, an overfitting effect might have been behind the excellent performance initially observed on dataset A. Even though overfitting might have accounted for the differences in performance, we also observed a lot of noise in dataset B, even after the pre-processing stage. Some outliers were resilient to pre-processing because they could not be all completely removed without risking legitimate peaks ending up unrecognizable. These kinds of resilient outliers were also observed in dataset A. However, in that case, the resulting spikes were narrow, spaced wide apart, and scarce. Therefore, their contribution to the output of the moving median filter was insignificant. Conversely, resilient outliers in dataset B were abundant and very close to each other. Therefore, multiple nearby spikes managed to pass through the moving median filter in the form of a single spurious peak susceptible to being mistaken for a legitimate peak. On the other hand, the moving minimum filter in Algorithm-v2 was able to free the filtered signal from those spurious spikes and resulted in a remarkable improvement in performance compared to Algorithm-v1. Thus, we concluded that the poor performance of Algorithm-v1 was due to the moving median filter’s inability to cope with the noisy nature of the signals in dataset B.
The source of additional noise in dataset B was unclear. Functional decline (due to either normal aging or some condition, such as the frailty syndrome) imposes some mobility constraints on older people. Their movements become less precise and, during the experimentation, they might have accidentally moved the chair more prominently than their healthy young counterparts. For example, some of them needed to lean back and forth repeatedly to gain some momentum and stand up. However, we did not collect any data to support this hypothesis which, in fact, comes from an a posteriori subjective evaluation.
Algorithm-v2 was designed to be more responsive than Algorithm-v1 to spurious events in the signals. IRR results did indeed show a remarkable improvement. Again, the subset of signals in dataset B used in adjusting the algorithm parameters were also used in performance testing. Thus, an overfitting effect might have helped to reach better results than in the case of two separate sets. Even though overfitting might have accounted for such a good performance, we observed that the moving minimum filter in Algorithm-v2 was able to completely remove the effect of the spurious spikes from the filtered signal. Since we identified these spikes as responsible for the degradation in the performance of Algorithm-v1, we concluded that the moving minimum filter was responsible for the good performance of Algorithm-v2. Even though the noise from the resilient outliers and their corresponding spurious spikes were completely removed from the filtered signal, Algorithm-v2 and the manual count failed to show full correlation. We observed that the algorithm had difficulties in correctly spotting sit-to-stand transitions when the value of the minima in the filtered signal was greater than 30 cm. We think that this situation happened whenever an elder did not lean back after sitting down on the chair. However, we could not check this hypothesis because we did not video-record the experimental sessions.
The IRR for Algorithm-v2 on dataset B was good according to Koo and Li’s (2016) criteria because the ICC was over 0.75. However, since Algorithm-v2 and the manual count were not fully correlated, the error for some Algorithm-v2 scores was non-zero. We observed that the mean error for Algorithm-v2 scores nearby the border between the average class and the above-average class (m = 1.38, SD = 1.44) was similar or even greater than the mean distance between the manual count and that very same border (m = 1, SD = 1.22). Therefore, the relative magnitude of said error (138%) facilitated erroneous classifications of some subjects despite the good levels of ICC. Conversely, we observed that the mean error for Algorithm-v2 scores nearby the other border, i.e., between the below-average class the average class, (m = 0.94, SD = 1.18) was smaller than the mean distance between manual count and that very same border (m = 2.33, SD = 2.97). Therefore, below-average readings would be less prone to resulting in erroneous classifications. This is consistent with the fact that we only observed erroneous classifications between the average and the above-average classes. This effect resulted in a degradation of the classifier performance which, together with the low power of our sample, made it hard to tell whether outcomes from Algorithm-v2 are reliable enough to identify a subject’s functional status. In fact, the limited sample size was a general limitation of the study. The difference between 30-s CST scores measured two weeks apart is also used as a clinical criterion. It is used to track the progression of functional decline over time; however, our experimental design did not include any follow-up sessions. Thus, further experiments would be necessary to test the ability of Algorithm-v2 to generate scores consistent enough over time to raise the same red flags as a manual count would do.
We expected the main difficulty for the algorithms to be how to tell the difference between valid and invalid sit-to-stand transitions. This is because invalid transitions were expected to look like local maxima just like any other valid transition. Therefore, we expected erroneous outcomes to show a systematic overestimation of miscounts. However, miscounts did not seem to come from invalid transitions. No systematic overestimation was observed, and, in fact, invalid transitions were very scarce. From the total 335 sit-to-stand transitions in dataset B, only 11 of them were labeled as invalid, and they were scattered across seven different signals.
We studied the feasibility of using the quasi-periodic nature of the distance between a subject’s back and the chair backrest during a 30-s CST to carry out unsupervised measurements based on readings from a low-cost ultrasound sensor. The feasibility varied depending on the age and/or functional status of the user. The target population for this kind of clinical test involves older adults. Unfortunately, they generate such noisy signals that local maxima become hard to match to actual sit-to-stand transitions. Using a moving minimum filter to cancel the effects of said noise resulted in a remarkable improvement. Nevertheless, it is still not clear whether the results are good enough to make any clinical decisions based on the sensor outcomes. We did not find any other works reporting the processing of ultrasound readings for this purpose. Even though previous instrumented versions of the 30 s CST exist, all of them made use of acceleration and angular velocity signals from wearable IMUs. This latter approach was proven to be accurate, but the usability and the user experience of wearable devices for frail older people versus portable devices remain unexplored.

 ,
, 


