Article

Establishment of Acid Hydrolysis by Box–Behnken Methodology as Pretreatment to Obtain Reducing Sugars from Tiger Nut Byproducts

by
María del Carmen Razola-Díaz
1,
Vito Verardo
1,2,*,
Beatriz Martín-García
1,
Elixabet Díaz-de-Cerio
1,
Belén García-Villanova
1 and
Eduardo Jesús Guerra-Hernández
1
1
Department of Nutrition and Food Science, University of Granada, Campus of Cartuja, 18071 Granada, Spain
2
Institute of Nutrition and Food Technology ‘José Mataix’, Biomedical Research Center, University of Granada, Avda del Conocimiento sn, 18100 Granada, Spain
*
Author to whom correspondence should be addressed.
Agronomy 2020, 10(4), 477; https://doi.org/10.3390/agronomy10040477
Submission received: 21 February 2020 / Revised: 24 March 2020 / Accepted: 26 March 2020 / Published: 31 March 2020

Abstract

:
Carbohydrate-rich byproducts may be used as a growth substrate for microalgae. The tiger nut, compared to other tubers, has higher carbohydrate content, which mostly remain in the byproduct after the production of tiger nut milk (“Horchata”). The aim of this study is the optimization of a hydrolysis pre-treatment in tiger nut byproduct to obtain reducing sugars, objective framed in the European SUSPUFA (Sustainable production of health-promoting n-3 LC-PUFA using agro-food industry by-products through microalgae) Project. Two experimental 4-factor Box–Behnken designs (acid concentration (N), temperature (°C), time (min) and ratio acid/sample) were carried out with 27 experiments to optimize chemical hydrolysis conditions with H2SO4 and H3PO4 in duplicate. The sugars were determined by the Schoorl method and the extracts obtained by the optimal conditions were analyzed by high-performance liquid chromatography (HPLC). Protected designation of origin (PDO) and non-protected designation of origin (n-PDO) tiger nut byproducts were characterized by physicochemical methods. The validity of the experimental designs was confirmed by ANOVA. The optimum sugar values were obtained with H2SO4 2 N at 85 °C, 60 min and ratio 60 and H3PO4 21 N at 90 °C, 60 min and ratio 60. Glucose and xylose were the sugars detected in the hydrolyzed samples. In conclusion, almost 50% of the total carbohydrates present in the tiger nut byproduct were hydrolyzed to reducing sugars.

Graphical Abstract

1. Introduction

The recent update published by the European union (EU) on the Bioeconomy Strategy underlined the importance to re-use the food wastes and sewage sludge as raw materials useful for biorefinery and as a source of added value products [1]. The ‘biorefinery’ concept is analogous to the conventional petrochemical refinery, where several processes are used to obtain renewable source of carbon from organic feedstocks. In this way, the ‘pyramidal approach’ of biorefinery favorites the extraction of valuable biomolecules instead the bioenergy production, involving advanced technologies for the production of biofuel or to obtain bio-products [2]. The substrate used for biorefinery scope includes as first-generation biomasses (i.e., simple sugars cane and corn) than second-generation biomasses (i.e., food wastes or byproducts and sewage sludge). The first ones show very good efficiency in terms of fermentation; however, they are expensive and non-sustainable if compared to food industry wastes. In fact, second-generation biomasses represent a very good substrate to obtain bioethanol, biogas and bioactive compounds, taking advantage from a waste and avoiding the cultivation expenses for a dedicated crop that it is in competition with the food and feed industry [3]. Briefly, the cost of first-generation biomasses is higher than the second-generation biomasses represented by food wastes and sewage sludge.
Finally, the constitute third-generation biomasses is represented by microalgae; they are able to mitigate carbon dioxide emissions and produce oils with potential applications as biofuels or for food and feed scope [4]. There are more than 30.000 species of microalgae cataloged and available, but nevertheless only a few are studied and used for industrial scope. Among others, Haematococcus pluvialis is used to produce astaxanthin, a carotenoid with a high antioxidant power; Chlorella vulgaris and Spirulina platensis are used as nutraceutical supplements; Isochrysis galbana and Nannochloropsis gaditana, are used as omega-3 fatty acid source due to their high content of polyunsaturated fatty acids, docosahexaenoic acid (DHA) and eicosapentaenoic acid (EPA), respectively. Finally, Porphyridium cuentum is produced ad phycoerythrin source; and Anabaena produces a high amount of exopolysaccharides [5]. Heterotrophic or mixotrophic microalgae are able to digest simple sugars, as source of organic carbon. Because of that, sugar rich byproducts from the food industry could be used as microalgae culture media, thus reducing fertilizer costs and waste/wastewater disposal. Bibliographic data on the production of microalgae from byproducts and food wastes are few and not complete in terms of the productivity of obtaining microalgae and the chemical composition of biomass [6,7,8], thus SUSPUFA (Sustainable production of health-promoting n-3 LC-PUFA using agro-food industry by-products through microalgae) European Project is developing sustainable processes based on the recovery of food wastes to grown different microalgae rich of polyunsaturated fatty acids.
There is a wide variety of tubers and nuts which byproducts could have a potential use for this purpose. These products with high content in valuable carbohydrates are potato (18.2%) [9,10], yam (34.6%) [11], tupinambo (14.8%) [12], yacon (13.8%) [13], sweet potato (25.7%) [14], cassava (38%) [15], almond (6.10%) [16], hazelnut (4.70%) [17] and others nuts as walnut (3.90%), pistachio (7.80%), pinion (3.70%) or peanut (7.48%) [16]. However, other products such as tiger nuts show highest natural carbohydrate and sugar content (43.3%) [18,19]. “Valencia’s tiger nut” of protected designation of origin (PDO) (Cyperus esculentus L. var. Sativus Boeck.) is yellow tiger nut used for “horchata” or tiger nut milk which is a typical non-alcoholic beverage of Spain, with milky appearance, white color and mild flavor. It should be noted that this drink is also consumed in other countries such as Mexico, Panama, Dominican Republic, United States of America (USA) and South of France [20]. The horchata production industry in Spain represents an annual consumption of almost 3 million kilograms of tiger nut to produce around 50 million liters of horchata, valued at 60 million euros. The byproducts of horchata production account for 60% of the tiger nut used [21] and it stands out for its high dietary fiber content [22] and antioxidants such as phenolic compounds among others [23]. Until now, tiger nut byproducts are mainly used as composting and animal feed or as organic matter for combustion [24] and as a carbon source for the growth of probiotic bacteria [25]. Due to its extraordinary water and oil retention capabilities, high emulsifying capacity and low water absorption compared to other sources of dietary fiber, tiger nut by products are used as an alternative to soy (which is a known allergen), for the production of gluten-free products [26]. Other authors have evaluated the potential of this byproduct as a source of fiber to enrich meat products such as pork [27] or beef [28] burgers and pork sausages [29], to enhance cooking performance, moisture and fat retention.
Taking into account these premises, Box–Behnken designs and response surface methodology (RSM) [30], were used to establish the extraction conditions of reducing sugars basing on a pre-treatment with acid hydrolysis of tiger nut byproducts. The best extraction conditions were applied to two characterized variety of tiger nut byproducts to identify the source with highest amounts of the reducing sugars. The hydrolyzed extracts were also characterized by ion chromatography.

2. Materials and Methods

2.1. Chemicals

Reagents and solvents were purchased from Merck KGaA (Darmstadt, Germany). Glucose and xylose, used for the calibration curves, were purchased from Sigma-Aldrich (St. Louis, MO, USA).

2.2. Samples

Tiger nut byproduct samples were provided by Puleva company located in Granada (Spain), in May 2019. Two types of samples were collected, one from protected designation of origin (PDO) of Valencia and another one without appellation of origin (non-protected designation of origin (n-PDO)) from Ivory Coast (the pictures of these byproducts are presented in the Graphical abstract). The PDO byproduct was obtained after three successive pressing of the tiger nut, while the n-PDO byproduct was obtained after only two presses. The samples were dried till 5.57% ± 0.29% and 5.46% ± 0.67% humidity in PDO and n-PDO tiger nut byproduct respectively and they were frozen at −18 °C until the analyses in order to prevent possible fermentation or degradation.

2.3. Experimental Design

The experimental hydrolysis conditions to obtain the reducing sugars from tiger nut byproducts were selected by the Box–Behnken design, coupled to response surface methodology (RSM). The complete design consisted of 27 experimental series, in three blocks, with three levels (−1, 0, 1) for each factor was performed in duplicate. The variables taken into account are the effects of acid concentration (N) (X1), bath temperature (°C) (X2), time (min) (X3) and acid/sample ratio (mL/g) (X4). The response variables were adjusted to a second order polynomial model equation (Equation (1)) estimated by RSM.
Equation (1). Second order polynomial equation.
Υ =   β 0 + i = 0 4 β i X i + i = 0 4 β ii X ii 2 + i = 0 4 j = 0 4 β ii X i X j
where Υ represents the response variable, the sum of reducing sugars, Xi and Xj are the independent factors that affect the response and β0, βi, βii and βij are the regression coefficients of the model (interception, linear, quadratic and interaction term). The design and the results of the mathematical model were obtained using the Statistica 7.0 package (StatSoft, Tulsa, OK, USA). The analysis of variance (ANOVA) was performed at 95% confidence level for the response variable. The suitability of the regression model was assessed using the regression coefficient (R2), the p-value of the regression model and the p-value of the lack of adjustment. The importance of the model was valued on the p-value obtained for the terms of interception, linear, quadratic and interaction of the model. Optimum conditions were established by RSM.

2.4. Optimized Chemical Hydrolysis

For the model made with sulfuric acid, it was weighed 0.67 g of sample and 40 mL of sulfuric acid 2 N (ratio 60) was added in 250 mL Erlenmeyer flasks and they were capped and covered with aluminum foil. The hydrolysis was carried out in a thermostatic bath at 85 °C (GLF 1086, Burgwedel, Germany) under agitation for 60 min. When the time was up, the flasks were allowed to cool to room temperature and they were filtered to 50 mL Falcon tubes with standard filter paper (Albet 400, 38 µm; Albet® LabScience, Dassel, Germany).
In the model made with phosphoric acid, 0.67 g of sample was weight and 40 mL of phosphoric acid 21 N (ratio 60) was added in 250 mL Erlenmeyer flask capped and covered with aluminum foil. The hydrolysis was carried out in a thermostatic bath at 90 °C under agitation for 60 min. After that, the flasks were cooled at room temperature and they were filtered to 50 mL Falcon tubes with filter paper (Albet 400, 38 µm; Albet® LabScience, Dassel, Germany). In both cases the flasks were weighed before and after the hydrolysis process in order to check that any loss was occurred during the hydrolysis process.

2.5. Determination of Simple Sugars by Volumetry

The determination of reducing sugars was carried out following a variant of the Fehling method proposed by Schoorl, which is included in the first commission directive of 26 July 1979, establishing the methods of community analysis for the control of certain sugars intended for human consumption [31].
Briefly, 3 mL of hydrolyzed sample were diluted up to 20 mL with distilled water in a 250 mL Erlenmeyer flask. After that, 10 mL of Fehling A, 10 mL of Fehling B, 10 mL of deionized water and glass beads were added to the flask. The mix was heated in a Bunsen burner and kept boiling for 2 min. It was quickly cooled in an ice bath to room temperature; 10 mL of potassium iodide 30% (w/v) solution, 10 mL of 10 N sulfuric acid and 3 drops of 1% starch were added. The iodine produced was titrated with 0.1 N sodium thiosulfate until total disappearance of the blue-black color.
The blank test was performed using distilled water instead the extract.
The calibration curves were performed by titration of anhydrous glucose (dextrose) and xylose solutions from 100 to 3000 ppm (15 concentration points).

2.6. Determination of Sugars by Ionic Chromatography

The sugar composition of hydrolyzed samples was determined by ion chromatography using a Metrohm 940 Professional IC Vario 2 ion chromatograph (Metrohm AG, Herisau, Switzerland), with amperometric detection. Working conditions were controlled from the MagIC Net ™ software from Metrohm AG (Herisau, Switzerland).
The experimental conditions of the chromatographic analysis were: Flow: 0.500 mL/min; Temperature: 30 °C; Analysis time: 25 min; Column: Metrosep Carb 2–250/4.0 (Metrohm AG, Herisau, Switzerland); Eluent composition: 300 mM NaOH–100 mM Na acetate.
Before the analyses, the hydrolyzed samples were neutralized with NaOH and filtered by a 0.45 µm syringe filter. The sugars were identified by matching the retention time of the sugars in the chromatogram with the external standards. The calibration curve of each sugar was obtained at concentrations between 0.5 to 50 ppm, plotting the areas versus the concentration.

2.7. Complementary Analytical Determinations

2.7.1. Moisture Determination

Moisture analysis of the samples was done following the official method 925.10 of the Official Association of Chemical Analysts [32]. The determination was made by gravimetric determination of the product dried in an oven (J.P. Selecta, Conterm model, Barcelona, Spain) at 130 °C, at atmospheric pressure, until constant weight.

2.7.2. Protein Determination

The total protein content was determined by the Kjeldahl procedure, a process that involves digestion, distillation and titration of the total nitrogen in the samples [33,34].
Briefly, 2 g of sample was weighed in a Kjeldahl tube with 2 g of catalyst (100 g K2SO4, 6 g CuSO4 and 1 g of Se powdered) and 25 mL of 95–98% concentrated H2SO4 and glass beads were added. It was mixed gently and placed in the heating battery (J.P. Selecta, BLOC DIGEST 12 model, Barcelona, Spain) and digested at 320 °C until it was transparent with greenish-blue coloration (approximately during 1.5 h). It was cooled and 25 mL of water was added. Then, 50 mL of 4% boric acid was added and a few drops of Shiro–Tachiro indicator (0.1 g of methyl red and 0.05 g of methylene blue were dissolved and flush to 100 mL with ethanol of 96%) in a 250 mL Erlenmeyer. The Kjeldahl tube was fit to the distillation apparatus (J.P. Selecta, PRONITRO I model, Barcelona, Spain) and 125 mL of 33% NaOH was added. Finally, 250 mL of distillate was collected and titrated with 0.1 N hydrochloric acid. A blank test was performed.

2.7.3. Fat Determination

Fat content was determined extracting the samples (2 g) by petroleum ether (Soxhlet procedure, AOAC official method 966.15 [35]); solvent was evaporated by rotary evaporator and fat amounts were weighed.

2.7.4. Ash Determination

The ash content was determined according to ICC method 104/1 [36].
Briefly, 2 g of sample were calcinated at 510 °C in a muffle furnace (Nabertherm, LE 2/11/R6 model, Lilienthal, Germany), until obtaining white ashes. After this, it was cooled and weighed.

3. Results and Discussion

3.1. Tiger Nut By-Products Characterization

A complete characterization of tiger nut byproducts from PDO and n-PDO was carried out. The results obtained are shown in Table 1.
The greatest differences in composition were in fat content and total carbohydrates. In fact, n-PDO tiger nut byproduct presented a higher fat content (7.41%). The PDO tiger nut byproduct has the highest content of proteins (1.2%), while in terms of ashes and humidity similar results were obtained. Consequently, the PDO tiger nut byproduct was the one with the highest total carbohydrate content (27.3%) obtained by difference. This fraction includes starch, that in tiger nut is closely related to that of cassava and insoluble fiber (99.8% of total fiber) [19]. As expected, reducing sugars content is very low in these byproducts because they passed in the tiger nut milk (horchata) during its production.

3.2. Setting Ranges for Model Parameters

Previous tests were carried out in order to select the Box–Behnken factor ranges. According to literature [37,38,39], HCl was not taken into account because compared to H2SO4 or H3PO4 a low yield of hydrolysis was obtained. Thus, higher amounts of HCl and/or higher time of treatment would be required in order to obtain results similar to those with the used acids in order to hydrolyze the complex carbohydrates as fiber. In fact, as reported by Khawla and co-workers [38], that compared the yield of reducing sugars after an acid hydrolysis using HCl and H2SO4 (both at a concentration of 5% and at 90 °C), the highest amounts were obtained using sulfuric acid and in lees time (90 vs. 120 min). On the other hand, the final application of the hydrolysate is to be the culture medium of microalgae and they need phosphorus (around 3% of the total weight of the culture medium) and sulfur (around 1% of the total weight of the culture medium), that could proceed as residues of the chemical hydrolysis pretreatment; contrary, their need chlorine is only in trace, thus additional processes should be applied to eliminate the chlorine [5]. Based on a study on potato peel [38], 1.8 N sulfuric acid, with a ratio of 15, 120 min at 90 °C was used to hydrolyze starch and cellulose standard compounds. The results obtained were not entirely satisfactory because 94.54% of starch and 0% of cellulose were hydrolyzed. These first assays confirmed that starch can be hydrolyzed by this H2SO4 1.8 N, however, cellulose remains intact. Therefore, according to Englyst and co-workers [40] that hydrolyzed the chemical fiber, a 12 N sulfuric acid solution was used to evaluate the cellulose hydrolysis. The result obtained showed that 28.94% of cellulose can be hydrolyzed. Thus, a range between 2 and 12 N of H2SO4 was adopted for the Box–Behnken model design. A similar work was carried out for H3PO4 and a range of concentration from 6 to 36 N of H3PO4 was chosen.
To evaluate the influence of static and dynamic hydrolysis, chemical hydrolysis was tested in test tubes with a screw cap in a static oven system at 90 °C for 150 min and in 250 mL Erlenmeyer flasks capped and covered with aluminum foil was tested in a thermostatic bath at 90 °C for 120 min and 100 min−1 revolutions of shaking. The dynamic hydrolysis reported highest amount of reducing sugars than static hydrolysis carried out in tube.
Subsequently, different ratios samples/acid solutions were tested, allowing adequate agitation and an optimum surface of reaction for hydrolysis. In fact, one of the problems that arises is that the tiger nut byproduct has a low weight/volume ratio, which, although the ratio conditions proposed by other studies used in other byproducts were imitated, were not satisfactory. The lowest ratio to reach a satisfactory hydrolysis was ratio 30. Therefore, the creation of the prediction model was proposed as a low limit of a ratio 30 and the high one 60.
The maximum temperature was set at 90 °C because higher temperatures provide unreproducible data due to the fast evaporation of the water in the thermostatic and consequently to a dishomogeneus distribution of the temperature. The lower limit of the established model was 40 °C.
Finally, according to previous experiments, the upper time limit for the model was established at 150 min.

3.3. Model Fit of Sulfuric and Phosphoric Acid Hydrolyzes

The Box–Behnken model, coupled to response surface methodology, was used to optimize the hydrolysis to obtain reducing sugars and determine the combined effect of acid concentration (X1), temperature (X2), time (X3) and acid/sample ratio (X4). The experimental conditions of the model and the respective responses obtained after acid hydrolyzes developed are presented in Table 2 and Table 3. The observed values for the sulfuric acid ranged between 0.54 and 37.62 g of sugars per 100 g of dry tiger nut byproduct, which corresponded to the following extraction conditions: H2SO4 2 N, 40 °C, 105 min and 45 ratio and H2SO4 7 N, 90 °C, 105 min and 60 ratio, respectively.
The values obtained for the phosphoric acid ranged between 0.38 and 38.34 g of sugar per 100 g of dry tiger nut byproduct with the extraction conditions: H3PO4 36 N, 40 °C, 105 min and 45 ratio and H3PO4 21 N, 90 °C, 150 min and 45 ratio, respectively. The hydrolysis conditions obtained for phosphoric acid are harshest than those reported for sulfuric acid due to the low acidity of phosphoric acid compared to sulfuric.
The experimental data were analyzed by RSM using the least squares method (LSM), a regression model that provides the lowest residual value and was adjusted to a second order polynomial equation (Equation (1)) using for this, the regression coefficients listed in Table 4 for the model with sulfuric acid and Table 5 for the model with phosphoric acid.
Only few significant terms were noticed when the model was analyzed with a significance level (α) of 0.05; because of that, according to Diaz de Cerio and co-workers [41] level of significance was increased to (α) 0.1. According the p-value, both models showed significant effects for the individual linear factors of concentration of acid (β1), temperature (β2) and ratio (β4).
Concerning crossed interactions, the (β12) was significant for both models; moreover, β24 and β34 showed significant interaction in phosphoric acid model. Furthermore, quadratic of acid concentration and temperature (β11 and β22) were also found in both models. Finally, the quadratic of time (β33) was reported only in sulfuric acid model. Time (β3), the rest of interactions and any quadratic product did not have effect with the meanings chosen. The predicted models were recalculated only with significant terms and tested by ANOVA after discarding non-significant terms at p < 0.1 (Table 6 and Table 7).
As can be seen, the present models revealed a high correlation between the factors and the response variable (R2 = 0.9929 and 0.9822 for sulfuric and phosphoric model, respectively) in both models. The validity of the models is statistically accepted due to its p value < 0.05 and a non-significant lack of fit.

3.4. Optimization of Reducing Sugar Extraction Conditions

Taking into account the validity of the predicted models, the optimization of the conditions for the obtention of reducing sugars (RS) was performed. Three-dimensional response surfaces of independent factors were plotted in order to be studied and to obtain the optimal conditions to maximize the value of reducing sugars. This is an essential step because the critical values for the model were not provided by the software. Therefore, to maximize the response, a compromise was established between the minimum possible values of each independent factor.
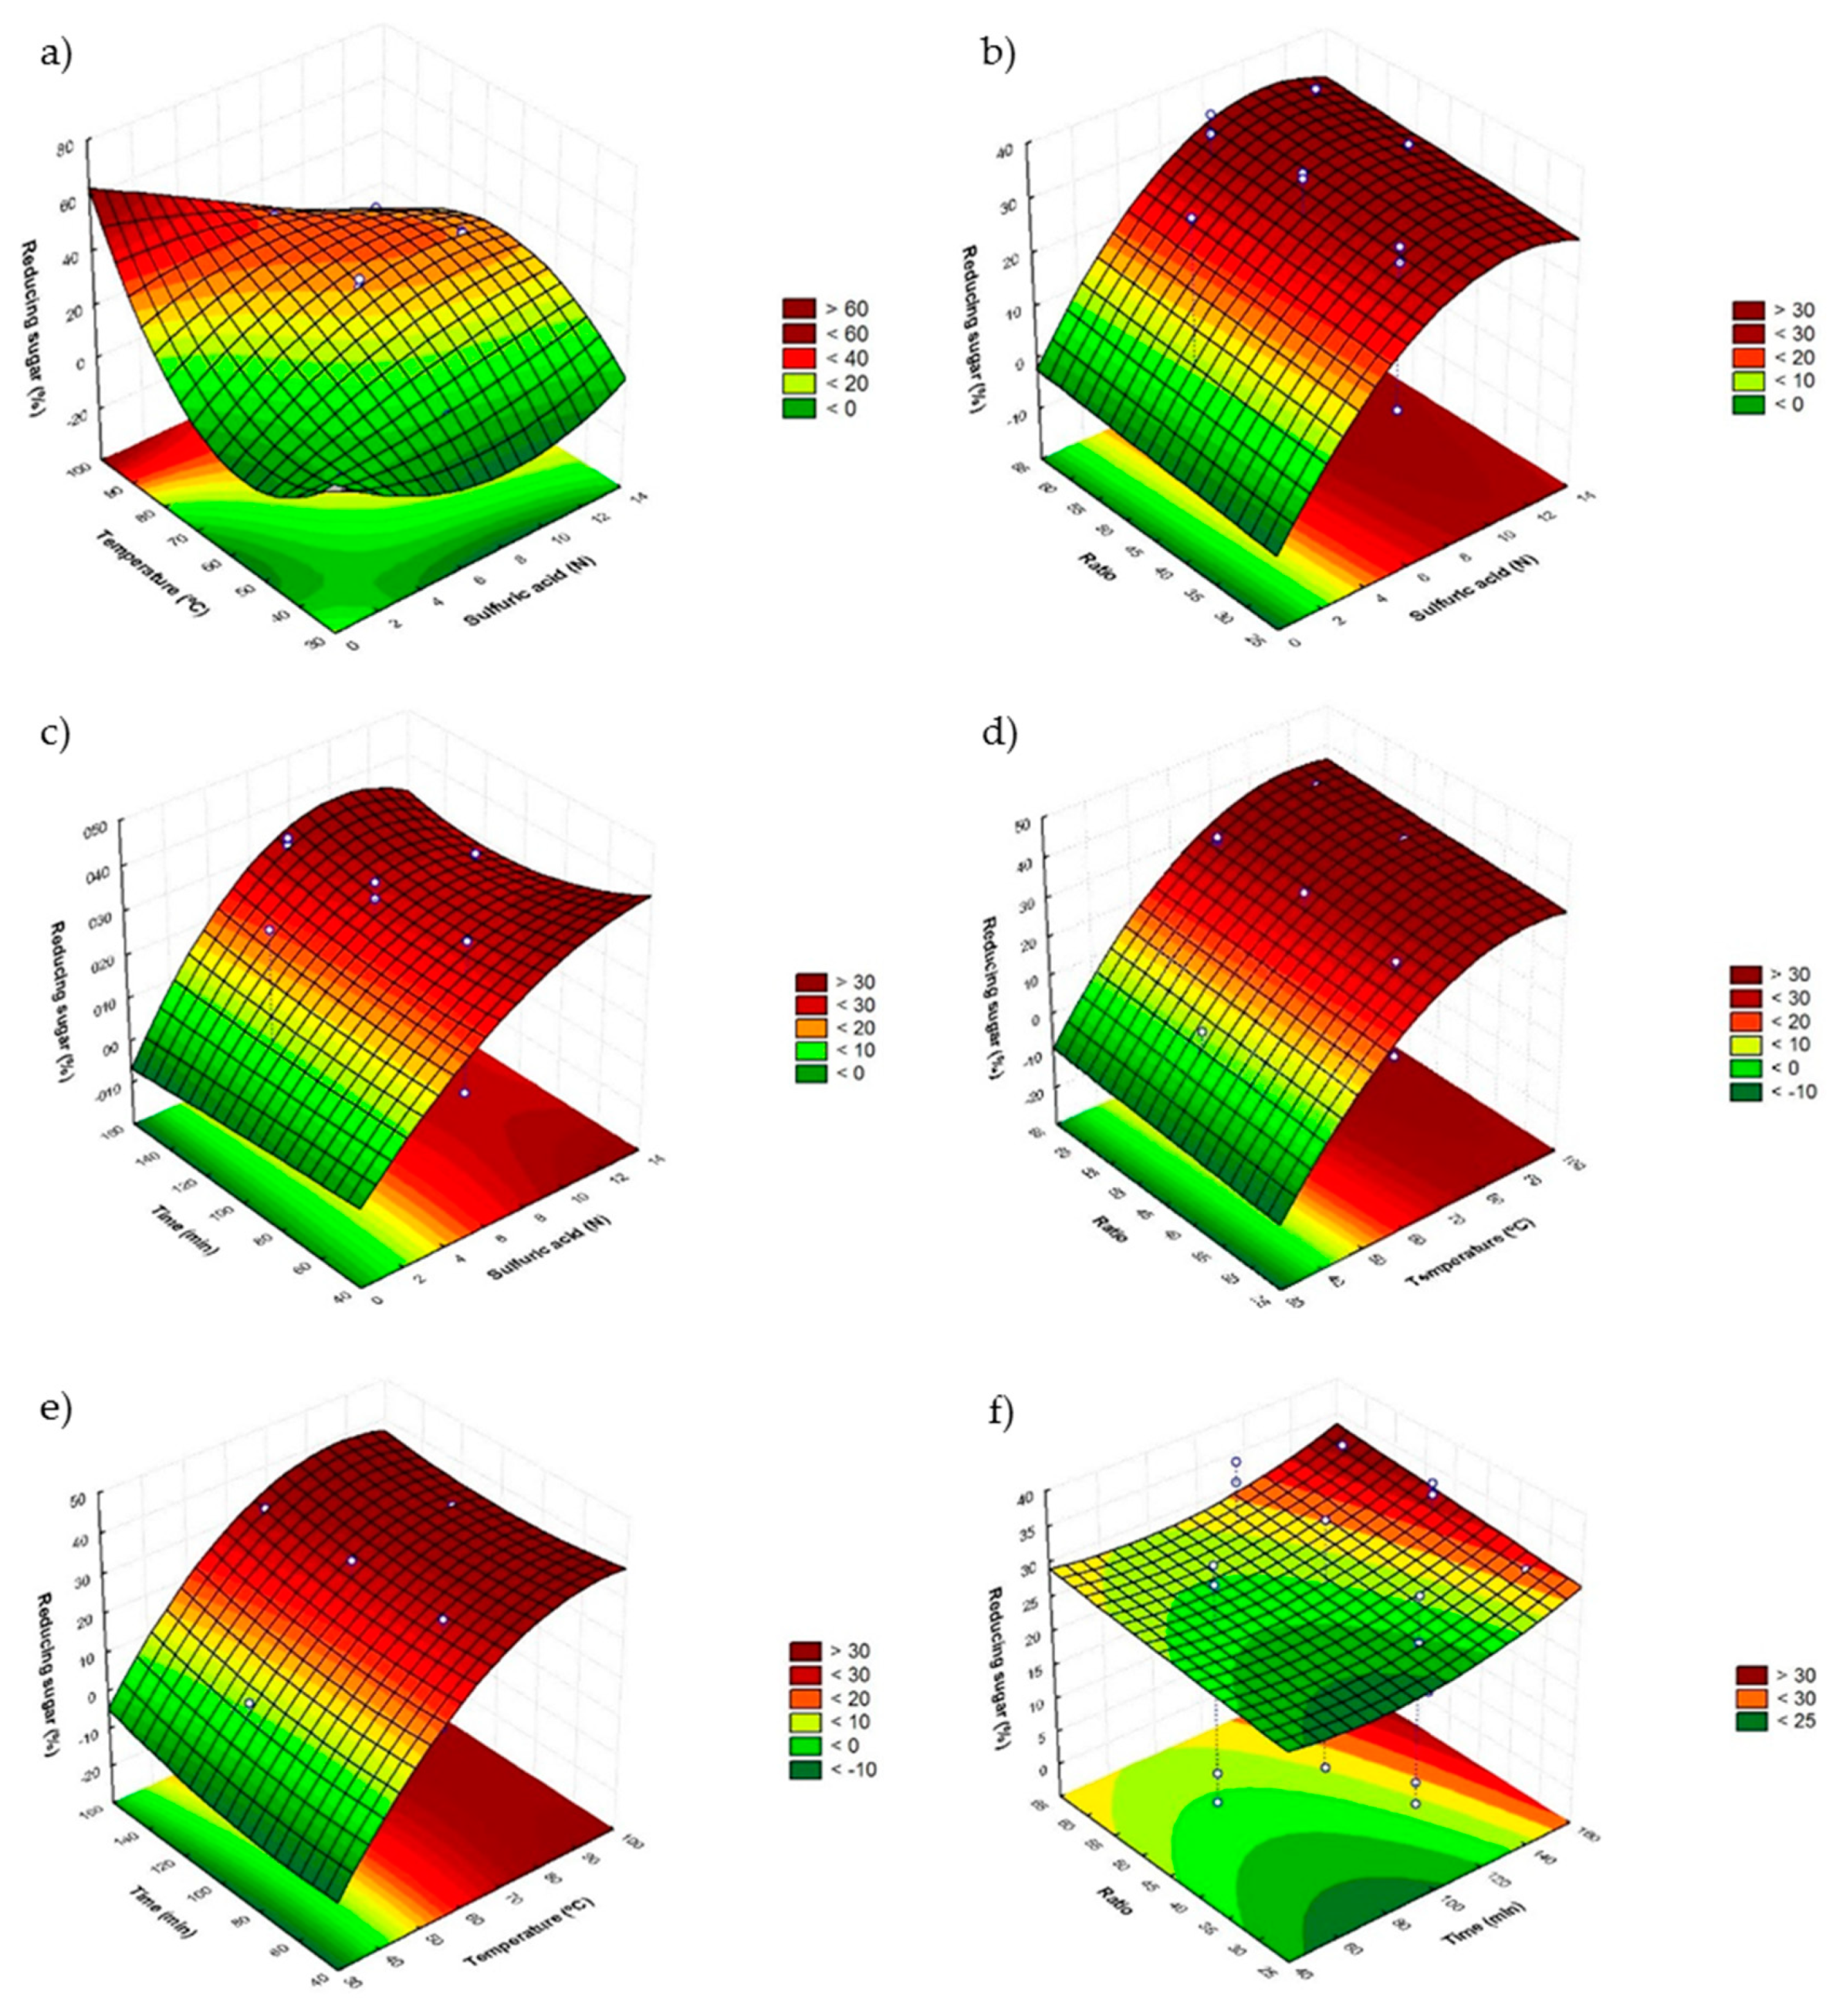
Figure 1 shows the surface responses obtained for the sulfuric acid model. Figure 1a represents the combined effect between H2SO4 (X1s) and the bath temperature (X2), which shows that the RS decrease when the H2SO4 concentration increases, while increasing the temperature at low H2SO4 concentration achieves an increase in RS. In addition, the positive influence of the quadratic term of X1 and X2 and the negative interaction between X1 and X2 produces a maximum range at temperatures in the range 80–90 °C and H2SO4 concentration below 4 N.
According to the study of response surfaces for the concentration of H2SO4 (X1)-time (X3) (Figure 1c) and the concentration of H2SO4 (X1)—ratio (X4) (Figure 1b), the same conclusion could be reached since it is seen that both the time as the ratio seems to have no effect according to the shapes of the graphs. This is confirmed by the low effect shown in Table 4 of the terms X3 and X4 compared to the values obtained for X1 and X2, since some of them were not significant. Thus, in these cases a high RS recovery was achieved with shorter times and higher ratios.
With respect to the combined effect of bath temperature (X2) with time (X3) (Figure 1e) and ratio (X4) (Figure 1d), it was observed that, on the one hand, higher amounts of RS could be obtained in the highest values of X2 and X4 as a result of the positive influence of the regression coefficient (Table 4) and on the other hand, in the lowest values of X3, since the interaction effects are negative. As a consequence, higher RS values are obtained at the level lower than X3 and the highest for X4, concluding that time must be kept to a minimum in order to make the process as fast as possible.
These observations made it possible to adjust the best conditions as follows: Concentration of H2SO4 2 N, 85 °C, 60 min and 60 mL/g ratio.
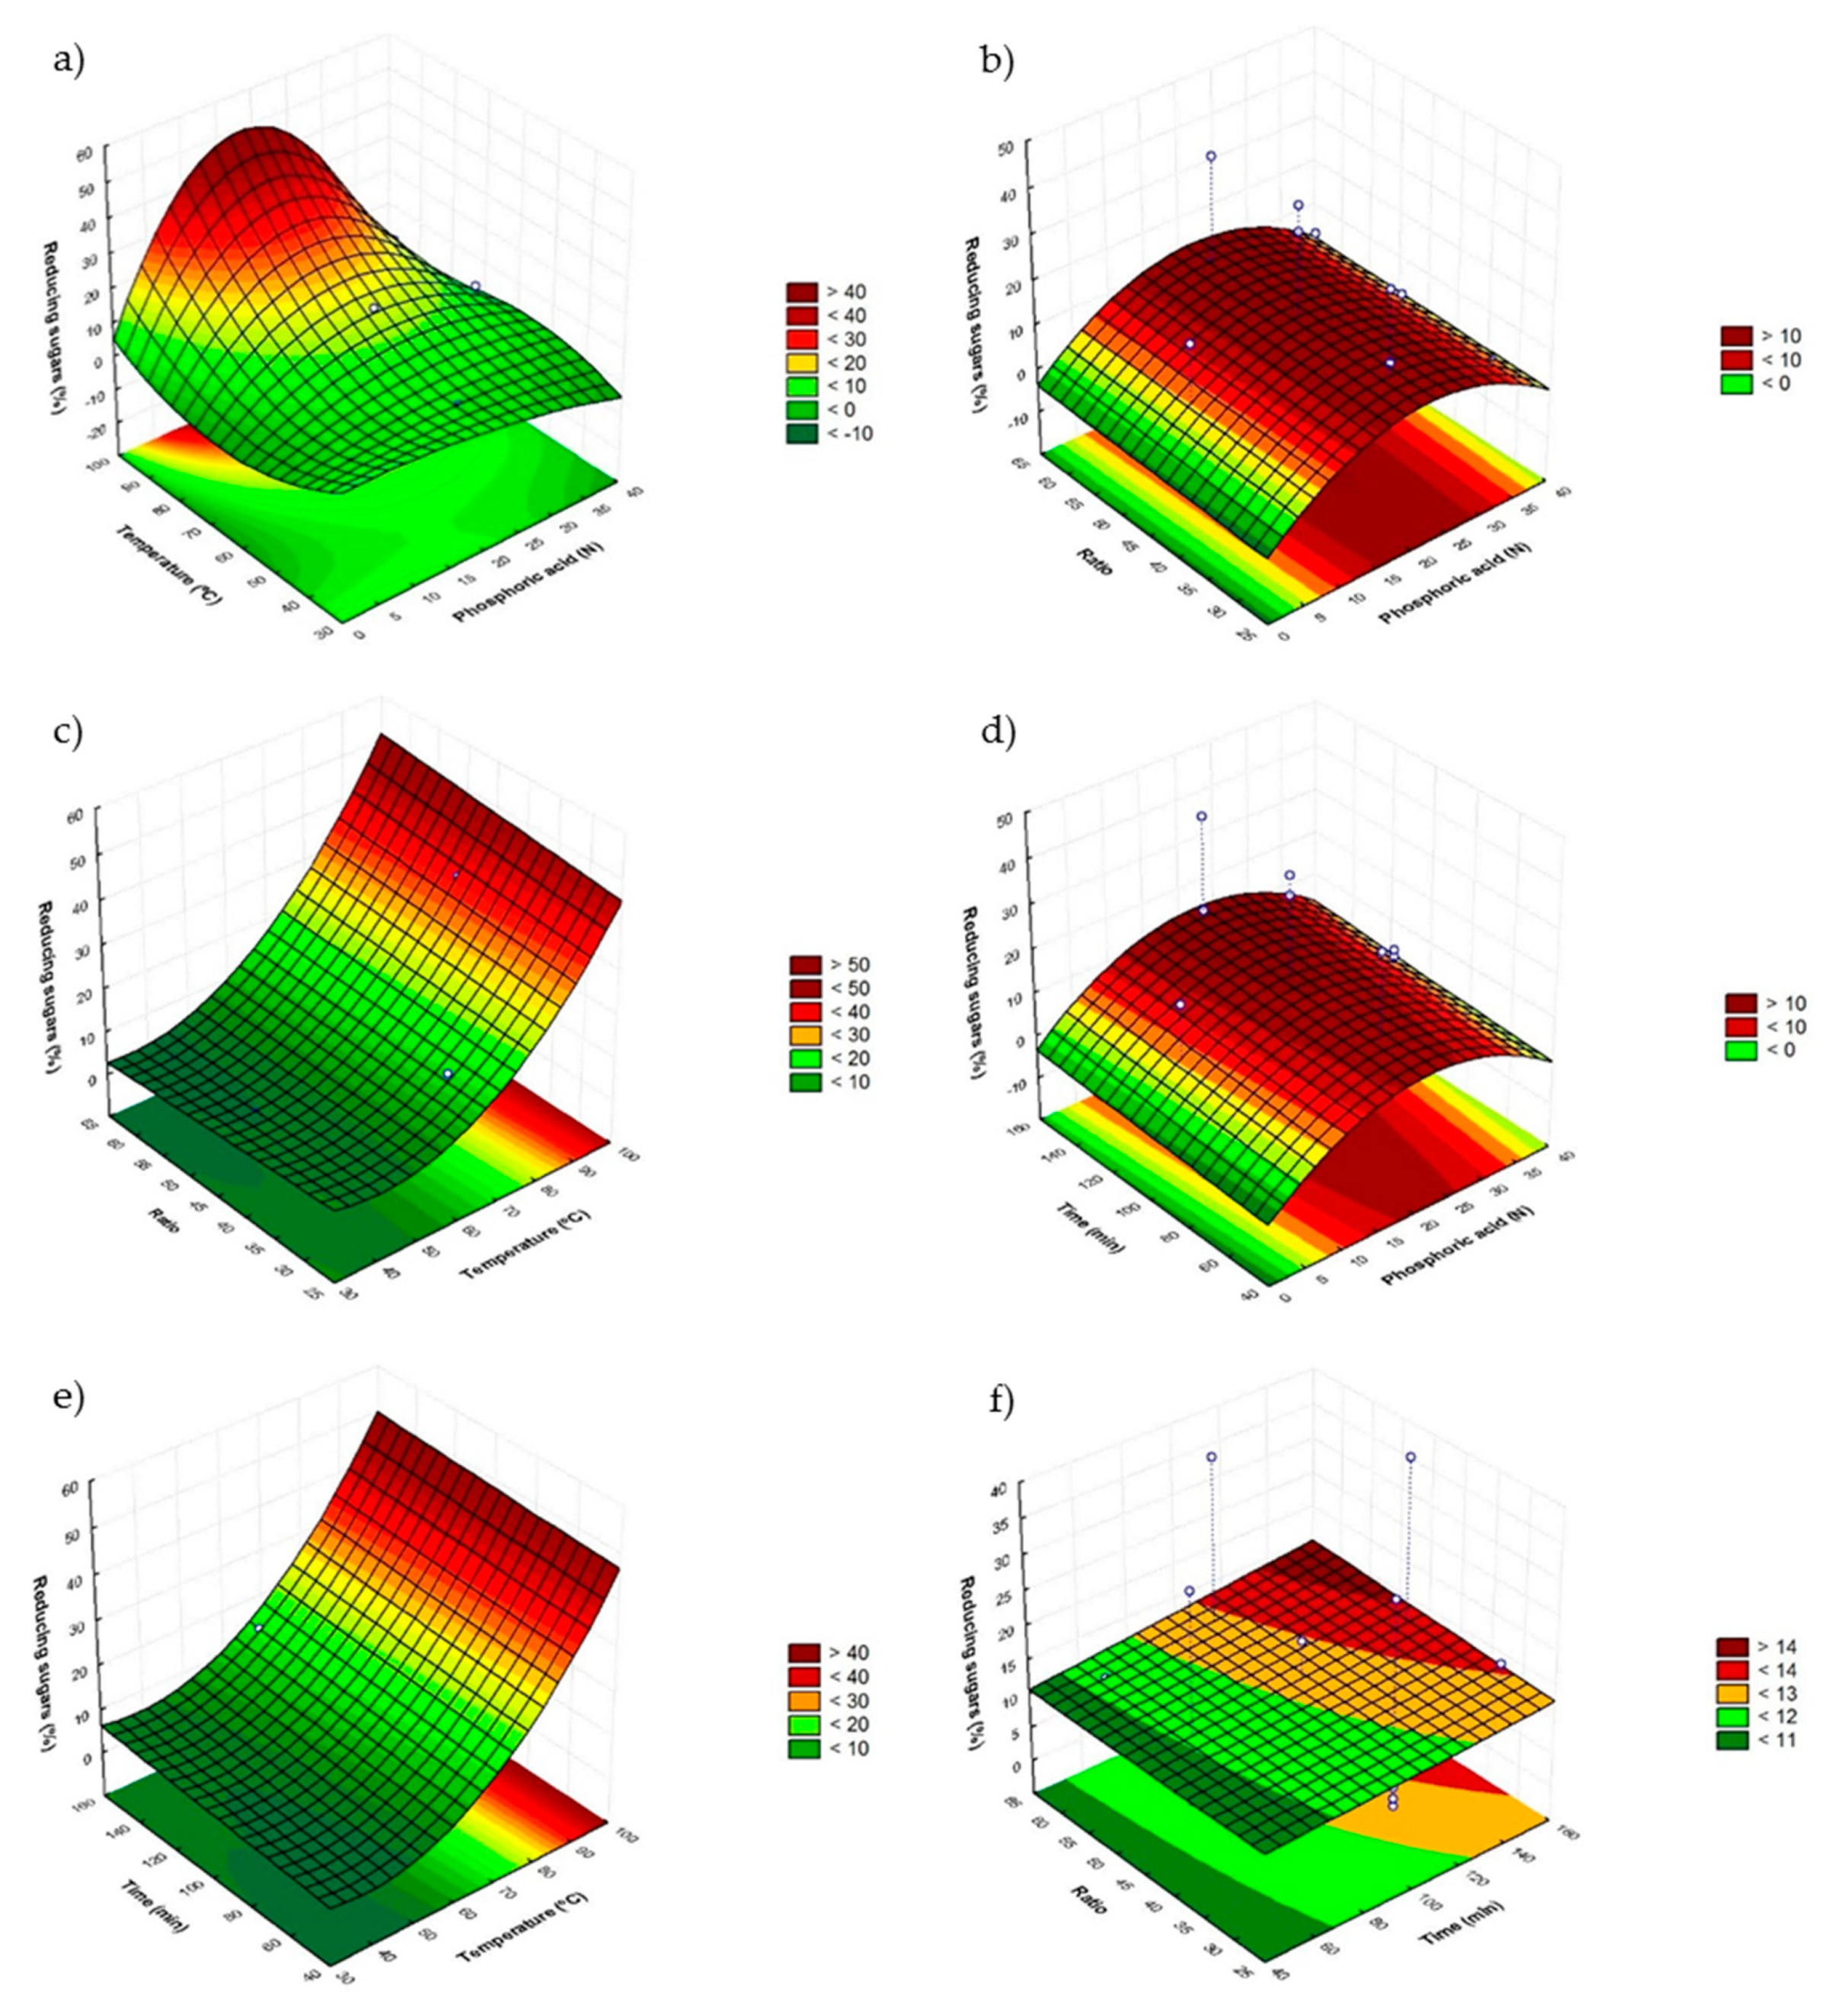
Figure 2 reports all the combined effects between factors in the model of phosphoric acid. First of all is shown the combined effect between H3PO4 (X1f) and the bath temperature (X2) (Figure 2a), which have major effect according with Table 4. As shown in the Figure 2a,c,e the highest values of RS are at the highest temperature, which is corroborated by the graphics ratio (X4)-temperature (X2) (Figure 2c) and time (X3)-temperature (X2) (Figure 2e). Following the temperature, the second factor with major influence is H3PO4 (X1f) and the graphs show clearly that the highest amounts of RS are obtained with intermediate values, because the highest and lowest show negative effect (Table 5). In third term ratio has shown a subtle influence (Table 5) as shown in graphs ratio (X4)-temperature (X2) (Figure 2c) and ratio (X4)- H3PO4 (X1f) (Figure 2b); it can be deduced that with higher ratios higher amount of RS was obtained. Finally, time has not shown significant effect (Table 5); moreover, studying the graphs 2d and 2e, reducing sugars yield is totally independent from the time of treatment, because of that, trying to develop a fast process, the time must be kept to a minimum.
Concluding, the optimal conditions are: H3PO4 21 N, 90 °C, 60 min and 60 mL/g ratio.
However, in the case of phosphoric acid hydrolysis it is important to underline that the maximum RS production was reached at the maximum temperature of the model; probably higher temperatures are needed to improve the carbohydrates hydrolysis. However, they could be reached only using a more expensive process such as the autoclave reactor.

3.5. Confirmation of Optimal Conditions

The predicted models were verified using the predicted conditions (Table 8).
In the first model (made with sulfuric acid), the value obtained with the optimal conditions were 45.39 ± 0.41 of sugar per 100 g. This value did not report significant differences (p < 0.05) compared to the predicted value.
In the second model (made with phosphoric acid), the values of sugar shown with the optimal conditions were 41.1 ± 0.5 g/100 g of dry tiger nut byproduct; neither this value reported significant differences (p < 0.05) compared to the predicted value.
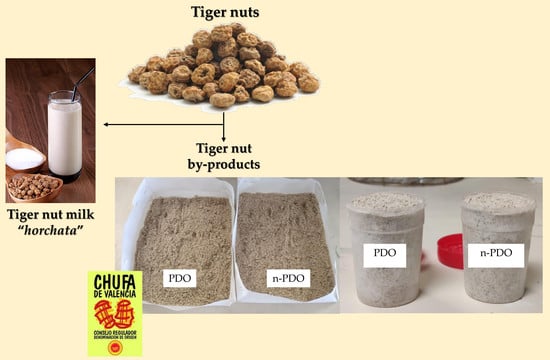
Hydrolysis optimum conditions were also carried out on n-PDO tiger nut byproducts; the total reducing sugar content was 41.45 ± 0.47 and 39.06 ± 0.71 g/100 g of dry tiger nut byproduct for sulfuric and phosphoric model, respectively.
Comparing to the raw byproducts, the hydrolysis with sulfuric acid increased 60 times the reducing sugar in PDO tiger nut byproduct and 20 times in the case of n-PDO tiger nut byproduct. On the other hand, the optimized conditions of hydrolysis with phosphoric acid allowed significant lower reducing sugar content (p < 0.05) than sulfuric acid model. This is probably due to the low acid power of phosphoric acid compared with sulfuric acid.

3.6. Determination of Sugar by Ionic HPLC

The sugars content of hydrolyzed extracts obtained by the optimal sulfuric acid model conditions was also determined by ion chromatography and the results are shown in Table 9.
As reported in Table 9 and in Figure S1, only glucose and xylose were detected after hydrolysis. Positive correlations were also found between volumetric Schoorl method and ion chromatographic method (r2 = 09887, p < 0.05) confirming the good selection of both techniques to determine the reducing sugars.

4. Conclusions

Tiger nut byproducts showed high content of carbohydrates (about 26% on fresh weight) because of that, they are an interesting raw material for biorefinery. Acid hydrolysis is usually used as pretreatment in order to obtain reducing sugars from complex carbohydrates, thus the establishment of the hydrolysis conditions is a mandatory step in order to obtain the high reducing sugar recovery. To this aim, two methods, using sulfuric and phosphoric acid, were set up using Box–Behnken coupled to RSM methodology. The optimum conditions obtained for both models underlined that sulfuric acid showed the best performance allowing higher reducing sugars content at a concentration 2 N and temperature of 85 °C. Conversely, phosphoric acid model showed that the maximum temperature of extraction corresponded to the maximum temperature of the model (90 °C) and at very high concentration (21 N). According to these data, it could be hypothesized that an autoclave treatment is necessary to allow the maximum amounts of reducing sugars when phosphoric acid is used; in contrast, sulfuric acid could be used at atmospheric pressure and at lower concentration than phosphoric acid.
Briefly, adopting the optimum conditions obtained for sulfuric model, 50% of the total carbohydrates present in the tiger nut byproduct were hydrolyzed obtaining an extract rich in glucose and xylose. To our knowledge, this is the first report that describes the possibility to obtain reducing sugar form this byproduct. Thus, this method is proposed as optimum pretreatment previous to the enzymatic hydrolysis in order to obtain reducing sugars from tiger nut byproducts.

Supplementary Materials

The following are available online at https://www.mdpi.com/2073-4395/10/4/477/s1, Figure S1: Chromatogram of reducing sugars obtained by ion chromatography.

Author Contributions

Conceptualization, V.V. and E.J.G.-H.; investigation, M.d.C.R.-D.; data curation, M.d.C.R.-D., E.D.-d.-C. and B.M.-G.; writing–original draft preparation, M.d.C.R.-D.; writing–review and editing, V.V., E.J.G.-H. and B.G.-V.; supervision, V.V. and E.J.G.-H.; funding acquisition, V.V. All authors have read and agreed to the published version of the manuscript.

Funding

This study is part of ERA-Net SUSFOOD2 project SUSPUFA, ID 145, funding provided by Spanish Ministry of Science, Education and Universities/ Spanish State Research Agency (PCI2018-093178) and co-funding by the European Union’s Horizon 2020 research and innovation program.

Acknowledgments

V.V. thanks the Spanish Ministry of Economy and Competitiveness (MINECO) for “Ramon y Cajal” contract (RYC-2015-18795). M.d.C.R.-D. would like to thank to the University of Granada for the “Beca de Iniciación a la Investigación para estudiantes de másteres oficiales” granted by the “Plan Propio 2019” program.

Conflicts of Interest

The authors declare no conflict of interest.

References

  1. European Commission. A Sustainable Bioeconomy for Europe: Strengthening the Connection between Economy, Society and the Environment; European Commission: Brussels, Belgium, 2018; ISBN 978-9-27-994145-0. [Google Scholar]
  2. Xing, Y.; Bu, L.; Zheng, T.; Liu, S.; Jiang, J. Enhancement of high-solids enzymatic hydrolysis of corncob residues by bisulfite pretreatment for biorefinery. Bioresour. Technol. 2016, 221, 461–468. [Google Scholar] [CrossRef] [PubMed]
  3. Galanakis, C.M.; Cvejic, J.; Verardo, V.; Segura-Carretero, A. Food Use for Social Innovation by Optimizing Food Waste Recovery Strategies. In Innovation Strategies in the Food Industry: Tools for Implementation; Galanakis, C.M., Ed.; Academic Press is an imprint of Elsevier: London, UK, 2016; pp. 211–236. ISBN 978-0-12-803751-5. [Google Scholar]
  4. Enamala, M.K.; Enamala, S.; Chavali, M.; Donepudi, J.; Yadavalli, R.; Kolapalli, B.; Aradhyula, T.V.; Velpuri, J.; Kuppam, C. Production of biofuels from microalgae-A review on cultivation, harvesting, lipid extraction, and numerous applications of microalgae. Renew. Sustain. Energy Rev. 2018, 94, 49–68. [Google Scholar] [CrossRef]
  5. Culture Collection of Algae and Protozoa. Available online: https://www.ccap.ac.uk/ (accessed on 20 November 2019).
  6. Candido, C.; Lombardi, A.T. Growth of Chlorella vulgaris in treated conventional and biodigested vinasses. J. Appl. Phycol. 2017, 29, 45–53. [Google Scholar] [CrossRef]
  7. Massa, M.; Buono, S.; Langellotti, A.L.; Castaldo, L.; Martello, A.; Paduano, A.; Sacchi, R.; Fogliano, V. Evaluation of anaerobic digestates from different feedstocks as growth media for Tetradesmus obliquus, Botryococcus braunii, Phaeodactylum tricornutum and Arthrospira maxima. New Biotechnol. 2017, 36, 8–16. [Google Scholar] [CrossRef]
  8. Pleissner, D.; Lam, W.C.; Sun, Z.; Lin, C.S.K. Food waste as nutrient source in heterotrophic microalgae cultivation. Bioresour. Technol. 2013, 137, 139–146. [Google Scholar] [CrossRef]
  9. Lombardo, S.; Pandino, G.; Mauromicale, G. Nutritional and sensory characteristics of “early” potato cultivars under organic and conventional cultivation systems. Food Chem. 2012, 133, 1249–1254. [Google Scholar] [CrossRef]
  10. Murniece, I.; Karklina, D.; Galoburda, R.; Santare, D.; Skrabule, I.; Costa, H.S. Nutritional composition of freshly harvested and stored Latvian potato (Solanum tuberosum L.) varieties depending on traditional cooking methods. J. Food Compos. Anal. 2011, 24, 699–710. [Google Scholar] [CrossRef]
  11. Abara, A.E. Proximate and mineral elements composition of the tissue and peel of Dioscorea bulbifera tuber. Pakistan J. Nutr. 2011, 10, 546–551. [Google Scholar] [CrossRef]
  12. Barta, J.; Pátkai, G. Chemical composition and storability of Jerusalem artichoke tubers. Acta Aliment. 2007, 36, 257–267. [Google Scholar] [CrossRef]
  13. Scher, C.F.; De Oliveira Rios, A.; Noreña, C.P.Z. Hot air drying of yacon (Smallanthus sonchifolius) and its effect on sugar concentrations. Int. J. Food Sci. Technol. 2009, 44, 2169–2175. [Google Scholar] [CrossRef]
  14. Lai, Y.C.; Huang, C.L.; Chan, C.F.; Lien, C.Y.; Liao, W.C. Studies of sugar composition and starch morphology of baked sweet potatoes (Ipomoea batatas (L.) Lam). J. Food Sci. Technol. 2013, 50, 1193–1199. [Google Scholar] [CrossRef] [Green Version]
  15. Maieves, H.A.; De Oliveira, D.C.; Bernardo, C.; Müller, C.M.D.O.; Amante, E.R. Microscopy and texture of raw and cooked cassava (manihot esculenta crantz) roots. J. Texture Stud. 2012, 43, 164–173. [Google Scholar] [CrossRef]
  16. Freitas, J.B.; Naves, M.M.V. Chemical composition of nuts and edible seeds and their relation to nutrition and health. Rev. Nutr. 2010, 23, 269–279. [Google Scholar] [CrossRef]
  17. Ros, E. Health benefits of nut consumption. Nutrients 2010, 2, 652–682. [Google Scholar] [CrossRef] [PubMed] [Green Version]
  18. Alegría-Torán, A.; Farré, R. Horchata y salud. Aspectos nutricionales y dietéticos. Jornada chufa y horchata. In Fundación Valenciana de Estudios Avanzados; Generalitat Valenciana, Consejería de Agricultura, Pesca y Alimentación: Valencia, Spain, 2003; pp. 55–77. [Google Scholar]
  19. Roselló-Soto, E.; Garcia, C.; Fessard, A.; Barba, F.; Munekata, P.; Lorenzo, J.; Remize, F. Nutritional and Microbiological Quality of Tiger Nut Tubers (Cyperus esculentus), Derived Plant-Based and Lactic Fermented Beverages. Fermentation 2018, 5, 3. [Google Scholar] [CrossRef] [Green Version]
  20. Martín-Esparza, E.; González-Martínez, C. Integrating Food Science and Engineering Knowledge Into the Food Chain. Functional Properties of Traditional Foods; Ötles, K.K., Ed.; Springer US: Reykjavík, Iceland, 2016; pp. 371–375. ISBN 978-1-4899-7660-4. [Google Scholar]
  21. Consejo Regulador Denominación de Origen de Chufa de Valencia. Available online: http://www.chufadevalencia.org/ (accessed on 11 November 2019).
  22. Roselló-Soto, E.; Poojary, M.M.; Barba, F.J.; Lorenzo, J.M.; Mañes, J.; Moltó, J.C. Tiger nut and its by-products valorization: From extraction of oil and valuable compounds to development of new healthy products. Innov. Food Sci. Emerg. Technol. 2018, 45, 306–312. [Google Scholar] [CrossRef]
  23. Roselló-Soto, E.; Barba, F.J.; Putnik, P.; Kovačević, D.B.; Lorenzo, J.M.; Cantavella-Ferrero, Y. Enhancing bioactive antioxidants’ extraction from “horchata de chufa” by-products. Foods 2018, 7, 161. [Google Scholar] [CrossRef] [PubMed] [Green Version]
  24. Sánchez-Zapata, E.; Fernández-López, J.; Angel Pérez-Alvarez, J. Tiger Nut (Cyperus esculentus) Commercialization: Health Aspects, Composition, Properties, and Food Applications. Compr. Rev. Food Sci. Food Saf. 2012, 11, 366–377. [Google Scholar] [CrossRef]
  25. Sánchez-Zapata, E.; Fernández-López, J.; Pérez-Alvarez, J.A.; Soares, J.; Sousa, S.; Gomes, A.M.P.; Pintado, M.M.E. In vitro evaluation of “horchata” co-products as carbon source for probiotic bacteria growth. Food Bioprod. Process. 2013, 91, 279–286. [Google Scholar] [CrossRef]
  26. Aguilar, N.; Albanell, E.; Miñarro, B.; Guamis, B.; Capellas, M. Effect of tiger nut-derived products in gluten-free batter and bread. Food Sci. Technol. Int. 2015, 21, 323–331. [Google Scholar] [CrossRef]
  27. Sánchez-Zapata, E.; Muñoz, C.M.; Fuentes, E.; Fernández-López, J.; Sendra, E.; Sayas, E.; Navarro, C.; Pérez-Alvarez, J.A. Effect of tiger nut fibre on quality characteristics of pork burger. Meat Sci. 2010, 85, 70–76. [Google Scholar] [CrossRef] [PubMed]
  28. Bobreneva, I.V.; Baioumy, A.A. Effect of using tiger nuts (Cyperus esculentus) on nutritional and organoleptic characteristics of beef burger. Biosci. Res. 2018, 15, 1424–1432. [Google Scholar]
  29. Sánchez-Zapata, E.; Zunino, V.; Pérez-Alvarez, J.A.; Fernández-López, J. Effect of tiger nut fibre addition on the quality and safety of a dry-cured pork sausage (“Chorizo”) during the dry-curing process. Meat Sci. 2013, 95, 562–568. [Google Scholar] [CrossRef] [PubMed]
  30. Ferreira, S.L.C.; Bruns, R.E.; Ferreira, H.S.; Matos, G.D.; David, J.M.; Brandão, G.C.; da Silva, E.G.P.; Portugal, L.A.; dos Reis, P.S.; Souza, A.S.; et al. Box-Behnken design: An alternative for the optimization of analytical methods. Anal. Chim. Acta 2007, 597, 179–186. [Google Scholar] [CrossRef] [PubMed]
  31. European Communities. First Commission Directive of July 26, 1979. Laying down Community Methods of Analysis for Testing Certain Sugars Intended for Human Consumption; European Commission: Brussels, Belgium, 1979; Volume 2, pp. 24–52. [Google Scholar]
  32. Skurikhin, I.M. New metrological characteristics of analytical methods of analysis used for safety control of food and environmental materials. J. AOAC Intl. 1993, 76, 262–267. [Google Scholar] [CrossRef]
  33. Kjeldahl, J. A New Method for the Determination of Nitrogen in Organic Matter. Z. Anal. Chem. 1883, 22, 366–382. [Google Scholar] [CrossRef] [Green Version]
  34. Kirk, P.L. Kjeldahl Method for Total Nitrogen. Anal. Chem. 1950, 22, 354–358. [Google Scholar] [CrossRef]
  35. Helrich, K. Method 963.15. In AOAC Official Methods of Analysis; Association of Official Anlytical Chemists, Ed.; AOAC: Arlington, VA, USA, 1990; pp. 79–80. ISBN 0-935584-42-0. [Google Scholar]
  36. ICC method 104/1. Standard Methods of the International Association for Cereal Science and Technology; International Association for Cereal Science and Technology Press: Vienna, Austria, 1995. [Google Scholar]
  37. Wang, J.; Zhao, L.-L.; Sun, G.-X.; Liang, Y.; Wu, F.-A.; Chen, Z.; Cui, S. A comparison of acidic and enzymatic hydrolysis of rutin. AFRICAN J. Biotechnol. 2011, 10, 1460–1466. [Google Scholar]
  38. Khawla, B.J.; Sameh, M.; Imen, G.; Donyes, F.; Dhouha, G.; Raoudha, E.G.; Oumèma, N.E. Potato peel as feedstock for bioethanol production: A comparison of acidic and enzymatic hydrolysis. Ind. Crops Prod. 2014, 52, 144–149. [Google Scholar] [CrossRef]
  39. Du, X.; Ou, C.; Qian, M. Comparison of mild enzymatic hydrolysis and acidic hydrolysis on monoterpenoic and norisoprenoidic glycoconjugates in Pinot noir grapes. Am. J. Enol. Vitic. 2008, 59, 332A. [Google Scholar]
  40. Englyst, H.N.; Trowell, H.; Southgate, D.; Cummings, J.H. Dietary Fiber and Resistant Starch. Am. J. Clin. Nutr. 1987, 46, 873–874. [Google Scholar] [CrossRef] [PubMed]
  41. Díaz-de-Cerio, E.; Tylewicz, U.; Verardo, V.; Fernández-Gutiérrez, A.; Segura-Carretero, A.; Romani, S. Design of Sonotrode Ultrasound-Assisted Extraction of Phenolic Compounds from Psidium guajava L. Leaves. Food Anal. Methods 2017, 10, 2781–2791. [Google Scholar] [CrossRef]
Figure 1. Response surface graphs (af) showing the combined effects of the process variables: H2SO4 concentration (N), temperature (°C), time (min) and ratio (H2SO4/sample).
Agronomy 10 00477 g001
Figure 2. Response surface graphs (af) showing the combined effects of the process variables: H3PO4 concentration (N), temperature (°C), time (min) and ratio (H3PO4/sample).
Agronomy 10 00477 g002
Table 1. Chemical composition tiger nut byproducts (g/100 g fresh weight).
ComponentPDO Tiger Nut By-Productn-PDO Tiger Nut By-Product
Moisture67.14 ± 0.1866.14 ± 0.10
Proteins1.17 ± 0.140.85 ± 0.12
Fat3.99 ± 0.357.41 ± 0.24
Ash0.36 ± 0.010.43 ± 0.01
Total carbohydrates27.34 ± 1.6725.17 ± 1.23
Reducing sugars0.25 ± 0.030.71 ± 0.02
PDO, n-PDO: protected designation of origin and non-protected designation of origin.
Table 2. Box–Behnken design with natural and coded values for chemical hydrolysis conditions with H2SO4 and experimental values of reducing sugars quantified by Schoorl method.
Independent FactorsReducing Sugars (g/100 g Dry Sample)Yield of Extraction (%)
X1sX2X3X4
12 (−1)40 (−1)105 (0)45 (0)0.540.67
212 (1)40 (−1)105 (0)45 (0)10.3112.95
32 (−1)90 (1)105 (0)45 (0)36.9046.36
412 (1)90 (1)105 (0)45 (0)23.8830.00
57 (0)65 (0)60 (−1)30 (−1)24.6030.90
67 (0)65 (0)150 (1)30 (−1)31.1139.08
77 (0)65 (0)60 (−1)60 (1)26.0532.73
87 (0)65 (0)150 (1)60 (1)34.0042.71
97 (0)65 (0)105 (0)45 (0)26.5933.40
102 (−1)65 (0)105 (0)30 (−1)7.249.10
1112 (1)65 (0)105 (0)30 (−1)27.4934.55
122 (−1)65 (0)105 (0)60 (1)9.4111.82
1312 (1)65 (0)105 (0)60 (1)34.7343.63
147 (0)40 (−1)60 (−1)45 (0)2.713.40
157 (0)90 (1)60 (−1)45 (0)36.9046.36
167 (0)40 (−1)150 (1)45 (0)4.886.13
177 (0)90 (1)150 (1)45 (0)35.8144.99
187 (0)65 (0)105 (0)45 (0)24.9631.36
192 (−1)65 (0)60 (−1)45 (0)7.058.86
2012 (1)65 (0)60 (−1)45 (0)34.1942.95
212 (−1)65 (0)150 (1)45 (0)7.609.55
2212 (1)65 (0)150 (1)45 (0)34.1942.95
237 (0)40 (−1)105 (0)30 (−1)3.985.00
247 (0)90 (1)105 (0)30 (−1)34.0042.71
257 (0)40 (−1)105 (0)60 (1)2.893.63
267 (0)90 (1)105 (0)60 (1)37.6247.26
277 (0)65 (0)105 (0)45 (0)26.5933.40
X1s–4: H2SO4 concentration (N), Temperature (°C), time (min), H2SO4/sample ratio (mL/g).
Table 3. Box–Behnken design with natural and coded values for chemical hydrolysis conditions with H3PO4 and experimental values of reducing sugars quantified by Schoorl method.
Independent FactorsReducing Sugars (g/100 g Dry Sample)Yield of Extraction (%)
X1fX2X3X4
16 (−1)40 (−1)105 (0)45 (0)3.264.09
236 (1)40 (−1)105 (0)45 (0)0.811.02
36 (−1)90 (1)105 (0)45 (0)18.7123.51
436 (1)90 (1)105 (0)45 (0)8.1510.24
521 (0)65 (0)60 (−1)30 (−1)9.7812.29
621 (0)65 (0)150 (1)30 (−1)16.8121.12
721 (0)65 (0)60 (−1)60 (1)11.9616.40
821 (0)65 (0)150 (1)60 (1)13.0316.37
921 (0)65 (0)105 (0)45 (0)11.4114.33
106 (−1)65 (0)105 (0)30 (−1)3.264.10
1136 (1)65 (0)105 (0)30 (−1)5.977.50
126 (−1)65 (0)105 (0)60 (1)3.264.10
1336 (1)65 (0)105 (0)60 (1)9.7712.27
1421 (0)40 (−1)60 (−1)45 (0)3.254.08
1521 (0)90 (1)60 (−1)45 (0)32.5340.87
1621 (0)40 (−1)150 (1)45 (0)4.906.16
1721 (0)90 (1)150 (1)45 (0)38.3448.17
1821 (0)65 (0)105 (0)45 (0)10.6013.32
196 (−1)65 (0)60 (−1)45 (0)2.453.08
2036 (1)65 (0)60 (−1)45 (0)4.115.16
216 (−1)65 (0)150 (1)45 (0)4.075.11
2236 (1)65 (0)150 (1)45 (0)4.075.11
2321 (0)40 (−1)105 (0)30 (−1)4.345.45
2421 (0)90 (1)105 (0)30 (−1)32.6240.98
2521 (0)40 (−1)105 (0)60 (1)3.274.11
2621 (0)90 (1)105 (0)60 (1)37.1046.60
2721 (0)65 (0)105 (0)45 (0)12.2415.38
X1f–4: H3PO4 concentration (N), Temperature (°C), time (min), H3PO4/sample ratio (mL/g).
Table 4. Estimated regression coefficients of the adjusted second-order polynomial equation of sulfuric acid model.
Regression CoefficientsResponse
EffectStandard Deviationt Valuep Value
β0 *21.24310.478644.38980.00051
Lineal
β1 *9.22480.93999.81500.01022
β2 *27.55370.939929.31660.00116
β3−1.86910.9399−1.98870.18506
β4 **3.25580.93993.46410.07418
Crossed
β12 *−11.39530.9399−12.12440.00673
β13−0.27130.9399−0.28870.80000
β142.53230.93992.69430.11456
β23−1.62790.9399−1.73210.22540
β242.35140.93992.50190.12946
β340.72350.93990.76980.52191
Quadratic
β11 **2.45690.67823.62220.06848
β22 *2.93930.58085.06020.03690
β33 **−2.06500.5808−3.55510.07082
β44−1.22090.4891−2.49620.12994
*,**: Significant <0.05 and <0.1.
Table 5. Estimated regression coefficients of the adjusted second-order polynomial equation of phosphoric acid model.
Regression CoefficientsResponse
EffectStandard Deviationt Valuep Value
β0 *9.96110.415323.98320.00173
Lineal
β1 *−5.31530.8157−6.51620.02275
β2 *18.15030.815722.25090.00201
β31.66240.81572.03800.17842
β4 **2.66460.81573.26660.08231
Crossed
β12 *−4.05520.8157−4.97130.03816
β13−0.83560.8157−1.02440.41337
β141.89510.81572.32330.14581
β232.08190.81572.55230.12530
β24 **2.77750.81573.4050610.07648
β34 **−2.97990.8157−3.65320.067439
Quadratic
β11 *11.04890.588718.76870.00283
β22 *−4.26020.5041−8.45080.01371
β330.59080.50411.17190.36193
β44−0.52840.4245−1.24480.33929
*,**: Significant <0.05 and <0.1.
Table 6. Variance analysis of the adjusted model made with sulfuric acid.
Sum of SquaresDegrees of FreedomSquare AverageF Valuep Value
Model (R2 = 0.9929)
Regression4572.061224190.5026215.65890.0046
Residual1.766720.8834
Lack of fit30.9270112.811631.82900.2633
Total4573.828026
R2: Coefficient of determination.
Table 7. Variance analysis of the adjusted model made with phosphoric acid.
Sum of SquaresDegrees of FreedomSquare AverageF Valuep Value
Model (R2 = 0.9822)
Regression3189.606324132.9003199.73500.0050
Residual1.330820.6654
Lack of fit57.9672134.45906.70140.1372
Total3190.937026
R2: Coefficient of determination.
Table 8. Comparison between predicted and experimental value obtained with the optimum conditions of 85 °C, 60 min and 60 mL/g ratio with H2SO4 2 N and 90 °C, 60 min and 60 mL/g ratio with H3PO4 21 N in PDO tiger nut byproduct (g/100 g of tiger nut byproduct dry weight).
H2SO4 ModelH3PO4 Model
Predicted value39.80 ± 6.5136.82 ± 4.7
Experimental value45.39 ± 0.4141.11 ± 0.47
Table 9. Sugars content in the hydrolyzed tiger nut byproducts (g/100 g of tiger nut byproduct dry weight) by the optimal sulfuric acid conditions (H2SO4 2 N, 85 °C, 60 min and ratio 60).
SampleGlucoseXyloseTotal
PDO tiger nut byproduct24.59 ± 0.0420.07 ± 0.5744.66 ± 0.54
n-PDO tiger nut byproduct22.15 ± 0.9219.34 ± 0.6641.49 ± 0.26
PDO, n-PDO: Protected designation of origin and Non-protected designation of origin.

