On the Spatial Dimension of the Circular Economy


1
Center for Industrial Ecology, Yale University, New Haven, CT 06511, USA
2
Department of Industrial Chemistry “Toso Montanari”, Alma Mater Studiorum-University of Bologna, Bologna 40136, Italy
*
Author to whom correspondence should be addressed.
Resources 2019, 8(1), 32; https://doi.org/10.3390/resources8010032
Submission received: 14 December 2018
/
Revised: 22 January 2019
/
Accepted: 29 January 2019
/
Published: 2 February 2019
(This article belongs to the Special Issue Responsible Sourcing of Materials Required for a Resource Efficient and Low-carbon Society)
Abstract
:The concept of a “circular economy”, in which material in society is regarded as “a transient phase in anthropogenic resource utilization”, is a growing topic for discussion. The primary motivations for supporting a circular economy include a reduction of environmental impacts and conservation of natural resources. Australia is a vivid example of a country whose large metal extraction capacity is not balanced as it has neither an extensive product manufacturing capability nor a large domestic market. Consequently, Australia must rely on the global resource network to achieve circularity and carbon neutrality. This work illustrates this situation with quantitative material flow cycles for Australian aluminum, nickel, copper, zinc, and stainless steel, and comments on the implications of the results for Australia and for circular economy prospects more generally.
Highlights
- Australia’s metal extraction rates are not balanced by the domestic use of those metals;
- Most domestic metal use in Australia is enabled by imports;
- Australia is far from being a circular economy for metals;
- The circular economy can only be realized at the global level.
1. Introduction
The concept of a “circular economy”, in which material in society is regarded as a transient phase in anthropogenic resource utilization, was first formally proposed in 1990 [1] and has come to be regarded in some countries and regions as a politically attractive alternative to the traditional “linear economy” [2,3,4]. Despite the fact that such a process is, strictly speaking, a violation of the Second Law of Thermodynamics [5], a strong approach to a circular economy may be regarded as a significant improvement over present day practices [6]. The systems perspective of the circular economy implies a preference for repair, reuse, remanufacture, and recycling as strategies to maintain products in service. If this is not possible, the preference is to recycle the product efficiently, rather than dump it as refuse.
Which “economy” does one have in mind when speaking of the circular economy? In fact, is the word economy that is appropriate in this context, given that in a modern economic system each transaction must make sense economically [7,8]? The circular economy approach thus far is clearly focused on materials, and the implication is that it is appropriate to consider it on a regional scale [4,6]—this is probably because Europe is the geographical location of those who have been active in pursuing the concept. It has been observed that it is economically impractical to imagine that a circular economy system could exist within arbitrary geographical borders [9,10] due to globalized systems of production and consumption. Such a system would require each constituency (country, region, etc.) to maintain a complete sequence of industrial capacity for the processing of a full spectrum of materials through every stage of their life cycles [11]. No country or region anywhere in the world meets or could meet that criterion, which requires suitable domestic resources throughout the periodic table, a full manufacturing capability across all aspects of modern technology, and a comprehensive recovery, refurbishment, reuse, and recycling program.
If one grants that the circular economy concept is appealing but challenging, how can a more structured assessment of its potential be achieved? As with many discussions, quantitative information is a useful guide to a more informed perspective, notably for minerals and metals where supply is often concentrated but demand is fragmented and difficult to track. In this regard, national-level life cycles of five materials (four metals and one alloy) are herein presented for Australia, a country with extensive and intensive mining activity, but one that utilizes resources at a very modest level by comparison [12]. This work complements related research in which the criticality of the metals is evaluated [13] and scenarios of feasible future supply and demand of the metals are explored (forthcoming). First, we summarize comments on the circular society potential for each of the cycles and on the environmental implications of the country profile. Then, we explore Australia’s options for achieving or approaching a circular society for those materials and reflect on the political and societal aspects of those options. Finally, we outline comments on what these results have to say about the potential for global realization of the circular economy concept.
2. Methodology
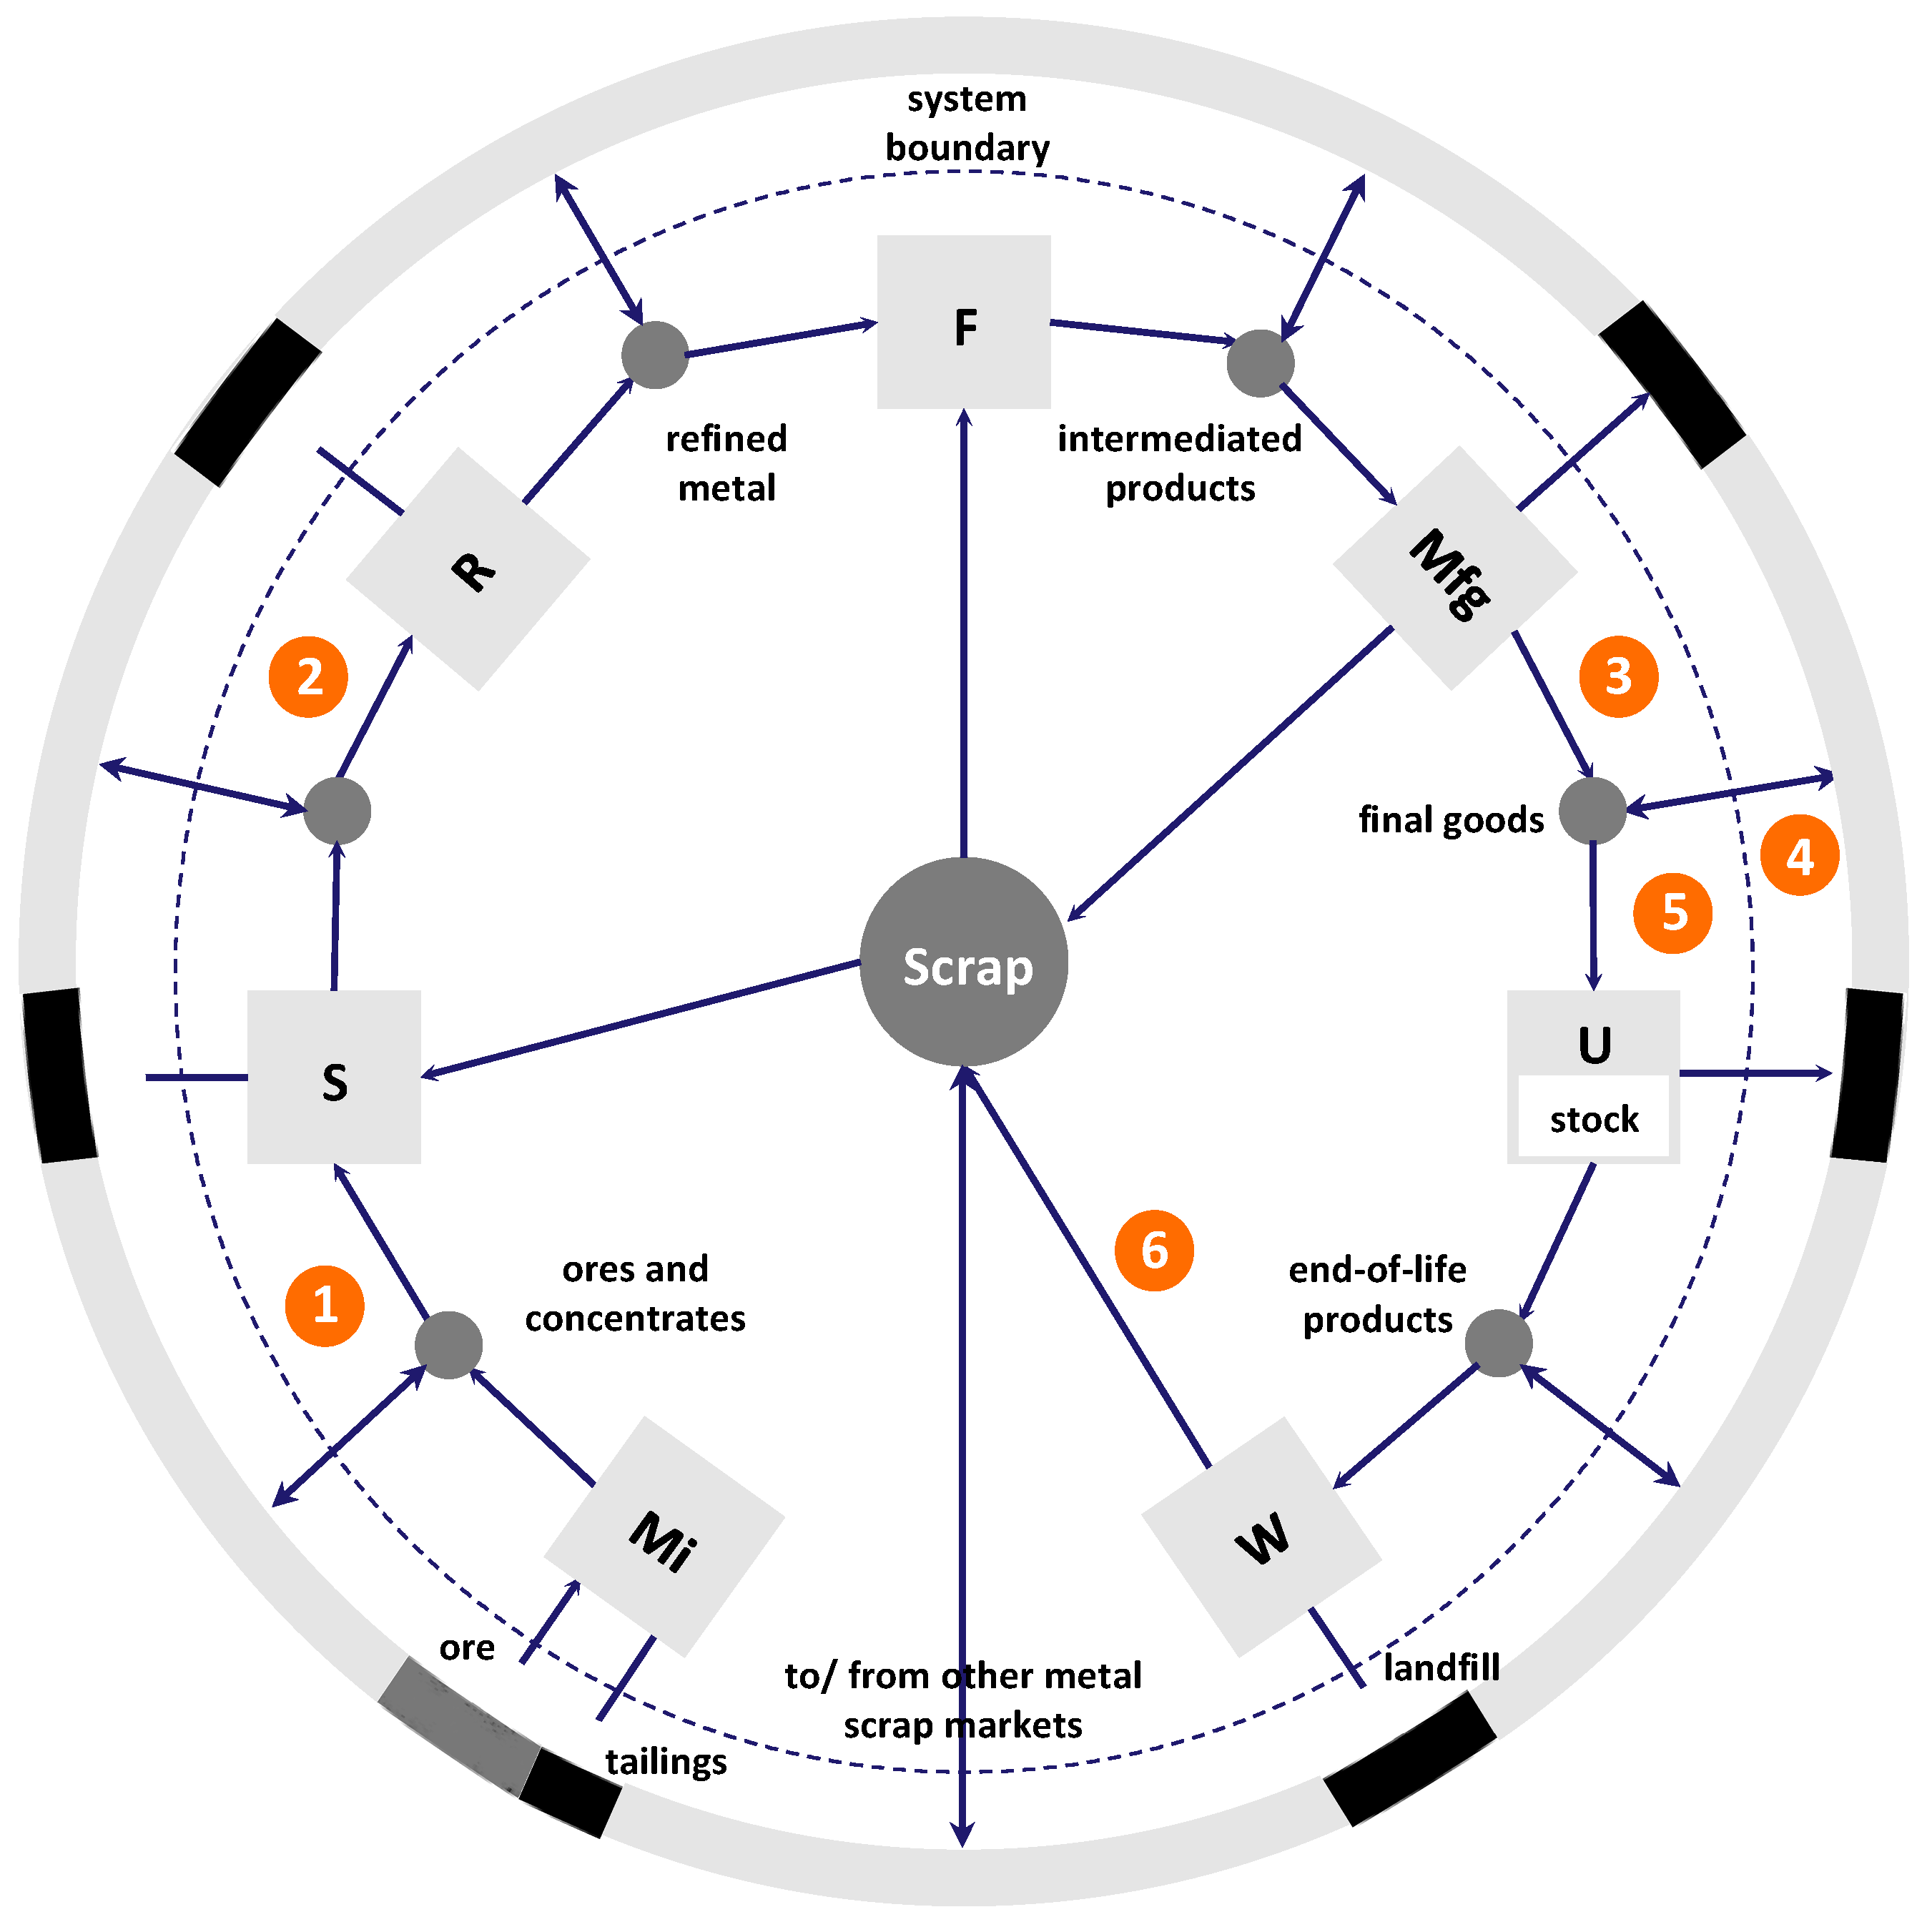
A generic diagram for the material life cycle of a metal is shown in Figure 1. The virgin metal enters the cycle at the lower left, moves from one life cycle stage to the next around the circle, ends the life cycle at the bottom right, and, if circularity is to be achieved, returns to the center of the circle and subsequently reenters the cycle to undergo a subsequent use.
Several circled numbers representing metal flows were added to the Figure 1 generic cycle in order to discuss the potential for country-level circularity. Flow 1 represents the flow of metal concentrate, which results from a comminution process that crushes metal-containing ore and performs a rough separation of minerals from gangue by froth flotation (concentrate is the form of a mine’s output most often imported or exported). Flow 2 represents the flow of impure metal, from which the anions present in the minerals have been largely extracted in the smelting process, followed by refining the metal to purity, fabricating semi-products (sheets, rod, etc.), and product manufacturing. Flow 3 is the outflow of the target metal in domestically manufactured products. This can be added to or subtracted from flow 4, the amount of the target metal in imported or exported products. Flows 3 and 4 combine to provide the magnitude of flow 5, the amount of the target metal flowing into domestic use. Flow 6 is the domestic recycled flow fed back into the domestic material flow cycle; as Birat [14] notes, it is an extremely challenging step for many metals. However, for a system to completely satisfy circularity for a target metal, flow 6 must be equal to flow 5.
Material flow cycles for selected metals in Australia are constructed upon data generated for this project or as part of more comprehensive projects published previously. The goal for each of the five materials was to generate and/or evaluate sufficient data to construct a cycle on the model of Figure 1 for 2010, the reference year for data consistency across the targeted materials. Doing so required extensive acquisition and vetting of information across the entire metal life cycle from mining to product use to obsolescence to reuse. In the cases of aluminum, copper, nickel, and stainless steel, the analyses were carried out specifically for this project. For zinc, a recently published study provided a 2010 Australian cycle as part of a global zinc assessment [15]. For all metals other than zinc, details of data sources related to Australia and the ways in which material flows were characterized are provided in the Supplementary Information (Tables S1–S5).
The elemental information generated by means of material flow analysis (MFA) constituted the basis for computing the environmental implications associated with a metal value chain. The mining industry is very energy-intensive and, as such, is one of the largest industrial sectors contributing to global greenhouse gas (GHG) emissions [16]. Using gross energy requirements as a proxy for environmental impacts [17], in particular for energy-related GHG emissions, we computed first-order estimates of energy requirements per life cycle stage and for the share of the energy embodied in trade in Australia compared to metal production and consumption. Overall, our model determined the embodied energy in mining, beneficiation, smelting, and refining, prorated for primary and secondary metal inputs. For the fabrication and manufacturing stages, global averages for cradle-to-gate data were used, assuming that the energy required for further processing is negligible compared to that of earlier life cycle stages. Life cycle inventory (LCI) databases and literature were used in combination, as described in the Supplementary Information.
3. Results
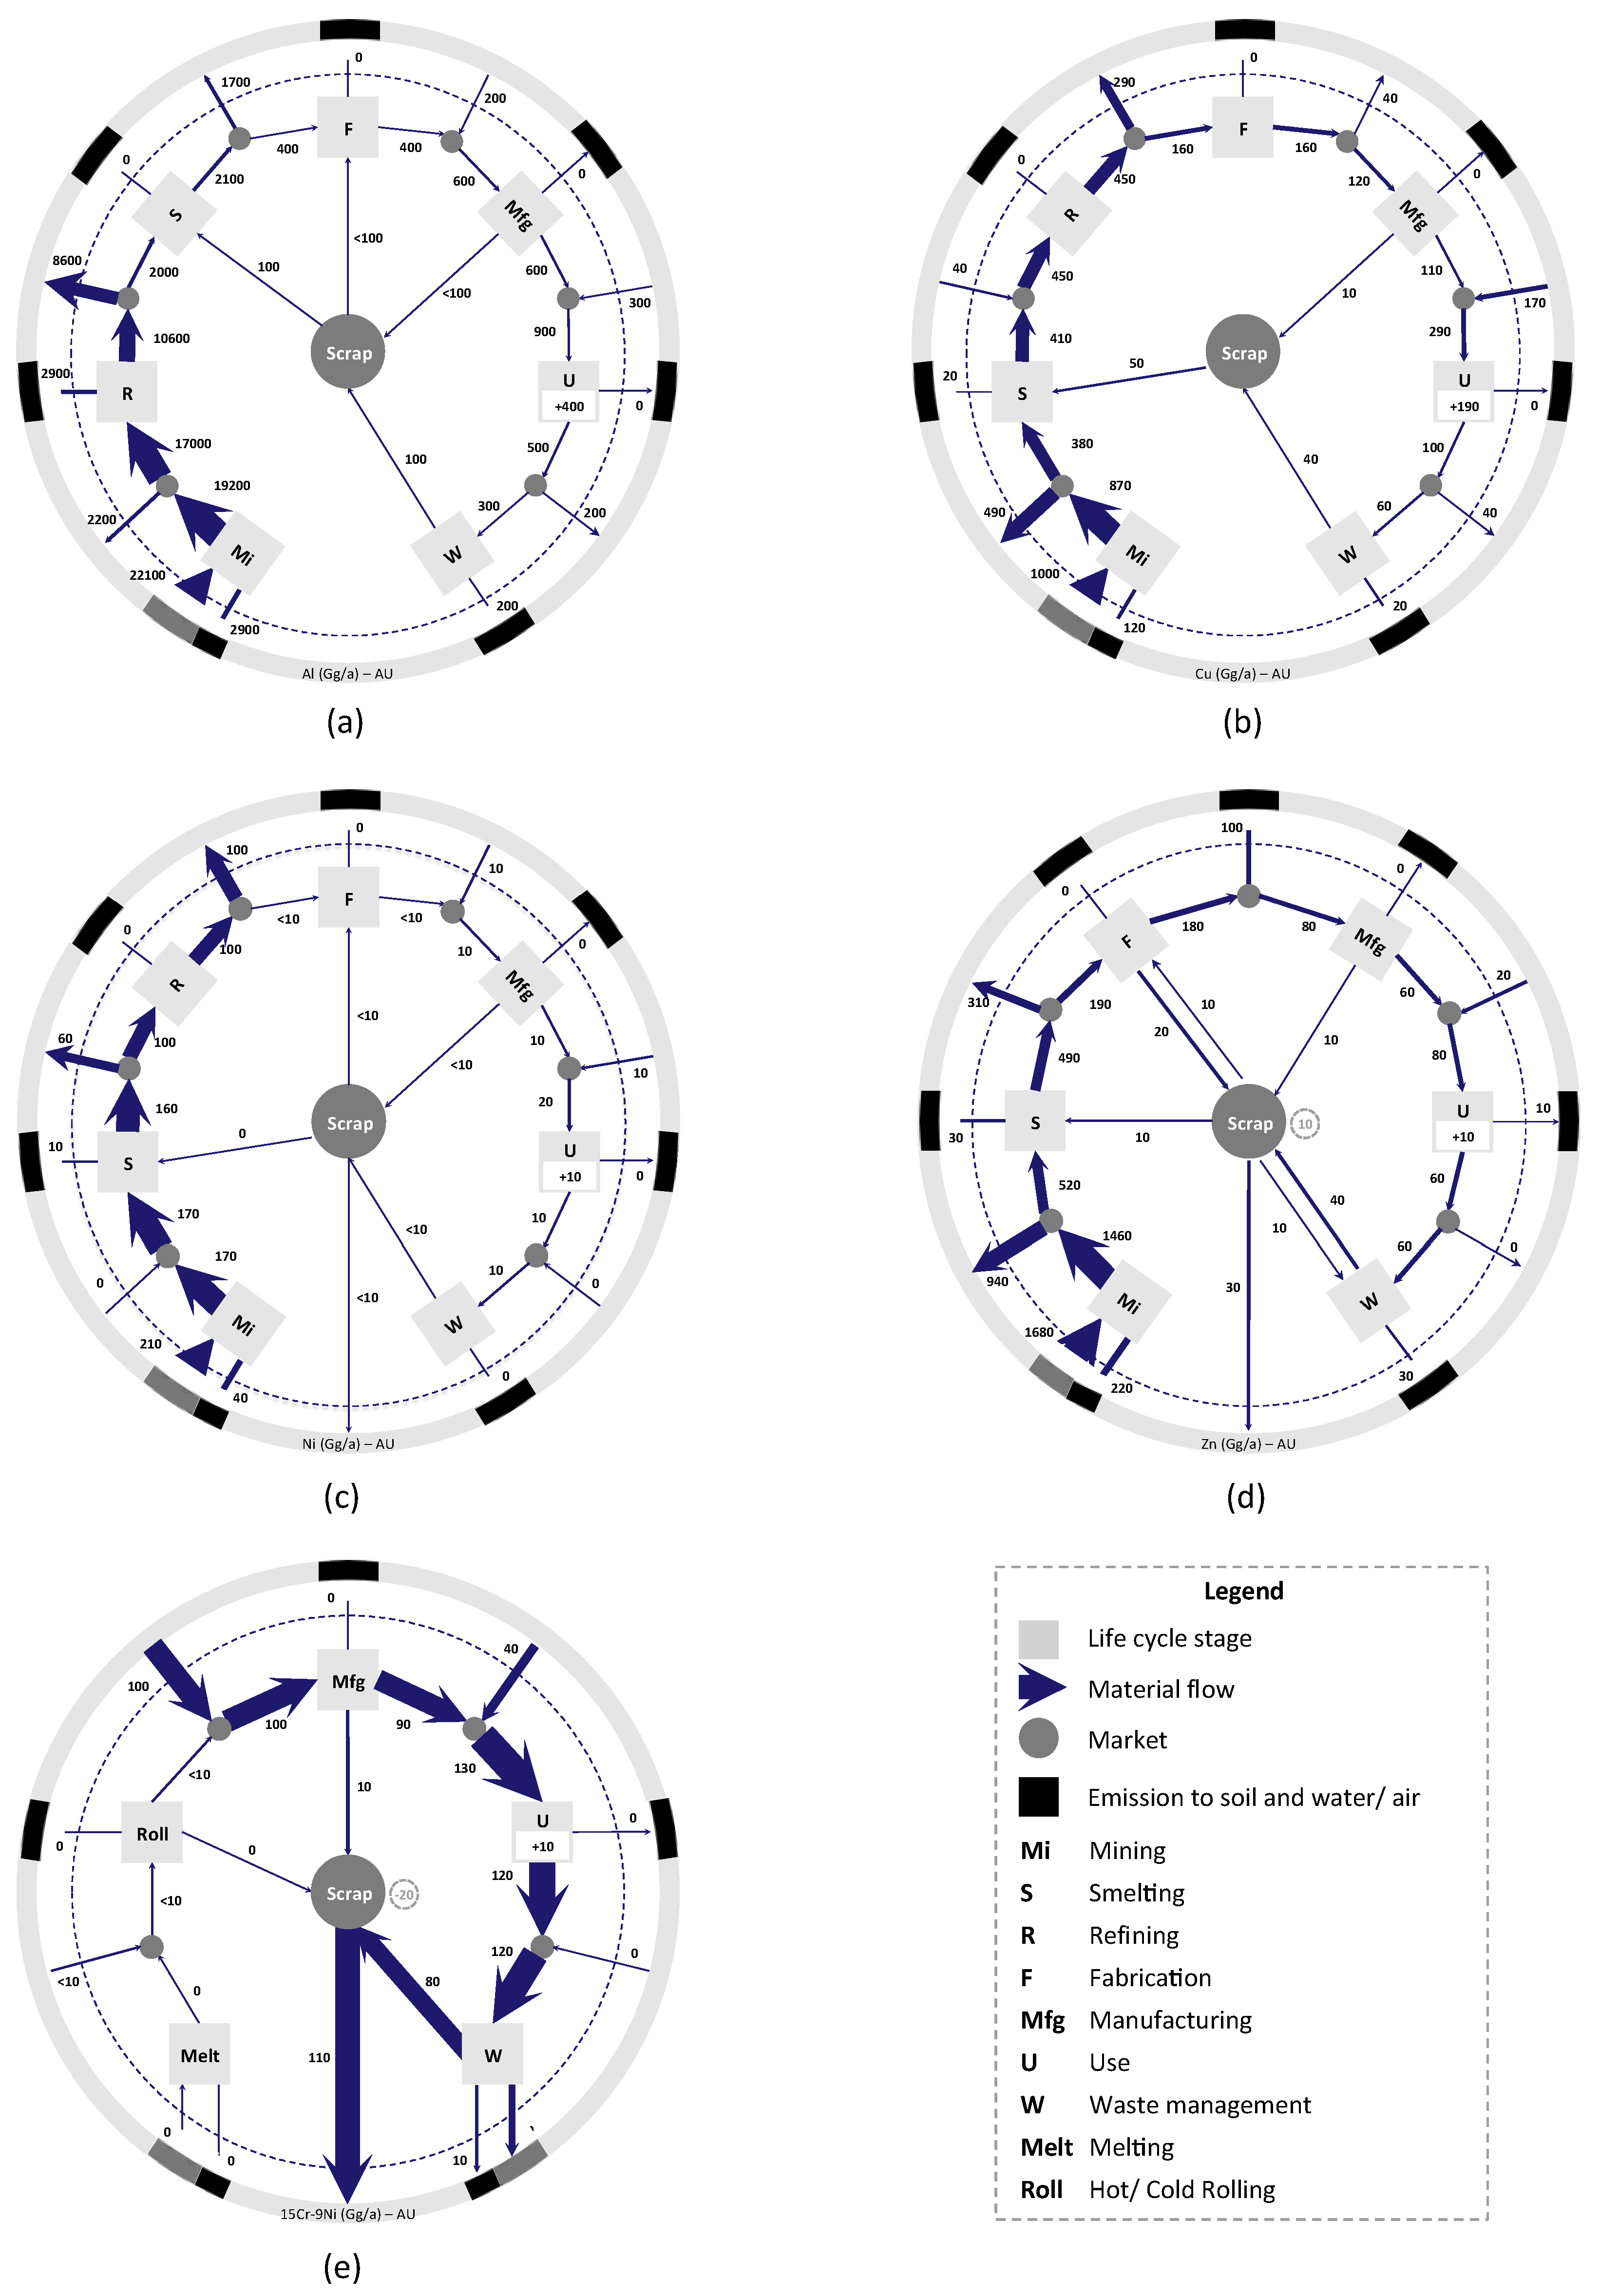
As a first example of our results, Figure 2a presents the Australian material flow cycle for aluminum in 2010. Australia is one of the world’s major producers of bauxite and alumina; in 2010, 22,100 Gg Al were extracted in the country from virgin ores. Of that amount, about 2200 Gg were net-exported after mining, 8600 Gg after refining, and 1700 Gg as unwrought aluminum forms. Less than 5% of aluminum originally mined in 2010 entered fabrication for the production of semi-finished goods through extrusion, rolling, foundry casting, and other fabrication processes. A total of 600 Gg of semi-finished goods were then processed into finished goods and, with the additional import of about 300 Gg, entered the use phase. Due to its relatively long in-use lifetime, aluminum embedded in principal end-use sectors such as building and construction and transportation accumulates as in-use stock (400 Gg in 2010). The largest amount of aluminum scrap generated annually derives from packaging and containers. Of the total amount of aluminum scrap (500 Gg), only a minor fraction was domestically processed for recycling, with about 200 Gg of aluminum scrap being exported mainly to China, and more than 200 Gg were disposed of in landfill. Aluminum scrap input to secondary smelting is estimated at about 100 Gg. Even with perfect recycling of secondary sources, achieving a circular economy for aluminum in Australia is inhibited by increasing metal demand and the time delay in scrap generation.
The Australian cycle for copper appears in Figure 2b. About 1000 Gg of copper was extracted and processed from Australian mines in 2010. Primary copper production amounted to 870 Gg, of which more than half was exported. Smelters processed 380 Gg of copper, as well as about 50 Gg of copper from secondary (recycled) sources. Total unrefined copper production was 410 Gg; this amount plus the addition of 40 Gg from net-import of copper anodes resulted in a total copper cathode production of about 450 Gg. More than 60% of the refined copper was exported, and the remaining fraction was processed to create semi-finished goods such as wires and rods, strips, sheets, castings, and tubes. Net-input of new scrap to fabrication was estimated at 10 Gg. Apparent consumption of wrought copper forms amounted to 120 Gg; this flow was processed through manufacturing processes and supplemented with 170 Gg Cu imported in finished goods. Major application sectors included building and construction, infrastructure, machinery and equipment, transportation, and consumer durables. Total copper entering use amounted to 290 Gg. The copper net addition to in-use stock was estimated at 190 Gg, which represents around two thirds of the total flow entering use. At end-of-life, 100 Gg of copper was discarded. Subtracting 40 Gg of copper in exported obsolete products, 60 Gg were processed through the national waste management system. Of that amount, about 20 Gg of copper were not recovered and lost from the cycle.
In Figure 2c we show the Australian nickel cycle. This cycle is quite similar to that of copper in Figure 2b, but shows even less manufacturing activity. In 2010, Australia extracted 210 Gg Ni domestically, of which 170 Gg went into the smelting process. About 60 Gg Ni were exported, while 100 Gg underwent domestic refining and then were almost entirely exported. What nickel is used in the economy is largely contained in products made outside Australia and imported. However, the level of nickel imports is small, and recycling is rather efficient. About 20 Gg Ni entered the use phase, 10 Gg net-accumulated in the anthropogenic reserve, while 10 Gg Ni were generated at end-of-life.
The Australian cycle for zinc appears in Figure 2d [15]. Australia is one of the world’s major zinc mining countries, extracting more than 2000 Gg (thousand metric tons) of zinc in 2010. Of that amount, some 1680 Gg were exported immediately after mining and another 310 Gg were exported after smelting. Australian fabrication and manufacturing processes employed less than 10% of that originally mined, and transferred most of that material into use. Because products remain in use for extended periods, discards from use do not balance the input flow, i.e., zinc stock contained in products grows over time. It is clear that even with perfect recycling (which is not occurring now), Australia cannot come close to achieving a circular economy for zinc if it must achieve that goal within its own borders.
The Australian stainless steel cycle for 2010 is given in Figure 2e. This cycle is not for a single metal but for an alloy, one with the approximate composition of 15Cr-9Ni. Australia is a producer of each of these alloy metals, but not of stainless steel itself. However, the country imports stainless steel at the manufacturing stage (100 Gg), and the products of that life stage provide most of the stainless steel for Australian use. Virtually all stainless steel scrap is exported, but need not be, because there is the potential for an Australian circular economy of stainless steel given the approximate balance between flows of stainless steel into and out of use.
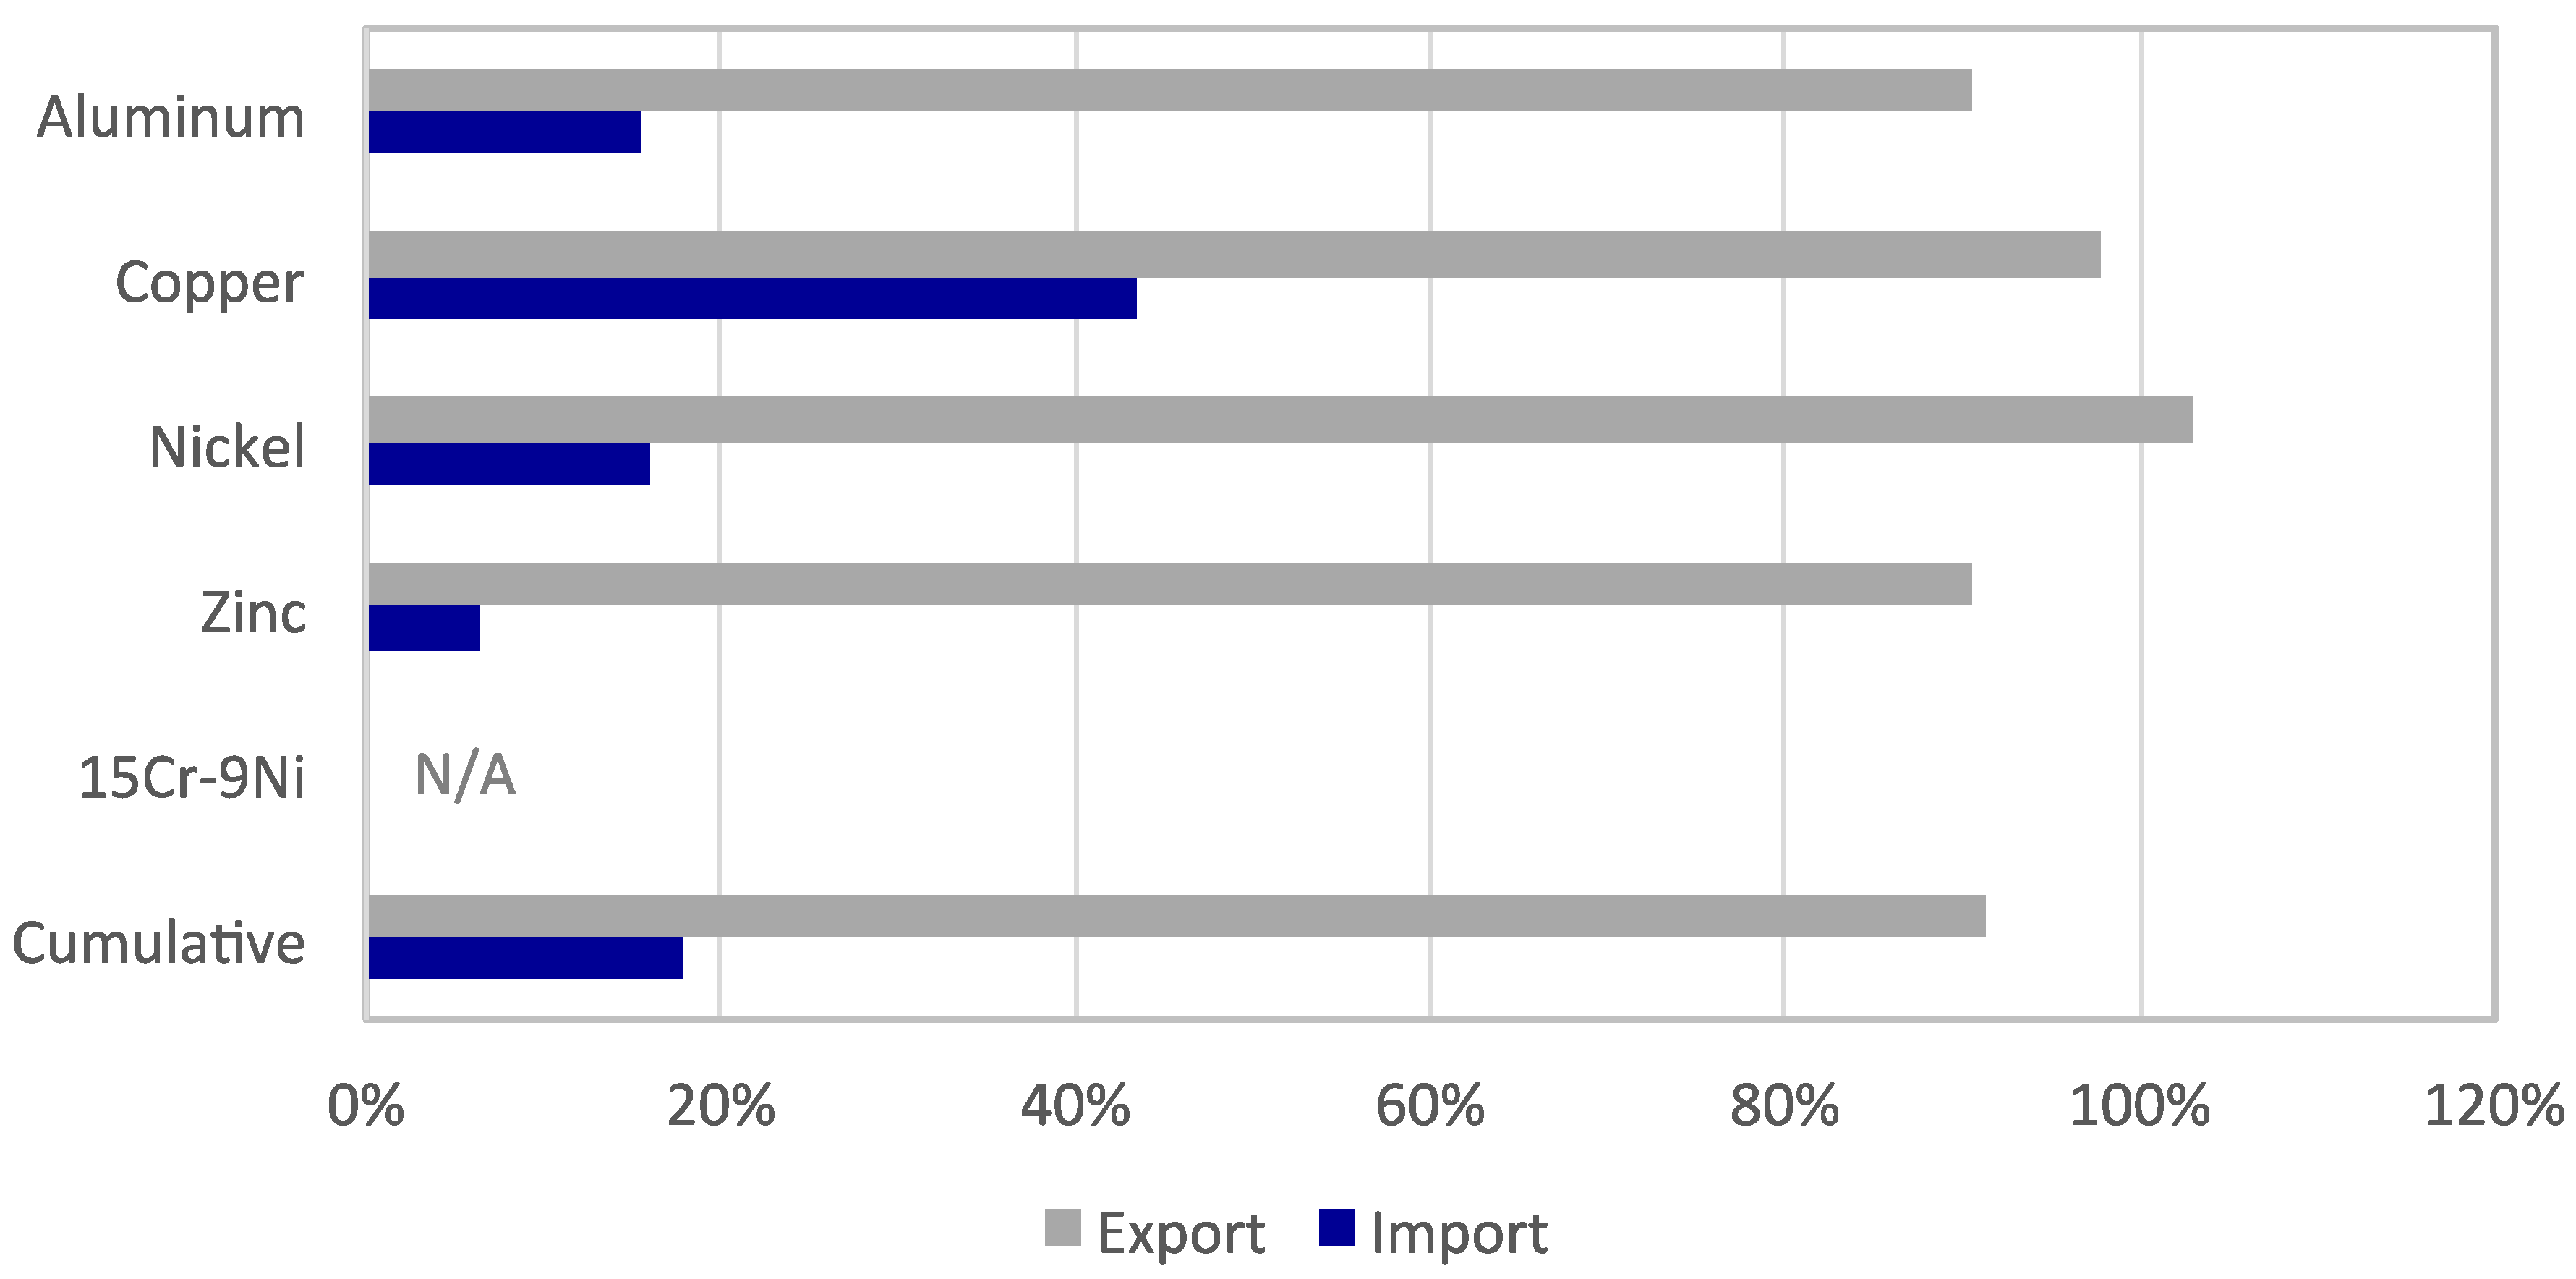
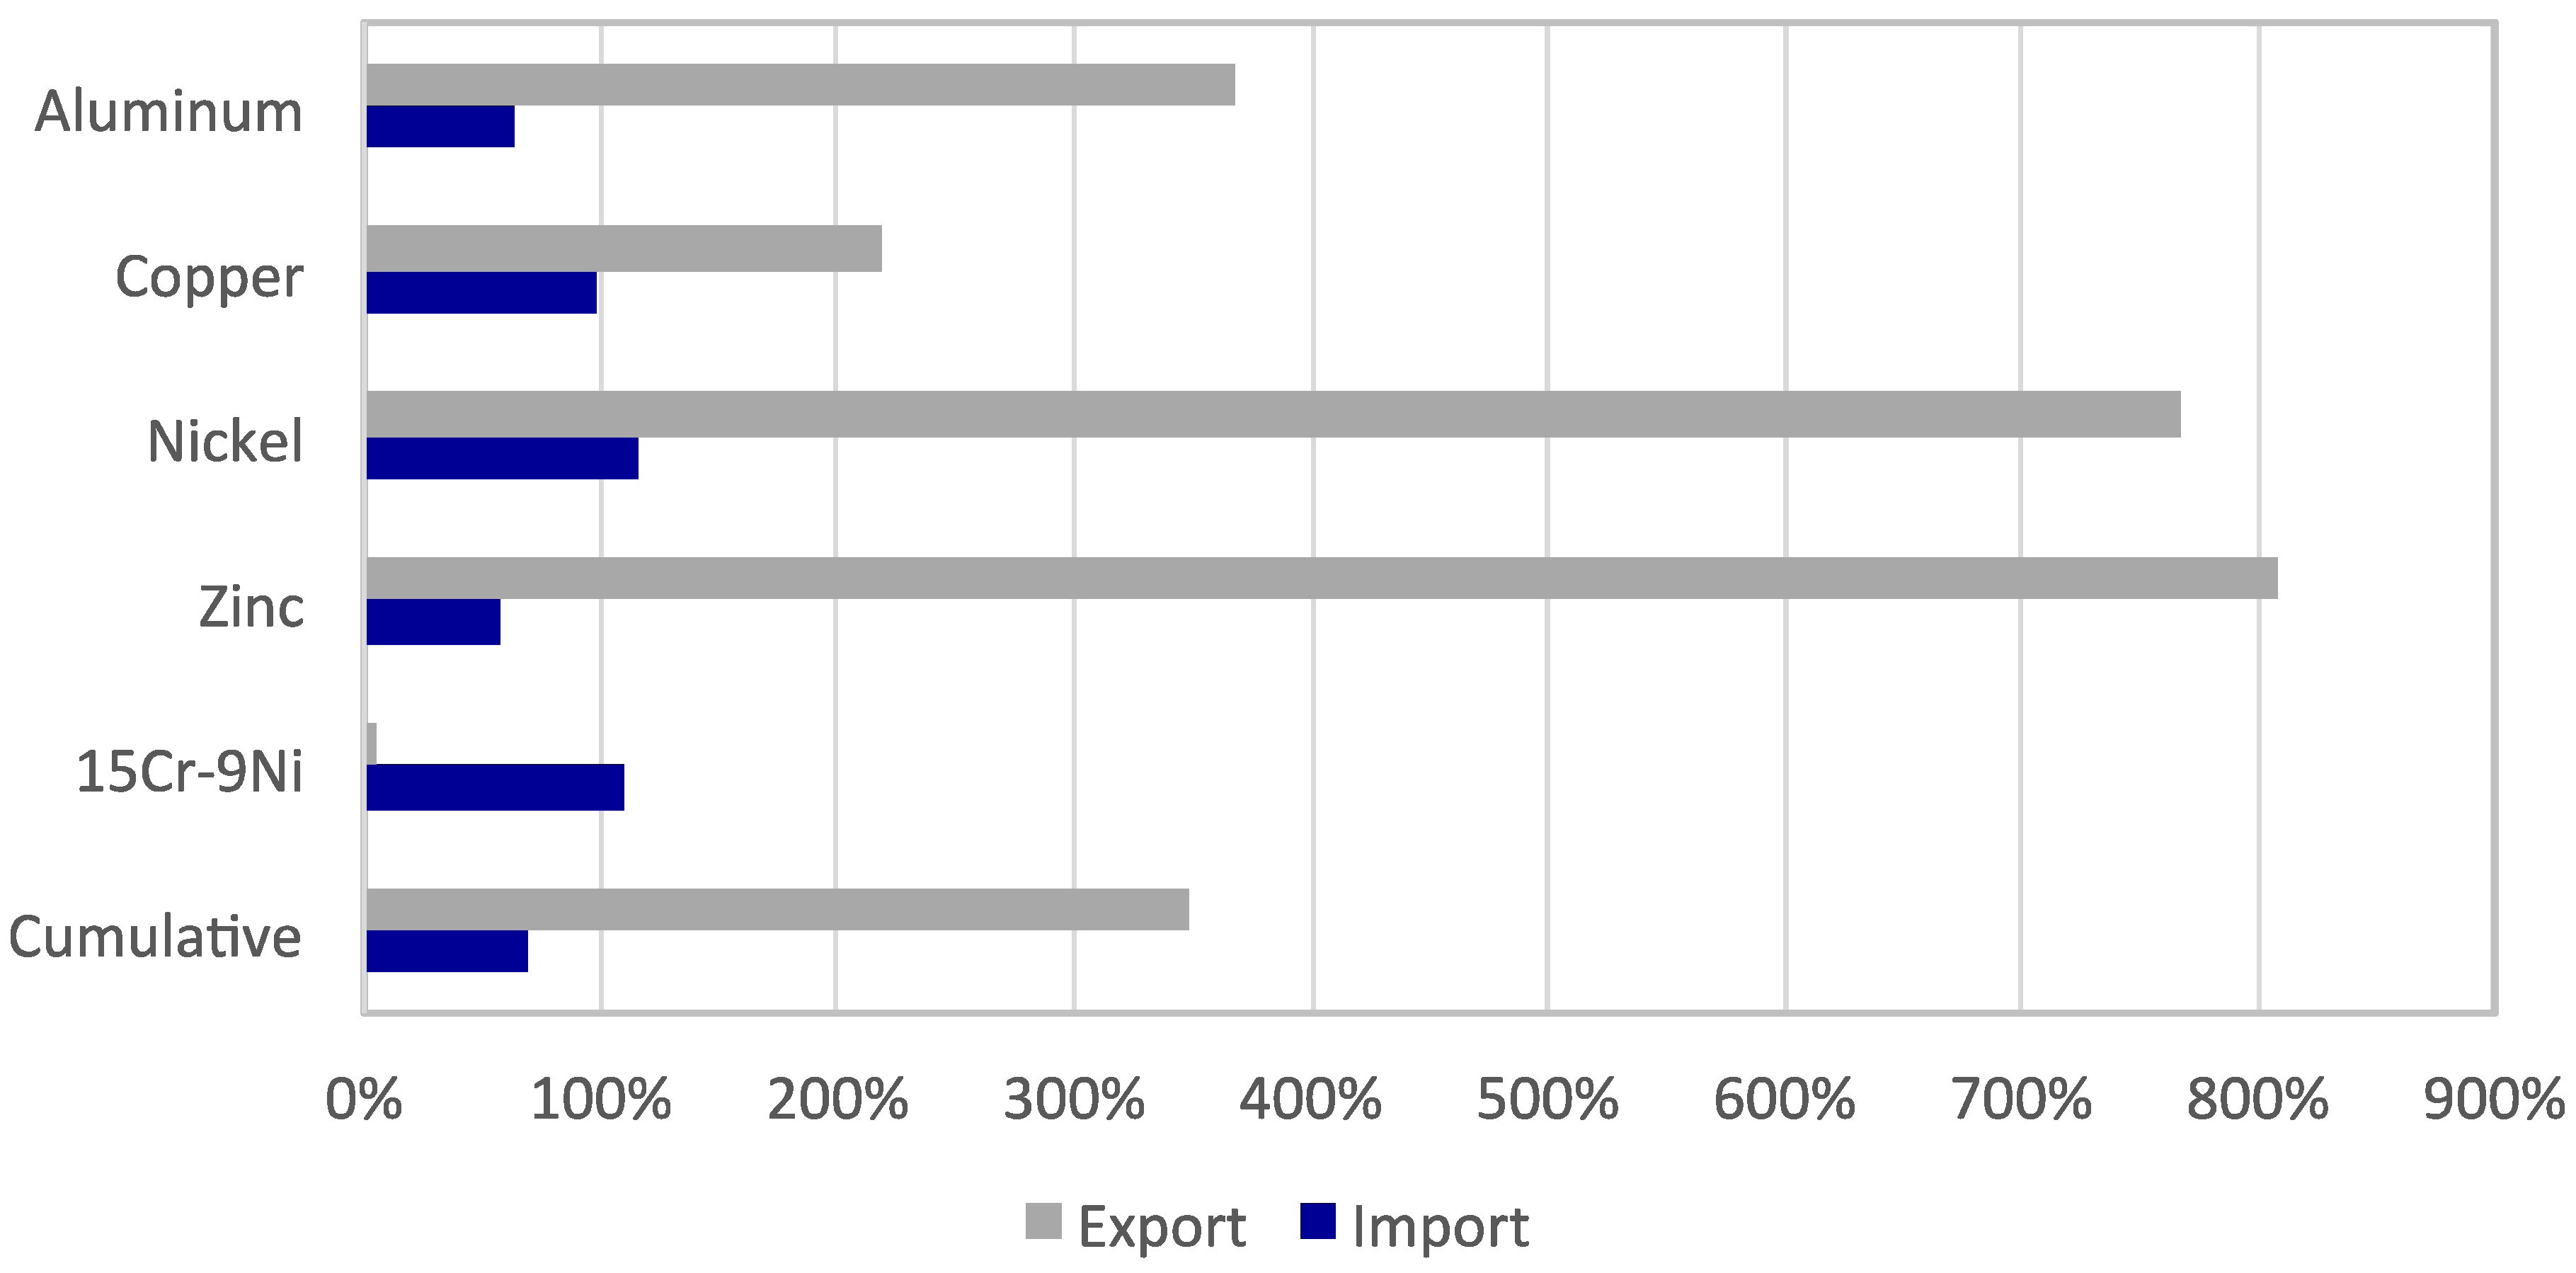
In Figure 3, the embodied energy in trade allocated to the targeted materials production is reported. Overall, greater embodied energy results in exports than imports for aluminum (90% and 15%, respectively), copper (96%, 43%), nickel (103%, 16%), and zinc (90%, 6%). In absolute terms, the cumulative results for the five materials follow those for aluminum, which is a main driver of energy embodied in trade for Australia due to the primary role of Australia in the global value chain of this metal and the relatively high energy requirements per unit of virgin aluminum processed. This trend becomes more evident if the embodied energy is compared to consumption (i.e., flow into use) rather than production (Figure 4). In this case, the energy embodied in exports of nickel and zinc is up to 8 times greater than that attributable to the amount of material consumed in Australia. For aluminum and copper, the energy embodied in exports is between 2 and 4 times that associated with the flow into use. For stainless steel 15Cr-9Ni, the entire flow into use in Australia is imported, with only a relatively small fraction of this alloy (5%) being exported in finished goods.
4. Discussion
Figure 2 makes it apparent that Australia is far from being a circular economy so far as metals and alloys are concerned. However, Lane [7] pointed out that the appropriate geographical scale for a circular economy is open to discussion. Within its national boundaries, Australia is active in the first stages of most metal life cycles, has a modest manufacturing capability, and possesses the potential for recovery and reuse at the end of product life [18]. That product life could be enhanced by designing for more efficient maintenance [19], refurbishment [20], remanufacture [21,22,23], and reuse, as well as cascading uses as an alternative to discard and improved separation [24]. Such actions would not help to circularize the Australian metals cycles, but would result in lowering the metal flow in imports to the use stage.
Australia has the potential for circular economy partnerships with countries around the world [25]. As pointed out above, however, each step of the process must make economic sense if it is to happen. Ultimately, increasing material circularity is one of the possible ways to improve the sustainability of resource use and to achieve the desired goal of extending the longevity of resources [26].
An innovative idea put forth by Giurco et al. [24] is that the rapid development of additive manufacturing may make it feasible for product manufacturing to be increasingly local—additive manufacturing could make it more efficient to produce new parts or products locally rather than to import them. The steps leading to additive manufacturing would be important to consider in this regard. To manufacture new products from discarded ones, the products would need to be disassembled in detail, the metal melted at perhaps 1000–1600 °C (depending on the metal), and the molten metal formed into powder by water or gas atomization [27] to enable additive manufacturing. This would add a step to the material’s reuse process, and thus would need to make technological, energetic, and economic sense, but it might move some of Australia’s metal cycles closer to circularization from a national perspective.
From the perspective of this paper, it is also of interest to ask “What is the prime motivating reason for supporting a more circular economy?” Among the possible answers to this question are (1) it will be economically beneficial, (2) it will minimize environmental impacts such as energy requirements and carbon emissions, and (3) it will conserve resources, especially scarce resources. Our discussion herein does not speak to the first of these, but it does address the last two. From that standpoint, an increasingly circular economy does indeed speak to resource conservation, but only if the scale of circularity is sufficiently broad.
The minimization of environmental impacts, supply risk, and vulnerability to supply restriction are features related to the global challenge of mitigating resource scarcity and are commonly covered in material criticality assessments [28]. The dynamic nature of criticality and its variance in space and among materials is influenced by geological, geopolitical, economic, social, technical, and regulatory factors [13]. For instance, Australia holds large deposits of major metals, but the global metal production network distributes material over a multi-tiered supply chain. While outsourcing and globalization may increase resilience to supply deficits, a diffuse and interlinked supply chain limits transparency and accountability, makes cascade-effects challenging to predict, and ultimately prevents the country from approaching or achieving material circularity [29].
This relationship and interdependence between organizations and the natural environment is a main source of complexity in the implementation of the circular economy [30]. Global awareness about the importance of integrating sustainability issues beyond the first-tier levels in supply chain management is increasing [31], but dispersed supply chains like those of minerals and metals are difficult to track within components and manufactured products originating from diverse sources [32].
As the metal cycles have demonstrated, Australia is a very significant supplier of primary resources to the rest of the world. This feature determines a shift between the location of metal production and that of use, which shapes national environmental profiles and may influence the perception of economic costs associated with global climate policy [33]. A considerable variation in energy requirements based on consumption (i.e., flow into use) rather than production introduces a geographical dimension in the environmental pressure of resource cycles and may reduce the net environmental benefits of recycling, ultimately undermining the potential to achieve carbon neutral economies.
At the national level, recovering an obsolete product containing, for instance, stainless steel (iron, chromium, and sometimes nickel and molybdenum) conserves the metals and/or alloys only if appropriate domestic processing technology exists. If it does not, the discarded material must be exported to an appropriate country or region where the technology resides, an action that might compromise both the environmental and economic aspects of resource recovery. The international trade of secondary materials and their recycling in countries with different CO2-eq emissions per unit of electrical energy generated and different process efficiencies compared to those of primary producer countries may cause leakages in carbon accounting [33]. This is not to say that a circular economy goal is undesirable, but rather that it must be carefully analyzed in all aspects to make sure that its intentions can in fact be realized. Further refinement of the role of institutions and international trade in the circular economy concept is hence needed to solve the dichotomy between global efforts of policies, legislation, and society against individual company efforts of profitability, competitiveness, and manufacturing capacity [28].
5. Conclusions
In this work, the Australia anthropogenic cycles of five materials (four metals and one alloy) were analyzed and utilized to provide novel insights into the circular society potential for each of the cycles and carbon neutral prospects in Australia. Considering the role of Australia in the early stages of metal supply chains, the elemental information provided in this work will contribute to an understanding of the modern metabolism of the targeted resources as well as inform criticality assessments and scenario analyses. Absolute amounts of resources in metallic equivalents per life cycle stage were combined with related life cycle inventory per unit of mass of resource to estimate the gross energy requirements allocated to production, trade, and consumption for Australia. While the material flow approach can be used to highlight the magnitude of carbon emissions embodied in international trade, production-based emissions inventories may be preferable for demonstrating implications to global climate policy. More integrative research in this direction can build upon the framework demonstrated herein.
To summarize, the results in this work have demonstrated that a circular materials economy is difficult to impossible to achieve at the level of a single country. Australia has been used as an example, but no country anywhere has a complete collection of the technologies that would be needed in order to achieve circularity. It is apparent that a circular economy must be conceived at the global level, and must be cognizant of the losses that are inevitable at every life stage. In addition, the material handling and ocean transport needed for circularity need to be weighed against the potential environmental impacts of such activities. The circular economy concept remains a promising goal, but one that should not be slavishly followed to the detriment of other environmental goals.
Supplementary Materials
The following are available online at https://www.mdpi.com/2079-9276/8/1/32/s1, Table S1: Energy requirement per unit of aluminum processed. Values in MJ/kg Al, Table S2: Energy requirement per unit of copper processed. Values in MJ/kg Cu, Table S3: Energy requirement per unit of nickel processed. Values in MJ/kg Ni, Table S4: Energy requirement per unit of zinc processed. Values in MJ/kg Zn, Table S5: Energy requirement per unit of stainless steel 15Cr-9Ni processed. Values in MJ/kg 15Cr-9Ni.
Author Contributions
Conceptualization, T.E.G.; Writing-Original Draft Preparation, T.E.G., B.K.R., and L.C.; Formal Analysis & Visualization, L.C. and B.K.R.; Writing-Review & Editing: L.C., T.E.G. and F.P.; Funding Acquisition, T.E.G. and B.K.R.
Funding
This research was funded by the “Wealth from Waste Cluster”, a research collaboration between the Australian Commonwealth Scientific and Industrial Research Organisation (CSIRO), University of Technology Sydney (UTS), The University of Queensland, Swinburne University of Technology, Monash University, and Yale University. We gratefully acknowledge the contribution of each partner and the CSIRO Flagship Collaboration Fund. The Wealth from Waste Cluster is part of the Minerals Resources Flagship and is supported by the Manufacturing Flagship.
Acknowledgements
We thank R. Lifset for helpful discussions, and the Wealth from Waste project of the Australian Commonwealth Science, Industry, and Research Organization for financial support.
Conflicts of Interest
The authors declare no conflict of interest. The founding sponsors had no role in the design of the study; in the collection, analyses, or interpolation of data; in the writing of the manuscript, and in the decision to publish the results.
References
- Pearce, D.W.; Turner, R.K. Economics of Natural Resources and the Environment; Harvester Wheatsheaf: London, UK, 1990. [Google Scholar]
- Morioka, T.; Tsunemi, K.; Yamamoto, Y.; Yabar, H.; Yoshida, N. Eco-efficiency of advanced loop closing systems for vehicles and household appliances in Hyogo Eco-town. J. Ind. Ecol. 2005, 9, 205–221. [Google Scholar] [CrossRef]
- Su, B.; Heshmati, Y.; Geng, Y.; Yu, X. A review of the circular economy in China: Moving from rhetoric to implementation. J. Clean. Prod. 2013, 42, 215–227. [Google Scholar] [CrossRef]
- European Commission. Towards a Circular Economy: A Zero Waste Programme for Europe; Report COM/2014/0398 final/2; European Commission: Brussels, Belgium, 2014. [Google Scholar]
- De Man, R.; Friege, H. Circular economy: European policy on shaky ground. Waste Manag. Res. 2016, 34, 93–95. [Google Scholar] [CrossRef] [PubMed] [Green Version]
- Ellen MacArthur Foundation. Towards the Circular Economy: Economic and Business Rationale for an Accelerated Transition; Ellen MacArthur Foundation: Cowes, UK, 2013. [Google Scholar]
- Lane, R. Understanding the dynamic character of value in recycling metals from Australia. Resources 2014, 3, 416–431. [Google Scholar] [CrossRef]
- Roos, G. Business model innovation to create and capture resource value in future circular material chains. Resources 2014, 3, 248–274. [Google Scholar] [CrossRef]
- Corder, G.D.; Golev, A.A.; Giurco, D. “Wealth from metal waste”: Translating global knowledge on industrial ecology to metals recycling in Australia. Miner. Eng. 2015, 76, 2–9. [Google Scholar] [CrossRef]
- Gregson, N.; Crang, M.; Fuller, S.; Holmes, H. Interrogating the circular economy: The moral economy of resource recovery in the EU. Econ. Soc. 2015, 44, 218–243. [Google Scholar] [CrossRef]
- Velis, C.A. Circular economy and global secondary material supply chains. Waste Manag. Res. 2015, 33, 389–391. [Google Scholar] [PubMed] [Green Version]
- Golev, A.; Corder, G. Modelling metal flows in the Australian economy. J. Clean. Prod. 2016, 112, 4296–4303. [Google Scholar] [CrossRef] [Green Version]
- Ciacci, L.; Nuss, P.; Reck, B.K.; Werner, T.T.; Graedel, T.E. Metal criticality determination for Australia, the US, and the planet—Comparing 2008 and 2012 results. Resources 2016, 5, 29. [Google Scholar] [CrossRef]
- Birat, J.-P. Life-cycle assessment, resource efficiency, and recycling. Metal. Res. Technol. 2015, 112, 24. [Google Scholar] [CrossRef]
- Meylan, G.; Reck, B.K. The anthropogenic cycle of zinc: Status quo and perspectives. Resour. Conserv. Recycl. 2016. [Google Scholar] [CrossRef]
- Elshkaki, A.; Graedel, T.E.; Ciacci, L.; Reck, B.K. Copper demand, supply, and associated energy use to 2050. Glob. Environ. Chang. 2016, 39, 305–315. [Google Scholar] [CrossRef]
- Nuss, P.; Eckelman, M.J. Life cycle assessment of metals: A scientific synthesis. PLoS ONE 2014, 9, e101298. [Google Scholar] [CrossRef] [PubMed]
- Florin, F.; Madden, B.; Sharpe, S.; Benn, S.; Agarwal, R.; Perey, R.; Giurco, D. Shifting Business Models for a Circular Economy: Metals Management for Multi-Product-Use Cycles; University of Technology Sydney: Sydney, Australia, 2015; ISBN 978-1-4863-0582-7. [Google Scholar]
- Mulder, W.; Basten, R.J.I.; Jauregui Becker, J.M.; Blok, J.; Hoekstra, S.; Kokkeler, F.G.M. Supporting industrial equipment development through a set of design-for-maintenance guidelines. In Proceedings of the International Design Conference—Design 2014, Dubrovnik, Croatia, 19–22 May 2014; pp. 323–332. [Google Scholar]
- Van Weelden, E.; Mugge, R.; Bakker, C. Paving the way towards circular consumption: Exploring consumer acceptance of refurbished mobile phones in the Dutch market. J. Clean. Prod. 2016, 113, 743–754. [Google Scholar] [CrossRef]
- Kerr, W.; Ryan, C. Eco-efficiency gains from remanufacturing: A case study of photocopier remanufacturing at Fuji Xerox, Australia. J. Clean. Prod. 2001, 9, 75–81. [Google Scholar] [CrossRef]
- Seitz, M.A. A critical assessment of motives for product recovery: The case of engine remanufacturing. J. Clean. Prod. 2007, 15, 1147–1157. [Google Scholar] [CrossRef]
- Diener, D.L.; Tillman, A.-M. Component end-of-life management: Exploring opportunities and related benefits of remanufacturing and functional recycling. Resour. Conserv. Recycl. 2015, 102, 80–93. [Google Scholar] [CrossRef]
- Giurco, D.; Littleboy, A.; Boyle, T.; Fyfe, J.; White, S. Circular economy: Questions for responsible minerals, additive manufacturing, and recycling of metals. Resources 2014, 3, 432–453. [Google Scholar] [CrossRef]
- Lyons, D.; Rice, M.; Wachal, R. Circuits of scrap: Closed loop industrial ecosystems and the geography of US international recyclable material flows 1995–2005. Geogr. J. 2009, 175, 286–300. [Google Scholar] [CrossRef]
- Franklin-Johnson, E.; Figge, F.; Canning, L. Resource duration as a managerial indicator for Circular Economy performance. J. Clean. Prod. 2016, 133, 589–598. [Google Scholar] [CrossRef]
- Pease, F.L., III; West, W.G. Fundamentals of Powder Metallurgy; Metal Powder Industries Federation: Princeton, NJ, USA, 2002; p. 452. [Google Scholar]
- Lieder, M.; Rashid, A. Towards circular economy implementation: A comprehensive review in context of manufacturing industry. J. Clean. Prod. 2016, 115, 36–51. [Google Scholar] [CrossRef]
- Ciacci, L.; Vassura, I.; Cao, Z.; Liu, G.; Passarini, F. Recovering the “new twin”: Analysis of secondary neodymium sources and recycling potentials in Europe. Resour. Conserv. Recycl. 2018, 142, 143–152. [Google Scholar] [CrossRef]
- Ghisellini, P.; Cialani, C.; Ulgiati, S. A review on circular economy: The expected transition to a balanced interplay of environmental and economic systems. J. Clean. Prod. 2016, 114, 11–32. [Google Scholar] [CrossRef]
- Tachizawa, E.M.; Wong, C.Y. Towards a theory of multitier sustainable supply chains: A systematic literature review. Supply Chain Manag. 2014, 19, 643–663. [Google Scholar] [CrossRef]
- Hofmann, H.; Schleper, M.C.; Blome, C. Conflict minerals and supply chain due diligence: An exploratory study of multi-tier supply chains. J. Bus. Ethics 2018, 147, 115–141. [Google Scholar] [CrossRef]
- Peters, G.P.; Hertwich, E.G. CO2 Embodied in international trade with implications for global climate policy. Environ. Sci. Technol. 2008, 42, 1401–1407. [Google Scholar] [CrossRef] [PubMed]
Figure 1.
The generic life cycle of a metal at the country level. The dots between the life cycle stages represent international markets through which resources can be imported or exported. In a “circular economy” model, most or all metal would move around the right side of the diagram and through the scrap market back into reuse, while the extraction of virgin resources would be diminished or eliminated. Mi—mining, S—smelting, R—refining, F—fabrication, Mfg—manufacturing, U—use, W—waste management. The circled numbers refer to the discussion in the text.

Figure 2.
The Australian cycle of aluminum (a, this work), copper (b, this work), nickel (c, this work), zinc (d, [15]), and stainless steel 15Cr-9Ni (e, this work). The units are Gigagrams (thousand metric tons) of metallic equivalent per year. The year of reference is 2010. Flows may not add up due to rounding.

Figure 3.
Energy embodied in trade as a fraction of metal production in Australia (%). N/A—Not applicable.
Figure 3.
Energy embodied in trade as a fraction of metal production in Australia (%). N/A—Not applicable.

Figure 4.
Energy embodied in trade as a fraction of metal consumption in Australia (%).

© 2019 by the authors. Licensee MDPI, Basel, Switzerland. This article is an open access article distributed under the terms and conditions of the Creative Commons Attribution (CC BY) license (http://creativecommons.org/licenses/by/4.0/).
Share and Cite
MDPI and ACS Style
Graedel, T.E.; Reck, B.K.; Ciacci, L.; Passarini, F. On the Spatial Dimension of the Circular Economy. Resources 2019, 8, 32. https://doi.org/10.3390/resources8010032
AMA Style
Graedel TE, Reck BK, Ciacci L, Passarini F. On the Spatial Dimension of the Circular Economy. Resources. 2019; 8(1):32. https://doi.org/10.3390/resources8010032
Chicago/Turabian StyleGraedel, T. E., Barbara K. Reck, Luca Ciacci, and Fabrizio Passarini. 2019. "On the Spatial Dimension of the Circular Economy" Resources 8, no. 1: 32. https://doi.org/10.3390/resources8010032
Note that from the first issue of 2016, this journal uses article numbers instead of page numbers. See further details here.