Comparing Electrical Energy Storage Technologies Regarding Their Material and Carbon Footprint


1
Center for Environmental Systems Research, University of Kassel, 34117 Kassel, Germany
2
Fraunhofer Institute for Energy Economics and Energy System Technology, 34119 Kassel, Germany
*
Author to whom correspondence should be addressed.
Energies 2018, 11(12), 3386; https://doi.org/10.3390/en11123386
Submission received: 2 November 2018
/
Revised: 16 November 2018
/
Accepted: 22 November 2018
/
Published: 3 December 2018
(This article belongs to the Section D: Energy Storage and Application)
Abstract
:The need for electrical energy storage technologies (EEST) in a future energy system, based on volatile renewable energy sources is widely accepted. The still open question is which technology should be used, in particular in such applications where the implementation of different storage technologies would be possible. In this study, eight different EEST were analysed. The comparative life cycle assessment focused on the storage of electrical excess energy from a renewable energy power plant. The considered EEST were lead-acid, lithium-ion, sodium-sulphur, vanadium redox flow and stationary second-life batteries. In addition, two power-to-gas plants storing synthetic natural gas and hydrogen in the gas grid and a new underwater compressed air energy storage were analysed. The material footprint was determined by calculating the raw material input RMI and the total material requirement TMR and the carbon footprint by calculating the global warming impact GWI. All indicators were normalised per energy fed-out based on a unified energy fed-in. The results show that the second-life battery has the lowest greenhouse gas (GHG) emissions and material use, followed by the lithium-ion battery and the underwater compressed air energy storage. Therefore, these three technologies are preferred options compared to the remaining five technologies with respect to the underlying assumptions of the study. The production phase accounts for the highest share of GHG emissions and material use for nearly all EEST. The results of a sensitivity analysis show that lifetime and storage capacity have a comparable high influence on the footprints. The GHG emissions and the material use of the power-to-gas technologies, the vanadium redox flow battery as well as the underwater compressed air energy storage decline strongly with increased storage capacity.
1. Introduction
In the German energy system, renewable energy sources have substantially expanded their leading position in the electricity mix and the future growth will mainly be in the solar and wind power areas [1]. As electrical energy generated by photovoltaic cells and wind power plants fluctuates due to its dependence on weather conditions, the use of electrical energy storage technologies (EEST) is an important aspect of the German Energiewende. Especially along German coastlines, the expansion of wind energy has progressed faster than inland grid expansion, which leads to regular cut-offs of wind power plants [2]. The application of EEST could reduce the cut-off times and make the excess energy usable, until grids are expanded, or other flexibility options are available [3]. According to current forecasts, a share of 80% of renewables will lead to an increased demand for short- and long-term energy storage in Germany [4]. Since this target shall be achieved before 2050, research on EEST is of growing importance in order to optimize efficiency and to exploit their development potentials [5].
Life Cycle Assessment (LCA) is the forefront approach for assessing the environmental and human health impacts along the complete life cycle of products from raw material extraction through production, use to the end of life (EoL) phase. The methodological framework for LCA and the relevant steps for the execution of LCA studies is described within ISO 14040 and 14044 [6]. Existing life cycle impact assessment (LCIA) methods are mainly output oriented. All output flows that are contributing to an environmental impact category are aggregated into one or more impact indicators. The most prominent impact category is the global warming where the carbon footprint is determined by aggregating the output flows of GHG emissions into the global warming impact (GWI). Since the late nineties, studies have been carried out using comparative LCA approaches to assess the environmental burden of batteries with a focus on emission based impacts [7]. Later studies also considered the effects on material flows and resource constraints by increasing use of batteries [8,9]. The focus of further LCA studies was on GHG emissions [10] and energy requirements [11]. In the following years, studies compared different storage technologies regarding their environmental impacts including cumulative energy demand and fossil depletion [12,13,14]. None of the studies considered the material footprint as an indicator, although it is easy to apply and allows the evaluation of “the environmental burden, without the uncertainty associated with the assessment of emission-based impacts” ([15], p. 1).
The urgent need to bring natural resource use down to sustainable levels becomes more and more obvious and is emphasised internationally by the work of the International Resource Panel [16] and nationally by the German Resource Efficiency Program II [17]. The use of renewable energy plants may significantly increase the resource efficiency of the energy supply [18]. In contrast, the use of EEST is always associated with an additional resource use. The material footprint can be determined using LCA methodology by aggregating the material input flows into the raw material input (RMI) and the total material requirement (TMR). The calculation of the indicators can be supported by e.g., openLCA, an open source software tool for modelling different product systems and quantifying the environmental impacts over the complete life cycle (www.openLCA.org). RMI and TMR have been established for national and regional integrated environmental and economic accounting, being derived from economy-wide material flow analysis [19,20,21]. For the use at product level, the RMI was largely adopted in a standardization process in Germany. In the VDI 4800 guideline, the indicator is called cumulated raw material demand (CRD, German: Kumulierter Rohstoffaufwand, KRA) which differs from RMI only by excluding biomass harvest from agriculture [22]. RMI and TMR have also been applied to measure the material resource efficiency of buildings, and are recommended to be included in sustainability assessment schemes [23]. When the material input indicators are calculated per service unit of the product, their inverses are measures for the material efficiency. For the interpretation of the indicators, with regard to their bundles of environmental impacts, see Bringezu et al. [24].
For the first time, eight different EEST, storing excess energy from a renewable energy power plant, were analysed regarding their material footprint using the LCA methodology. The results for RMI and TMR for two different power-to-gas technologies, five different types of batteries and a new underwater compressed air energy storage technology are presented in comparison to the results of the carbon footprint. The information about the storage systems was taken from pilot applications. The study identified which of the EEST best supports the objectives of material efficiency and climate protection.
2. Electrical Energy Storage Technologies
EEST are available in broad range and used in a great variety of applications with different techniques [25]. We consider a charged energy of 14,600 MWh over 20 years operating time and a discharged energy according to the efficiency of the EEST, under the constrain of one full charge/discharge cycle per day. Therefore, batteries as decentralized electricity storage technologies, with a storage period of a few hours are considered. Power-to-gas technologies are usually classified as long-term storages, but can technically also be used as a short-term storage and are therefore also considered. Other interesting storage systems like flywheel energy storage or superconductor storage are not included in the study but could be taken into account in future research studies. We give a short description of the storage technologies with a focus on the considered pilot applications and the parameters relevant for the LCA process model.
2.1. Power-to-Gas Storage
The power-to-gas storage systems are chemical energy storages. The energy is transformed into hydrogen (H2) or synthetic natural gas (SNG) and the gas can be stored in gas tanks or directly in the gas grid. The discharging of the storage can be done by gas fired or combined heat and power (CHP) plants [4]. Furthermore, the gas can be used as fuel in the transportation sector or as feedstock in the chemical industry [26]. The assumption for the power-to-gas hydrogen storage (H2-S) is based on two pilot projects in Germany: Energiepark Mainz (www.energiepark-mainz.de) and WindGas Hamburg (www.powertogas.info). In the first project, three electrolysers are used with 2 MW each. In the second project, a smaller electrolyser is installed with 1 MW. We assume a direct feed into the gas grid and a transport of 50 km. After transport, electricity is generated by a CHP plant with a gas engine of 1 MW electric output. The analysis considers the complete electricity-hydrogen-electricity chain of the power-to-gas technologies.
2.2. Batteries
Batteries in MW sizes are being built by stacking many battery modules. The considered batteries are lead-acid battery (PbA-B), lithium-ion battery (LiI-B), sodium-sulphur battery (NaS-B), vanadium redox flow battery (VRF-B) and used automotive lithium-ion battery as stationary second-life battery (SL-B). The choice for the batteries is based on results by Sauer et al. [27] and Hartmann et al. [28].
The PbA-B is one of the most technically advanced and cost-effective battery technologies and therefore widely used despite its disadvantages compared to other battery types [4]. The electrodes and the current collector consist predominantly of lead, whose proportion of secondary material is estimated at 80%. Graphite is considered as the carbon material that is used for the anode. The LiI-B is available with several electrode combinations and with different material requirements. Furthermore, it shows great differences in terms of main operating parameters. The analysed battery uses graphite as anode and spinel-structured lithium manganese oxide (LiMn2O4) as cathode material (ecoinvent 3.1). The SL-B is considered to be a used LiI-B. The assumptions are similar to the storage build in the 2 MW pilot project by Bosch, Vattenfall and BMW (www.bosch.com). The batteries are split into single modules and then reconnected to a large battery system with a storage capacity of 2.8 MWh. The new system is built on about 2600 modules, which have been used in more than 100 cars. In this project, a first life lifetime of 8 years and a second life lifetime of 10 years have been assumed [29]. The NaS-B with an operating temperature of over 300 °C is a so-called high-temperature battery [4]. However, there are efforts underway to develop NaS-B for room temperature applications [30]. The world largest energy storage site using NaS-B has storage capacity of 300 MWh and an output power of 50 MW (www.ngk.co.jp). The VRF-B differs in its structure and functioning from the other batteries essentially in that the energy storage takes place in separate tanks. Its calculation is associated with high uncertainties, as the amount of electrolyte is highly dependent on the energy to power ratio. The data for our study are taken from the LCA of a VRF-B with a storage capacity of 450 kWh and nominal power of 50 kW [6]. Today, VRF-B are applied in different pilot applications in MW-size worldwide for example for peak power shaving [4].
According to our study assumptions, the batteries are operated with a depth of discharge (DoD) of 80% and therefore have a nominal storage capacity of 2.5 MWh. The cyclic and calendar lifetime data are based on Battke et al. [31]. Since the literature values for the lifetime vary, possible ranges were considered. From the median, the number of batteries required for a 20 years operating time or for 7300 charging cycles was determined. For the selected use case, the LiI-B, NaS-B and VRF-B reach their calendric EoL before their cyclical EoL. The calendar life of these three batteries is thus the limiting factor, which determines how much products are required. For the PbA-B, the limiting factor is the cyclical life.
2.3. Compressed Air Energy Storage
The analysis also included a new underwater compressed air energy storage (CA-S). The CA-S is a new storage technology that is still under development [32]. So far, only one pilot plant exists to estimate the needed parameters. The idea is to compress the air using three electric generators, while the compressed air is stored by large bags underwater [33]. The lifetime of all components is estimated at 20 years. Only the storage bags made from fabrics are replaced after 10 years [34]. The main characteristics of the EEST are shown in Table 1.
3. Methodological Approach
3.1. System Description
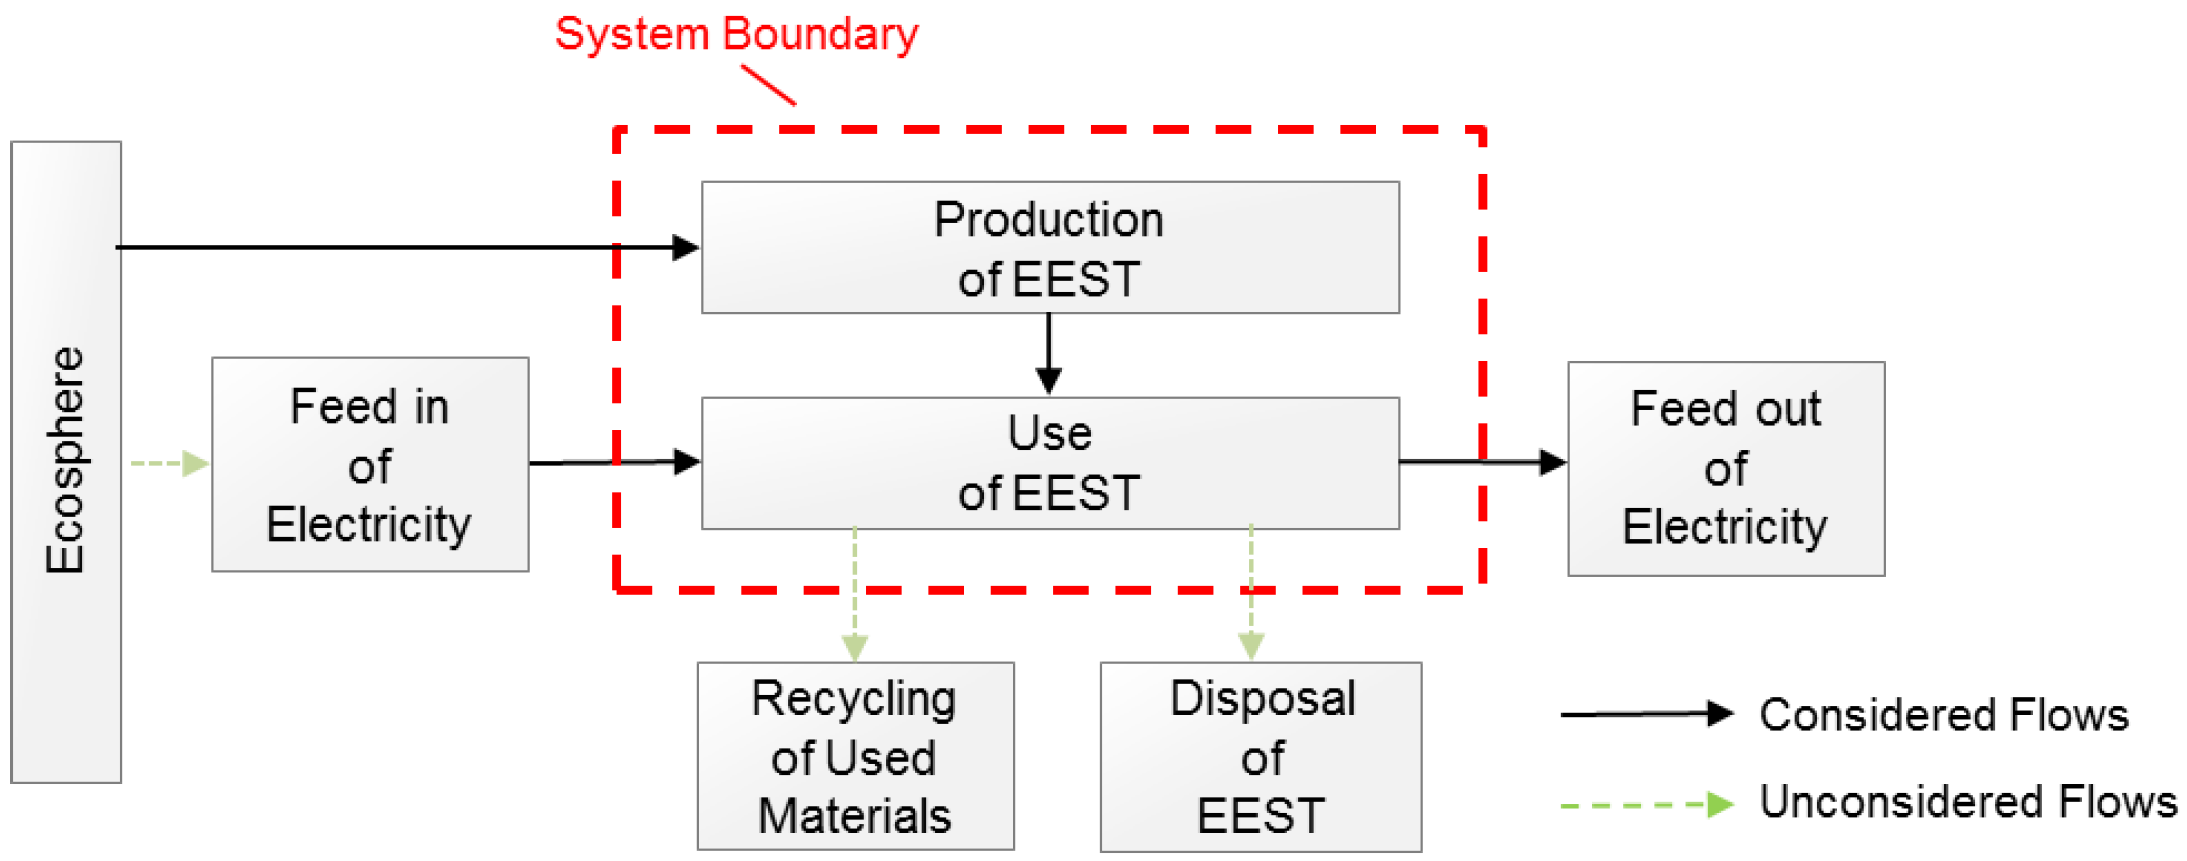
The considered product system is an energy storage facility directly connected to a renewable energy power plant. The EEST is accumulating electrical excess energy, which would not have been generated by the power plant due to e.g., a cut-off in times of grid overload. A functional unit FU is defined to compare the different EEST expressing the benefit of the product system in a comparable quantity [35]. The benefit of the energy storage is the reduction of the downtimes of the renewable energy power plant and the provision of the stored energy. The FU is the amount of usable electricity, which can be provided by the EEST based on a unified energy fed-in. It considers that the amount of electrical energy fed-out varies from storage to storage according to the efficiency of the storage η EEST with the same amount of loading cycles and energy being stored. An energy fed-in of 2 MWh, one loading cycle per day d and a period of 20 years a corresponding to the usual operating time of a renewable energy power plant is considered [36]. The resulting calculation for the FU is shown in Equation (1):
The product system and the system boundary are shown in Figure 1.
3.2. Inventory Analysis
In the inventory analysis all input and output flows are identified, which are generated over the considered life cycle of the EEST. They can be product, material or energy flows [37]. The quantification of the flows is based on a detailed literature research with a focus on scientific publications, data sheets from manufacturers and on processes of the ecoinvent database (version 3.1) using the cut-off system model. The use of generic data is common in LCA as there are always limitations in collecting or accessing primary data in the inventory analysis. The input flow of energy for the use phase of EEST is excess electricity, which is made usable only by the EEST. Therefore, it is not bearing any impacts and is burden free according to the cut-off model. The input flows of material and energy for the production phase of EEST bear all impacts of the upstream processes.
The input and output tables with the relevant flows are set up with the software openLCA (version 1.4.2) for the production and use phase. The disposal of EEST or the recycling of used material is not considered due to insufficient data and information about the EoL phase for all EEST. Transportation processes for the EEST are generally not considered for the same reason. Only for the power-to-gas technologies, a transportation process of the gas to the CHP plant is calculated as the gas grid is considered part of the storage facility. The processes inventory can be found in the Appendix B.
The input and output flows are assigned to the considered impact categories climate change and material use. The impact categories are quantified by impact indicators, which are calculated and normalized by the results of the inventory analysis and by multiplying them with characterization factors CF [35].
3.3. Carbon Footprint
The carbon footprint is determined by the impact indicator GWI. According to the Joint Research Center of the European Commission, a characterization model with a time horizon of 100 years is chosen [38]. The GWP100 data of the Fifth Assessment Report of the International Panel of Climate Change are used [39]. The GWI per functional unit is calculated as shown in Equation (3):
3.4. Material Footprint
The material footprint is determined by the raw material input RMI and the total material requirement TMR. The RMI considers all abiotic and biotic primary raw materials, which represent an input into the product over its complete life cycle.
The RMI per functional unit is calculated according to Equation (5):
Whereas the RMI accounts only for used extractions from the environment, i.e., raw materials that are sold by mining, agriculture, forestry and fisheries, the TMR considers both used and per se unused extraction. The unused extraction includes all natural material that is moved and dumped to enable the extraction of the primary raw material.
The TMR thus measures the total amount of abiotic and biotic primary material required over the complete life cycle:
The TMR per functional unit is calculated as shown in Equation (7):
The characterization model based on the characterization factor GWP100 has been used in a great number of LCA and is widely accepted. For the calculation of the material footprint, a standardized approach is still missing. Therefore, the characterization model of material use based on RMI and TMR including the calculation of the characterization factors CFRMI and CFTMR had to be developed and implemented into openLCA. The method for calculating CFRMI and CFTMR has been adopted from the calculation of the material input per service unit (MIPS) using the ecoinvent database [40,41].
The CFRMI is the ratio of the mass of the extracted primary raw material and the mass of the material in primary raw material as shown in Equation (8):
The CFRMI can also be calculated by the material concentration in the extracted primary raw material, e.g., the metal concentration in the extracted minerals, according to Equation (9):
The CFTMR is calculated from the CFRMI and the extraction coefficient according to Equation (10):
The data for the calculation of CFRMI and CFTMR are taken from the ecoinvent database (version 3.1), from the database of the former Raw Materials Group and from Schoer et al. [42].
4. Results
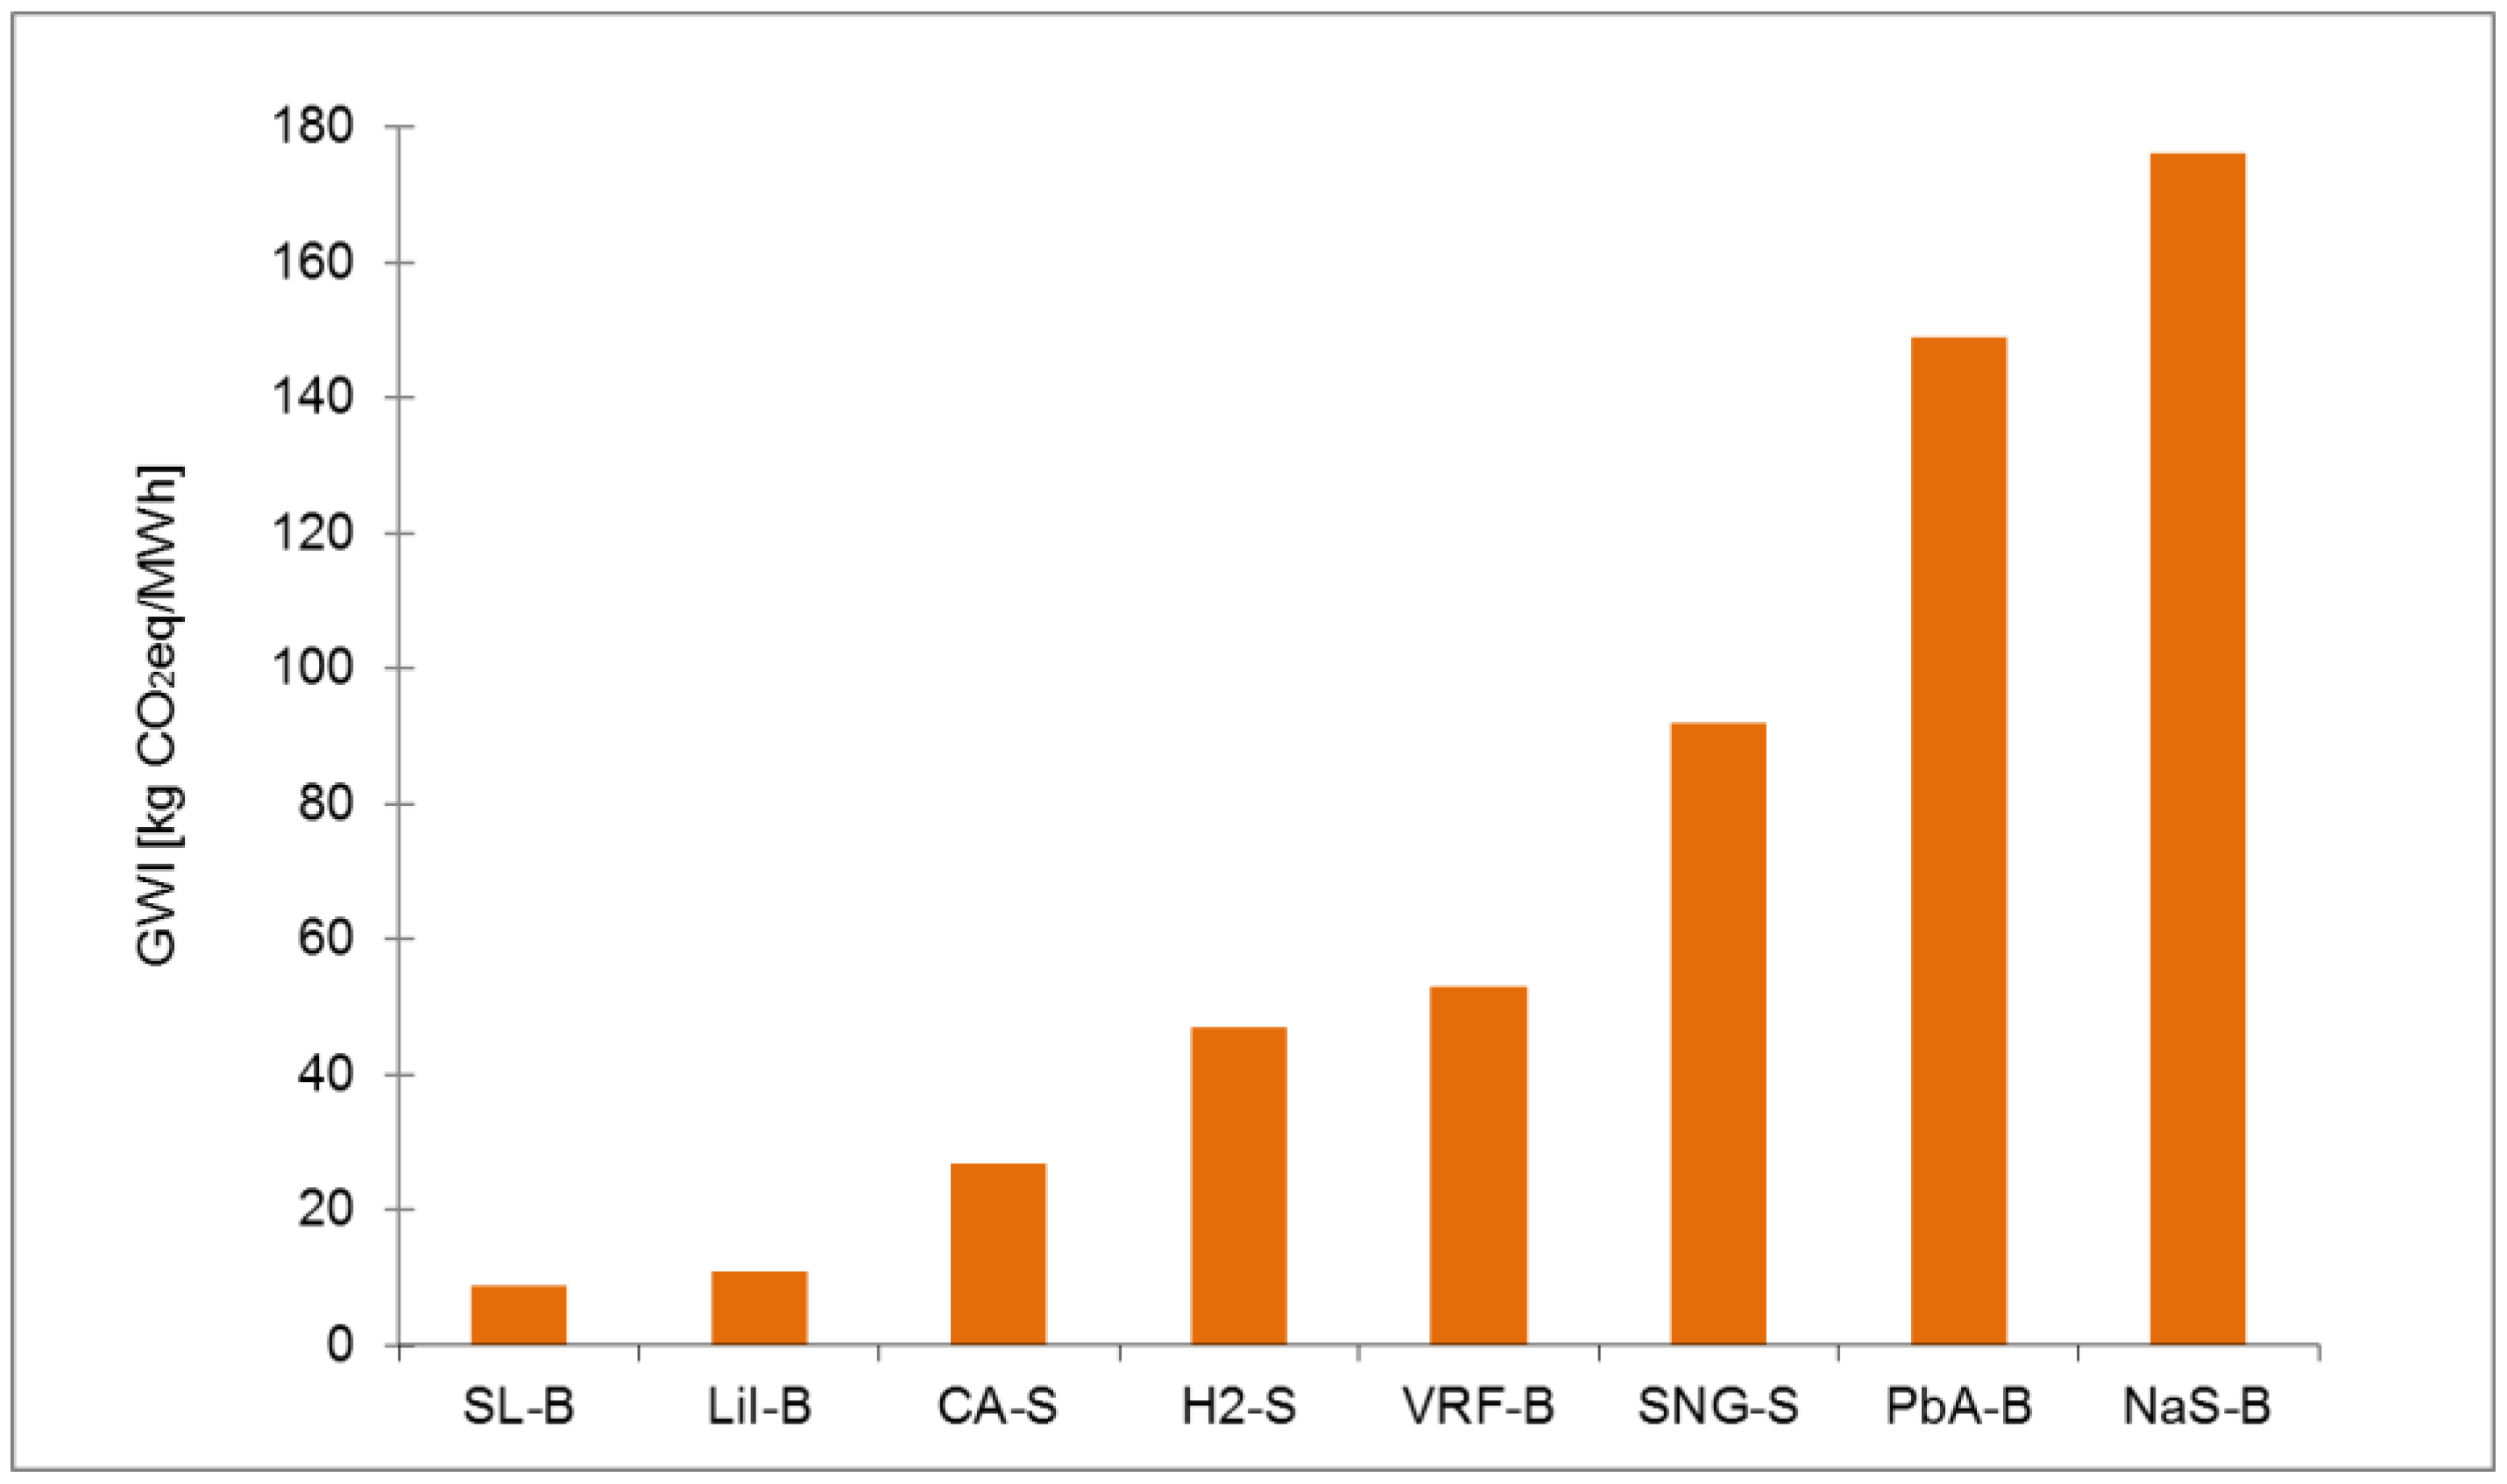
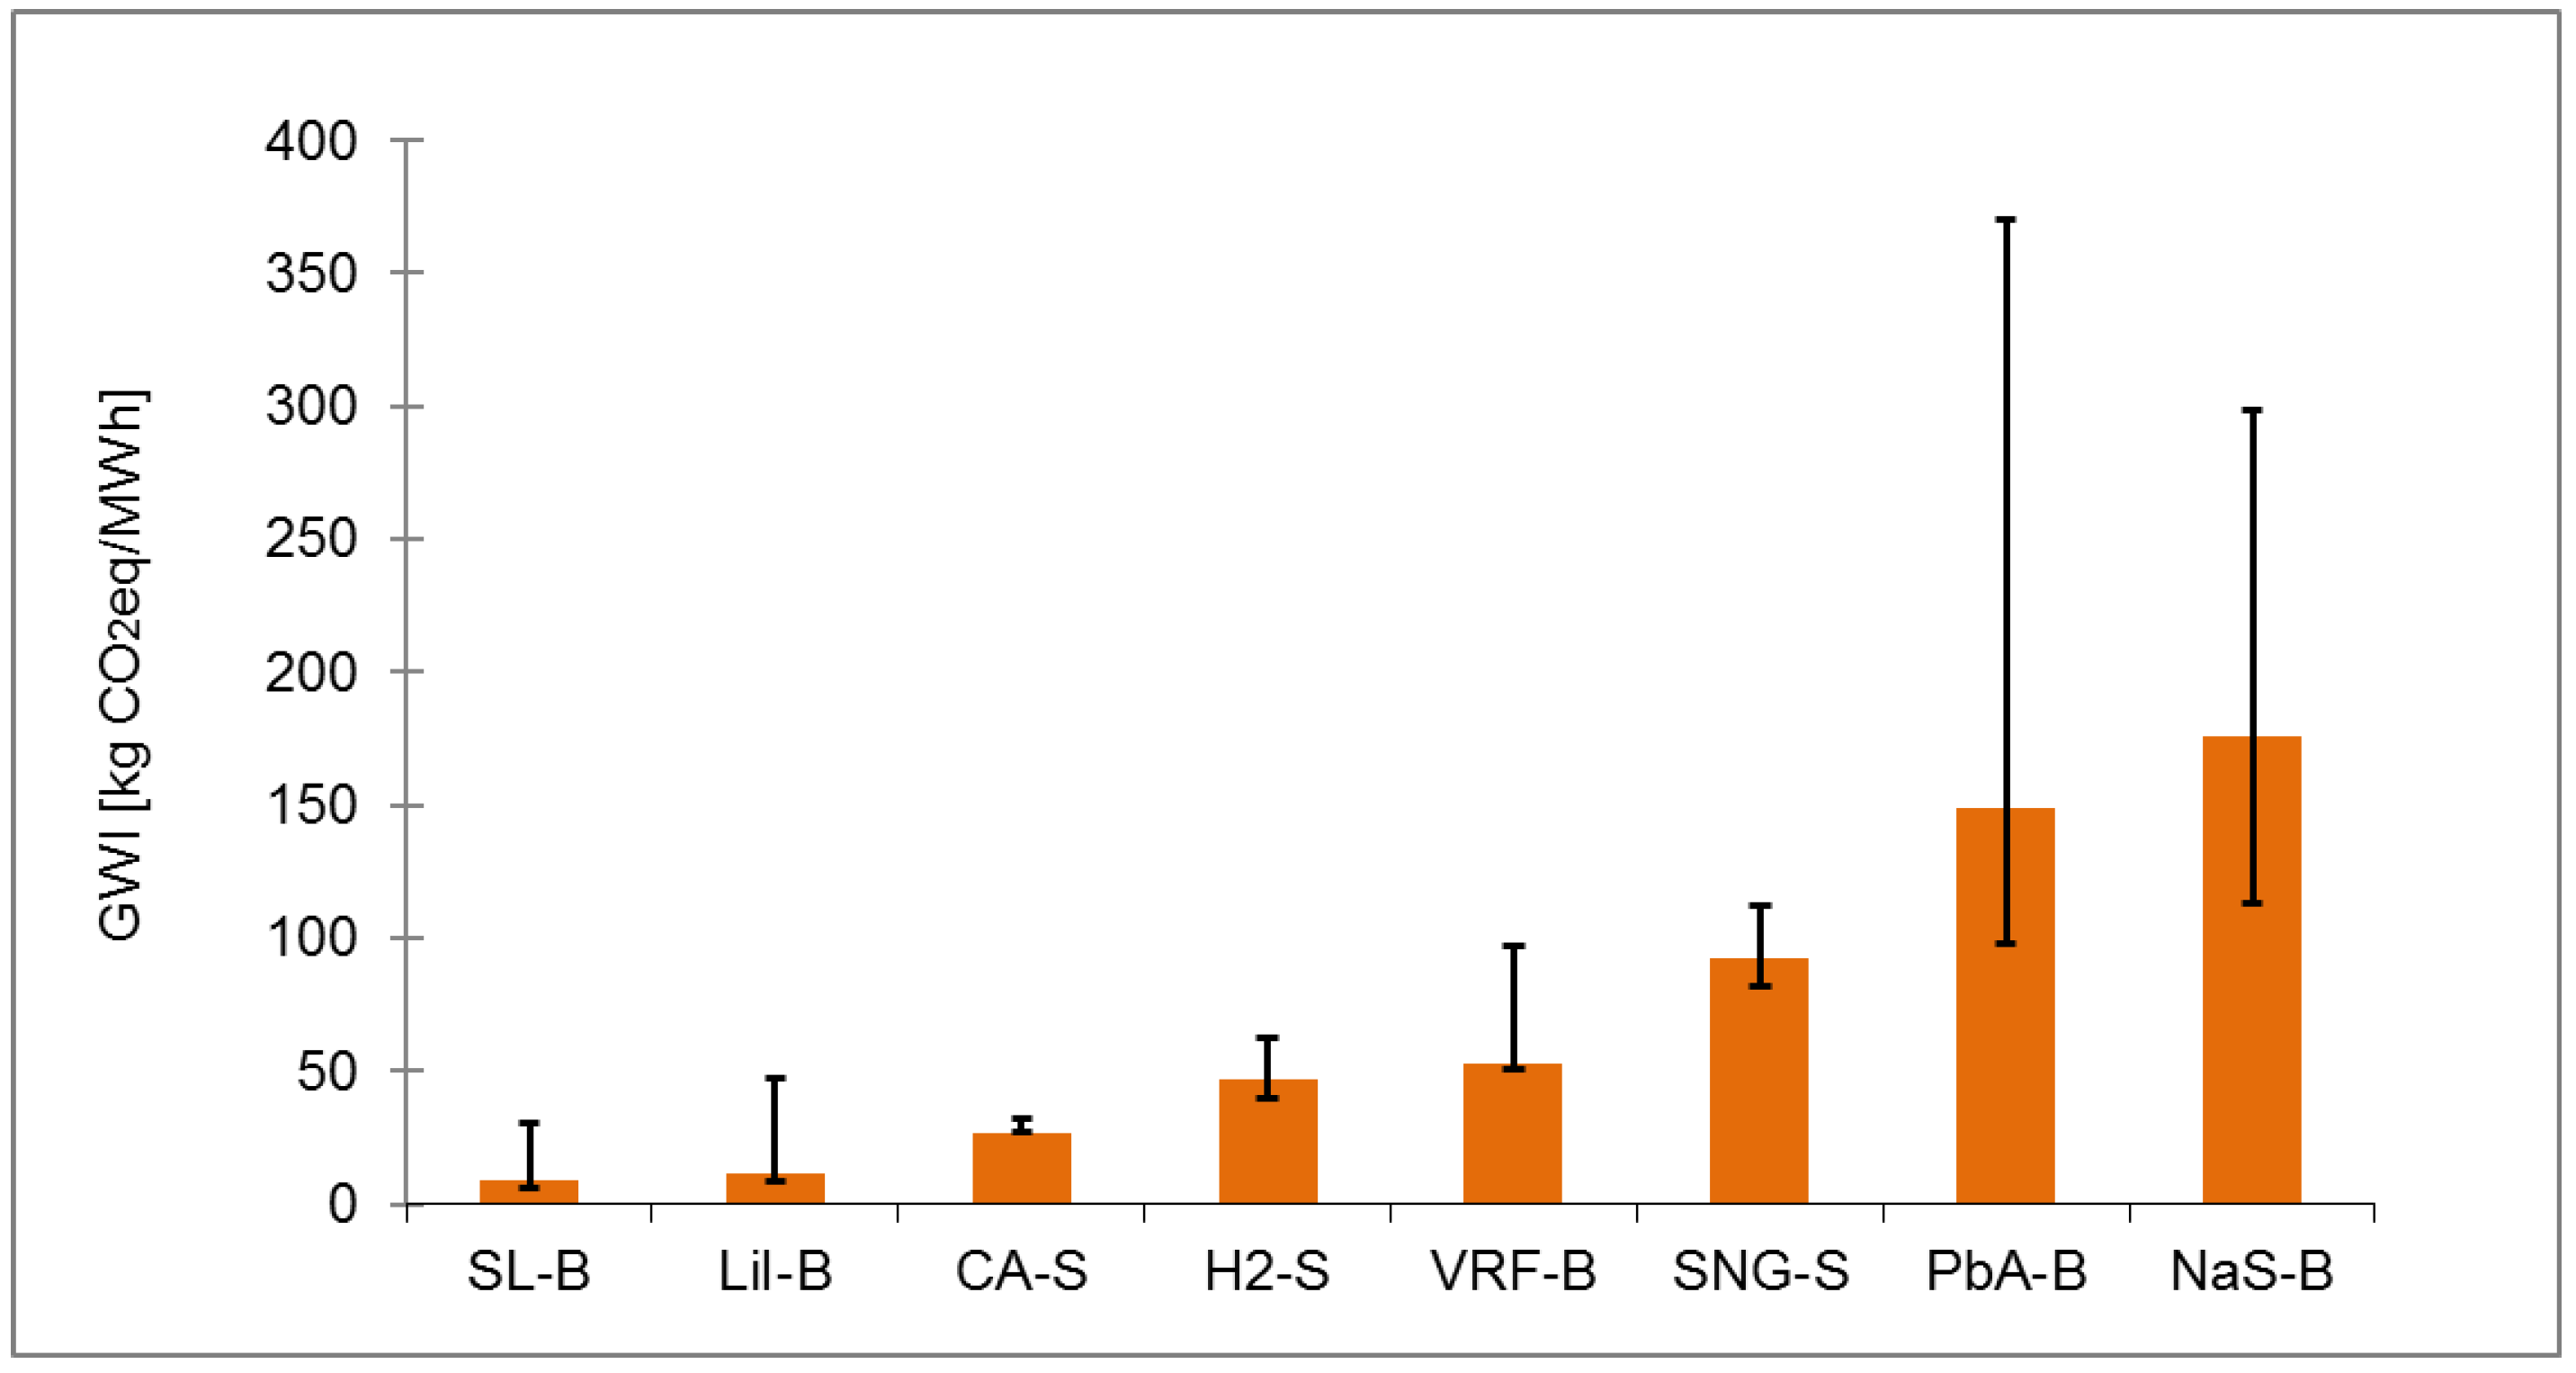
The second-life battery (SL-B) and the lithium-ion battery (LiI-B) have the lowest GWI per fed-out electricity with 9 and 11 kg CO2eq·MWh−1 (Figure 2). They are followed by the underwater compressed air energy storage (CA-S) with 27 kg CO2eq·MWh−1, the power-to-gas storage using hydrogen (H2-S) with 47 kg CO2eq·MWh−1 and the vanadium redox flow battery (VRF-B) with 53 kg CO2eq·MWh−1. The power-to-gas storage using synthetic natural gas (SNG-S) has a GWI of 92 kg CO2eq·MWh−1, nearly twice as much as the H2-S and 3.4 times higher than the CA-S. The lead-acid battery (PbA-B) and the sodium-sulphur battery (NaS-B) have the highest GWI with 149 and 176 kg CO2eq·MWh−1. Their carbon footprint is 13.5 and 16.0 times higher than that of the LiI-B.
In the case of the NaS-B and the VRF-B, the energy production for manufacturing the battery cells has the main influence on the GHG emissions. The power and heat production are accounting for 44% and 36% (NaS-B) and 43% and 32% (VRF-B) of the total GWI. The manufacturing process of the used materials primarily influences the GWI of the remaining five storage technologies. These materials are mainly graphite, aluminum, stainless steel, copper and iron. In case of the PbA-B, the production of graphite, which is used for the anode, is accounting for 55% of the GWI. In case of the power-to-gas storages, the production of stainless steel production has the highest share of GHG emissions. The process is accounting for 48% (H2-S) and 32% (SNG-S) of the total GWI. In case of the CA-S the manufacturing process of the compressors, particular the use of low-alloy steel and iron, is accounting for 52% of the total GWI.
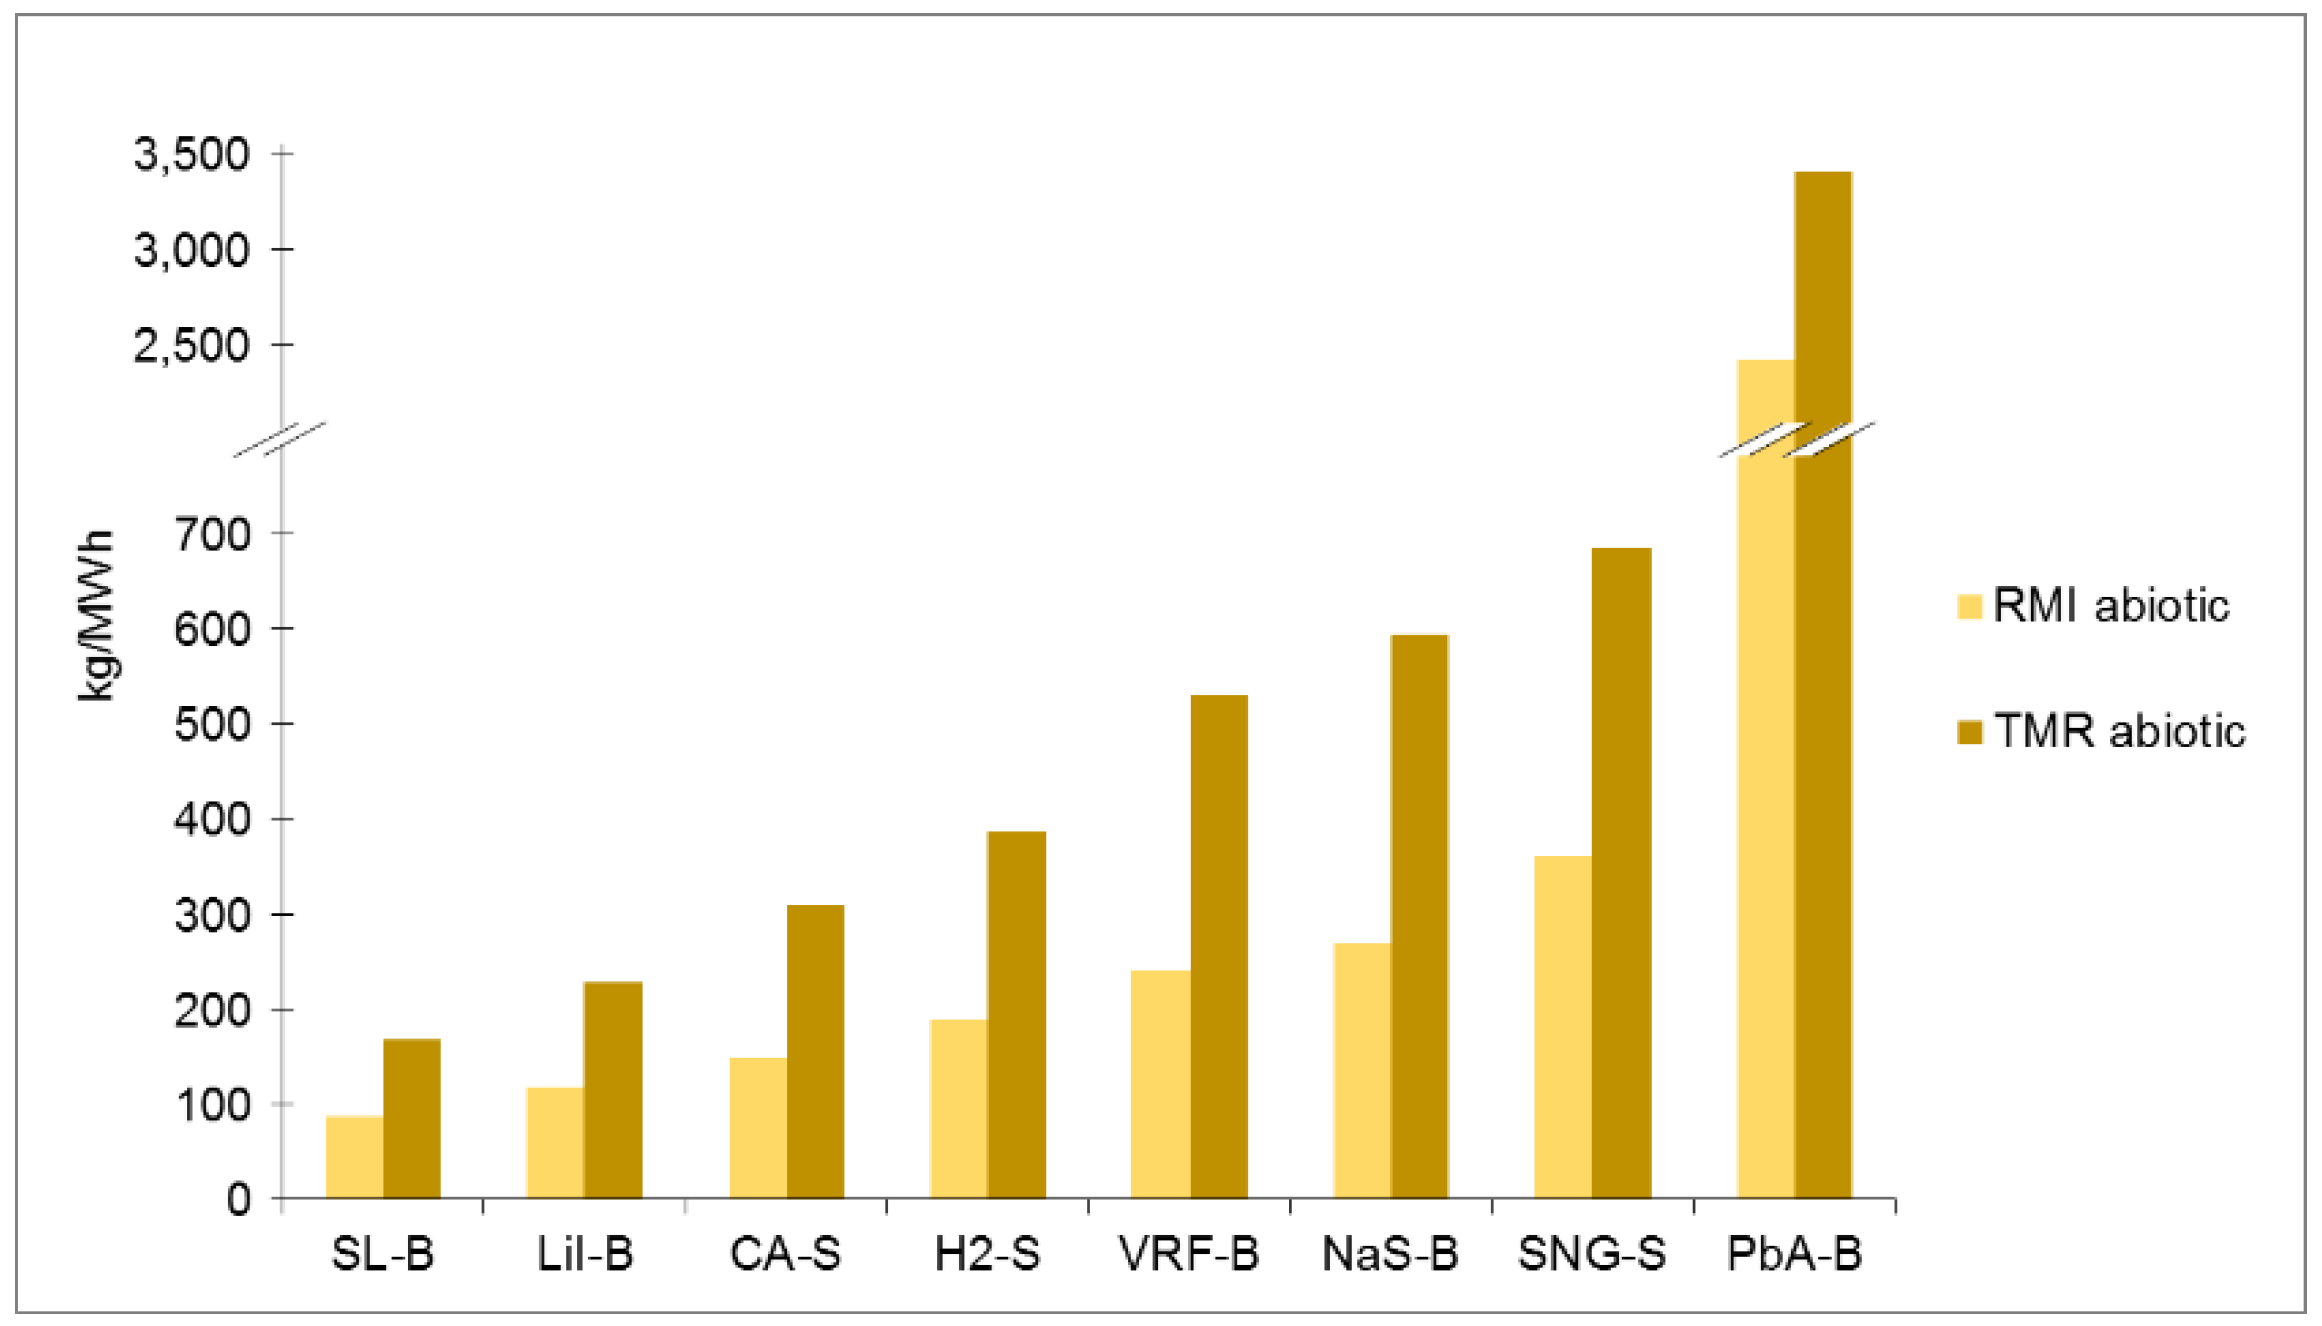
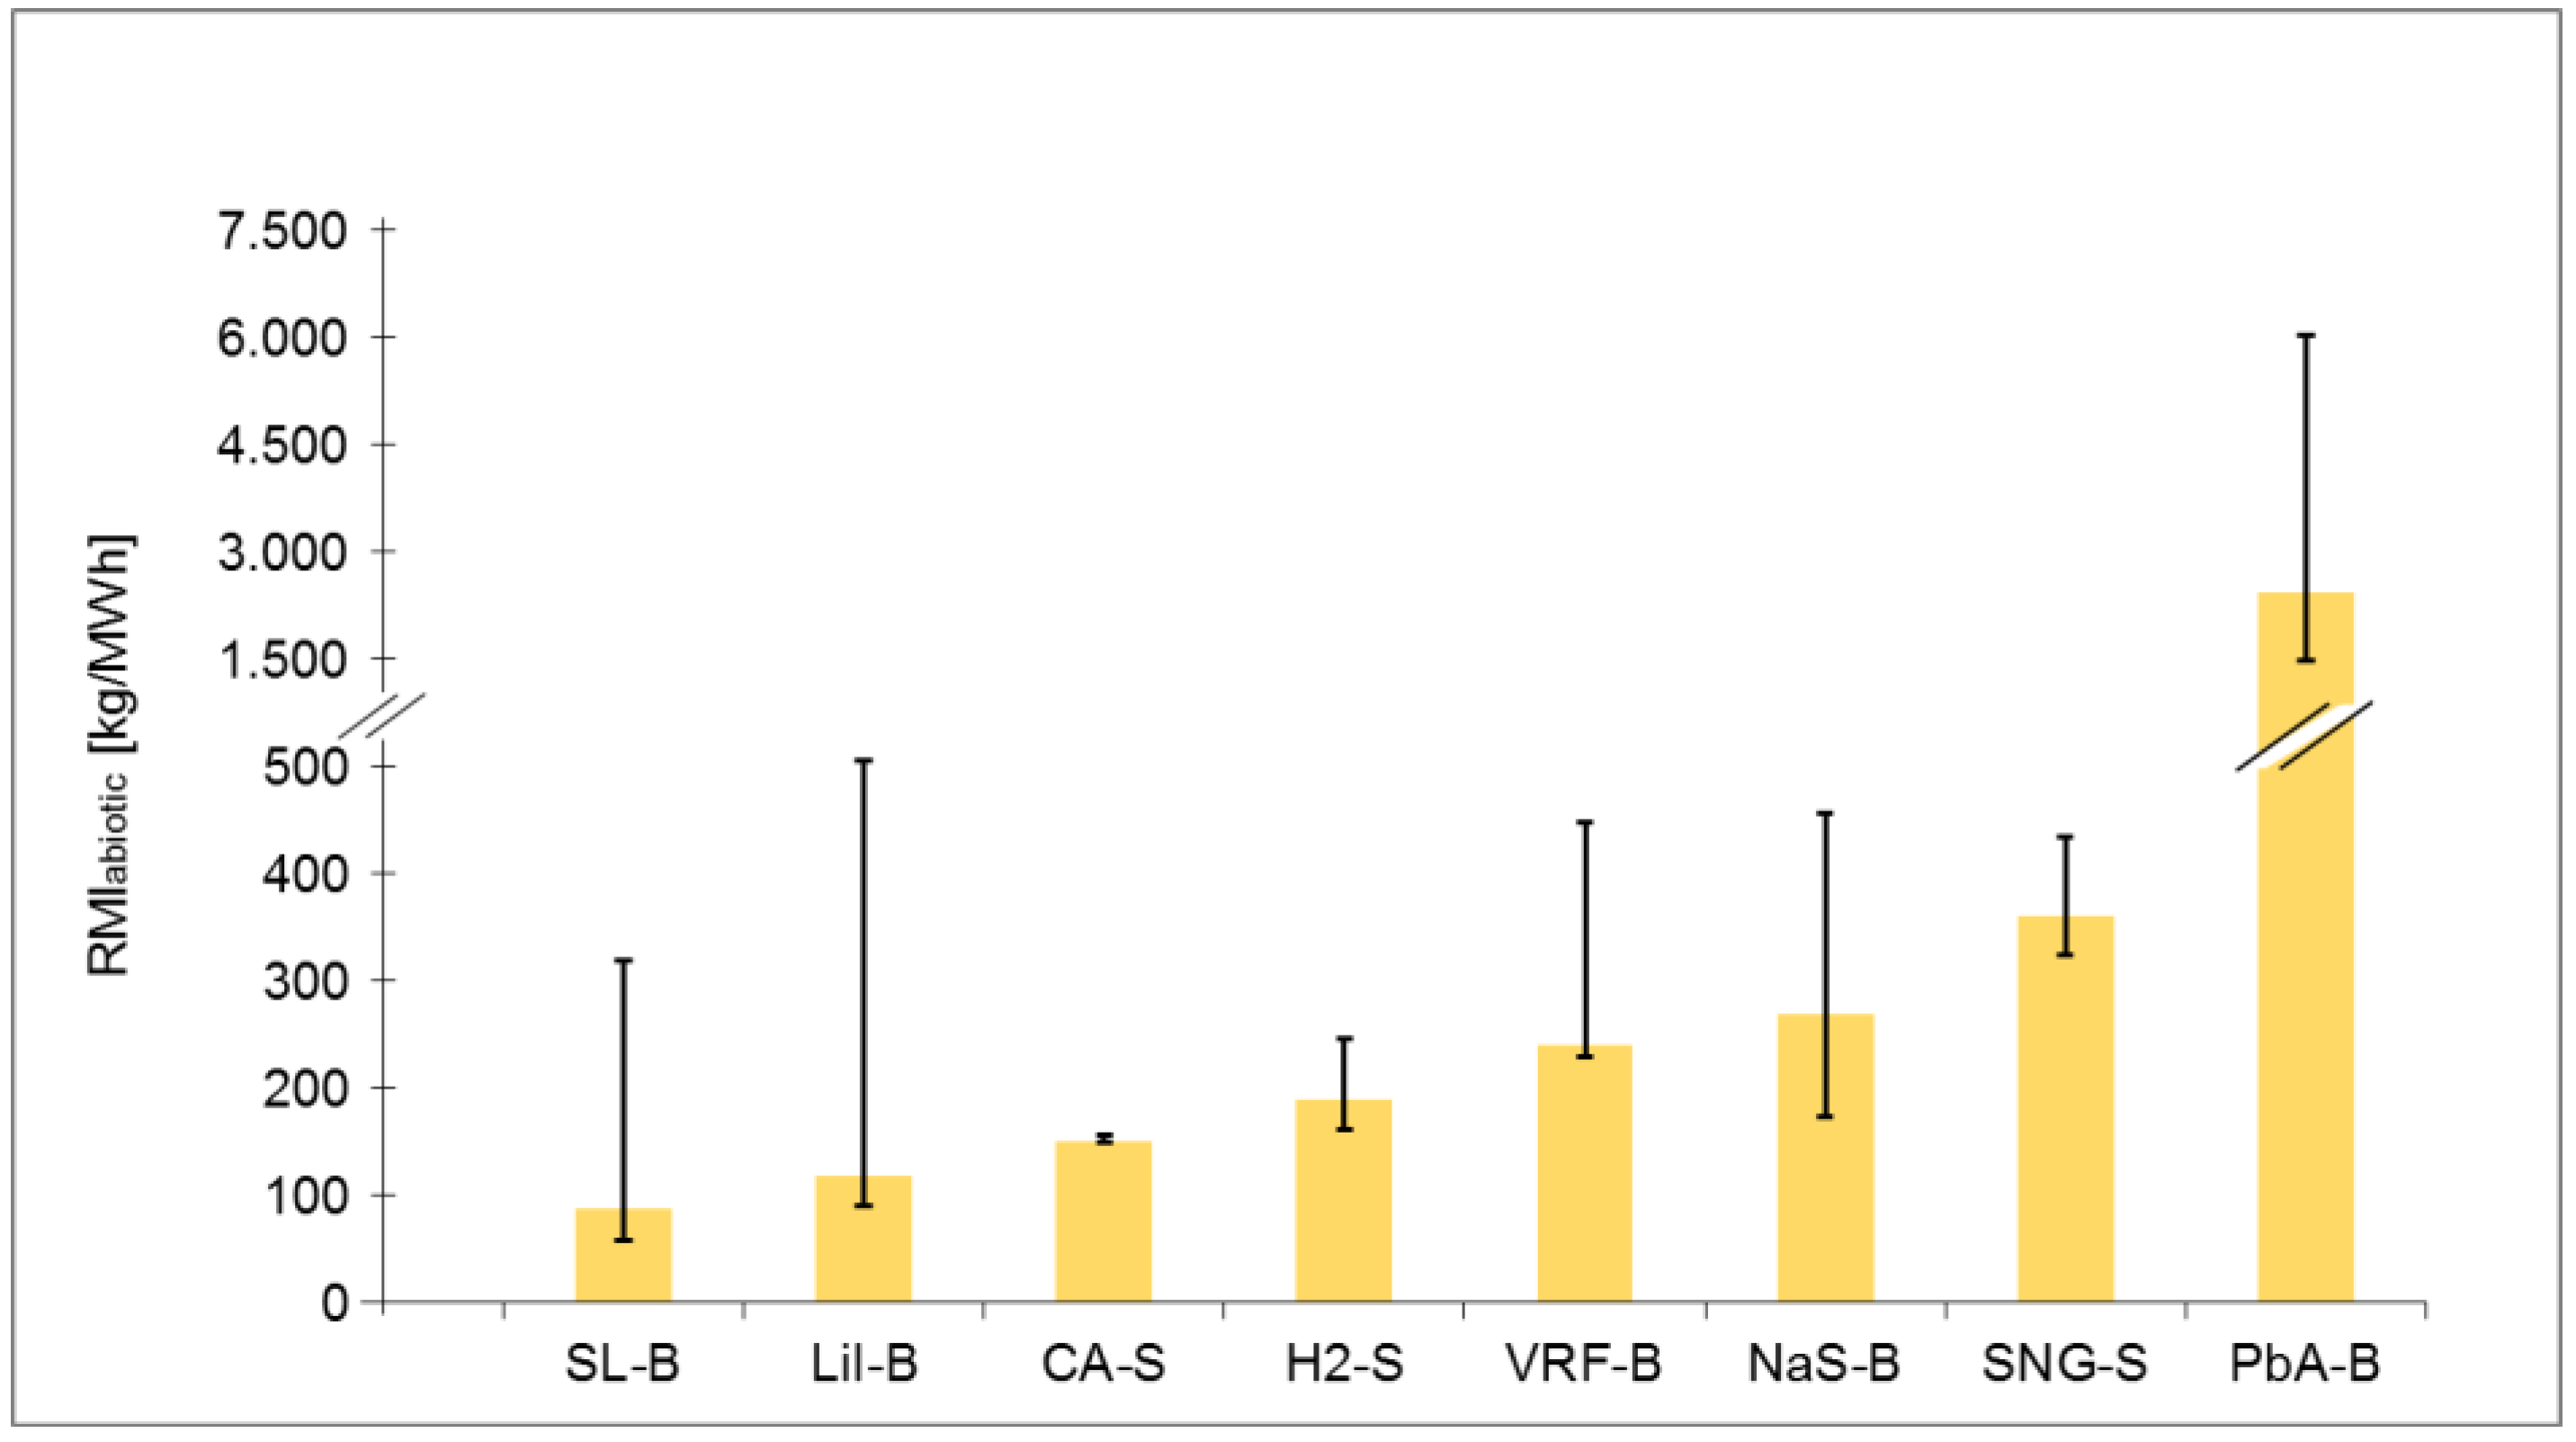
The results for RMIabiotic and TMRabiotic per fed-out electricity are shown in Figure 3. The difference between RMIabiotic and TMRabiotic represents the unused extraction. The ranking for abiotic material use corresponds to the ranking for global warming from SL-B to VRF-B. The SL-B has the lowest RMIabiotic and TMRabiotic with 87 and 168 kg·MWh−1 followed by the LiI-B with 118 and 229 kg·MWh−1, the CA-S with 149 and 309 kg·MWh−1, the H2-S with 189 and 387 kg·MWh−1 and the VRF-B with 240 and 531 kg·MWh−1. The NaS-B has an abiotic material use of 269 and 595 kg·MWh−1 and the SNG-S of 360 and 686 kg·MWh−1, nearly twice as much as the H2-S and 2.4 times higher than the CA-S. The PbA-B has by far the highest RMIabiotic and TMRabiotic with 2414 and 3411 kg·MWh−1. Thus, the SL-B has the lowest and the PbA-B the highest material footprint.
For all batteries except the NaS-B, the extraction and the processing of the primary materials mainly metals as lead, copper and stainless steel are accounting for more than 58% of the RMIabiotic and TMRabiotic. The RMIabiotic of the PbA-B is determined for more than 80% by the use of primary lead. In case of the NaS-B, the electric energy demand for manufacturing the battery cells has the main influence on abiotic resource consumption. For the power-to-gas technologies and the CA-S the materials used for the production of the combined heat and power plant, the compressors and the motors have the highest influence on abiotic resource consumption. In all these processes, copper has the highest share of RMIabiotic and TMRabiotic.
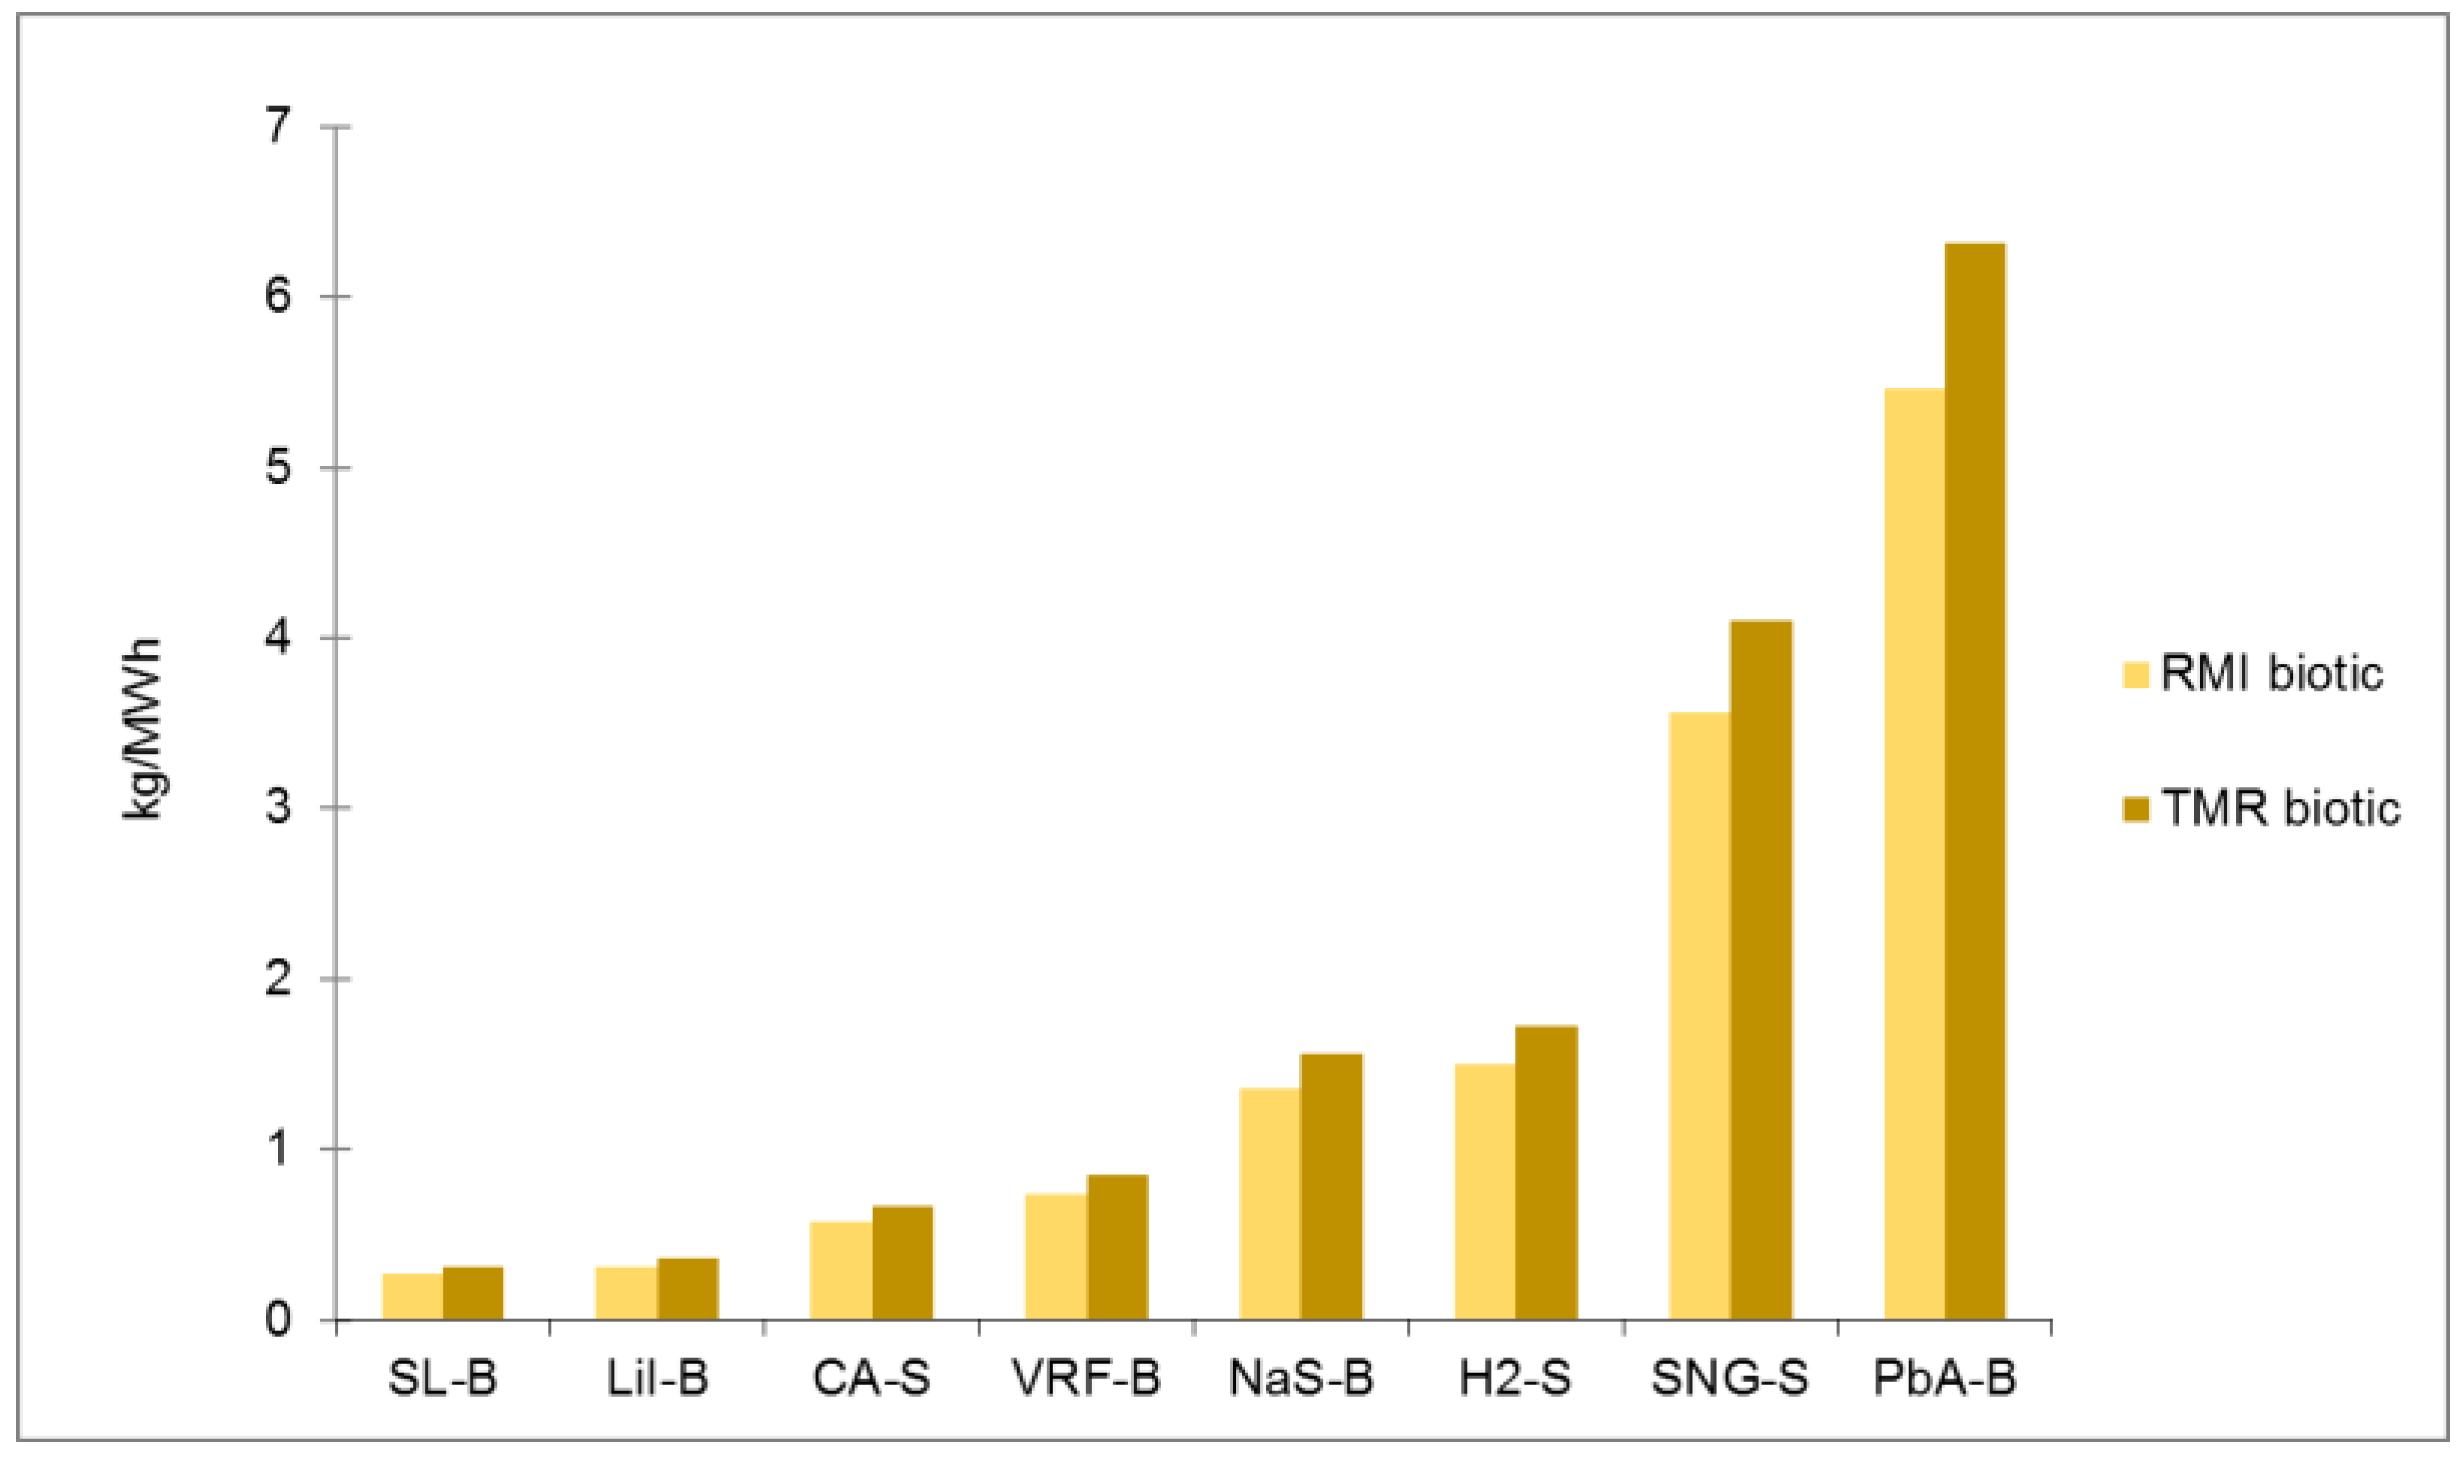
The values for RMIbiotic and TMRbiotic are shown in Figure 4. The influence on the material footprint is significantly lower than that of the abiotic material use with a RMIbiotic of up to 5.5 kg·MWh−1 and a TMRbiotic of up to 6.3 kg·MWh−1. The order of the EEST differs slightly from that of the abiotic material use. Again, the SL-B and the LiI-B have the lowest values with 0.27 and 0.31 kg·MWh−1 and 0.31 and 0.36 kg·MWh−1, followed by the CA-S with 0.58 and 0.67 kg·MWh−1 and the VRF-B with 0.74 and 0.85 kg·MWh−1. The values of the NaS-B are 1.35 and 1.56 kg·MWh−1 and of H2-S 1.50 and 1.72 kg·MWh−1. The second highest abiotic material use has the SNG-S with 3.56 and 4.10 kg·MWh−1 followed by the PbA-B with 5.47 and 6.32 kg·MWh−1.
The ranking of the EEST shows a strong correlation between the material and carbon footprints for the SL-B, LiI-B, CA-S, H2-S and VRF-B (Table 2). The NaS-B has the highest carbon footprint, mainly because of the high energy demand in the manufacturing process and is ranked 6 for material footprint. The PbA-B has the by far highest material footprint but the carbon footprint is lower than that of the NaS-B. The SNG-S ranked 7 for material and 6 for carbon footprint.
5. Sensitivity Analysis
A sensitivity analysis was carried out to check how the underlying assumptions affect the study results. In a first step, the significantly influential parameters were identified. A parameter was considered significant if the carbon or material footprint increases or decreases more than 5% by changing the parameter within realistic ranges. Efficiency, lifetime, share of secondary material input, electricity mix for production and useable storage capacity were identified as significant parameters. The data for variation of efficiency and lifetime are shown in Table 3.
Furthermore, a 100% share of secondary material input for the main materials instead of ecoinvent 3.1 data, a CO2-emission factor for electricity mix for production of 675 kg CO2eq·MWh−1 (German mix, 2008) instead of 855 kg CO2eq·MWh−1 (Chinese mix, 2008) and a storage capacity of 8 MWh instead of 2 MWh were considered. Only a shorter lifetime and increased storage capacity lead to a change in the ranking of EEST. A shorter lifetime increases the GWI per fed-out electricity of the EEST between 22% (CA-S) and 316% (LiI-B) as shown in Figure 5.
As a result, the LiI-B and the CA-S as well as the PbA-B and NaS-B exchange their rank. A longer lifetime decreases their GWI up to 36% (PbA-B) but has no influence on the ranking. The detailed data for the change in GWI for shorter and longer lifetime can be found in the Appendix A.
A shorter lifetime of the EEST increases the RMIabiotic between 4% (CA-S) and 327% (LiI-B) as shown in Figure 6. A longer lifetime decreases the RMIabiotic up to 37% (PbA-B). The results for the changes in TMRabiotic are in the same range. The detailed data for RMIabiotic and TMRabiotic can be found in the Appendix A.
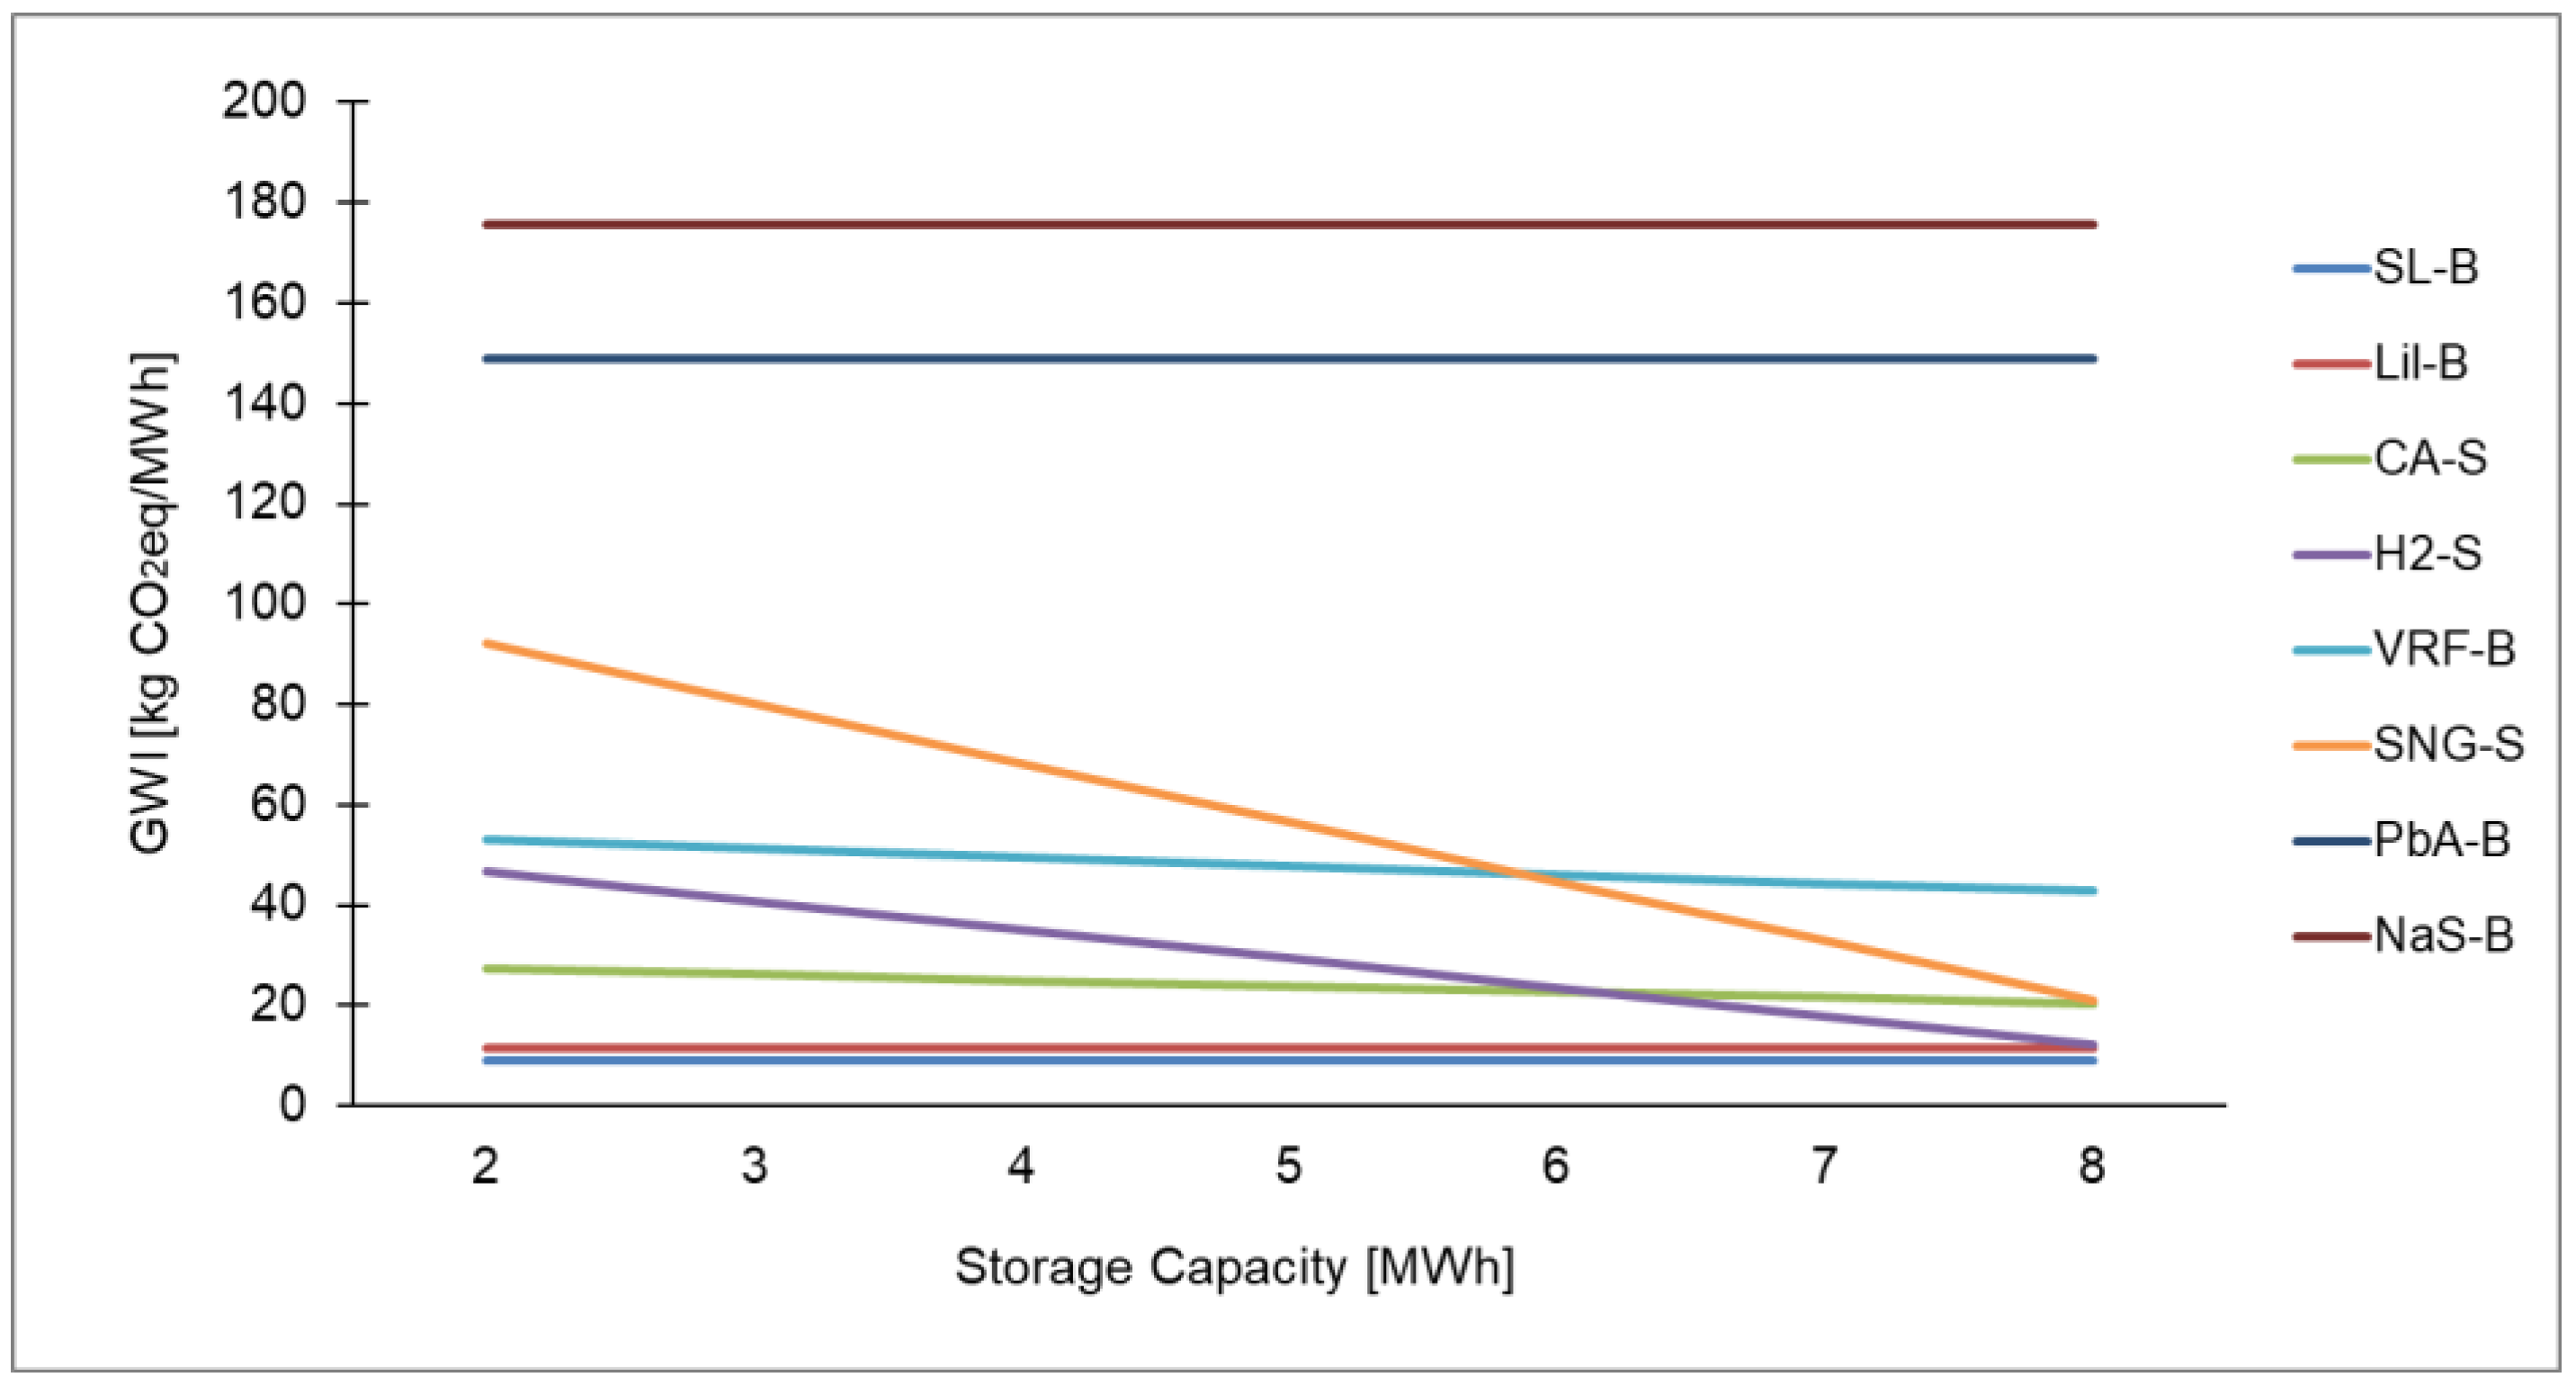
The results for the change in GWI per fed-out electricity for increasing storage capacity from 2 to 8 MWh are shown in Figure 7.
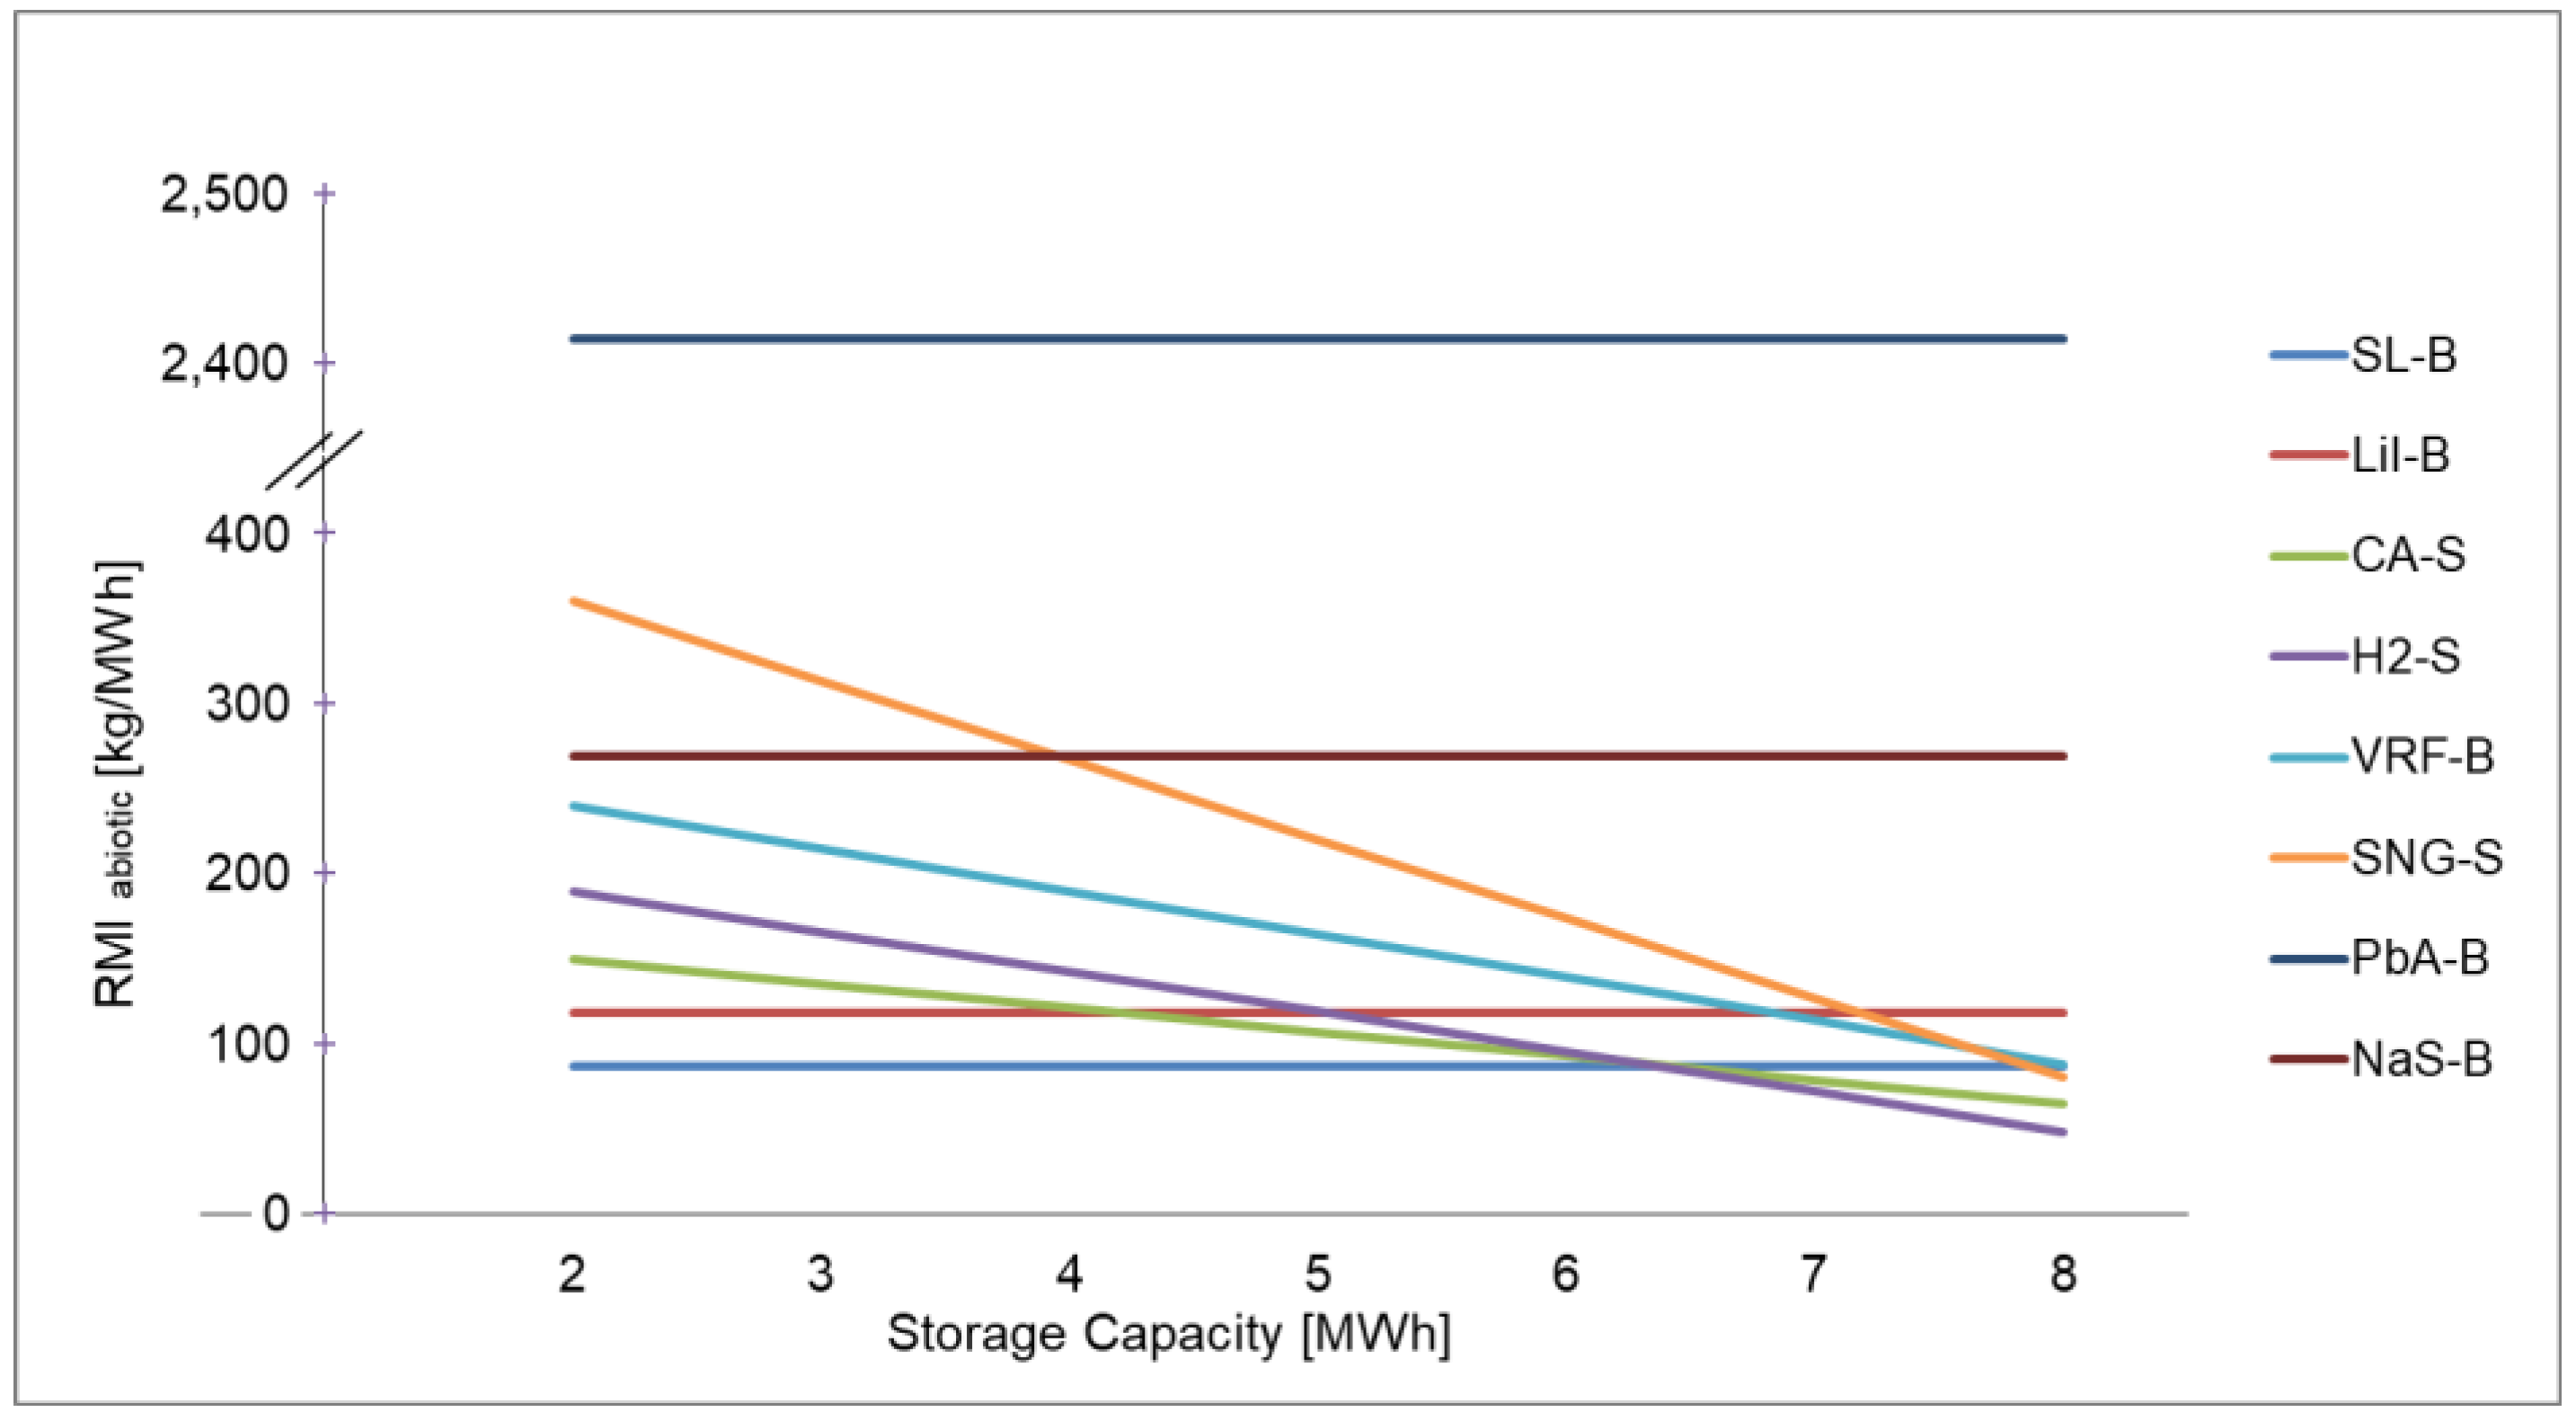
For all batteries, except the VRF-B, the capacity increase is achieved by interconnecting the fourfold number of battery modules (stacking). As the impact indicators are normalized per fed-out electricity, the stacking does not lead to a change in the carbon and material footprint. The capacity of the VRF-B is increased by a larger container, bigger components, more electrode material and a greater amount of electrolyte. The CA-S requires more material, bigger components and a higher volume of thermal oil. The capacity of the SNG-S and the H2-S is increased just by scaling up of the power-to-gas plants as they use the gas grid as storage. The GWI of the VRF-B is reduced by 19.6% and of the CA-S by 25.2%. The GWI of the H2-S is reduced by 74.1% (close to the value of the LiI-B) and of the SNG-S by 77.5% (close to the value of the CA-S). The detailed data are shown in the Appendix A. The change in RMIabiotic per fed-out electricity for increasing storage capacity from 2 to 8 MWh is shown in Figure 8.
The values of RMIabiotic for the CA-S, the VRF-S, the H2-S and the SNG-S are reduced from 57.0% up to 77.8%. The H2-S has the lowest RMIabiotic with 48 kg·MWh−1 followed by the CA-S with 64 kg·MWh−1. The RMIabiotic of the SNG-S is 80 kg·MWh−1, of the SL-B 87 kg·MWh−1 and of the VRF-B 88 kg·MWh−1. The RMIabiotic of the LiI-B, the NaS-B and the PbA-B remains constant. The detailed data for the RMIabiotic and the TMRabiotic are shown in the Appendix A. In addition, the variation of some parameters affecting only specific EEST was analysed: material composition of VRF-B, energy mix for CO2 capture in the SNG-S, increase in water storage depth for the CA-S and primary energy demand for aluminum of NaS-B. However, the results did not lead to a change in the ranking of the EEST regarding the material or carbon footprint.
6. Discussion
The inventory analyses for the CA-S and the SL-B are based on a few publications as they have so far only been implemented in some pilot projects. Especially the analysis results of the CA-S are associated with a comparatively high number of assumptions about the dimensions and material composition. In addition, its use is tied to specific geographical locations. In Germany, there are only ten lakes with a depth of more than 50 m, which is the necessary water storage depth. The depth of the Baltic Sea is only up to 40 m in German coastal regions. In the North Sea, the problem of low tide has to be considered. For the SL-B it is still unclear how battery cells from different manufacturers can be linked to each other, how cost-intensive the inspection of the cells before the second application is and how fast the capacity of the batteries decreases during use. In addition, their broader use is strongly dependent on the, so far very slow, increase in number of electric vehicles.
The barriers for the use of the CA-S and the SL-B show that those technologies have either limited potential capacity for a country like Germany or need further development. Therefore, one may expect that various technologies have to be applied to meet future storage requirements. In particular, the demand for LiI-B cells has experienced an exponential increase in the last decades, due to the use in consumer goods, leading to a continuous further development and improvement of this type of battery. A complete recycling of the LiI-B is not yet state of the art, as it focuses only on the recovery of cobalt and nickel [43]. This disadvantage promotes their use as SL-B until a complete recycling is economical. In comparison PbA-B are almost 100% recycled in Europe and the United States [44].
A general problem of LCA is outdated data and data lacks. The results of the inventory for the VRF-B are based on data from the year 1999 [7]. Presumably, the material composition and production processes for currently manufactured batteries have changed. In addition, as some key components for the power-to-gas technologies are still under development, several assumptions had to be made for the calculation of the material and carbon footprint, including the composition of the energy mix for the production phase. In addition, the 10 years lifetime of the second life of the SL-B is an assumption that is associated with high uncertainties, as there are no reliable data available so far.
7. Conclusions
The aim of the study was to compare different EEST regarding their material and carbon footprint per fed-out electricity within a comparable application as a storage system for a renewable energy power plant. The results show a clear order for the SL-B, LiI-B, CA-S, H2-S and VRF-B. Their material footprint (measured by TMR) ranges from 168 to 532 kg·MWh−1 and their carbon footprint from 9 to 53 kg CO2eq·MWh−1. The PbA-B has by far the highest material footprint with 3417 kg·MWh−1 and the NaS-B has the highest carbon footprint with 176 kg CO2eq·MWh−1. The fact, that EEST with lower GHG emissions also show a lower material use, is indicating a strong correlation between the carbon and material footprint.
The variation of the assumptions and the significant parameters has not shown a strong influence on the ranking of the EEST. Only a shorter lifetime leads to stronger shifts. Since all technologies are continuously further developed, it can be assumed that the lifetime will rather increase in the future. The sensitivity analysis showed that the material and carbon footprint of the power-to-gas storages as well as of the CA-S could be reduced significantly by increasing the storage capacity. This is consistent with other findings that power-to-gas technologies are particularly suitable as long-term storage solutions [27]. Therefore, these technologies should not only be used as long-term storages due to their technical ability, but also because of lower GHG emissions and material use.
For nearly all EEST the production phase is accounting for the highest share of the material and carbon footprint. However, the sensitivity analysis shows that the results are sensitive to the ratio of primary to secondary material and energy-mix. Therefore, an increased share of secondary material and the use of energy from renewable sources in the production phase could significantly reduce the impact on climate change and material use of the EEST.
There is little influence on the results from the use phase, because the electrical energy fed-in is considered burden free, as it is electrical excess energy that would not have been used without the additional storage. This is also the reason why the results for GWI are very low compared to other findings [14]. Taking into account grid electricity and losses, the values are in a comparable order of magnitude. Recycling could have a significant influence on the results and reduce the material footprint especially of EEST with high material intensity. The EoL phase was not considered, as there are currently not sufficient data and information available. In Germany, there is a statutory obligation for consumers to return used batteries and a return obligation for manufacturers [45].
The defined use case for the excess electricity, one full loading cycle per day, may not be fully representative for all energy systems. In Germany, photovoltaic power plants achieve between 210 and 250 full loading cycles per year and wind energy power plants less than 100. The usage period of 20 years for renewable power plants is mainly justified by the German Renewable Energy Act, due to the limitation of the feed in tariffs and the uncertainty to which degree the plants would be operated thereafter. Therefore, we will analyse different excess electricity scenarios with different usage periods in the future to have more detailed information about the strength and weaknesses of the storage technologies and their possible contribution to climate protection and sustainable material consumption.
Author Contributions
B.O. collected the data and performed the calculations. C.M. reviewed the results and wrote the article. S.B. initiated and coordinated the work. T.M.K. gave valuable guidance on electrical energy storage technologies. All the authors have read and approved the final manuscript.
Funding
This research received no external funding.
Conflicts of Interest
The authors declare no conflict of interest.
Nomenclature
| a | year |
| d | day |
| m GHG | mass of greenhouse gas |
| m material | mass of material |
| coeff extraction | extraction coefficient |
| CF | characterization factor |
| CFRMI | characterization factor for RMI |
| CFTMR | characterization factor for TMR |
| CRD | cumulated raw material demand |
| DoD | depth of discharge |
| FU | functional unit |
| GWI | global warming impact |
| GWP100 | global warming potential for a time horizon of 100 years |
| RMI | raw material input |
| RMIabiotic | raw material input abiotic |
| RMIbiotic | raw material input biotic |
| TMR | total material requirement |
| TMRabiotic | total material requirement abiotic |
| TMRbiotic | total material requirement biotic |
| η EEST | efficiency of the electrical energy storage technologies |
| Acronyms | |
| CA-S | underwater compressed air energy storage |
| CHP | combined heat and power |
| EEST | electrical energy storage technologies |
| EoL | end of life |
| GHG | greenhouse gas |
| H2-S | power-to-gas hydrogen storage |
| LCA | life cycle assessment |
| LCIA | life cycle impact assessment |
| Lil-B | lithium-ion battery |
| MIPS | material input per service unit |
| NaS-B | sodium-sulphur battery |
| PbA-B | lead-acid battery |
| SL-B | second-life battery |
| SNG-S | power-to-gas synthetic natural gas storage |
| VRF-B | vanadium redox flow battery |
Appendix A

Table A1.
Ranking of electrical energy storage technologies for GWI with normal, shorter and longer lifetime.
Table A1.
Ranking of electrical energy storage technologies for GWI with normal, shorter and longer lifetime.
| GWI (kg CO2eq·MWh−1) | SL-B | LiI-B | CA-S | H2-S | VRF-B | SNG-S | PbA-B | NaS-B |
|---|---|---|---|---|---|---|---|---|
| Normal lifetime Value | 8.88 | 11.41 | 27.33 | 46.56 | 53.08 | 92.09 | 148.77 | 175.84 |
| Rank | 1 | 2 | 3 | 4 | 5 | 6 | 7 | 8 |
| Shorter lifetime | 30.37 | 47.42 | 32.37 | 62.08 | 97.29 | 112.16 | 370.08 | 298.48 |
| Change [%] | +241.9 | +315.5 | +18.4 | +33.3 | +83.3 | +21.8 | +148.8 | +69.7 |
| Rank | 1 | 3 | 2 | 4 | 5 | 6 | 8 | 7 |
| Longer lifetime | 6.15 | 8.66 | 27.33 | 38.92 | 50.51 | 82.20 | 94.70 | 112.67 |
| Change [%] | −30.8 | −24.1 | 0.0 | −16.4 | −4.9 | −10.7 | −36.3 | −35.9 |
| Rank | 1 | 2 | 3 | 4 | 5 | 6 | 7 | 8 |
Table A2.
Ranking of electrical energy storage technologies for RMI abiotic with normal, shorter and longer lifetime.
Table A2.
Ranking of electrical energy storage technologies for RMI abiotic with normal, shorter and longer lifetime.
| RMIabiotic (kg·MWh−1) | SL-B | LiI-B | CA-S | H2-S | VRF-B | SNG-S | PbA | NaS-B |
|---|---|---|---|---|---|---|---|---|
| Normal lifetime Value | 87 | 118 | 149 | 189 | 240 | 360 | 2414 | 269 |
| Rank | 1 | 2 | 3 | 4 | 5 | 7 | 8 | 6 |
| Shorter lifetime | 318 | 505 | 155 | 246 | 447 | 433 | 6032 | 455 |
| Change [%] | +266.5 | +327.3 | +3.8 | +30.1 | +86.0 | +20.5 | +149.8 | +69.3 |
| Rank | 3 | 7 | 1 | 2 | 5 | 4 | 8 | 6 |
| Longer lifetime | 57 | 89 | 149 | 161 | 228 | 323 | 1531 | 173 |
| Change [%] | −33.9 | −25.0 | 0.0 | −14.8 | −5.0 | −10.1 | −36.6 | −35.7 |
| Rank | 1 | 2 | 3 | 4 | 6 | 7 | 8 | 5 |
Table A3.
Ranking of electrical energy storage technologies for TMR abiotic with normal, shorter and longer lifetime.
Table A3.
Ranking of electrical energy storage technologies for TMR abiotic with normal, shorter and longer lifetime.
| TMRabiotic (kg·MWh−1) | SL-B | LiI-B | CA-S | H2-S | VRF-B | SNG-S | PbA | NaS-B |
|---|---|---|---|---|---|---|---|---|
| Normal lifetime | 168 | 229 | 309 | 387 | 531 | 686 | 3411 | 595 |
| Rank | 1 | 2 | 3 | 4 | 5 | 7 | 8 | 6 |
| Shorter lifetime | 614 | 976 | 320 | 499 | 988 | 830 | 8517 | 1008 |
| Change [%] | +265.5 | +326.8 | +3.6 | +28.8 | +86.0 | +21.0 | +149.7 | +69.3 |
| Rank | 3 | 5 | 1 | 2 | 6 | 4 | 8 | 7 |
| Longer lifetime | 111 | 172 | 309 | 332 | 504 | 615 | 2163 | 383 |
| Change [%] | −33.8 | −25.0 | 0.00 | −14.2 | −5.0 | −10.3 | −36.6 | −35.7 |
| Rank | 1 | 2 | 3 | 4 | 6 | 7 | 8 | 5 |
Table A4.
Ranking of electrical energy storage technologies for GWI with 2 and 8 MWh storage capacity.
Table A4.
Ranking of electrical energy storage technologies for GWI with 2 and 8 MWh storage capacity.
| GWI (kg CO2eq·MWh−1) | SL-B | LiI-B | CA-S | H2-S | VRF-B | SNG-S | PbA-B | NaS-B |
|---|---|---|---|---|---|---|---|---|
| 2 MWh | 8.88 | 11.41 | 27.33 | 46.56 | 53.08 | 92.09 | 148.77 | 175.84 |
| Rank | 1 | 2 | 3 | 4 | 5 | 6 | 7 | 8 |
| 8 MWh | 8.88 | 11.41 | 20.45 | 12.07 | 42.70 | 20.96 | 148.77 | 175.84 |
| Change (%) | 0.0 | 0.0 | −25.2 | −74.1 | −19.6 | −77.2 | 0.0 | 0.0 |
| Rank | 1 | 2 | 4 | 3 | 6 | 5 | 7 | 8 |
Table A5.
Ranking of electrical energy storage technologies for RMI abiotic with 2 and 8 MWh storage capacity.
Table A5.
Ranking of electrical energy storage technologies for RMI abiotic with 2 and 8 MWh storage capacity.
| RMIabiotic (kg·MWh−1) | SL-B | LiI-B | CA-S | H2-S | VRF-B | SNG-S | PbA | NaS-B |
|---|---|---|---|---|---|---|---|---|
| 2 MWh | 87 | 118 | 149 | 189 | 240 | 360 | 2414 | 269 |
| Rank | 1 | 2 | 3 | 4 | 5 | 7 | 8 | 6 |
| 8 MWh capacity | 87 | 118 | 64 | 48 | 88 | 80 | 2414 | 269 |
| Change (%) | 0.0 | 0.0 | −57.0 | −74.6 | −63.3 | −77.8 | 0.0 | 0.0 |
| Rank | 4 | 6 | 2 | 1 | 5 | 3 | 8 | 7 |
Table A6.
Ranking of electrical energy storage technologies for TMR abiotic with 2 and 8 MWh storage capacity.
Table A6.
Ranking of electrical energy storage technologies for TMR abiotic with 2 and 8 MWh storage capacity.
| TMRabiotic (kg·MWh−1) | SL-B | LiI-B | CA-S | H2-S | VRF-B | SNG-S | PbA | NaS-B |
|---|---|---|---|---|---|---|---|---|
| 2 MWh | 168 | 229 | 309 | 387 | 531 | 686 | 3411 | 595 |
| Rank | 1 | 2 | 3 | 4 | 5 | 7 | 8 | 6 |
| 8 MWh | 168 | 229 | 123 | 98 | 208 | 158 | 3411 | 595 |
| Change (%) | 0.0 | 0.0 | −60.2 | −75.7 | −60.8 | −77.0 | 0.0 | 0.0 |
| Rank | 4 | 6 | 2 | 1 | 5 | 3 | 8 | 7 |
Appendix B
Table A7.
Manufacturing, Intermodal container 40’ high cube.
| Unit | Amount | Process | |
|---|---|---|---|
| Inputs | |||
| steel, low-alloyed, hot rolled—GLO | kg | 1896 | market for steel, low-alloyed, hot rolled, cut-off, U-GLO |
| roundwood, meranti from sustainable forest management, under bark—GLO | m3 | 0.4 | market for roundwood, meranti from sustainable forest management, under bark, cut-off, U-GLO |
| Outputs | |||
| Intermodal container 40’ high-cube | Item (s) | 1 |
Table A8.
Manufacturing, Intermodal container 20’ high cube.
| Unit | Amount | Process | |
|---|---|---|---|
| Inputs | |||
| steel, low-alloyed, hot rolled—GLO | kg | 3232 | market for steel, low-alloyed, hot rolled, cut-off, U-GLO |
| roundwood, meranti from sustainable forest management, under bark—GLO | m3 | 0.8 | market for roundwood, meranti from sustainable forest management, under bark, cut-off, U-GLO |
| Outputs | |||
| Intermodal container 20’ high-cube | Item (s) | 1 |
Table A9.
Manufacturing, Electrolyseur.
| Unit | Amount | Process | |
|---|---|---|---|
| Inputs | |||
| transport, freight, sea, transoceanic ship—GLO | kg * km | 1.61 × 10⁸ | market for transport, freight, sea, transoceanic ship, cut-off, U-GLO |
| steel, chromium steel 18/8—GLO | t | 19.38 | market for steel, chromium steel 18/8, cut-off, U-GLO |
| steel, low-alloyed, hot rolled—GLO | t | 16.53 | market for steel. low-alloyed, hot rolled, cut-off, U-GLO |
| Iridium, in ground | g | 15.96 | |
| Platinum—GLO | g | 5.32 | market for platinum, cut-off, U-GLO |
| Intermodal container 40’ high-cube | Item(s) | 2 | Manufacturing, Intermodal container 40’ high cube |
| Outputs | |||
| Electrolyseur | Item (s) | 1 |
Table A10.
Production, Hydrogen.
| Unit | Amount | Process | |
|---|---|---|---|
| Inputs | |||
| water, ultrapure—DE | kg | 8.92 | water production for electrolysis, ultrapure—DE |
| Electrolyseur | Item (s) | 3.75 × 10⁻⁶ | Manufacturing, Electrolyseur |
| electricity, low voltage—DE | kWh | 0 | electricity voltage transformation from high to low voltage, wind power (1–3 MW) |
| Outputs | |||
| Hydrogen | kg | 1 |
Table A11.
Transport Hydrogen.
| Unit | Amount | Process | |
|---|---|---|---|
| Inputs | |||
| transport, pipeline, long distance, natural gas—DE | t * km | 0.05 | transport, pipeline, long distance, hydrogen, cut-off, U-DE |
| Hydrogen | kg | 1 | Production, Hydrogen |
| Outputs | |||
| Hydrogen, transported | kg | 1 |
Table A12.
Reconversion, Hydrogen.
| Unit | Amount | Process | |
|---|---|---|---|
| Inputs | |||
| Hydrogen, transported | kg | 266,717 | Transport, Hydrogen |
| heat and power co-generation unit, 1MW electrical, components for electricity only—RER | Item (s) | 1 | heat and power co-generation unit construction, 1MW electrical, components for electricity only, cut-off, U-RER |
| Outputs | |||
| electricity, high voltage—DE | MWh | 3557 |
Table A13.
Capturing CO2 from biogas.
| Unit | Amount | Process | |
|---|---|---|---|
| Inputs | |||
| electricity, low voltage—DE | kWh | 0.1136 | electricity voltage transformation from high to low voltage, wind power (1–3 MW) |
| Outputs | |||
| Captured CO2 | kg | 1 |
Table A14.
Production and Transport, SNG.
| Unit | Amount | Process | |
|---|---|---|---|
| Inputs | |||
| Captured CO2 | kg | 2.68 | Capturing CO2 from biogas |
| Hydrogen | kg | 0.5061 | Production, Hydrogen |
| transport, pipeline, long distance, natural gas—DE | t * km | 0.05 | transport, pipeline, SNG, cut-off, U-DE |
| synthetic gas factory—DE | Item (s) | 3.21 × 10⁻⁷ | synthetic gas factory construction, cut-off, U-DE |
| electricity, low voltage—DE | kWh | 0 | electricity voltage transformation from high to low voltage, wind power (1–3 MW) |
| Outputs | |||
| SNG | kg | 1 |
Table A15.
Reconversion, SNG.
| Unit | Amount | Process | |
|---|---|---|---|
| Inputs | |||
| SNG | t | 513 | Production and Transport, SNG |
| heat and power co-generation unit, 1MW electrical, components for electricity only—RER | Item (s) | 1 | heat and power co-generation unit construction, 1MW electrical, components for electricity only, cut-off, U-RER |
| Outputs | |||
| electricity, high voltage—DE | MWh | 2676 |
Table A16.
Manufacturing Electrode, PbA-B.
| Unit | Amount | Process | |
|---|---|---|---|
| Inputs | |||
| lead—RER | kg | 11.73 | treatment of scrap lead acid battery, remelting, cut-off, U-RER |
| graphite, battery grade—GLO | kg | 3.67 | market for graphite, battery grade, cut-off, U-GLO |
| lead—GLO | kg | 2.93 | primary lead production from concentrate, cut-off, U-GLO |
| sulfuric acid—GLO | kg | 2.20 | market for sulfuric acid, cut-off, U-GLO |
| water, ultrapure—GLO | kg | 1.47 | market for water, ultrapure, cut-off, U-GLO |
| heat, district or industrial, natural gas—RoW | kWh | 1.32 | market for heat, district or industrial, natural gas, cut-off, U-RoW |
| Outputs | |||
| Electrode, PbA-B | kg | 1 |
Table A17.
Manufacturing Electrolyte, PbA-B.
| Unit | Amount | Process | |
|---|---|---|---|
| Inputs | |||
| silica fume, densified—GLO | kg | 1.07 | market for silica fume, densified, cut-off, U-GLO |
| water, ultrapure—DE | kg | 0.7 | water production for electrolysis, ultrapure-DE |
| sulfuric acid—RER | kg | 0.3 | sulfuric acid production, cut-off, U-RER |
| Outputs | |||
| Electrolyte, PbA-B | kg | 1 |
Table A18.
Manufacturing, PbA-B.
| Unit | Amount | Process | |
|---|---|---|---|
| Inputs | |||
| heat, district or industrial, natural gas—RoW | MJ | 167.75 | market for heat, district or industrial, natural gas, cut-off, U-RoW |
| electricity, medium voltage—CN | MJ | 120.12 | market for electricity, medium voltage, cut-off, U-CN |
| Electrode, PbA-B | kg | 22 | Manufacturing Electrode, PbA-B |
| lead—RER | kg | 13.2 | treatment of scrap lead acid battery, remelting, cut-off, U-RER |
| Electrolyte, PbA-B | kg | 11 | Manufacturing Electrolyte, PbA-B |
| polypropylene, granulate—GLO | kg | 4.4 | market for polypropylene, granulate, cut-off, U-GLO |
| lead—GLO | kg | 3.3 | primary lead production from concentrate, cut-off, U-GLO |
| phenolic resin—GLO | kg | 1.1 | market for phenolic resin, cut-off, U-GLO |
| Outputs | |||
| PbA-B | Item (s) | 1 |
Table A19.
Manufacturing Storage, PbA-B.
| Unit | Amount | Process | |
|---|---|---|---|
| Inputs | |||
| PbA-B | Item (s) | 6.739 | Manufacturing, PbA-B |
| Intermodal container 40’ high-cube | Item (s) | 2 | Manufacturing, Intermodal container 40’ high cube |
| transport, freight, sea, transoceanic ship—GLO | kg * km | 7.92 × 10⁹ | market for transport, freight, sea, transoceanic ship, cut-off, U-GLO |
| Outputs | |||
| Storage, PbA-B | Item (s) | 1 |
Table A20.
Use Storage, PbA-B.
| Unit | Amount | Process | |
|---|---|---|---|
| Inputs | |||
| Storage, PbA-B | Item (s) | 1 | Manufacturing Storage, PbA-B |
| electricity, high voltage—DE | MWh | 0 | electricity production, wind, 1–3 MW turbine, onshore, cut-off, U-DE |
| Outputs | |||
| electricity, high voltage—DE | MWh | 11,899 |
Table A21.
Manufacturing, VRF-B.
| Unit | Amount | Process | |
|---|---|---|---|
| Inputs | |||
| water, ultrapure—DE | kg | 62,506 | water production for electrolysis, ultrapure—DE |
| sulfuric acid—RER | kg | 33,906 | sulfuric acid production, cut-off, U-RER |
| steel, low-alloyed, hot rolled—GLO | kg | 13,978 | market for steel, low-alloyed, hot rolled, cut-off, U-GLO |
| vanadium pentoxide | kg | 13,161 | vanadium pentoxide, production |
| copper—GLO | kg | 7360 | market for copper, cut-off, U-GLO |
| polypropylene, granulate—GLO | kg | 3333 | market for polypropylene, granulate, cut-off, U-GLO |
| graphite, battery grade—GLO | kg | 2400 | market for graphite, battery grade, cut-off, U-GLO |
| heat, district or industrial, natural gas—RoW | GJ | 1929.58 | market for heat, district or industrial, natural gas, cut-off, U-RoW |
| electricity, medium voltage—CN | GJ | 516.25 | market for electricity, medium voltage, cut-off, U-CN |
| Outputs | |||
| VRF-B | Item (s) | 1 |
Table A22.
Manufacturing Storage, VRF-B.
| Unit | Amount | Process | |
|---|---|---|---|
| Inputs | |||
| VRF-B | Item (s) | 2.11 | Manufacturing, VRF-B |
| Intermodal container 20’ high-cube | Item (s) | 10 | Manufacturing, Intermodal container 20’ high cube |
| transport, freight, sea, transoceanic ship—GLO | kg * km | 7.28 × 10⁹ | market for transport, freight, sea, transoceanic ship, cut-off, U-GLO |
| Outputs | |||
| Storage, VRF-B | Item (s) | 1 |
Table A23.
Use Storage, VRF-B.
| Unit | Amount | Process | |
|---|---|---|---|
| Inputs | |||
| Storage, VRF-B | Item (s) | 1 | Manufacturing Storage, VRF-B |
| electricity, high voltage—DE | MWh | 0 | electricity production, wind, 1–3 MW turbine, onshore, cut-off, U-DE |
| Outputs | |||
| electricity, high voltage—DE | MWh | 11,240 |
Table A24.
Manufacturing, LiI-B.
| Unit | Amount | Process | |
|---|---|---|---|
| Inputs | |||
| anode, graphite, for lithium-ion battery—GLO | kg | 0.4011 | market for anode, graphite, for lithium-ion battery, cut-off, U-GLO |
| cathode, LiMn2O4, for lithium-ion battery—GLO | kg | 0.3269 | market for cathode, LiMn2O4, for lithium-ion battery, cut-off, U-GLO |
| ethylene carbonate—GLO | kg | 0.1596 | market for ethylene carbonate, cut-off, U-GLO |
| electricity, medium voltage—CN | kWh | 0.1056 | market for electricity, medium voltage, cut-off, U-CN |
| polyethylene, low density, granulate—GLO | kg | 0.0733 | market for polyethylene, low density, granulate, cut-off, U-GLO |
| extrusion, plastic film—GLO | kg | 0.0733 | market for extrusion, plastic film, cut-off, U-GLO |
| heat, district or industrial, natural gas—RoW | MJ | 0.0652 | market for heat, district or industrial, natural gas, cut-off, U-RoW |
| battery separator—GLO | kg | 0.0537 | market for batt. sep., cut-off, U-GLO |
| lithium hexafluorophosphate—GLO | kg | 0.0190 | market for lithium hexafluorophosphate, cut-off, U-GLO |
| sheet rolling, aluminium—GLO | kg | 0.0165 | market for sheet rolling, aluminium, cut-off, U-GLO |
| aluminium, wrought alloy—GLO | kg | 0.0165 | market for aluminium, wrought alloy, cut-off, U-GLO |
| nitrogen, liquid—RoW | kg | 0.01 | market for nitrogen, liquid, cut-off, U-RoW |
| chemical factory, organics—GLO | Item (s) | 4.00 × 10⁻¹⁰ | market for chemical factory, organics, cut-off, U-GLO |
| Outputs | |||
| LiI-B | Item (s) | 1 |
Table A25.
Manufacturing Storage, LiI-B.
| Unit | Amount | Process | |
|---|---|---|---|
| Inputs | |||
| LiI-B | kg | 34,800 | Manufacturing, LiI-B |
| Intermodal container 40’ high-cube | Item (s) | 1 | Manufacturing, Intermodal container 40’ high cube |
| transport, freight, sea, transoceanic ship—GLO | kg * km | 8.09 × 10⁸ | market for transport, freight, sea, transoceanic ship, cut-off, U-GLO |
| Outputs | |||
| Storage, LiI-B | Item (s) | 1 |
Table A26.
Use Storage, LiI-B.
| Unit | Amount | Process | |
|---|---|---|---|
| Inputs | |||
| Storage, LiI-B | Item (s) | 1 | Manufacturing Storage, LiI-B |
| electricity, high voltage—DE | MWh | 0 | electricity production, wind, 1–3 MW turbine, onshore, cut-off, U-DE |
| Outputs | |||
| electricity, high voltage—DE | MWh | 13,651 |
Table A27.
Manufacturing, NaS-B.
| Unit | Amount | Process | |
|---|---|---|---|
| Inputs | |||
| heat, district or industrial, natural gas—RoW | MJ | 495 | market for heat, district or industrial, natural gas, cut-off, U-RoW |
| electricity, medium voltage—CN | MJ | 81.41 | market for electricity, medium voltage, cut-off, U-CN |
| steel, chromium steel 18/8—GLO | kg | 1.6324 | market for steel, chromium steel 18/8, cut-off, U-GLO |
| sulfur—GLO | kg | 1.0547 | market for sulfur, cut-off, U-GLO |
| aluminium oxide—GLO | kg | 0.9635 | market for aluminium oxide, cut-off, U-GLO |
| sodium—GLO | kg | 0.6307 | market for sodium, cut-off, U-GLO |
| glass, borosilicate | kg | 0.3392 | glass, borosilicate, cut-off, U-RoW |
| aluminium oxide—GLO | kg | 0.2332 | market for aluminium oxide, cut-off, U-GLO |
| graphite, battery grade—GLO | kg | 0.2067 | market for graphite, battery grade, cut-off, U-GLO |
| copper—GLO | kg | 0.1325 | market for copper, cut-off, U-GLO |
| sodium aluminate, powder—GLO | kg | 0.0857 | market for sodium aluminate, powder, cut-off, U-GLO |
| magnesium oxide—GLO | kg | 0.0214 | market for magnesium oxide, cut-off, U-GLO |
| Outputs | |||
| NaS-B | Item (s) | 1 |
Table A28.
Manufacturing Storage, NaS-B.
| Unit | Amount | Process | |
|---|---|---|---|
| Inputs | |||
| steel, low-alloyed, hot rolled—GLO | t | 7.2 | market for steel, low-alloyed, hot rolled, cut-off, U-GLO |
| sand—GLO | kg | 141,000 | market for sand, cut-off, U-GLO |
| steel, chromium steel 18/8—GLO | kg | 4982 | market for steel, chromium steel 18/8, cut-off, U-GLO |
| battery cell, NaS—JP | Item (s) | 36,096 | Battery cell production, NaS-JP |
| transport, freight, sea, transoceanic ship—GLO | kg * km | 4.03 × 10⁹ | market for transport, freight, sea, transoceanic ship, cut-off, U-GLO |
| Outputs | |||
| Storage, NaS-B | Item (s) | 1 |
Table A29.
Use Storage, NaS-B.
| Unit | Amount | Process | |
|---|---|---|---|
| Inputs | |||
| Storage, NaS-B | Item (s) | 1 | Manufacturing Storage, NaS-B |
| electricity, high voltage—DE | MWh | 0 | electricity production, wind, 1–3 MW turbine, onshore, cut-off, U-DE |
| Outputs | |||
| electricity, high voltage—DE | MWh | 11,169 |
Table A30.
Manufacturing, CA-S.
| Unit | Amount | Process | |
|---|---|---|---|
| Inputs | |||
| transport, freight, sea, transoceanic ship—GLO | kg * km | 1.61 × 10⁸ | market for transport, freight, sea, transoceanic ship, cut-off, U-GLO |
| naphtha—RoW | kg | 44,640 | market for naphtha, cut-off, U-RoW |
| steel, low-alloyed, hot rolled—GLO | kg | 6052 | market for steel, low-alloyed, hot rolled, cut-off, U-GLO |
| polyethylene terephthalate, granulate, amorphous—RER | kg | 3317 | polyethylene terephthalate production, granulate, amorphous, cut-off, U-RER |
| nylon 6-6—RER | kg | 3103 | nylon 6-6 production, cut-off, U-RER |
| steel, chromium steel 18/8—GLO | kg | 2253 | market for steel, chromium steel 18/8, cut-off, U-GLO |
| electric motor, electric passenger car—GLO | kg | 996 | electric motor production, vehicle (electric powertrain), cut-off, U-GLO |
| air compressor, screw-type compressor, 300 kW—RER | Item (s) | 6.27 | air compressor production, screw-type compressor, 300 kW, cut-off, U-RER |
| generator, 200 kW electrical—RER | Item (s) | 5.36 | generator production, 200 kW electrical, cut-off, U-RER |
| air compressor, screw-type compressor, 300 kW—RER | Item (s) | 4.3 | air compressor production, screw-type compressor, 300 kW, cut-off, U-RER |
| Intermodal container 40’ high-cube | Item (s) | 2 | Manufacturing, Intermodal container 40’ high cube |
| Outputs | |||
| CA-S | Item (s) | 1 |
Table A31.
Use, CA-S.
| Unit | Amount | Process | |
|---|---|---|---|
| Inputs | |||
| CA-S | Item (s) | 1 | Manufacturing, CA-S |
| electricity, high voltage—DE | kWh | 0 | electricity production, wind, 1–3 MW turbine, onshore, cut-off, U-DE |
| Outputs | |||
| electricity, high voltage—DE | MWh | 7826 |
Table A32.
Manufacturing Storage, SL-B.
| Unit | Amount | Process | |
|---|---|---|---|
| Inputs | |||
| battery cell, Li-ion—CN | kg | 25,000 | battery cell production, Li-ion, cut-off, U _w/o used battery—CN |
| Intermodal container 40’ high-cube | Item (s) | 2 | Manufacturing, Intermodal container 40’ high cube |
| transport, freight, sea, transoceanic ship—GLO | kg * km | 6.84 × 10⁸ | market for transport, freight, sea, transoceanic ship, cut-off, U-GLO |
| Outputs | |||
| Storage, SL-B | Item (s) | 1 |
Table A33.
Use Storage, SL-B.
| Unit | Amount | Process | |
|---|---|---|---|
| Inputs | |||
| Storage, SL-B | Item (s) | 1 | Manufacturing storage, SL-B |
| electricity, high voltage—DE | MWh | 0 | electricity production, wind, 1–3 MW turbine, onshore, cut-off, U-DE |
| Outputs | |||
| electricity, high voltage—DE | MWh | 13,651 |
References
- BMWI Federal Ministry for Economic Affairs and Energy (Ed.) Making a Success of the Energy Transition. On the Road to a Secure, Clean and Affordable Energy Supply; BMWI Federal Ministry for Economic Affairs and Energy: Berlin, Germany, 2015. [Google Scholar]
- Bundesnetzagentur for Electricity, Gas, Telecommunications, Post and Railway (Ed.) 3. Quartalsbericht 2015 zu Netz-und Systemsicherheitsmaßnahmen. Viertes Quartal Sowie Gesamtjahresbetrachtung 2015; Bundesnetzagentur for Electricity, Gas, Telecommunications, Post and Railway: Bonn, Germany, 2016. [Google Scholar]
- Antoni, O.; Hilpert, J.; Kahle, M.; Klobasa, M.; Eße, A. Gutachten zu Zuschaltbaren Lasten-für das Ministerium für Energiewende, Landwirtschaft, Umwelt und Ländliche Räume des Landes Schleswig-Holstein; Stiftung Umweltenergierecht, Fraunhofer Institut für System-und Innovationsforschung ISI: Würzburg/Karlsruhe, Germany, 2016. [Google Scholar]
- Michael, S.; Ingo, S. Energiespeicher-Bedarf, Technologien, Integration; Springer: Berlin, Germany, 2014. [Google Scholar] [CrossRef]
- Schill, W.-P. Systemintegration erneuerbarer Energien-Die Rolle von Speichern für die Energiewende. Vierteljahrsh. Wirtsch. 2013, 82, 61–88. [Google Scholar] [CrossRef] [Green Version]
- Finkbeiner, M.; Inaba, A.; Tan, R.; Christiansen, K.; Klüppel, H.-J. The new international standards for life cycle assessment: ISO 14040 and ISO 14044. Int. J. Life Cycle Assess. 2006, 11, 80–85. [Google Scholar] [CrossRef]
- Rydh, C.J. Environmental assessment of vanadium redox and lead-acid batteries for stationary energy storage. J. Power Sources 1999, 80, 21–29. [Google Scholar] [CrossRef]
- Andersson, B.A.; Råde, I. Metal resource constraints for electric-vehicle batteries. Transp. Res. Part D Transp. Environ. 2001, 6, 297–324. [Google Scholar] [CrossRef]
- Rydh, C.; Svard, B. Impact on global metal flows arising from the use of portable rechargeable batteries. Sci. Total Environ. 2003, 302, 167–184. [Google Scholar] [CrossRef]
- Denholm, P.; Kulcinski, G.L. Life cycle energy requirements and greenhouse gas emissions from large scale energy storage systems. Energy Convers. Manag. 2004, 45, 2153–2172. [Google Scholar] [CrossRef]
- Rydh, C.J.; Sandén, B.A. Energy analysis of batteries in photovoltaic systems. Part I. Performance and energy requirements. Energy Convers. Manag. 2005, 46, 1957–1979. [Google Scholar] [CrossRef]
- Sullivan, J.L.; Gaines, L. Status of life cycle inventories for batteries. Energy Convers. Manag. 2012, 58, 134–148. [Google Scholar] [CrossRef]
- Sternberg, A.; Bardow, A. Power-to-What?—Environmental assessment of energy storage systems. Energy Environ. Sci. 2015, 8, 389–400. [Google Scholar] [CrossRef]
- Hiremath, M.; Derendorf, K.; Vogt, T. Comparative life cycle assessment of battery storage systems for stationary applications. Environ. Sci. Technol. 2015, 49, 4825–4833. [Google Scholar] [CrossRef]
- Wiesen, K.; Wirges, M. From cumulated energy demand to cumulated raw material demand. The material footprint as a sum parameter in life cycle assessment. Energy Sustain. Soc. 2017, 7. [Google Scholar] [CrossRef]
- Ekins, P.; Hughes, N.; Brigenzu, S.; Arden Clark, C.; Fischer-Kowalski, M.; Graedel, T.; Hajer, M.; Hashimoto, S.; UNEP. Resource Efficiency: Potential and Economic Implications; A Report of the International Resource Panel; UN Environment: Nairobi, Kenya, 2017. [Google Scholar]
- BMUB Federal Ministry for the Environment, Nature Conservation, Building and Nuclear Safety (Ed.) German Resource Efficiency Programme II-Programme for the Sustainable Use and Conservation of Natural Resources; BMUB Federal Ministry for the Environment, Nature Conservation, Building and Nuclear Safety: Berlin, Germany, 2016.
- Wiesen, K.; Teubler, J.; Rohn, H. Resource Use of Wind Farms in the German North Sea—The Example of Alpha Ventus and Bard Offshore I. Resources 2013, 2, 504–516. [Google Scholar] [CrossRef] [Green Version]
- Eurostat (Ed.) Economy-Wide Material Flow Accounts and Derived Indicators. A Methodological Guide; Office for Official Publications of the European Communities: Luxembourg, 2001. [Google Scholar]
- Eurostat (Ed.) Economy-Wide Material Flow Accounts (EW-MFA); Compilation Guide 2013; Eurostat: Luxembourg, 2013. [Google Scholar]
- OECD Organisation for Economic Co-operation and Development (Ed.) Measuring Material Flows and Resource Productivity; The OECD Guide; OECD Organisation for Economic Co-operation and Development: Paris, France, 2008; Volume I. [Google Scholar]
- VDI. VDI 4800 Part 2, 2018: Resource Efficiency—Evaluation of Raw Material Demand; Beuth: Berlin, Germany, 2018. [Google Scholar]
- Sameer, H.; Bringezu, S. Life cycle input indicators of material resource use for enhancing sustainability assessment schemes of buildings. J. Build. Eng. 2018, 21, 230–242. [Google Scholar] [CrossRef]
- Bringezu, S.; Schütz, H.; Moll, S. Rationale for and Interpretation of Economy-Wide Materials Flow Analysis and Derived Indicators. J. Ind. Ecol. 2003, 7, 43–64. [Google Scholar] [CrossRef]
- Palizban, O.; Kauhaniemi, K. Energy storage systems in modern grids-Matrix of technologies and applications. J. Energy Storage 2016, 6, 248–259. [Google Scholar] [CrossRef]
- Lewandowska-Bernat, A.; Desideri, U. Opportunities of Power-to-Gas technology. Energy Procedia 2017, 105, 4569–4574. [Google Scholar] [CrossRef]
- Sauer, D.U.; Fuchs, G.; Lunz, B.; Leuthold, M. Technology Overview on Electricity Storage—Overview on the Potential and on the Deployment Perspectives of Electricity Storage Technologies; On Behalf of Smart Energy for Europe Platform GmbH (SEFEP); Institute for Power Electronics and Electrical Drives (ISEA), RWTH Aachen University: Aachen, Germany, 2012. [Google Scholar] [CrossRef]
- Hartmann, N.; Eltrop, L.; Bauer, N.; Salzer, J.; Schwarz, S.; Schmidt, M. Stromspeicherpotenziale für Deutschland; Zentrum für Energieforschung (ZfES): Stuttgart, Germany, 2012. [Google Scholar]
- Fischhaber, S.; Regett, A.; Schuster, S.; Hesse, H. Studie: Second-Life-Konzepte für Lithium-Ionen-Batterien aus Elektrofahrzeugen. Analyse von Nachnutzungsanwendungen, ökonomischen und ökologischen Potenzialen; Ergebnispapier Nr. 18. Begleit- und Wirkungsforschung Schaufenster Elektromobilität (BuW); Deutsches Dialog Institut GmbH: Frankfurt am Main, Germany, 2016. [Google Scholar]
- Kumara, D.; Rajouriab, S.K.; Kuharc, S.B.; Kanchand, D.K. Progress and prospects of sodium-sulfur batteries. A review. Solid State Ion. 2017, 312, 8–16. [Google Scholar] [CrossRef]
- Battke, B.; Schmidt, T.S.; Grosspietsch, D.; Hoffmann, V.H. A review and probabilistic model of lifecycle costs of stationary batteries in multiple applications. Renew. Sustain. Energy Rev. 2013, 25, 240–250. [Google Scholar] [CrossRef]
- Alami, A.H. Experimental assessment of compressed air energy storage (CAES) system and buoyancy work energy storage (BWES) as cellular wind energy storage options. J. Energy Storage 2015, 1, 38–43. [Google Scholar] [CrossRef]
- Wang, Z.; Xiong, W.; Ting, D.S.-K.; Carriveau, R.; Wang, Z. Conventional and advanced exergy analyses of an underwater compressed air energy storage system. Appl. Energy 2016, 180, 810–822. [Google Scholar] [CrossRef]
- Pimm, A.J.; Garvey, S.D.; de Jong, M. Design and testing of Energy Bags for under water compressed air energy storage. Energy 2014, 66, 496–508. [Google Scholar] [CrossRef]
- DIN EN ISO 14044: Environmental Management—Life Cycle Assessment—Requirements and Guidelines (ISO 14044:2006); German and English Version EN ISO 14044:2006; International Organization for Standardization: Geneva, Switzerland, 2006.
- Watter, H. Regenerative Energiesysteme Grundlagen, Systemtechnik und Analysen Ausgeführter Beispiele Nachhaltiger Energiesysteme; Springer: Wiesbaden, Germany, 2015. [Google Scholar]
- DIN EN ISO 14040: Environmental Management-Life Cycle Assessment-Principles and Framework (ISO 14040:2006), German and English version EN ISO 14040:2006; International Organization for Standardization: Geneva, Switzerland, 2006.
- European Commission (Ed.) ILCD Handbook. International Reference Life Cycle Data System. Recommendations for Life Cycle Impact Assessment in the European Context; Publications Office of the European Union, Joint Research Centre-Institute for Environment and Sustainability: Luxemburg, 2011. [Google Scholar]
- Myhre, G.; Shindell, D. Anthropogenic and Natural Radiative Forcing. In Climate Change 2013 The Physical Science Basis; Intergovernmental Panel on Climate Change, Ed.; Working Group I Contribution to the Fifth Assessment Report; Intergovernmental Panel on Climate Change: New York, NY, USA, 2013; pp. 659–740. [Google Scholar]
- Saurat, M.; Ritthoff, M. Calculating MIPS 2.0. Resources 2013, 581–607. [Google Scholar] [CrossRef]
- Klaus, W.; Saurat, M.; Lettenmeier, M. Calculating Material Input per Service Unit using the Ecoinvent database. Int. J. Perform. Eng. 2014, 10, 357–366. [Google Scholar]
- Schoer, K.; Giegrich, J.; Kovanda, J.; Lauwigi, C.; Liebich, A.; Buyny, S.; Matthias, J. Conversion of European Productflows into Raw Material Equivalents; Final Report of the Project: Assistance in the Development and Maintenance of Raw Material Equivalents Conversion Factors and Calculation of RMC Time Series; ifeu-Institut für Energie-und Umweltforschung: Heidelberg, Germany, 2012. [Google Scholar]
- Hanisch, C.; Diekmann, J.; Stieger, A.; Haselrieder, W.; Kwade, A. Recycling of Lithium-Ion Batteries. In Handbook of Clean Energy Systems; Yan, J., Ed.; Wiley: Chichester, UK, 2015; Volume 5. [Google Scholar]
- May, G.J.; Davidson, A.; Monahov, B. Lead batteries for utility energy storage. A review. J. Energy Storage 2018, 15, 145–157. [Google Scholar] [CrossRef]
- German Bundestag. The Batteries Act [Gesetz über das Inverkehrbringen, die Rücknahme und die Umweltverträgliche Entsorgung von Batterien und Akkumulatoren. (Batteriegesetz-BattG)]; Federal Ministry of Justice and Consumer Protection: Berlin, Germany, 2009.
Figure 1.
Product system, system boundary and flows.

Figure 2.
Global warming impact GWI per fed-out electricity of electrical energy storage technologies.
Figure 2.
Global warming impact GWI per fed-out electricity of electrical energy storage technologies.

Figure 3.
Raw material input abiotic RMIabiotic and total material requirement abiotic TMRabiotic per fed-out electricity of electrical energy storage technologies.
Figure 3.
Raw material input abiotic RMIabiotic and total material requirement abiotic TMRabiotic per fed-out electricity of electrical energy storage technologies.

Figure 4.
Raw material input biotic RMIbiotic and total material requirement biotic TMRbiotic per fed-out electricity of electrical energy storage technologies.
Figure 4.
Raw material input biotic RMIbiotic and total material requirement biotic TMRbiotic per fed-out electricity of electrical energy storage technologies.

Figure 5.
Change in global warming impact GWI per fed-out electricity for shorter and longer lifetime of electrical energy storage technologies.
Figure 5.
Change in global warming impact GWI per fed-out electricity for shorter and longer lifetime of electrical energy storage technologies.

Figure 6.
Change in raw material input abiotic RMIabiotic per fed-out electricity for shorter and longer lifetime of electrical energy storage technologies.
Figure 6.
Change in raw material input abiotic RMIabiotic per fed-out electricity for shorter and longer lifetime of electrical energy storage technologies.

Figure 7.
Change in global warming impact GWI per fed-out electricity for increasing the storage capacity of electrical energy storage technologies from 2 to 8 MWh.
Figure 7.
Change in global warming impact GWI per fed-out electricity for increasing the storage capacity of electrical energy storage technologies from 2 to 8 MWh.

Figure 8.
Change in the raw material input abiotic RMIabiotic per fed-out electricity for increasing storage capacity of electrical energy storage technologies from 2 to 8 MWh.
Figure 8.
Change in the raw material input abiotic RMIabiotic per fed-out electricity for increasing storage capacity of electrical energy storage technologies from 2 to 8 MWh.

| Characteristic | SL-B | LiI-B | CA-S | H2-S | VRF-B | SNG-S | PbA-B | NaS-B |
|---|---|---|---|---|---|---|---|---|
| Number of products (20 years operating time) | 2.00 | 1.70 | 1.00 | 1.00 | 2.10 | 1.00 | 5.80 | 2.40 |
| Nominal storage capacity (MWh) | 2.50 | 2.50 | 2.00 | 2.00 | 2.50 | 2.00 | 2.50 | 2.50 |
| Charged energy amount per day (MWh) | 2.00 | 2.00 | 2.00 | 2.00 | 2.00 | 2.00 | 2.00 | 2.00 |
| Efficiency (%) | 93.50 | 93.50 | 53.60 | 24.40 | 77.00 | 18.30 | 81.50 | 76.50 |
| Discharged energy amount per day (MWh) | 1.87 | 1.87 | 1.07 | 0.49 | 1.54 | 0.37 | 1.63 | 1.53 |
| Max. discharge power (MW) | 1.34 | 1.34 | 1.07 | 1.00 | 0.17 | 1.00 | 1.00 | 0.26 |
| Duration at max. discharge power (h) | 1.40 | 1.40 | 1.00 | 0.49 | 9.00 | 0.37 | 1.63 | 6.00 |
Table 2.
Ranking of electrical energy storage technologies regarding carbon and material footprint.
| Footprint | Impact Indicator | SL-B | LiI-B | CA-S | H2-S | VRF-B | SNG-S | PbA-B | NaS-B |
|---|---|---|---|---|---|---|---|---|---|
| Carbon | GWI | 1 | 2 | 3 | 4 | 5 | 6 | 7 | 8 |
| Material | RMI, TMR | 1 | 2 | 3 | 4 | 5 | 7 | 8 | 6 |
| EEST | Efficiency (%) | Lifetime (Number of Products for 20 Years Operating Time) | ||||
|---|---|---|---|---|---|---|
| Normal | Minimum | Maximum | Normal | Longer | Shorter | |
| SL-B | 93.50 | 90.00 | 97.00 | 2.0 | 1.3 | 7.5 |
| Lil-B | 93.50 | 90.00 | 97.00 | 1.7 | 1.3 | 7.5 |
| CA-S | 53.60 | 50.90 | 56.30 | 1.0 | 1.0 | 2.0 |
| H2-S | 24.40 | 23.20 | 25.60 | 1.3 | 1.0 | 2.0 |
| VRF-B | 77.00 | 71.00 | 83.00 | 2.1 | 2.0 | 4.0 |
| SNG-S | 18.30 | 17.40 | 19.20 | 1.0 | 1.0 | 2.0 |
| PbA-B | 81.50 | 74.00 | 89.00 | 5.8 | 3.7 | 14.6 |
| NaS-B | 76.50 | 72.00 | 81.00 | 2.4 | 1.5 | 4.0 |
© 2018 by the authors. Licensee MDPI, Basel, Switzerland. This article is an open access article distributed under the terms and conditions of the Creative Commons Attribution (CC BY) license (http://creativecommons.org/licenses/by/4.0/).
Share and Cite
MDPI and ACS Style
Mostert, C.; Ostrander, B.; Bringezu, S.; Kneiske, T.M. Comparing Electrical Energy Storage Technologies Regarding Their Material and Carbon Footprint. Energies 2018, 11, 3386. https://doi.org/10.3390/en11123386
AMA Style
Mostert C, Ostrander B, Bringezu S, Kneiske TM. Comparing Electrical Energy Storage Technologies Regarding Their Material and Carbon Footprint. Energies. 2018; 11(12):3386. https://doi.org/10.3390/en11123386
Chicago/Turabian StyleMostert, Clemens, Berit Ostrander, Stefan Bringezu, and Tanja Manuela Kneiske. 2018. "Comparing Electrical Energy Storage Technologies Regarding Their Material and Carbon Footprint" Energies 11, no. 12: 3386. https://doi.org/10.3390/en11123386
Note that from the first issue of 2016, this journal uses article numbers instead of page numbers. See further details here.