Communication

Enhancing Stability of Microalgae Biocathode by a Partially Submerged Carbon Cloth Electrode for Bioenergy Production from Wastewater

1
School of Environmental Science and Engineering, Guangdong University of Technology, Guangzhou 510006, China
2
School of Chemical Engineering and Light Industry, Guangdong University of Technology, Guangzhou 510006, China
3
Analysis and Test Center, Guangdong University of Technology, Guangzhou 510006, China
*
Author to whom correspondence should be addressed.
Energies 2019, 12(17), 3229; https://doi.org/10.3390/en12173229
Submission received: 18 June 2019 / Revised: 24 July 2019 / Accepted: 2 August 2019 / Published: 22 August 2019
(This article belongs to the Special Issue Advanced Biofuels: Microalgae, Drop-In and Bioelectro Approaches)

Abstract

:
The electricity output from microbial fuel cell (MFC) with a microalgae assisted cathode is usually higher than that with an air cathode. The output of electricity from a photosynthetic microalgae MFC was positively correlated with the dissolved oxygen (DO) level in the microalgae assisted biocathode. However, DO is highly affected by the photosynthesis of microalgae, leading to the low stability in the electricity output that easily varies with the change in microalgae growth. In this study, to improve the electricity output stability of the MFC, a partially submerged carbon cloth cathode electrode was first investigated to use oxygen from both microalgae and air, with synthetic piggery wastewater used as the anolyte and anaerobically digested swine wastewater as the catholyte. When the DO levels dropped from 13.6–14.8 to 1.0–1.6 mg/L, the working voltages in the MFCs with partially submerged electrodes remained high (256–239 mV), whereas that for the conventional completely submerged electrodes dropped from 259 to 102 mV. The working voltages (average, 297 ± 26 mV) of the MFCs with the 50% submerged electrodes were significantly (p < 0.05) higher than with other partially or completely submerged electrodes. The associated maximum lipid production from wastewater was 250 ± 42 mg/L with lipid content of 41 ± 6% dry biomass. Although the partially submerged electrode had no significant effects on lipid production or nitrogen removal in wastewater, there was significant improvement in the stability of the electricity generated under variable conditions.

Graphical Abstract

1. Introduction

Microbial fuel cell (MFC) is an attractive technology for sustainable development [1,2] that could be applied to wastewater treatment with bioelectricity generation [3,4]. Photosynthetic microalgae microbial fuel cell (MFC) could produce microbial lipid (could be converted to biodiesel [5]) and algal biomass besides electricity, while reducing greenhouse gas CO2 by photosynthesis [6,7]. Many studies have demonstrated that the bioelectricity generation was correlated with oxygen availability in the cathode as O2 is the electron acceptor [8,9,10]. Due to the high DO generated from photosynthesis, power generation of MFC with microalgae biocathode was reported to be higher than that of MFC with mechanical aeration cathode [8,11], abiotic-cathode, or air-cathode [12,13].
However, there are limits to the application of a microalgae biocathode because the dissolved oxygen (DO) level in the microalgae assisted cathode is significantly affected by microalgae growth and photosynthesis, resulting in the relatively low stability of the system [6]. A previous study has shown that when DO fell from 22.5 mg/L to 3.7 mg/L after the microalgae enter the dead phase of the growth cycle, open circuit voltage of the biocathode MFC decreased from 260 mV to 70 mV [9]. In addition, no electricity output was detected for the microalgae biocathode MFC when DO in microalgae biocathode dropped to zero during the darkness period (nighttime), although the open circuit voltage/potential increased to 544–700 mV during optimal microalgae growth with sufficient light supply [7,8,12]. On the other hand, wastewater, especially liquid digestate from pig farms, is difficult to treat due to the low C/N ratio, and microalgae grown in biocathode chamber have been shown effective for nitrogen removal in deficiency of organic carbon [14,15]. As MFC is often used for wastewater treatment, the variations in wastewater as catholyte and environmental conditions (such as temperature, light density, and day and night periods) could also contribute to the fluctuations in DO by microalgae, resulting in the unstable performance of the biocathode when using a conventional completely submerged electrode [6,8].
In this study, to improve the stability of the microalgae assisted cathode, a partially submerged carbon cloth cathode electrode was applied in a multi-purpose MFC system, which produces electricity, algal biomass and lipids, and removes nitrogen in anaerobically digested swine wastewater (as the catholyte). The carbon cloth electrode was completely permeated with catholyte by capillary action regardless of the level of submersion or of exposure to the air. This made it possible to use both DO from algae in catholyte and oxygen from the air for the cathodic reaction, rather than from only the catholyte as is the case with using the conventional completely submerged electrode. The influences of the submerged proportion of the cathode electrode on bioelectricity generation, algal biomass, and lipid production were evaluated. The working voltage was chosen as the main criteria for electricity generation because it is an important parameter for MFC performance and is more sensitive to the change of O2 availability for the cathodic reaction compared to the open circuit voltage/potential. The associated nitrogen removal and enhancement on organic matter to nitrogen ratio of unpasteurized anaerobically digested piggery wastewater fed into the cathode chamber were also assessed.

2. Materials and Methods

2.1. Microorganism, Medium, and Wastewater

The microalgae strain Chlorella pyrenoidosa FACHB-9 was purchased from the Institute of Hydrobiology (Chinese Academy of Sciences, China). It was cultured in BG11 medium [12] at 30 °C, under continuous light (light intensity 5000 lux) for about 7 days (about 0.2 g/L dry biomass) and used as seed for the cathode chamber.
Both the seeding anaerobic sludge for the anode and anaerobically digested swine wastewater (ADSW) for the cathode were collected from a pig farm located in Yunfu City, Guangdong, China. The ADSW fed into cathode contained a soluble chemical oxygen demand (SCOD) of 486–662 mg/L, total nitrogen (TN) of 705–788 mg/L, ammonia nitrogen (NH3-N) of 541–650 mg/L and total phosphorus (TP) of 38–108 mg/L, with a pH about 7.6 adjusted to 7.0 by 1 M HCl. The wastewater samples were filtered through 5 layers of filter paper (10–15 µm pore size cotton-fiber) and stored at 4 °C before use. The synthetic swine wastewater fed into the anode was prepared following Sotres et al. (2016) [16], which contained 6.44 g/L sodium acetate, 0.665 g/L NH4Cl, 0.147 g/L CaCl2, 0.246 g/L MgSO4, 3 g/L KH2PO4, 6 g/L Na2HPO4 and 1mL/L trace element solution.

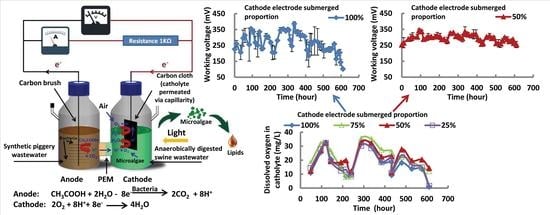
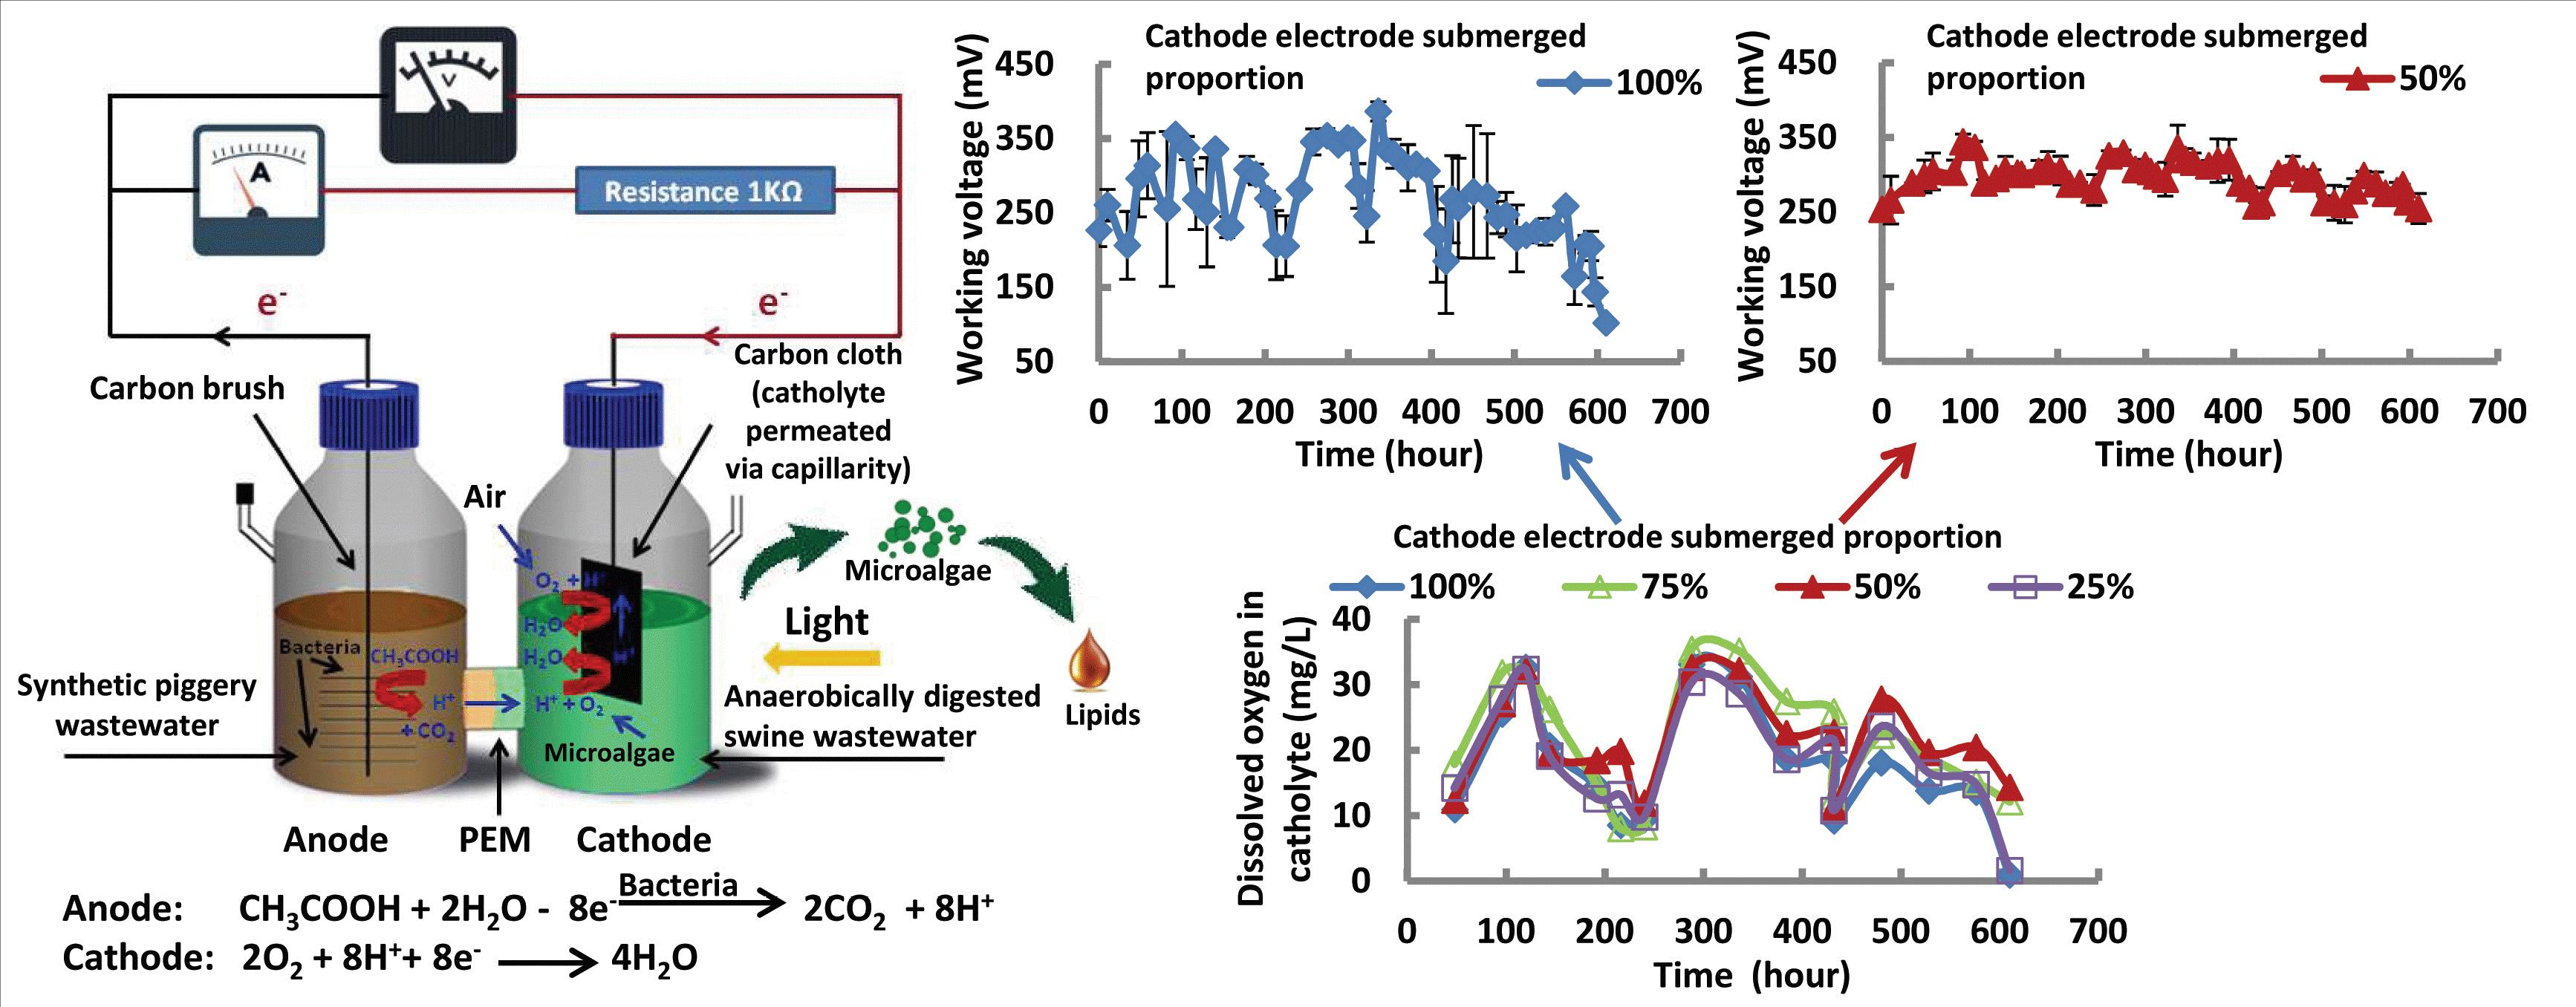
2.2. Configuration of Microbial Fuel Cells

The eight identical MFCs used were made of two glass bottles with equal volume (1 L) and a glass channel (diameter, 2 cm; length, 8 cm) in between with a proton exchange membrane (PEM, Nafion 117, Sigma-Aldrich, St. Louis, USA) fixed in the middle (Figure 1). A 24.5 cm long carbon brush (diameter, 5 cm) with a 19 cm long Ti handle was used as the anode electrode. The cathode electrode was constructed with a piece of carbon fiber cloth (64 × 55 × 2 mm, surface 75.16 cm2) pretreated as described in Hou et al. (2016) [9]. The carbon cloth electrodes were hanged by Ti wire with different submerged proportions of 25%, 50%, 75%, and 100% in the catholyte as designed. The carbon cloth electrodes were completely permeated with catholyte via capillary action regardless of different submerged proportions. The anode and cathode electrodes were connected by Ti wires (the part inside the bottle) and Cu wires (the part outside the bottle) with a 1000 Ω external resistance. The anode was sealed with silicone and paraffin to ensure an anaerobic environment and covered with black paper to prevent the light [12] (Figure 1).

2.3. Operation of Microbial Fuel Cells

The anode was filled with 330 mL of synthetic swine wastewater mix with 264 mL of distilled water and inoculated with 66 mL of anaerobic seeding sludge to make an initial SCOD about 5000 mg/L. About 50% of the wastewater was discharged by syphonage method and replaced with fresh synthetic wastewater every 4 days. Nitrogen gas was applied during the inoculation and the wastewater replacement process to create an anaerobic condition. The cathode chamber was filled with 660 mL of phosphate buffer solution, and the cathode electrode was 25%, 50%, and 75% submerged during the first 12 days of MFC operation.
When the MFC performance stabilized after 12 days of operation, the cathode chamber was evacuated and inoculated with 200 mL microalgae seed culture and 460 mL ADSW. For the control, 200 mL microalgae seed culture and 460 mL ADSW were added to two independent 1-L glass bottles. The submerged portions of the cathode electrodes were adjusted to 25%, 50%, 75%, and 100%. The MFCs were operated at 30 °C, under continuous light (5000 lux) for 8–10 days per batch until the chlorophyll or lipid production stopped increasing. The DO and pH values were measured, and pH adjustment to 7 by 1 M HCl was performed every 2 days. Approximately 9 mL samples were taken from the cathode chamber after completely mixed by a glass rod for analysis every 2 days. At the end of the batch culture, the total culture volume reduced from 660 mL to about 600 mL due to sampling and evaporation. Around 400 mL of culture (200 mL left as seed) in the cathode chamber and control was discharged and collected for analysis, before replacement with 460 mL fresh ADSW. Three batches of experiments were operated and all experiments were conducted in duplicate.

2.4. Analytical Methods

The working voltage and current of the MFCs were monitored by voltmeters and ammeters connected to the MFCs (Figure 1). Current density and power density at external resistance of 10–8500 Ω were normalized with the anolyte volume. Internal resistance was estimated based on the slope of polarization curve [9,12].
After centrifugation at 10,000 rpm for 10 min, the cell pellets from 2 mL of cathode culture samples were used for chlorophyll determination by spectrophotometry [17,18]. Cell pellets from 3 mL of samples were taken for lipid estimation by spectrophotometry method at 530 nm using sulfo-phospho-vanillin assay [19]. At the end of batch culture, the cell pellets were collected by centrifuging, and then frozen dry. The lipid production was estimated following Folch et al. (1957) [20]. The ratio between the productions of lipid and dry biomass was calculated as lipid content. Lipid composition was analyzed by gas chromatography–mass spectroscopy (GC-MS) according to Shun and Yun (2014) [21]. The supernatants were taken for chemical oxygen demand (COD), TN, and NH3-N analysis using Hach reagents with Hach DRB200 and DR3900 equipment, following the manufacturer’s instructions and the standard methods [22]. IBM SPSS Statistics 19 software (IBM Corp., New York, USA) was applied in the ANOVA analysis.

3. Results and Discussion

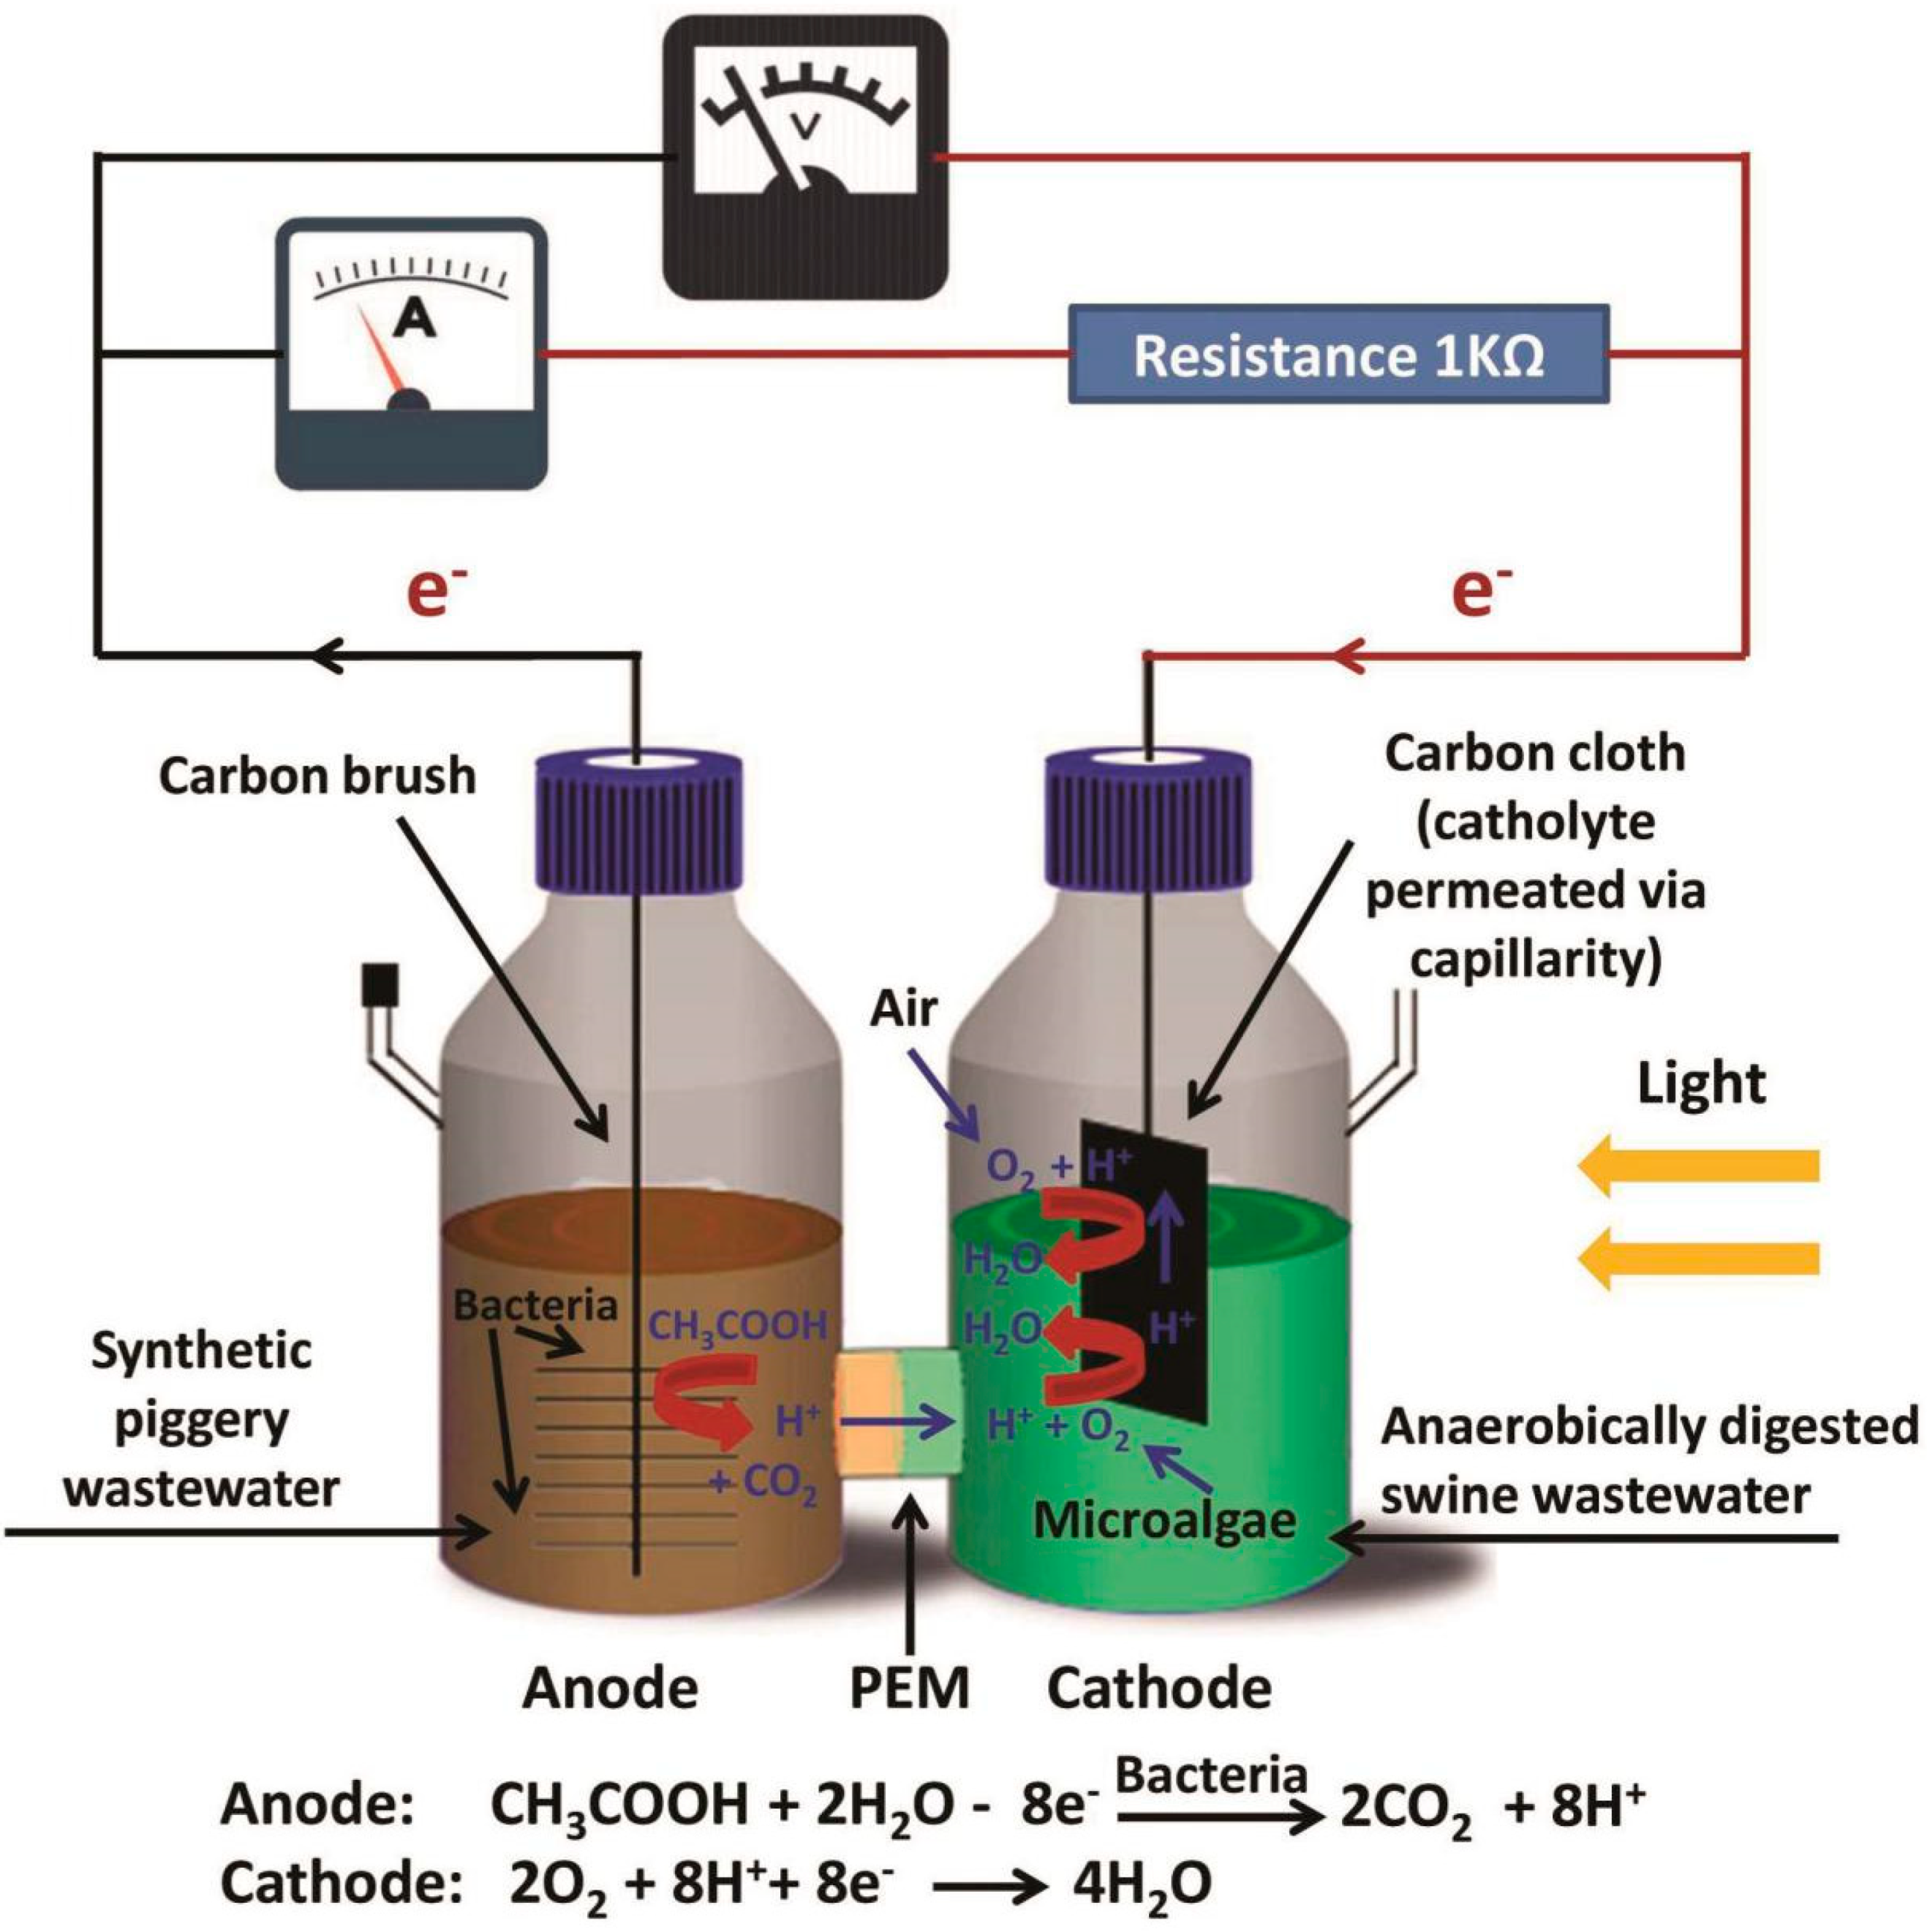
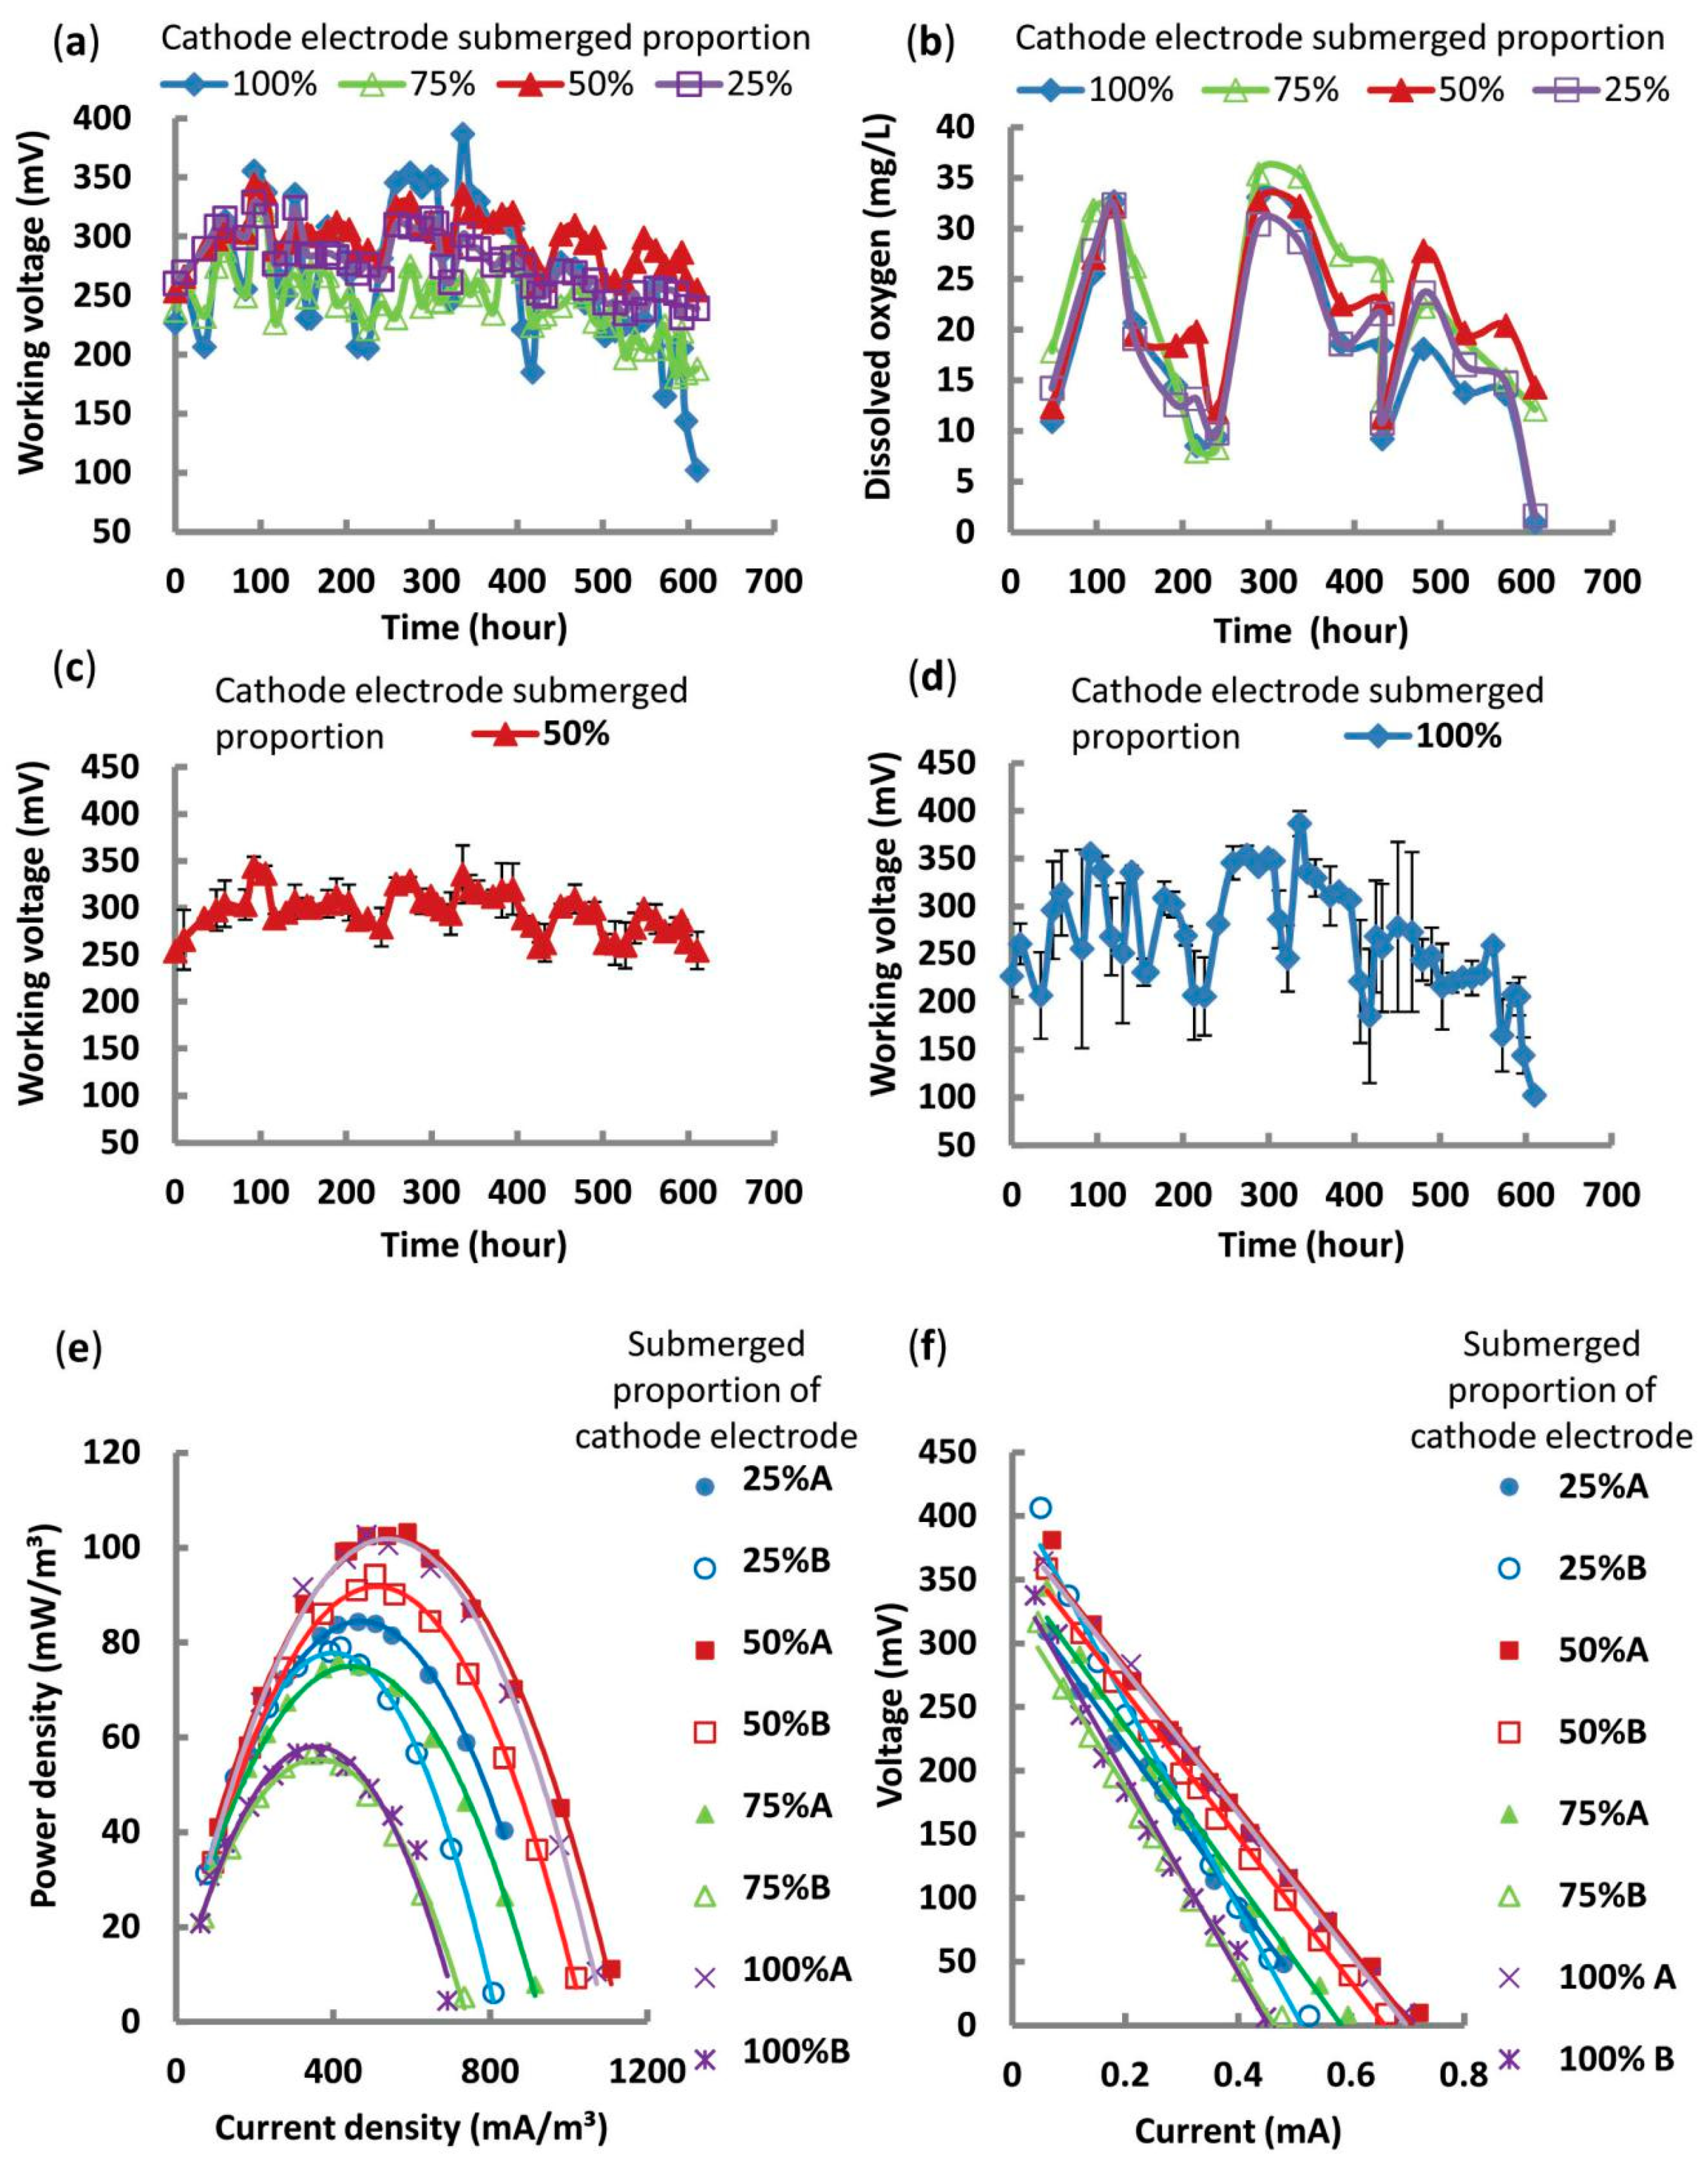
3.1. Effect of the Proportion of Cathode Electrode Submerged on Working Voltage

As illustrated in Figure 2a,c,d, the working voltages in the groups with partially submerged (25%, 50%, and 75%) electrodes were much more stable than those with 100% submerged electrodes in biocathode, despite similar large fluctuations (1.0–35.4 mg/L) in DO levels (Figure 2b) with the growth of microalgae (Figure 3a). The working voltage in the MFCs with 25% submerged cathode electrodes just changed from 256 to 239 mV, whereas that of the 100% submerged one fell from 259 to 102 mV, when their DO in the catholyte dropped from 13.6–14.8 mg/L to 1.0–1.6 mg/L at the end of the 3rd batch culture. These observations indicate that the performance of the partially submerged cathode electrode was more stable than the completely submerged ones and applicable to variable environmental conditions. One possible explanation is that the partially submerged electrode could access the O2 from the air as a supplement to maintain a relatively high working voltage output when the DO generated by microalgae was not enough for the cathodic reaction. However, the working voltages generated from completely submerged electrodes varied remarkably with the DO from microalgae, as previous studies reported [6,8,9], because the O2 originates solely from DO present in the catholyte.
As shown in Table 1, the average working voltages for the 25%, 50%, 75%, and 100% submerged electrodes were 278 ± 32, 297 ± 26, 246 ± 41, and 268 ± 66 mV, respectively. For the average working voltage, the highest and most stable value with the smallest standard deviation (SD) was recorded by the 50% submerged electrodes, though the highest working voltage (387 mV) was observed in the MFCs with the 100% submerged cathode electrodes. ANOVA analysis also revealed that the effect of submerged proportion on working voltages is significant (p (Sig.) < 0.05, Table A1). The working voltages from the 50% submerged electrodes were significantly higher than the other groups with the 25%, 75%, and 100% submerged electrodes with the highest average value (Table 1) and p (Sig.) values smaller than 0.05 in multiple comparisons with other groups by the Least Significant Difference (LSD) method (Table A2). It suggests that the partially submerged electrodes improved not only the stability of electricity generation but also the quantity. These values are higher than the working voltage (12–170 mV) from a photosynthetic algal MFC fed with food waste [9] or domestic wastewater [23]. The maximum values, rather than the average values for the parameters relative to electricity generation (e.g., working voltage, open circuit voltage/potential, current density), have traditionally been used in most studies [8,9,10,12,13]. Because those parameters vary remarkably with the change in DO caused by the different growth status of microalgae in the microalgae biocathode; for example, DO is usually very low in the start-up period or after replacement of the substrate in cathode chamber [9,10,12] and easily fluctuates with the shift in light/dark periods [8,12]. The large variations render the average values for these parameters meaningless in the assessment of photosynthetic algal MFC performance. With the partially submerged carbon cloth cathode electrode proposed in this study, the stability of microalgae assisted cathodes could be significantly improved, and the average values for parameters relative to electricity generation could be considered for the evaluation of MFC performance.

3.2. Effect of the Proportion of Cathode Electrode Submerged on Electrical Power Density and Internal Resistance

Figure 2e and Table 1 show that the average maximum power density (99 ± 6 mW/m3) was observed in the group with the 50% submerged electrodes during the stationary growth phase of microalgae, followed by the groups with the 25% submerged (82 ± 4 mW/m3), 100% submerged (80 ± 33 mW/m3), and 75% submerged (67 ± 13 mW/m3) electrodes. The power density curves for the two MFCs with 100% submerged electrodes were very different, resulting in the greatest standard deviation (SD, 33 mW/m3) among all the groups, while the SD for the 50% submerged electrode group was the smallest (6 mW/m3). These findings suggest that the performances of the MFCs with partially submerged cathode electrodes were more stable than those of the completely submerged electrodes, though the difference among them was not significant by ANOVA analysis (p (Sig.) > 0.05, Table A3 and Table A4), and a similar maximum power density was obtained for both groups in some specific cases (Figure 2e 50% A and 100% A). The lowest internal resistance (6 ± 0.1 × 10² Ω) was observed in the group with the 50% submerged electrodes, while those for the other groups were all about 7 × 10² Ω (Table 1). These results were in agreement with Bazdar et al. (2018) [12], in which the internal resistance of photosynthetic microalgae MFC was 662 Ω in operation with municipal wastewater. The smallest standard deviation of internal resistance was also observed with the 50% submerged electrodes, while the largest one observed with 100% submerged electrodes. As mentioned before, it is possible that the partially submerged electrode could use O2 from the air as a supplement to maintain relatively high working voltage and power density when variations occur in DO from microalgae, while the completely submerged electrodes could only use the DO in the catholyte from microalgae. As a result, the standard deviations of the working voltage and maximum power density for the MFCs with completely submerged electrodes were much larger than for the partially submerged electrodes, though the average values and SD for DO (Figure 2b; SD 0–14.6 mg/L, Table A5), total chlorophyll, biomass, and lipid production (Figure 3a–c, Table 1 and Figure A1 and Figure A2) were similar among all the test groups.

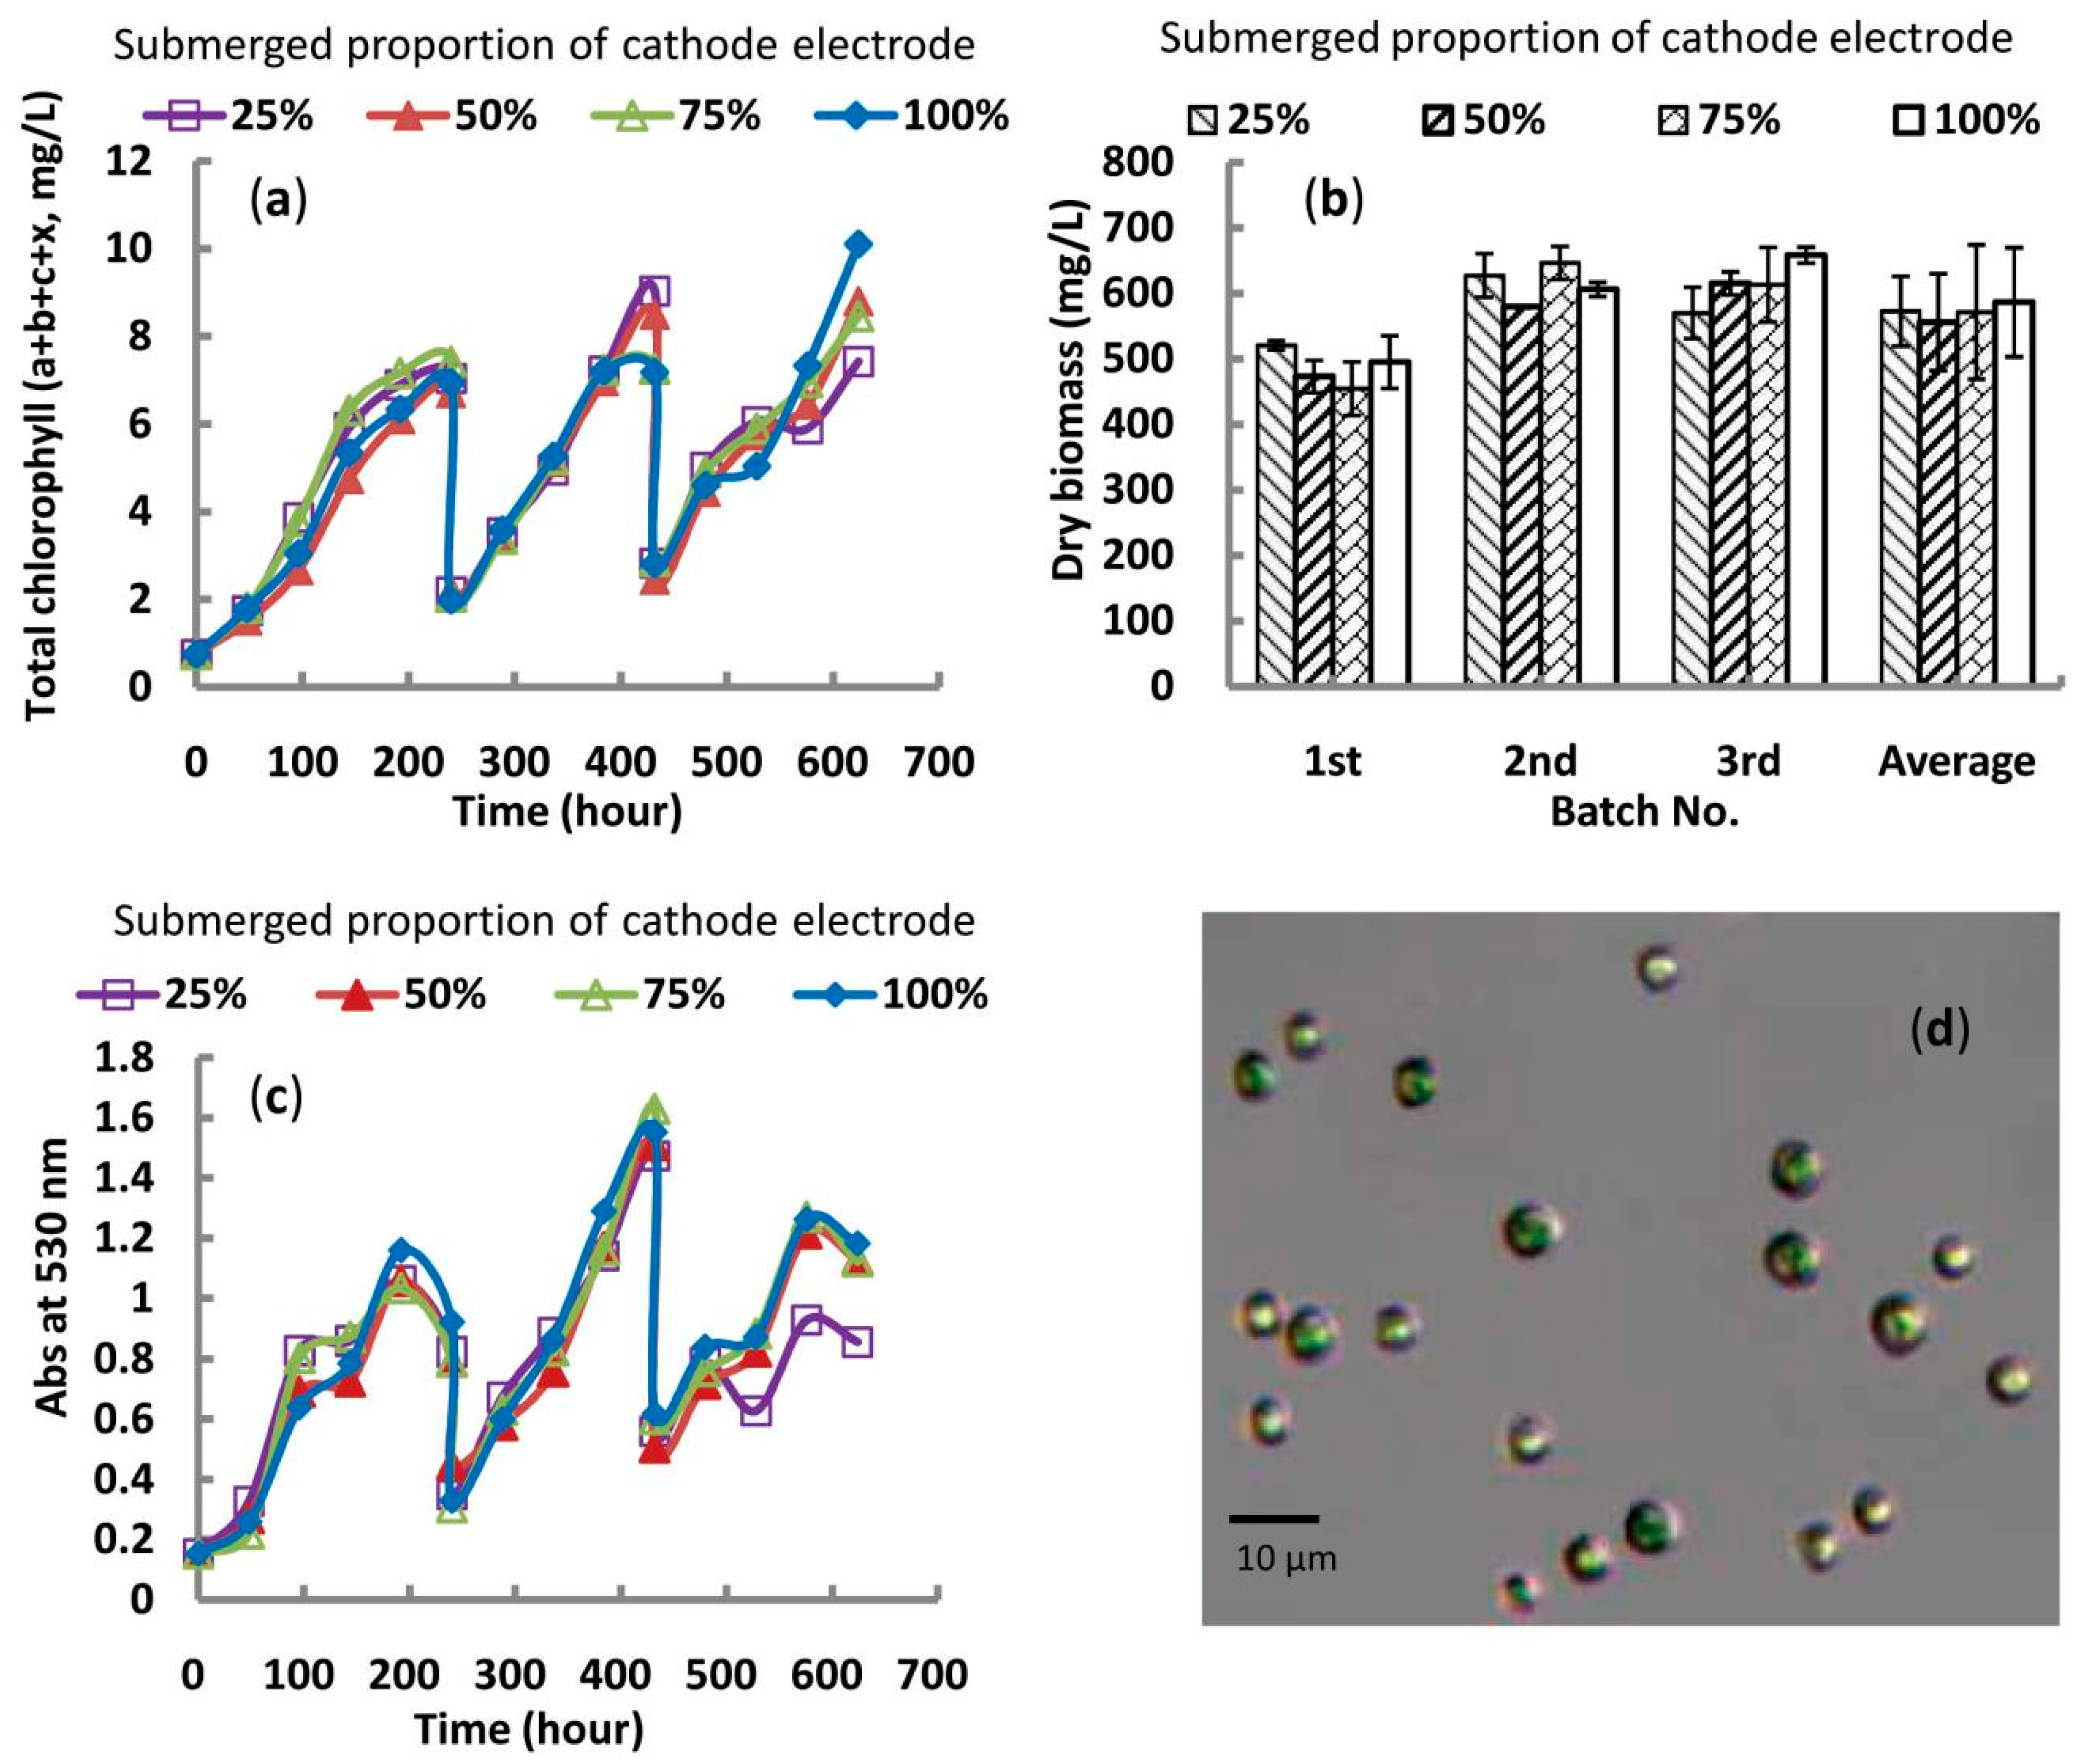
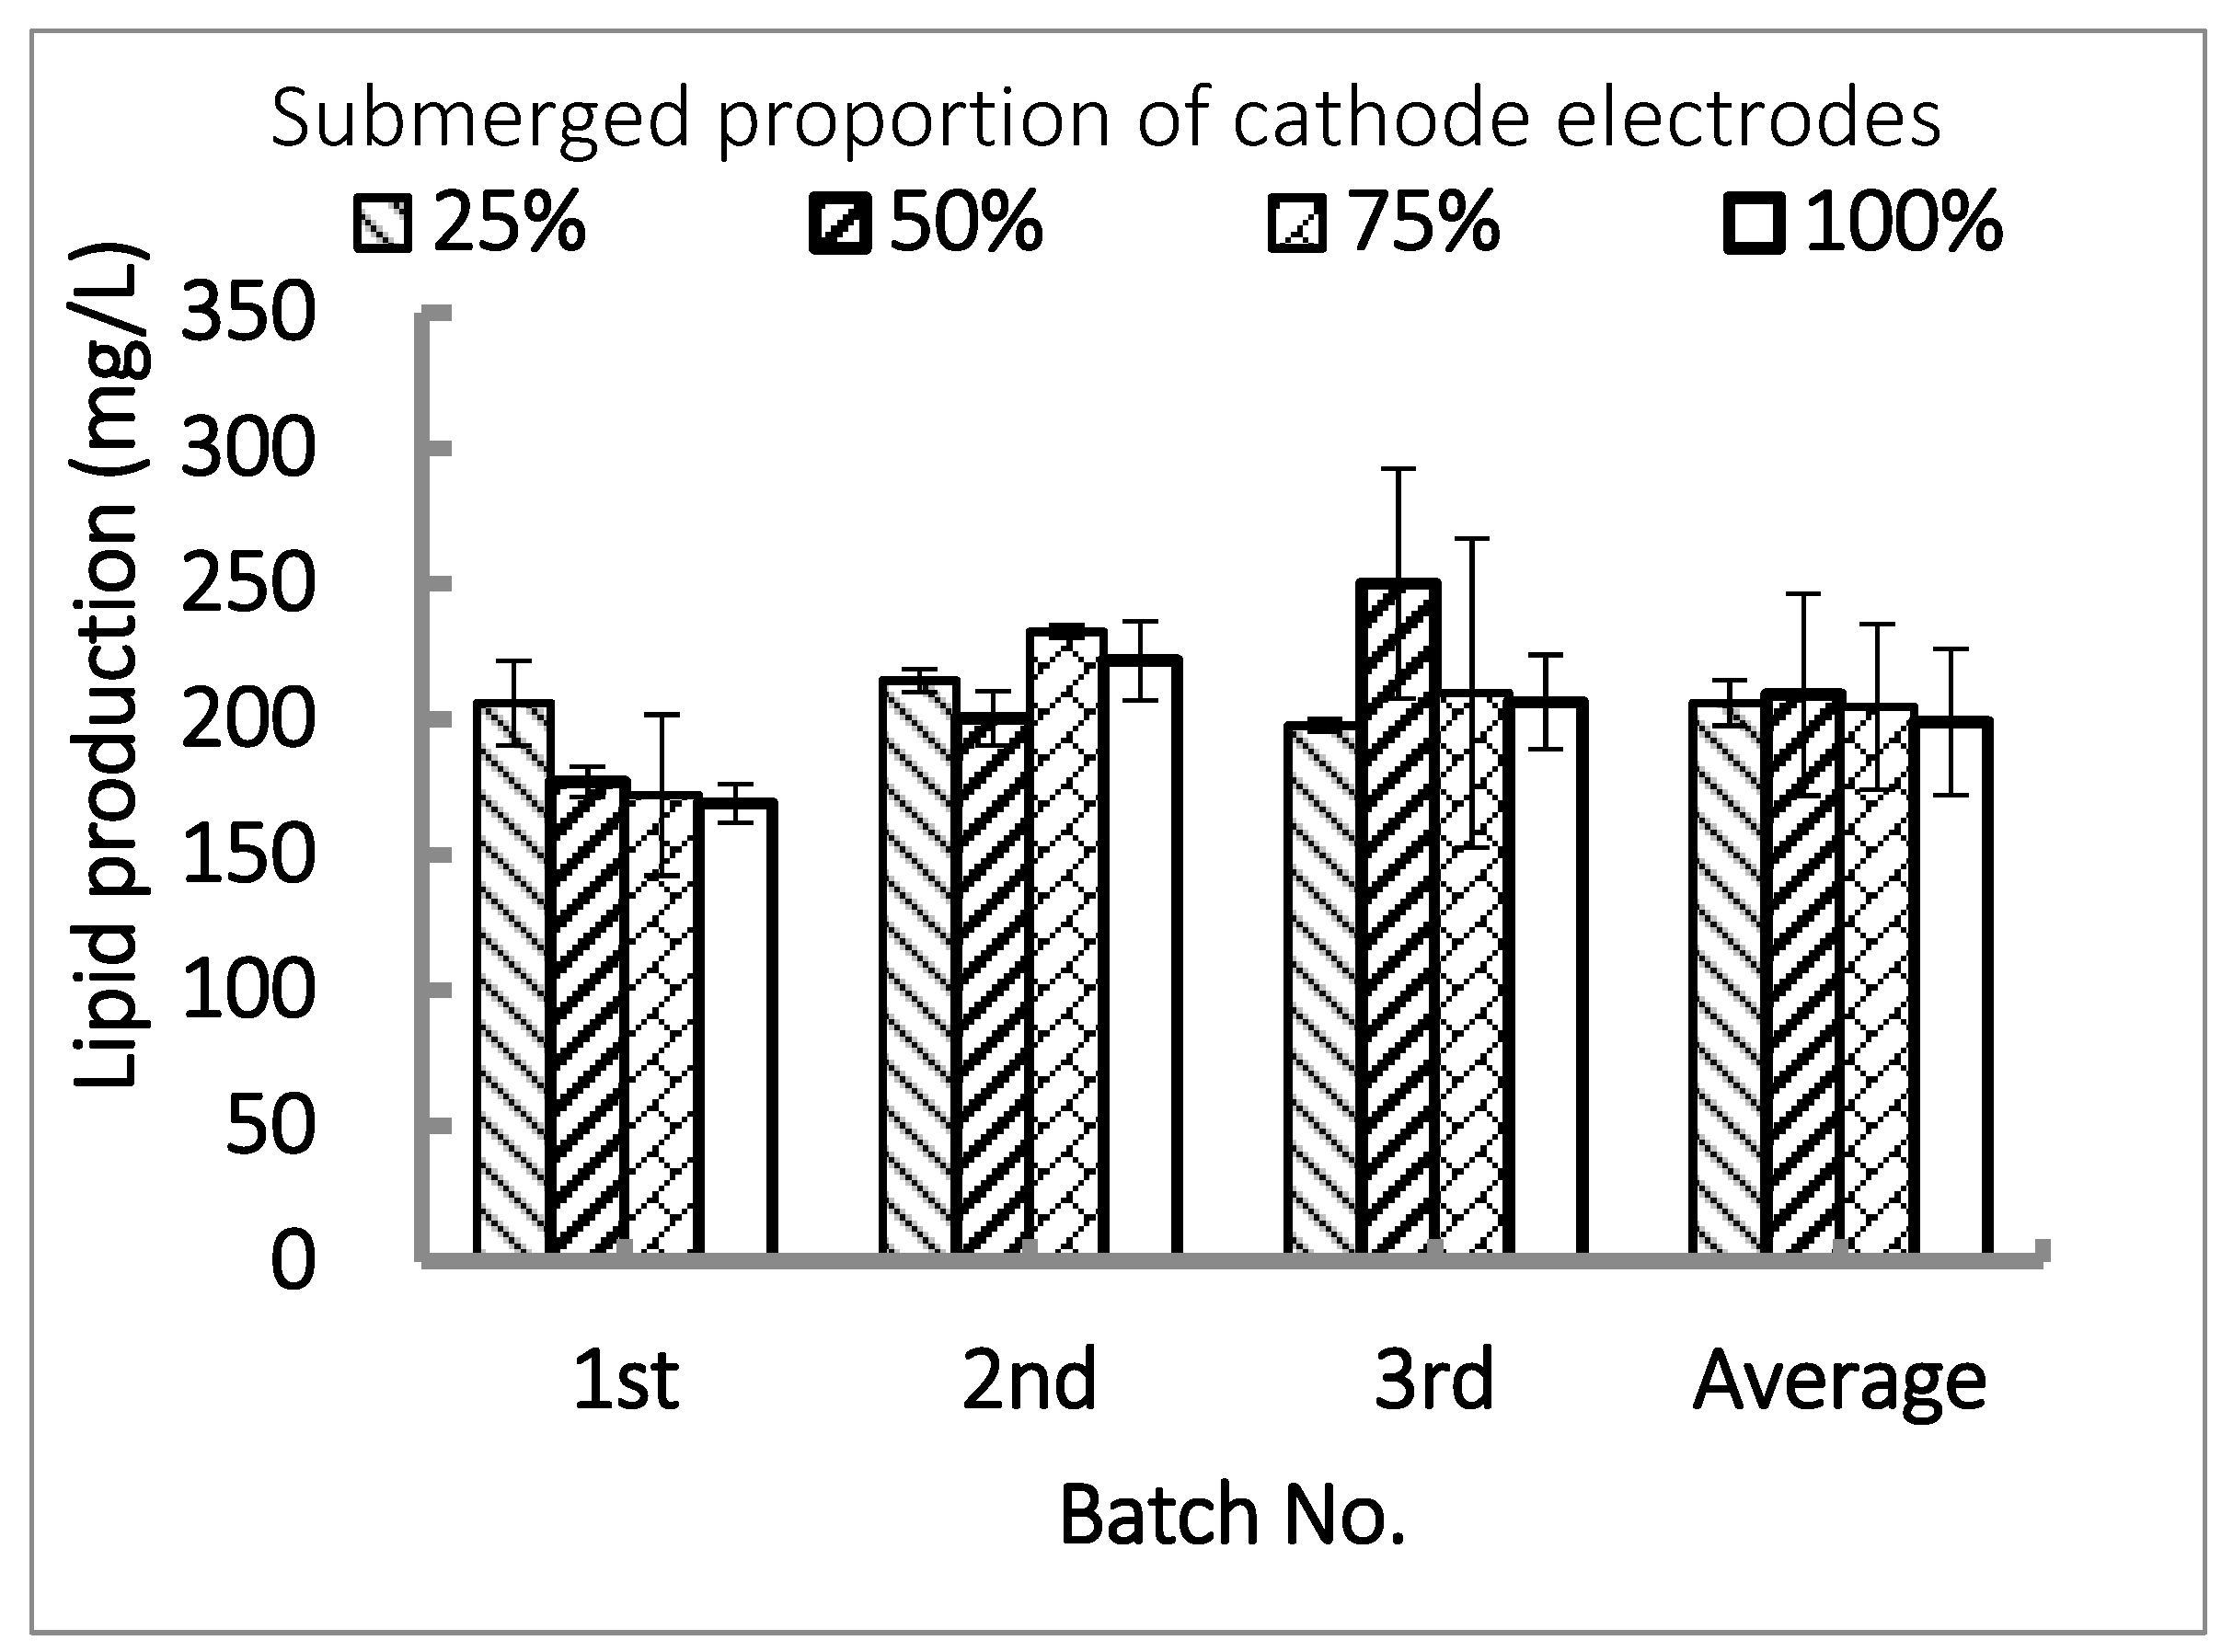
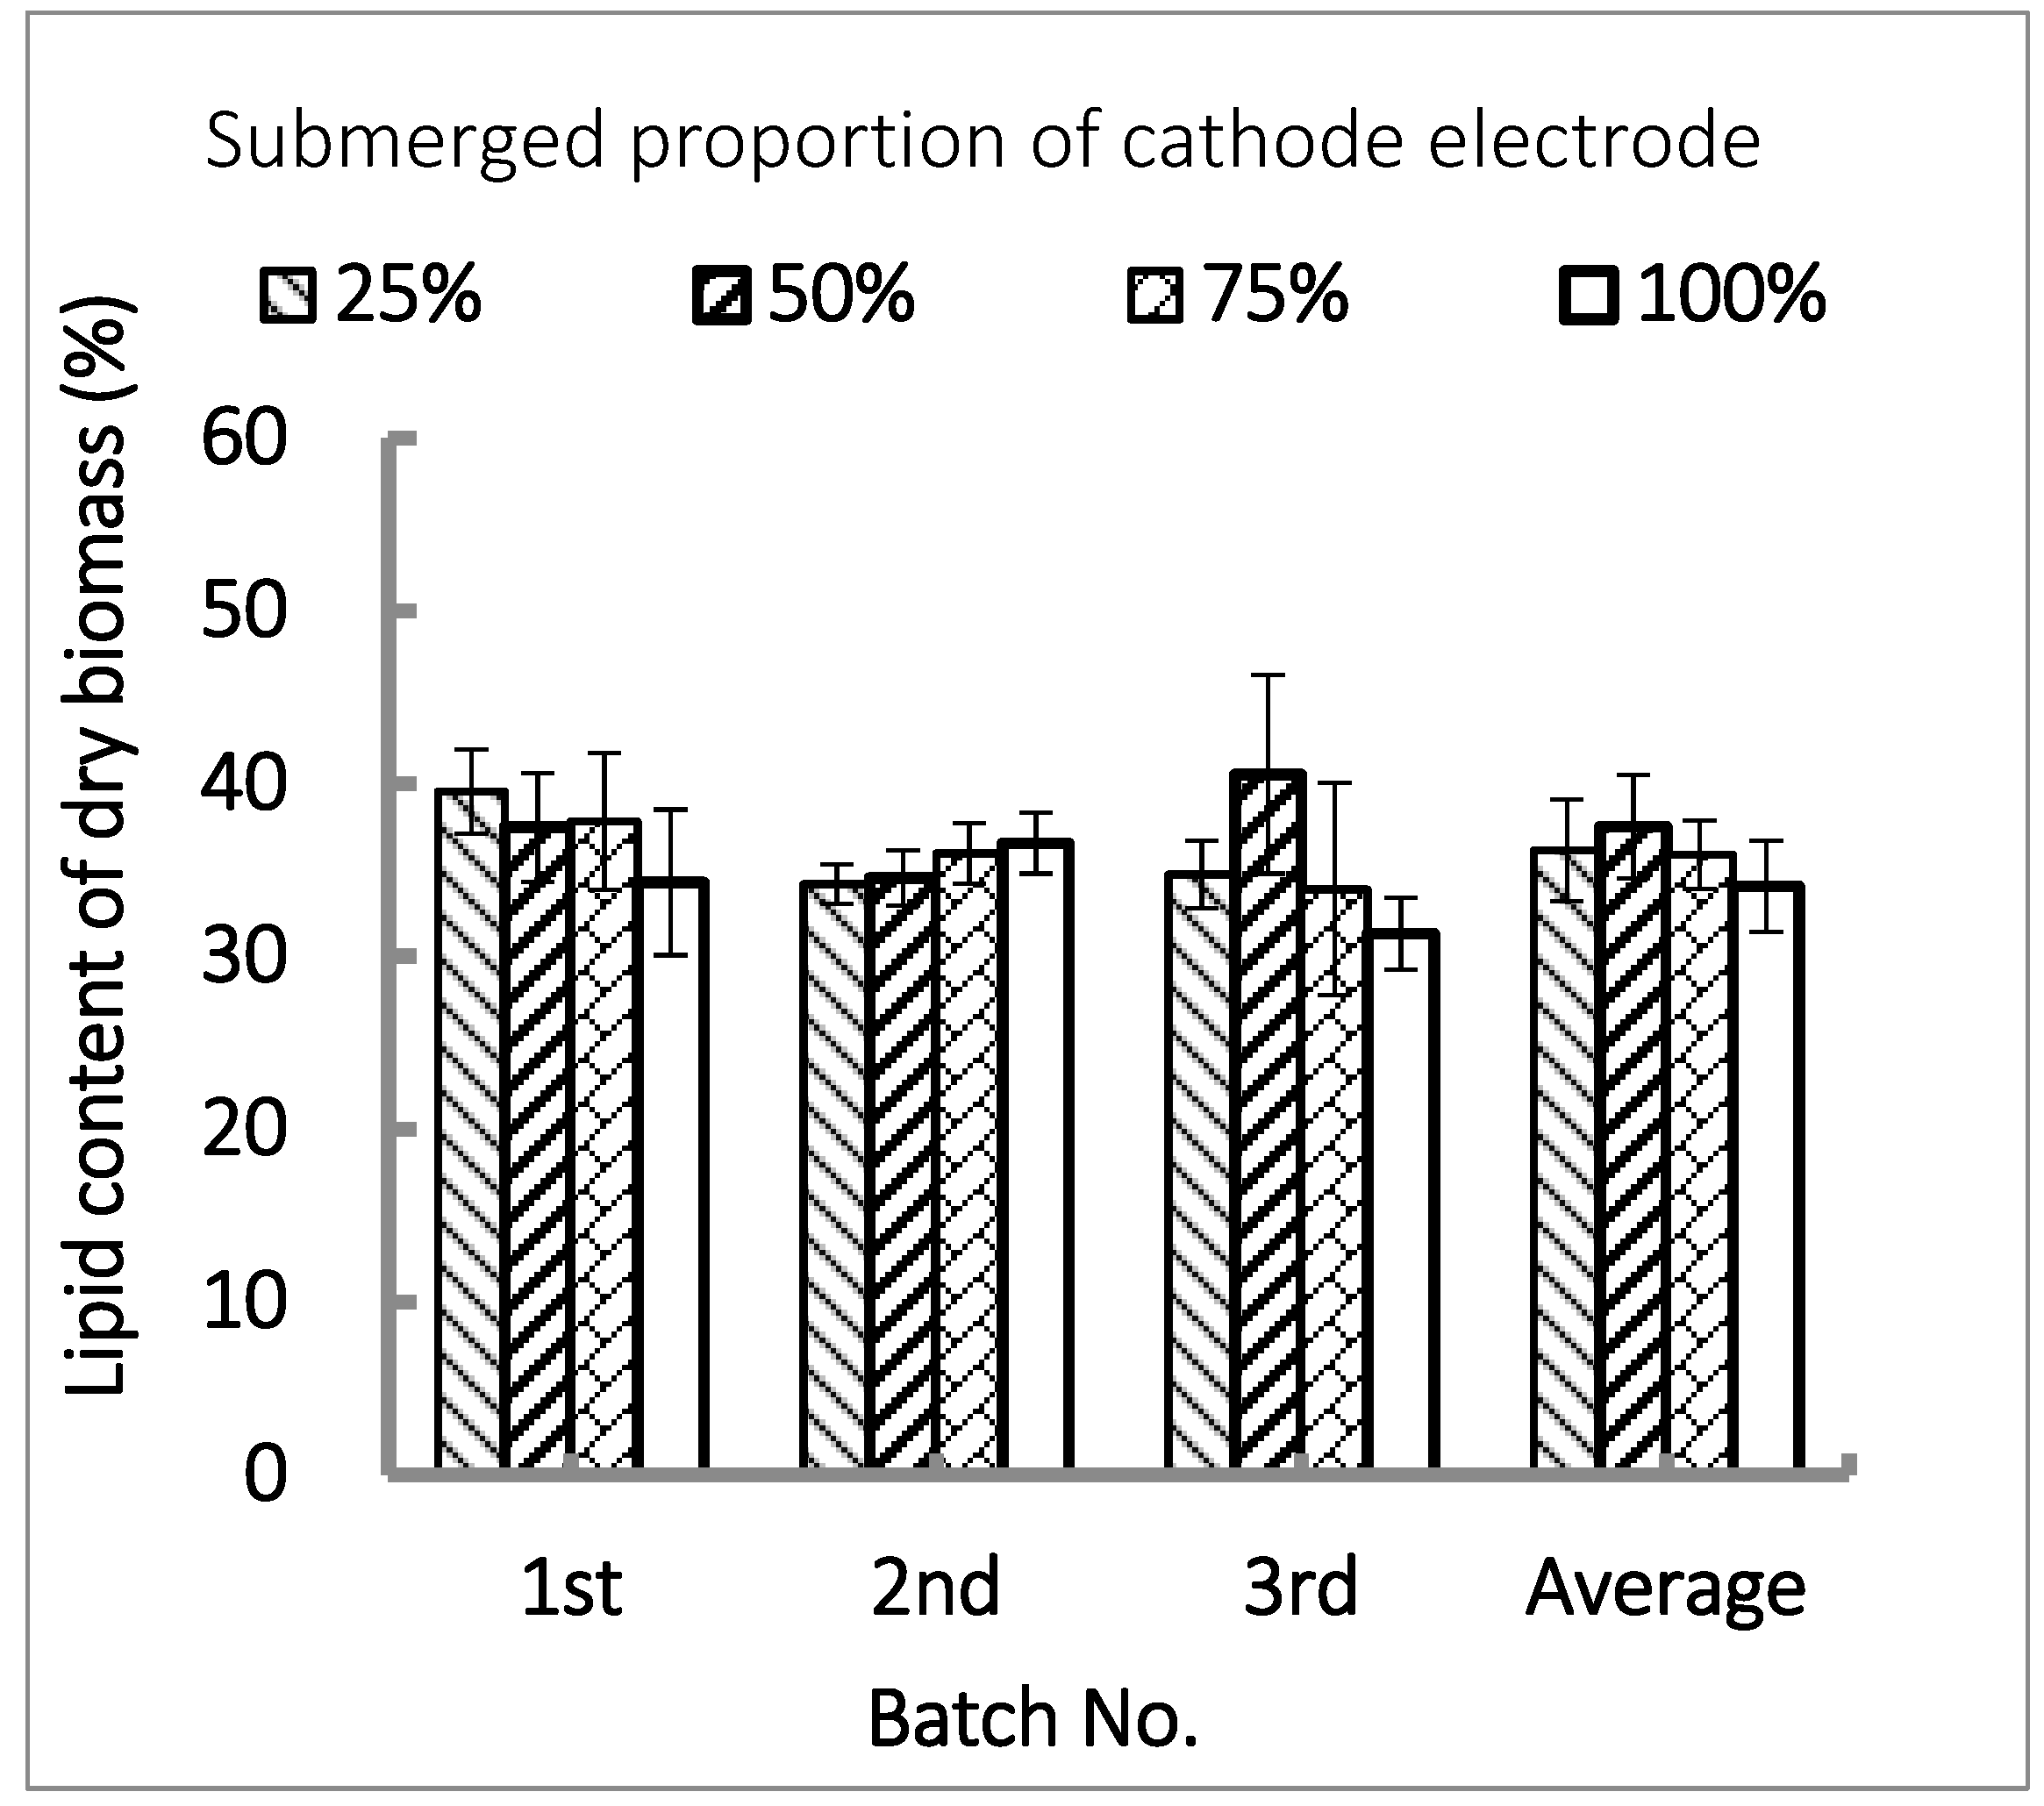
3.3. Biomass and Lipid Production of Microalgae in Biocathode with Partially and Completely Submerged Cathode Electrodes

Figure 3a,b and Table 1 display that the total chlorophyll (a + b + c + x) and the dry biomass production of microalgae at the end of batch culture were similar among all the groups generally, with values ranging from 455 to 659 mg/L in dry biomass weight. Similarly, no significant differences in lipid production were observed among the test groups (p > 0.05), in which lipid production varied from 169 to 250 mg/L (Figure 3c and Figure A1). The highest lipid production was obtained in the MFC group with 50% submerged cathode electrodes with biomass production, lipid production, and lipid content of 616 ± 17 mg/L, 250 ± 42 mg/L, and 41 ± 6 % (g/g dry weight), respectively, in batch No. 3 (Table 1 and Figure 3b, Figure A1 and Figure A2). The associated average productivity of lipid in the three batches of culture was 25 ± 7 mg/(L·d). The lipid content obtained in this study was higher than that from previous studies on algal lipid production from swine farm anaerobic effluents, in which lipid content of dry biomass ranged from 22% to 27% [14,15,24,25]. Negligible presences of bacteria cells (Figure 3d) could be a possible reason for the relatively high lipid content achieved under the non-septic open conditions. Both the low COD to TN ratio and the antibiotics present in anaerobically digested swine wastewater could contribute to the dominance of microalgae in the culture even in non-sterile wastewater. Furthermore, the less microbial contamination results in the less oxygen consumption by contaminating microorganisms, leading to the availability of more oxygen for the cathodic reaction. In addition, the highest DO produced in ADSW by microalgae (over 30 mg/L) was similar to or even higher than that in the BG11 medium (11–22.5 mg/L) [9,12], implying that ADSW as a catholyte has a positive effect on the electricity generation of the photosynthetic microalgae MFC.
The fatty acids produced by C. pyrenoidosa from aerobically treated swine wastewater were mainly linoleic acid (C18:2) (25.93%), palmitic acid (C16:0) (17.66%), 7,10-hexadecaduenoic acid (C16:2) (12.81%), linolenic acid (C18:3) (11.61%), stearic acid (6.70%), 11-octadecenoic acid (C18:1) (6.05%), palmitoleic acid (C16:1) (5.60%), and 7,10,13-hexadecatrienoic acid (C16:3) (4.91%), providing about 91% of all the fatty acid detected. The remaining 9% was composed of arachidic acid (C20:0), trans-13-octadecenoic acid (C18:1), hexacosanoic acid (C26:0), myristic acid (C14:0), tetracosanoic acid (C24:0), and pentacosanoic acid (C25:0) from large to small. The algal lipids produced in this process are suggested to be suitable for biodiesel production due to the high proportion of long chain fatty acids, such as C16 and C18 series compounds [26].

3.4. Influence of the Proportion of Electrode Submerged on Improvement in COD to Nitrogen Ratio for Wastewater in Biocathode

As shown in Table 1, the highest total nitrogen (TN) removal (75 ± 1%) was recorded in the MFCs with 50% submerged cathode electrodes, while the highest ammonia nitrogen (NH3-N) removal (63 ± 2%) was observed in the group with 100% submerged electrodes. The average removal efficiencies of TN and NH3-N were similar in MFCs with partially and completely submerged electrodes, as well as COD removal. This finding suggests that the effects for the submerged proportions of the cathode electrode were not significant for the removal efficiencies of nitrogen and COD. However, maximum removal efficiencies of TN and NH3-N were higher in MFCs than the control (p < 0.05) with associated values of 53 ± 4% and 44 ± 5% in the control, respectively. The ADSW pH was adjusted from 7.6 to 7.0 at the beginning of the experiment (see Section 2.1). The catholyte pH, which increased from 7.0 to 8.3–8.5, was then adjusted to 7.0 every 2 days after sampling. Free ammonia provided only 0.8%–20.2% of total ammonia in this pH range, suggesting that the microorganisms (mainly microalgae) not ammonia stripping were primarily responsible for TN and NH3-N removal. With the effective reduction of TN, the COD to TN ratio increased from 0.7–0.8 to 1.7–3.0 in MFCs. Anaerobic digestates are difficult to treat due to the low COD to N ratio [16], especially those from swine wastewater, which have a low COD/N ratio even before anaerobic treatment. Increasing the COD/N ratio could effectively improve the biological nitrogen removal by denitrification [27].

4. Conclusions

To improve the stability of the microalgal biocathode, a partially submerged carbon cloth electrode that could use both DO in catholyte and O2 from the air was evaluated. The results show that the partially submerged electrode significantly improved the stability of electricity output and maintained a stable working voltage even when DO decreased. The working voltages (average, 297 ± 26 mV) of the MFCs with 50% submerged electrodes were significantly higher (p < 0.05) than with other partially or completely submerged electrodes, though the effects of the submerged proportion were not significant (p > 0.05) for biomass and lipid production and for nitrogen removal of anaerobically digested swine wastewater. To adjust the proportion that the cathode electrode is submerged according to the changing DO in catholyte could be a feasible approach to make the best use of the high DO generated by microalgae and the oxygen in the air to maximize the electricity output.

Author Contributions

Conceptualization, J.L. and Y.X.; experiment implementation and formal analysis, J.L., C.L., and W.L.; methodology, J.L., G.X., and G.L.; visualization, J.L. and C.L.; writing—original draft, J.L.; writing—review and editing, J.L. and M.P.T.; supervision, Y.X.; project administration, Y.X., L.Z., and Q.D.; funding acquisition, Y.X. and J.L.

Funding

This research was funded by China Postdoctoral Science Foundation (No. 2016M590761), National Natural Science Foundation of China (No. 51708131, No. 41671481), National Science and Technology Major Project (No. 2016YFC0400706), the Science and Technology Plan Project of Guangdong (No. 2016B020240003; 2016A020221036), and College Student Innovation and Entrepreneurship Training Program of Guangdong Province (No.201811845158).

Conflicts of Interest

The authors declare no conflicts of interest. The funders had no role in the design of the study; in the collection, analyses, or interpretation of data; in the writing of the manuscript, or in the decision to publish the results.

Appendix A

Table A1. ANOVA analysis for working voltages (V) generated by the microbial fuel cell (MFC) reactors with the cathode electrodes submerged at the proportions of 25%, 50%, 75%, and 100%.
Sum of SquaresdfMean SquareFSig.
Between Groups0.13930.04623.9270.000
Within Groups0.7964120.002N/AN/A
Total0.935415N/AN/AN/A
N/A: not applicable.
Table A2. Multiple Comparisons by the Least Significant Difference (LSD) method for working voltages (V) generated by the microbial fuel cell (MFC) reactors with the cathode electrodes submerged at the proportions of 25%, 50%, 75%, and 100%.
(I) Sub_Prop(J) Sub_PropMean Difference (I–J)Std. ErrorSig.95% Confidence Interval
Lower BoundUpper Bound
2550−0.0183048 *0.00591980.002−0.029943−0.006667
750.0361045 *0.00614570.0000.0240220.048187
1000.01070870.00591980.071−0.0009290.022347
50250.0183048 *0.00591980.0020.0066670.029943
750.0544093 *0.00614570.0000.0423270.066491
1000.0290135 *0.00591980.0000.0173750.040652
7525−0.0361045 *0.00614570.000−0.048187−0.024022
50−0.0544093 *0.00614570.000−0.066491−0.042327
100−0.0253958 *0.00614570.000−0.037478−0.013314
10025−0.01070870.00591980.071−0.0223470.000929
50−0.0290135 *0.00591980.000−0.040652−0.017375
750.0253958 *0.00614570.0000.0133140.037478
* The mean difference is significant at the 0.05 level.
Table A3. ANOVA analysis for maximum power densities (mW/m3) of the microbial fuel cell (MFC) reactors with the cathode electrodes submerged at the proportions of 25%, 50%, 75%, and 100%.
Sum of SquaresdfMean SquareFSig.
Between Groups1032.3753344.1251.0660.457
Within Groups1291.5004322.875N/AN/A
Total2323.8757N/AN/AN/A
N/A: not applicable.
Table A4. Multiple Comparisons by the Least Significant Difference (LSD) method for maximum power densities (mW/m3) of the MFCs with the cathode electrodes submerged at the proportions of 25%, 50%, 75%, and 100%.
(I) Sub_Prop(J) Sub_PropMean Difference (I–J)Std. ErrorSig.95% Confidence Interval
Lower BoundUpper Bound
2550−17.00017.9690.398−66.8932.89
7515.00017.9690.451−34.8964.89
1001.50017.9690.937−48.3951.39
502517.00017.9690.398−32.8966.89
7532.00017.9690.150−17.8981.89
10018.50017.9690.361−31.3968.39
7525−15.00017.9690.451−64.8934.89
50−32.00017.9690.150−81.8917.89
100−13.50017.9690.494−63.3936.39
10025−1.50017.9690.937−51.3948.39
50−18.50017.9690.361−68.3931.39
7513.50017.9690.494−36.3963.39
Table A5. Standard deviations of dissolved oxygen (mg/L) in the catholyte of microbial fuel cell (MFC) reactors with the cathode electrodes submerged at the proportions of 25%, 50%, 75%, and 100%.
Time (hour)4896120144192216240288336384432432480528576610
Submerged Proportion (%)
25 0.7 5.4 0.4 1.8 4.7 0.3 0.9 0.6 4.1 1.3 0.3 0.2 6.1 2.0 2.6 1.6
50 0.3 6.5 0.5 3.1 8.3 4.6 2.3 0.2 1.5 2.8 2.3 1.2 0.8 2.0 5.1 2.3
75 0.7 4.0 0.4 1.7 4.7 2.0 1.5 1.3 0.3 1.9 0.0 1.4 0.6 0.6 6.8 1.9
100 1.2 0.1 0.5 0.3 1.1 1.2 1.2 0.4 1.2 2.6 5.6 2.8 2.5 6.1 6.2 1.0
Figure A1. Lipid production of microalgae from wastewater with partially and completely submerged electrodes in the cathode chamber.
Energies 12 03229 g0a1
Figure A2. Lipid content of dry microalgae biomass from wastewater with partially and completely submerged electrodes in the cathode chamber.
Energies 12 03229 g0a2

References

  1. Li, S.; Chen, G.; Anandhi, A. Applications of emerging bioelectrochemical technologies in agricultural systems: A current review. Energies 2018, 11, 2951. [Google Scholar] [CrossRef]
  2. Ali, J.; Sohail, A.; Wang, L.; Rizwan Haider, M.; Mulk, S.; Pan, G. Electro-microbiology as a promising approach towards renewable energy and environmental sustainability. Energies 2018, 11, 1822. [Google Scholar] [CrossRef]
  3. López Zavala, M.; Torres Delenne, P.; González Peña, O. Improvement of wastewater treatment performance and power generation in microbial fuel cells by enhancing hydrolysis and acidogenesis, and by reducing internal losses. Energies 2018, 11, 2309. [Google Scholar] [CrossRef]
  4. Włodarczyk, P.; Włodarczyk, B. Microbial fuel cell with ni–co cathode powered with yeast wastewater. Energies 2018, 11, 3194. [Google Scholar] [CrossRef]
  5. Onumaegbu, C.; Alaswad, A.; Rodriguez, C.; Olabi, A. Optimization of pre-treatment process parameters to generate biodiesel from microalga. Energies 2018, 11, 806. [Google Scholar] [CrossRef]
  6. Shukla, M.; Kumar, S. Algal growth in photosynthetic algal microbial fuel cell and its subsequent utilization for biofuels. Renew. Sustain. Energy Rev. 2018, 82, 402–414. [Google Scholar] [CrossRef]
  7. Chandra, R.; Sravan, J.S.; Hemalatha, M.; Kishore Butti, S.; Venkata Mohan, S. Photosynthetic synergism for sustained power production with microalgae and photobacteria in a biophotovoltaic cell. Energy Fuels 2017, 31, 7635–7644. [Google Scholar] [CrossRef]
  8. Commault, A.S.; Laczka, O.; Siboni, N.; Tamburic, B.; Crosswell, J.R.; Seymour, J.R.; Ralph, P.J. Electricity and biomass production in a bacteria-chlorella based microbial fuel cell treating wastewater. J. Power Sources 2017, 356, 299–309. [Google Scholar] [CrossRef]
  9. Hou, Q.; Pei, H.; Hu, W.; Jiang, L.; Yu, Z. Mutual facilitations of food waste treatment, microbial fuel cell bioelectricity generation and chlorella vulgaris lipid production. Bioresour. Technol. 2016, 203, 50–55. [Google Scholar] [CrossRef] [PubMed]
  10. Huang, L.F.; Lin, J.Y.; Pan, K.Y.; Huang, C.K.; Chu, Y.K. Overexpressing ferredoxins in chlamydomonas reinhardtii increase starch and oil yields and enhance electric power production in a photo microbial fuel cell. Int. J. Mol. Sci. 2015, 16, 19308–19325. [Google Scholar] [CrossRef]
  11. Kakarla, R.; Min, B. Evaluation of microbial fuel cell operation using algae as an oxygen supplier: Carbon paper cathode vs. Carbon brush cathode. Bioprocess Biosyst. Eng. 2014, 37, 2453–2461. [Google Scholar] [CrossRef] [PubMed]
  12. Bazdar, E.; Roshandel, R.; Yaghmaei, S.; Mardanpour, M.M. The effect of different light intensities and light/dark regimes on the performance of photosynthetic microalgae microbial fuel cell. Bioresour. Technol. 2018, 261, 350–360. [Google Scholar] [CrossRef] [PubMed]
  13. Rago, L.; Cristiani, P.; Villa, F.; Zecchin, S.; Colombo, A.; Cavalca, L.; Schievano, A. Influences of dissolved oxygen concentration on biocathodic microbial communities in microbial fuel cells. Bioelectrochemistry 2017, 116, 39–51. [Google Scholar] [CrossRef] [PubMed]
  14. Jiang, Y.; Wang, H.; Zhao, C.; Huang, F.; Deng, L.; Wang, W. Establishment of stable microalgal-bacterial consortium in liquid digestate for nutrient removal and biomass accumulation. Bioresour. Technol. 2018, 268, 300–307. [Google Scholar] [CrossRef] [PubMed]
  15. Chiang, Y.-L.; Chen, Y.-P.; Yu, M.-C.; Hsieh, S.-Y.; Hwang, I.-E.; Liu, Y.-J.; Huang, C.-Y.; Tseng, C.-P.; Liaw, L.-L. Biomass and lipid production of a novel microalga, chlorellaceae sp. P5, through heterotrophic and swine wastewater cultivation. J. Renew. Sustain. Energy 2018, 10, 33102. [Google Scholar] [CrossRef]
  16. Sotres, A.; Tey, L.; Bonmati, A.; Vinas, M. Microbial community dynamics in continuous microbial fuel cells fed with synthetic wastewater and pig slurry. Bioelectrochemistry 2016, 111, 70–82. [Google Scholar] [CrossRef]
  17. Lichtenthaler, H.K. [34] chlorophylls and carotenoids: Pigments of photosynthetic biomembranes. In Methods in Enzymology; Academic Press: Cambridge, MA, USA, 1987; Volume 148, pp. 350–382. [Google Scholar]
  18. Jeffrey, S.W.; Humphrey, G.F. New spectrophotometric equations for determining chlorophylls a, b, c1 and c2 in higher plants, algae and natural phytoplankton. Biochem. Physiol. Pflanz. 1975, 167, 191–194. [Google Scholar] [CrossRef]
  19. Mishra, S.K.; Suh, W.I.; Farooq, W.; Moon, M.; Shrivastav, A.; Park, M.S.; Yang, J.W. Rapid quantification of microalgal lipids in aqueous medium by a simple colorimetric method. Bioresour. Technol. 2014, 155, 330–333. [Google Scholar] [CrossRef]
  20. Folch, J.; Lees, M.; Sloane Stanley, G.H. A simple method for the isolation and purification of total lipides from animal tissues. J. Biol. Chem. 1957, 226, 497–509. [Google Scholar]
  21. Shun, N.Y.Z. Analysis of Fatty Acids in Infant Formulas Using an Agilent J & W HP-88 Capillary Gc Column. Available online: https://www.agilent.com/cs/library/applications/5990-8429EN.pdf (accessed on 31 October 2017).
  22. APHA. Standard Methods for the Examination of Water and Wastewater, 21st ed.; American Public Health Administration: Washington, DC, USA, 2005. [Google Scholar]
  23. Maity, J.P.; Hou, C.-P.; Majumder, D.; Bundschuh, J.; Kulp, T.R.; Chen, C.-Y.; Chuang, L.-T.; Nathan Chen, C.-N.; Jean, J.-S.; Yang, T.-C.; et al. The production of biofuel and bioelectricity associated with wastewater treatment by green algae. Energy 2014, 78, 94–103. [Google Scholar] [CrossRef]
  24. Amini, H.; Wang, L.J.; Shahbazi, A. Effects of harvesting cell density, medium depth and environmental factors on biomass and lipid productivities of chlorella vulgaris grown in swine wastewater. Chem. Eng. Sci. 2016, 152, 403–412. [Google Scholar] [CrossRef]
  25. Olguin, E.J.; Castillo, O.S.; Mendoza, A.; Tapia, K.; Gonzalez-Portela, R.E.; Hernandez-Landa, V.J. Dual purpose system that treats anaerobic effluents from pig waste and produce neochloris oleoabundans as lipid rich biomass. New Biotechnol. 2015, 32, 387–395. [Google Scholar] [CrossRef] [PubMed]
  26. Ashraful, A.M.; Masjuki, H.H.; Kalam, M.A.; Fattah, I.M.R.; Imtenan, S.; Shahir, S.A.; Mobarak, H.M. Production and comparison of fuel properties, engine performance, and emission characteristics of biodiesel from various non-edible vegetable oils: A review. Energy Convers. Manag. 2014, 80, 202–228. [Google Scholar] [CrossRef]
  27. Carrera, J.; Vicent, T.; Lafuente, J. Effect of influent cod/n ratio on biological nitrogen removal (bnr) from high-strength ammonium industrial wastewater. Process Biochem. 2004, 39, 2035–2041. [Google Scholar] [CrossRef]
Figure 1. Configuration of the microbial fuel cell (MFC) reactor.
Energies 12 03229 g001
Figure 2. Electricity generation by the microbial fuel cell (MFC) reactors with the cathode electrodes submerged at the proportions of 25%, 50%, 75%, and 100% on 1 kΩ external resistance. (a) Working voltage; (b) Dissolved oxygen in the catholyte; (c) Working voltage with the 50% submerged cathode electrodes; (d) Working voltage with the 100% submerged cathode electrodes (e) Power density; (f) Polarization curve. A and B refer to the data from the two identical reactors in the same test group. The data showed in (ad) were the average values of the two identical MFCs within each test group.
Energies 12 03229 g002
Figure 3. Biomass and lipid production of microalgae from wastewater with partially and completely submerged electrodes in the cathode chamber. (a) Total chlorophyll (a + b + c + x); (b) Biomass production of microalgae at the end of batch culture; (c) Lipid production estimated by sulfo-phospho-vanillin assay at 530 nm; (d) Optical microscopic observation of microalgae cultured in the unpasteurized swine wastewater digestate (magnification × 400). The data shown are the average values of the two identical MFCs within each test group.
Energies 12 03229 g003
Table 1. Summary of the performances of the photosynthetic microalgae microbial fuel cells with the carbon cloth cathode electrodes submerged at the proportions of 25%, 50%, 75%, and 100%.
Submerged Proportion of Cathode Electrode 25%50%75%100%
Working voltage on 1 kΩ (mV)max329344322387
average278 ± 32297 ± 26246 ± 41268 ± 66
Max power density (mW/m3)max8410376103
average82 ± 499 ± 667 ± 1380 ± 33
Current density (mA/m3)max614512506577
average410 ± 51446 ± 34375 ± 47410 ± 96
Internal resistance (× 102 Ω)average7 ± 16 ± 0.17 ± 17 ± 2
Biomass production (dry weight, mg/L)max628 ± 33616 ± 17647 ± 57659 ± 12
average573 ± 53556 ± 74572 ± 103587 ± 83
Lipid production (mg/L)max214 ± 4250 ± 42232 ± 2222 ± 15
average206 ± 8209 ± 37205 ± 30199 ± 27
Lipid content (%)max40 ± 341 ± 638 ± 437 ± 2
average36 ± 338 ± 336 ± 234 ± 3
NH3-N Removal (%)max62 ± 160 ± 158 ± 163 ± 2
average54 ± 2855 ± 852 ± 656 ± 7
TN Removal (%)max62 ± 175 ± 168 ± 368 ± 7
average52 ± 1062 ± 1159 ± 859 ± 10
COD/TN ratio of effluentaverage2.0 ± 0.32.3 ± 0.52.4 ± 0.62.3 ± 0.4

