Article

Case Study of Particle Number Fluxes and Size Distributions during Nucleation Events in Southeastern Italy in the Summer

1
Istituto di Scienze dell'Atmosfera e del Clima, ISAC-CNR, 73100 Lecce, Italy
2
Dipartimento di Matematica e Fisica, Università del Salento, 73100 Lecce, Italy
3
Istituto di Scienze dell'Atmosfera e del Clima, ISAC-CNR, 40129 Bologna, Italy
*
Author to whom correspondence should be addressed.
Atmosphere 2015, 6(7), 942-959; https://doi.org/10.3390/atmos6070942
Submission received: 30 March 2015 / Revised: 22 June 2015 / Accepted: 2 July 2015 / Published: 14 July 2015

Abstract

:
Concentrations, size distributions and particle number vertical turbulent fluxes were measured by the eddy-covariance method at an urban background site in southeastern Italy during the summer. CO2/H2O concentrations and fluxes were also determined together with meteorological parameters. Time series show that particles could be divided into two size classes with negatively-correlated temporal trends in diurnal hours: nanoparticles (diameter Dp < 50 nm) and larger particles (Dp > 50 nm). Larger particles include part of the Aitken mode and the accumulation mode. Nanoparticles peaked in diurnal hours due to the presence of several days with nucleation events when particles Dp > 50 nm were at minimum concentrations. Nucleation increased diurnal total particle concentration by a factor of 2.5, reducing mean and median diameters from Dmean = 62.3 ± 1.2 nm and Dmedian = 29.1 ± 1.3 nm on non-event days to Dmean = 35.4 ± 0.6 nm and Dmedian = 15.5 ± 0.3 nm on event days. During nucleation events, particle deposition increased markedly (i.e., downward fluxes), but no significant changes in CO2 concentrations and fluxes were observed. This is compatible with new particle formation above the measurement height and a consequent net transport towards the surface. Correlation with meteorology shows that the formation of new particles is correlated with solar radiation and favored at high wind velocity.

Graphical Abstract

1. Introduction

The high concentration of particles in the atmosphere could be due to nucleation events and subsequent growth phenomena [1]. New particle formation events have frequently been observed in remote sites in clean air conditions, for example in boreal forests [2] and polar regions [3]. However, recent studies showed a ubiquitous distribution of these events in sites with significantly different characteristics. Nucleation events have been observed in different environments: in urban and rural sites [4,5,6], forest sites [7], urban background sites [8] and coastal sites [9,10].
Nucleation often extends for several hundreds of kilometers (i.e., regional nucleation events) and can occur throughout the year, being observed on 5% to 40% of days, depending on the season and region [11]. The widespread occurrence of nucleation and growth events suggests that this phenomenon could play an important role in cloud condensation nuclei concentrations, potentially influencing climate.
A yearly trend in the occurrence of new particle formation events has been observed in several sites, with more frequent events in spring and summer seasons [7,8,12]. The maximum growth rate was often observed during summer [13,14]. Measurements in urban East St. Louis (USA) showed that the frequency of nucleation events had an evident seasonal dependence, but the number of nucleated particles did not [14]. This yearly pattern was also observed in Northern Italy in a site influenced by major anthropogenic pollution sources [8].
The onset of nucleation is influenced by meteorological parameters and the pre-existing pollution levels. The influence of these parameters is still not completely clear, but nucleation is favored with high solar radiation input and low relative humidity [8,12,15]. Instead, pre-existing particles enhance the condensation, and coagulation sinks quickly, scavenging newly-formed particles, preventing them from being airborne for a sufficient time to grow and be detected [16]. However, high solar radiation and a low concentration of existing particle do not automatically lead to the formation of new particles, and other parameters, like water vapor concentrations, condensation sinks and concentration of gaseous precursors, play important roles [12]. In some coastal sites, new particle formation events were positively correlated with sensible heat flux and negatively correlated with water vapor flux [9,10]. Nilsson et al. [17] observed significantly higher turbulent kinetics energy (namely vertical turbulence) during nucleation days compared to days without nucleation.
The increase in fine and ultrafine particle concentrations associated with nucleation events on large volumes of atmosphere can influence vertical turbulent fluxes (emissions and deposition of particles), thereby influencing the exchange between surface and atmosphere. Knowledge of fluxes is important to understand ecosystem transfers and budgets of nutrients and pollutants. Relatively few research works have investigated this aspect, mainly in Central and Northern European sites [17,18,19,20,21].
Aerosol fluxes during nucleation events measured above forest canopy in Finland showed a systematic increase in deposition (i.e., downward fluxes) with respect to the deposition observed in the absence of nucleation [17,18]. This finding supports the hypothesis of an elevated source with particles formed above the canopy and the surface layer level and subsequently transported towards the soil. Similar conclusions were also obtained at a nature park in Lapland [21]. Measurements of aerosol fluxes at the coastal site of Mace Head (Ireland) showed tidal-related nucleation events with upward fluxes over three orders of magnitude larger than primary marine aerosol fluxes [19]. Measurements performed with a twin condensation particle counter (CPC) system at a forest site in Bavaria (Germany) showed that aerosol deposition during nucleation is dominated by ultrafine particles (with diameters between 3 nm and 11 nm), and in some nucleation events, fluxes of different signs are observed for particles of different sizes: downward for the ultrafine fraction and upward for larger particles [20].
The aim of this work was to investigate the effects of nucleation events on particle number turbulent vertical fluxes, characterizing the surface-atmosphere exchange of aerosol, and the effects on size distributions at an urban background area in summer conditions. The measurement site was chosen in southeastern Italy in a period of intense solar radiation and quasi-arid soil. The influence of meteorological and micrometeorological parameters on nucleation events and the correlation between new particle formation and CO2/H2O concentrations and fluxes were investigated. To the best of our knowledge, identification of nucleation events with simultaneous measurements of particle fluxes are not available for the Mediterranean, area therefore, this paper could also represent a good starting point for further investigations and comparison with other Mediterranean sites.

2. Experimental Section

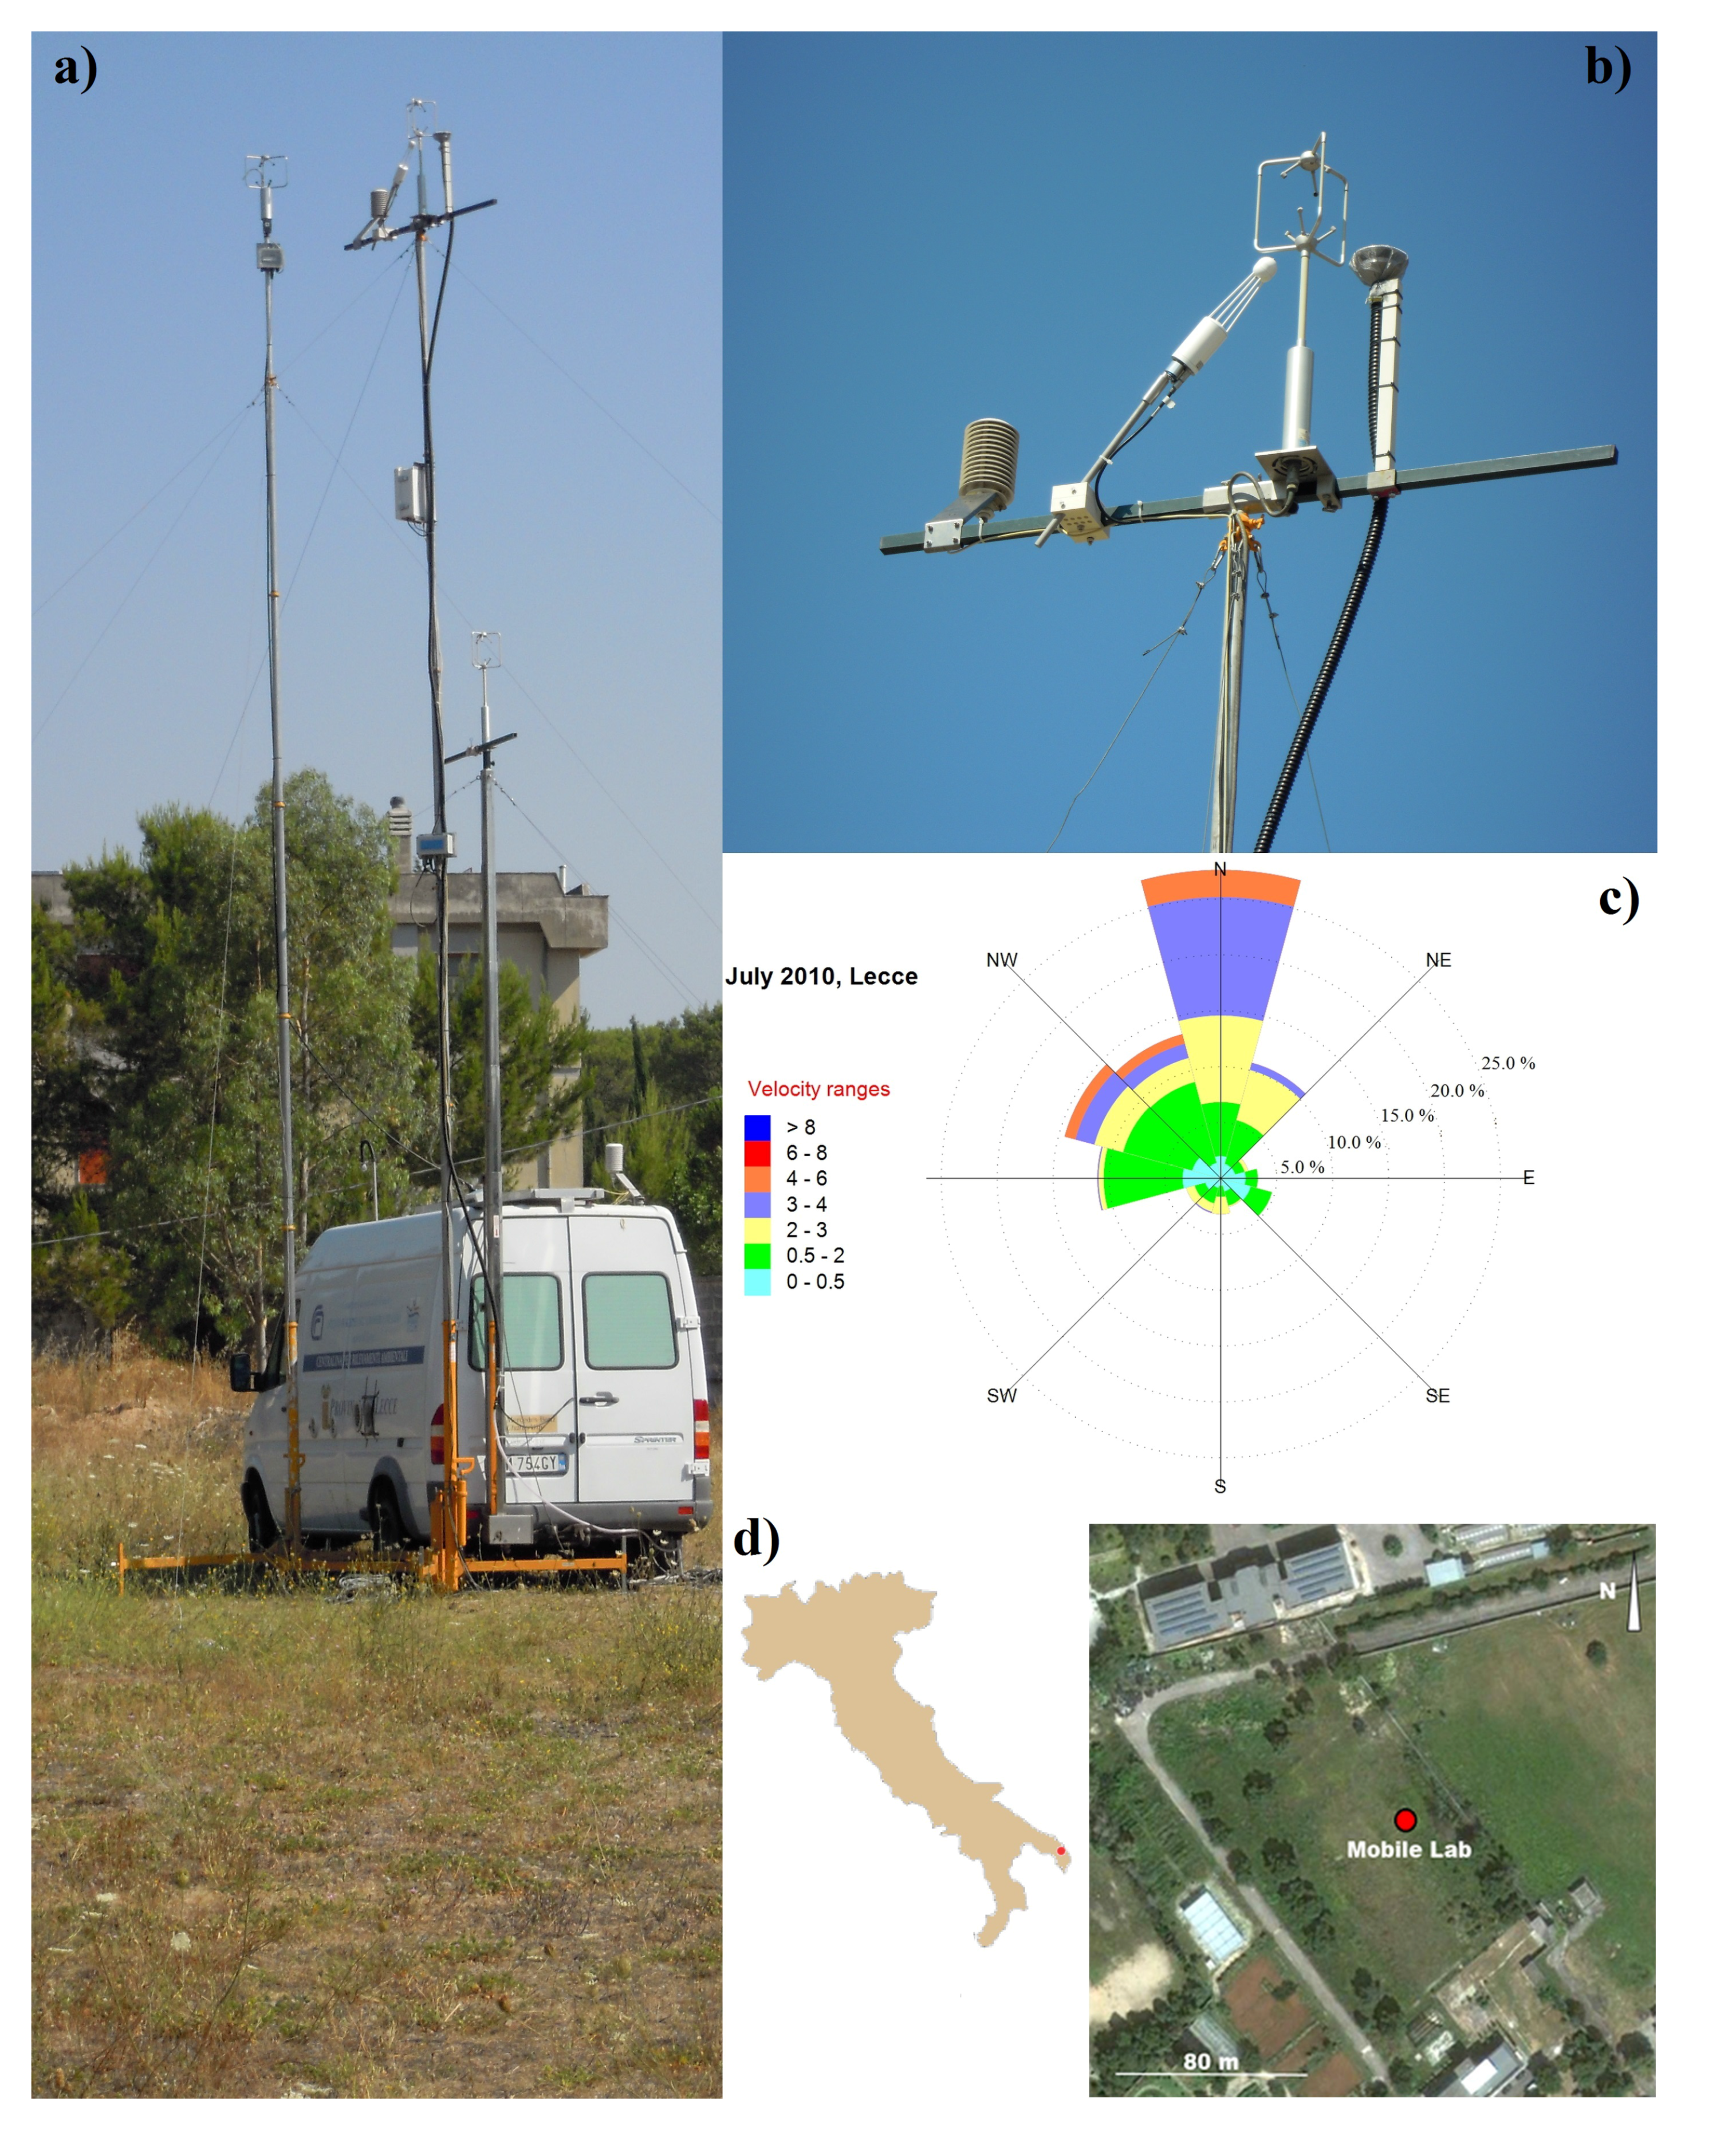
2.1. Site Description

Measurements were carried out at the experimental field of the Lecce Section of ISAC-CNR located inside a botanical garden on the university campus (40°20'10.8'' N, 18°07'21.0'' E), shown in Figure 1. The experimental site is a rectangular field with two contiguous sides surrounded by small trees, located about 4 km SW of Lecce city center. For at least 1 km in all directions, the area was characterized by clumps of trees (5–10 m tall), small buildings and internal campus roads. The site had a displacement height of 6.1 m (±0.4 m), and the roughness length was 0.53 m (±0.02 m) [22]. The measurement campaign was performed from 13 to 31 July 2010, mainly during daytime unstable atmospheric conditions. Figure 1c reports the wind rose of the measurement period showing a prevalence of winds from the north. Due to the proximity of urban areas (located about 4 km NE), the site can be categorized as an urban background area.

2.2. Instruments Used

All of the instruments used were on board the ISAC-CNR mobile laboratory. The first set of equipment was located at 10 m above the ground on a telescopic mast to measure vertical fluxes using the eddy-covariance (EC) method. The EC station included a condensation particle counter (CPC, Grimm 5.403), measuring the total particle number concentration at a sampling frequency of 1 Hz, an ultrasonic anemometer (Gill R3) to measure the three wind velocity components at 100 Hz and an IR gas analyzer (Li-7500, LICOR Environmental) for CO2 and H2O vapor concentration measurements.
The CPC output was connected to the analog inputs of the anemometer by means of a digital-to-analog conversion with a simple two-channel interface. More information on the instruments configuration is reported in Contini et al. [23]. The IR gas analyzer outputs were also sampled by the anemometer synchronously with wind velocity measurements.
Figure 1. Experimental setup inside the university campus: (a) mobile laboratory; (b) upper part of the mast hosting the eddy-covariance (EC) system; (c) wind rose relative to all of the measurement period; (d) satellite image showing the position of the measurement site.
Atmosphere 06 00942 g001
A second set of instrumentation comprised a scanning mobility particle sizer (SMPS, Grimm 5.500) to monitor aerosol size distribution at a 2.5 m above the ground with six-minute resolution in the size range between 11 nm and 1083 nm. The SMPS inlet was composed of a 0.8 m-long metal tube (22 mm internal diameter) with a flow-rate of 45 L/min maintained with a pump (Tecora Bravo HPlus). A portion of 0.3 L/min was injected into the SMPS column through a 0.7 m-long silicone conductive tube (6 mm internal diameter). SMSP measurements were corrected for the inlet losses evaluated according to Hinds [24].
The CPC inlet was an 8 m-long conductive tube (26 mm internal diameter) with a flow rate of 45 L/min (obtained using a second Tecora Bravo HPlus pump) to maintain a turbulent flow limiting the temporal distortion of concentration fluctuations. A portion of 1.5 L/min was injected into the CPC through a 0.8 m-long silicone conductive tube (6 mm internal diameter). The total counting efficiency was calculated as the product of the penetration factor and the counting efficiency of the CPC obtained from Heim et al. [25]. Results showed that the cut-off diameter (at 50% efficiency), D50, was around 10 nm, and the system was able to detect particles between 10 nm and 1000 nm (i.e., the upper limit of the CPC).

2.3. Post-Processing and Data Selection

The measured time series were de-spiked and treated with a three-dimensional rotation in the local streamlines reference system to remove errors due to wind sensor misalignment [26,27]. The mean (30 min) and fluctuating parts were extracted by performing a linear detrending to reduce the effects of slow changes in atmospheric parameters (i.e., daily meteorological cycle) on the calculated vertical turbulent fluxes [28,29].
The turbulent fluxes, F N = w N ¯ , were calculated as the covariance between the scalar (particle number concentration fluctuations, N') and the vertical wind velocity, w' (EC method) [30], over 30-min averaging periods. Similar calculations were performed to evaluate CO2 fluxes ( F C = w C ¯ ), sensible heat fluxes (H = cpρ w T ¯ ) and latent heat fluxes (E = ρλ w ρ v ¯ ); where ρ is the air density, ρv the water vapor concentration, cp= 1005 J/K kg the specific heat at constant pressure, λ = 2.47 × 10 6 J/kg the latent heat of evaporation and w ρ v ¯ the kinematic flux of water vapor.
To account for the time lag introduced by the aerosol sampling line, a fixed delay time of 12 s was adopted. This was determined looking for the average maximum of the cross-correlation between aerosol concentration and vertical wind speed as a function of lag time. Finally, a stationarity test was performed, as described in Mahrt [31], choosing a threshold of 2 for the non-stationarity index [32,33]. The percentage of non-stationary data was 6% for FN, 13% for FC, 17% for H and 16% for E. Non-stationary cases were removed from the following analyses.
Given the fast response of the CO2/H2O detector, no correction for he high frequency losses in the calculation of E and FC were applied. Measured E and FC were corrected for the effect of air density fluctuations [34]. The effect of air density fluctuations on FN was corrected using the approach reported in [35], and considering its absolute value, the correction was negligible, being on average about 0.2%.
The first-order time response of the CPC was τc = 1.3 ± 0.05 s, meaning that the system is not able to resolve high frequency fluctuations. This value was obtained in ten repeated laboratory experiments measuring the complete eddy-covariance flux system response to a concentration step, and the variability observed in these experiments was used to evaluate the uncertainty. This response time proved sufficient to measure concentration fluctuations at frequencies that typically made a substantial contribution to the vertical turbulent fluxes of particles [23,36,37]. However, the high frequency undersampling generates an error on FN that needs to be corrected. The correction used was based on the approach developed in [36]. The average correction for the high frequency losses on FN was about 23%.
The uncertainty on FN due to the random statistical counting errors in the CPC was estimated assuming random Poissonian counting statistics [38]. The average statistical error in the measurements reported in this paper was about 1%.
The aerosol size distribution obtained with the SMPS system was averaged on 30-min periods, in line with vertical fluxes measured by the EC station.

3. Results and Discussion

Size distributions measured with the SMPS were divided into two groups based on particle diameter Dp: nanoparticles (Dp < 50 nm) and larger particles (Dp > 50 nm). Larger particles, abbreviated as N > 50 , include part of the Aitken mode and the accumulation mode [24]. This classification is somewhat arbitrary, but it was confirmed by the correlation analysis of time series associated with the different size classes measured with the SMPS. The Pearson coefficients (rxy) between the temporal pattern of particle concentrations in different sizes were calculated for each possible combination of size classes. The results in Figure 2 show a good temporal correlation (rxy > 0.4) among the classes in the first group (i.e., the first 16 classes, up to Dp = 46.8 nm, defined as nanoparticles) and a good correlation among the other classes (Dp > 46.8 nm). However, small and large particle concentrations appear to be almost uncorrelated, suggesting that the two categories had a different temporal dynamics, even if subjected to the same meteorological and micrometeorological conditions. This indicates that they are likely influenced by different chemical-physical processes and/or different sources.
Figure 2. Time correlation between the 43 different channels of the SMPS. The diagonal has rxy = 1.
Atmosphere 06 00942 g002

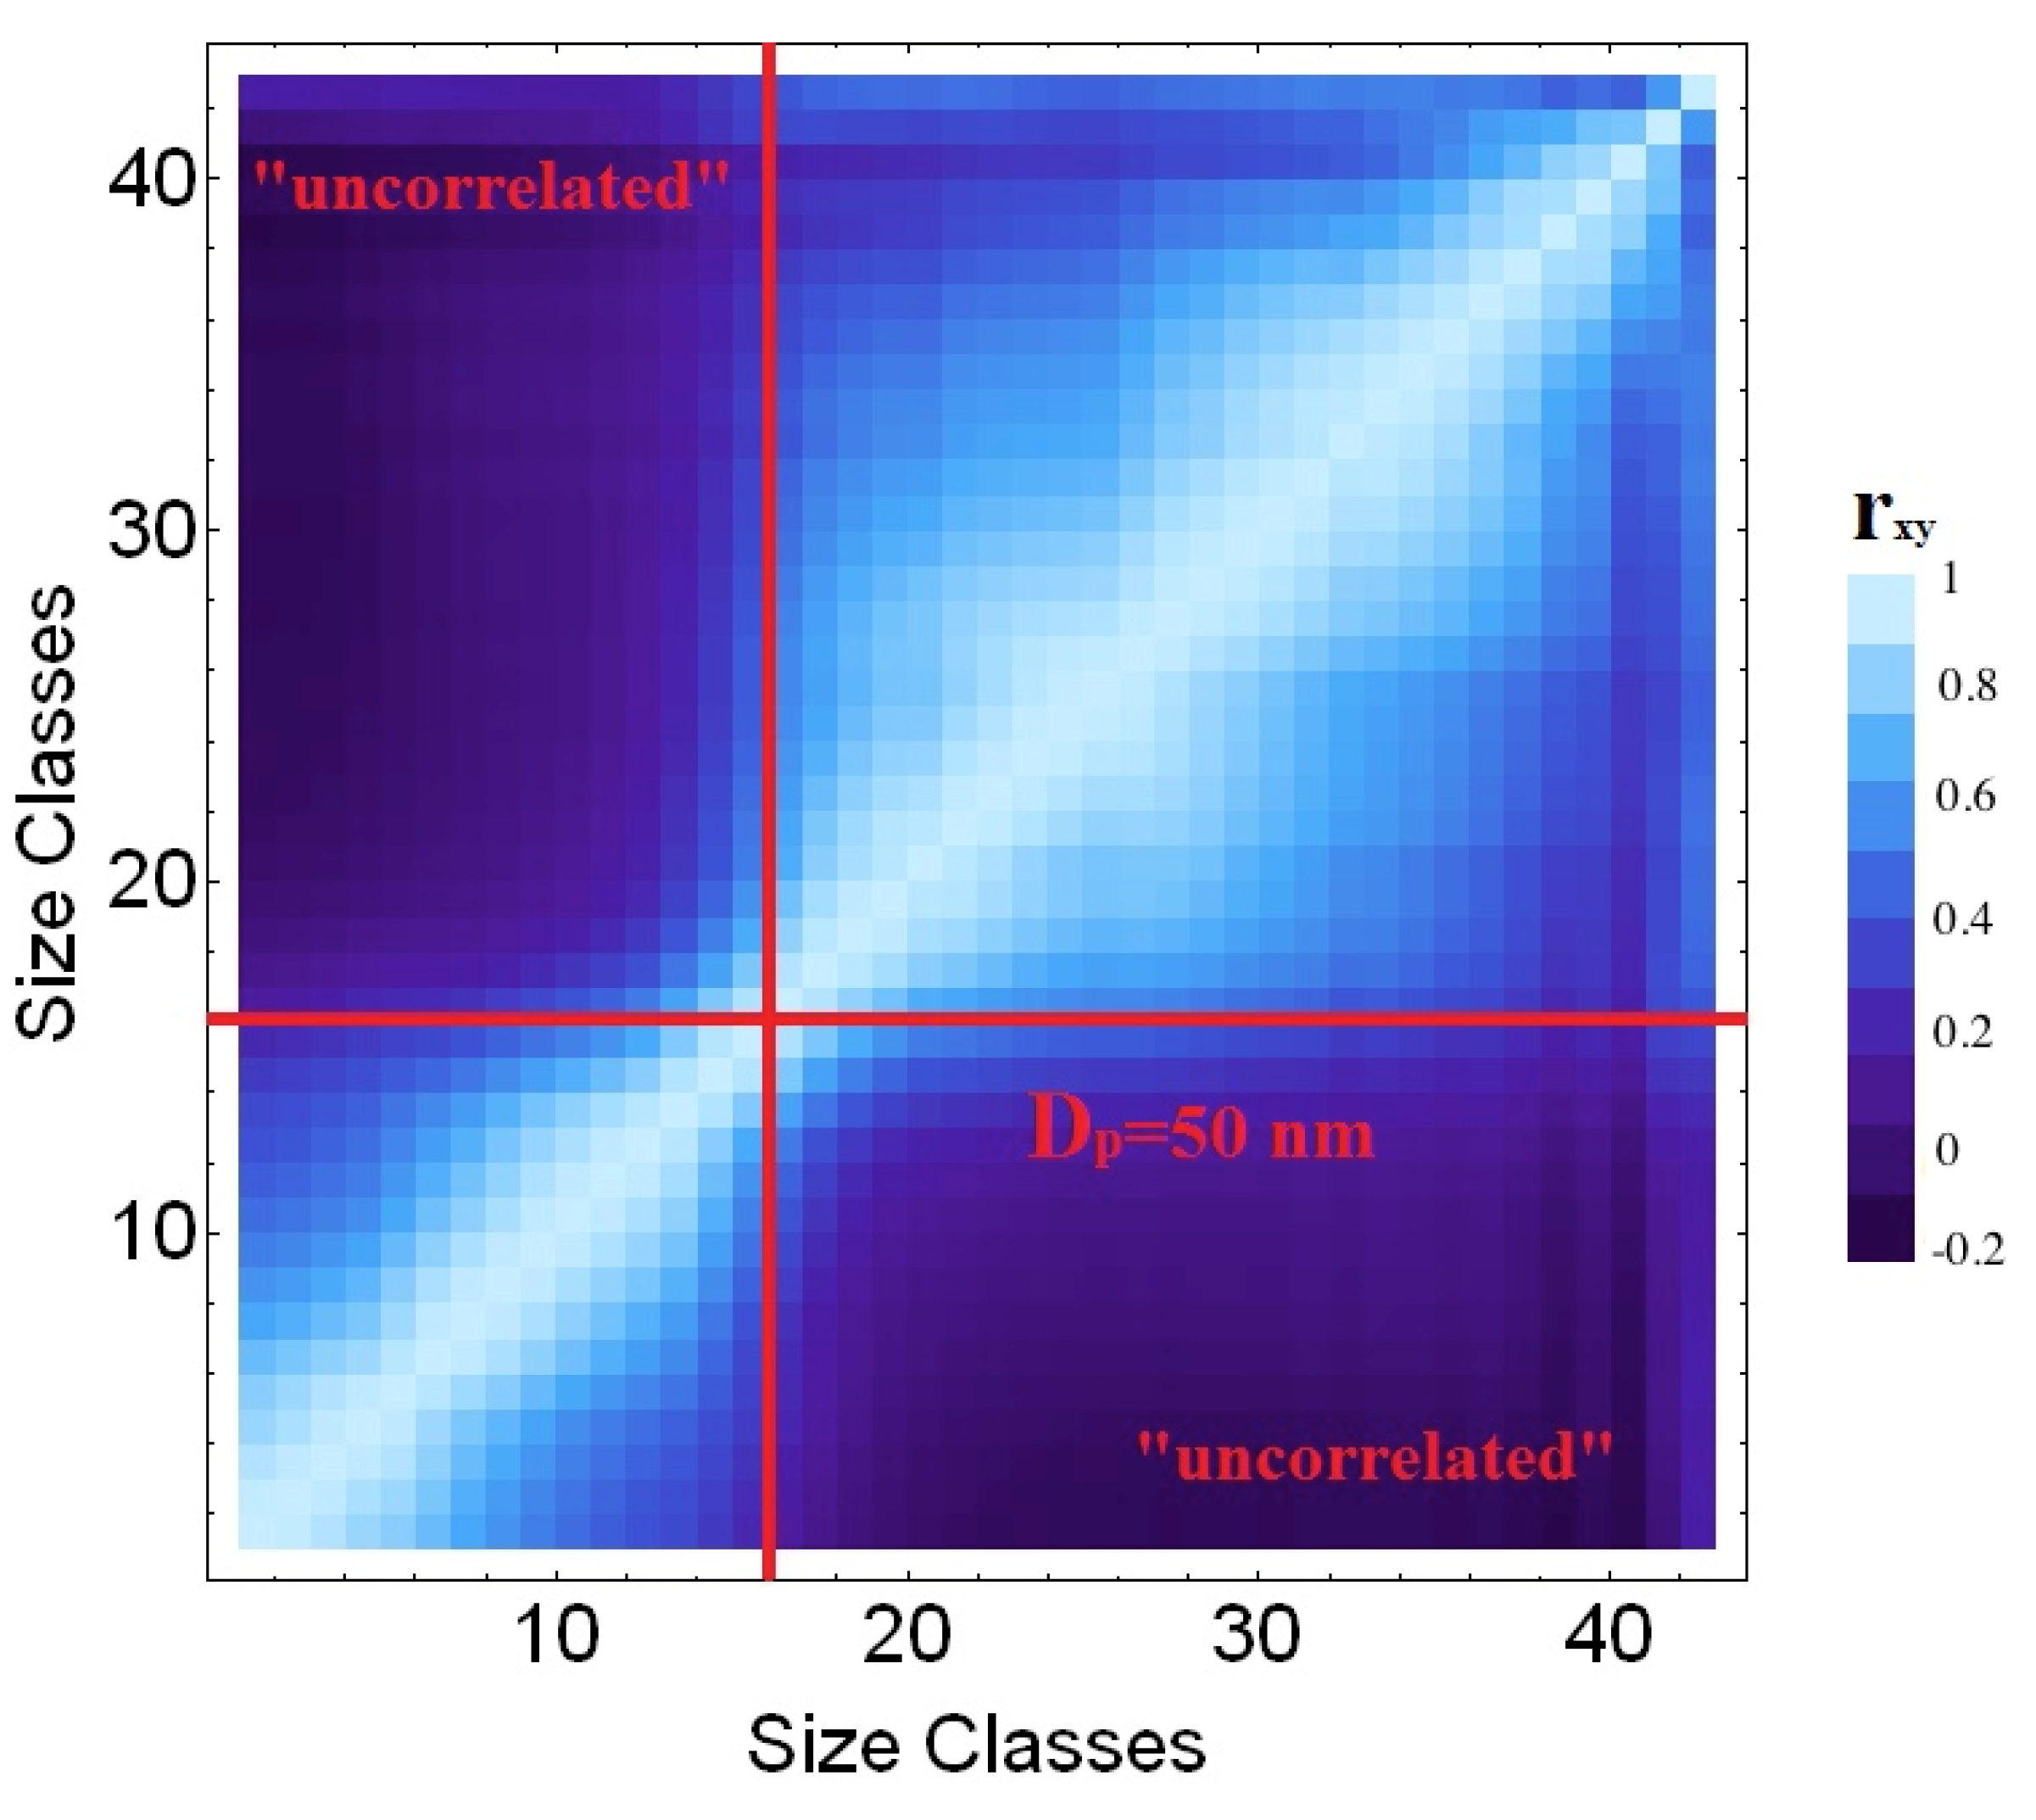
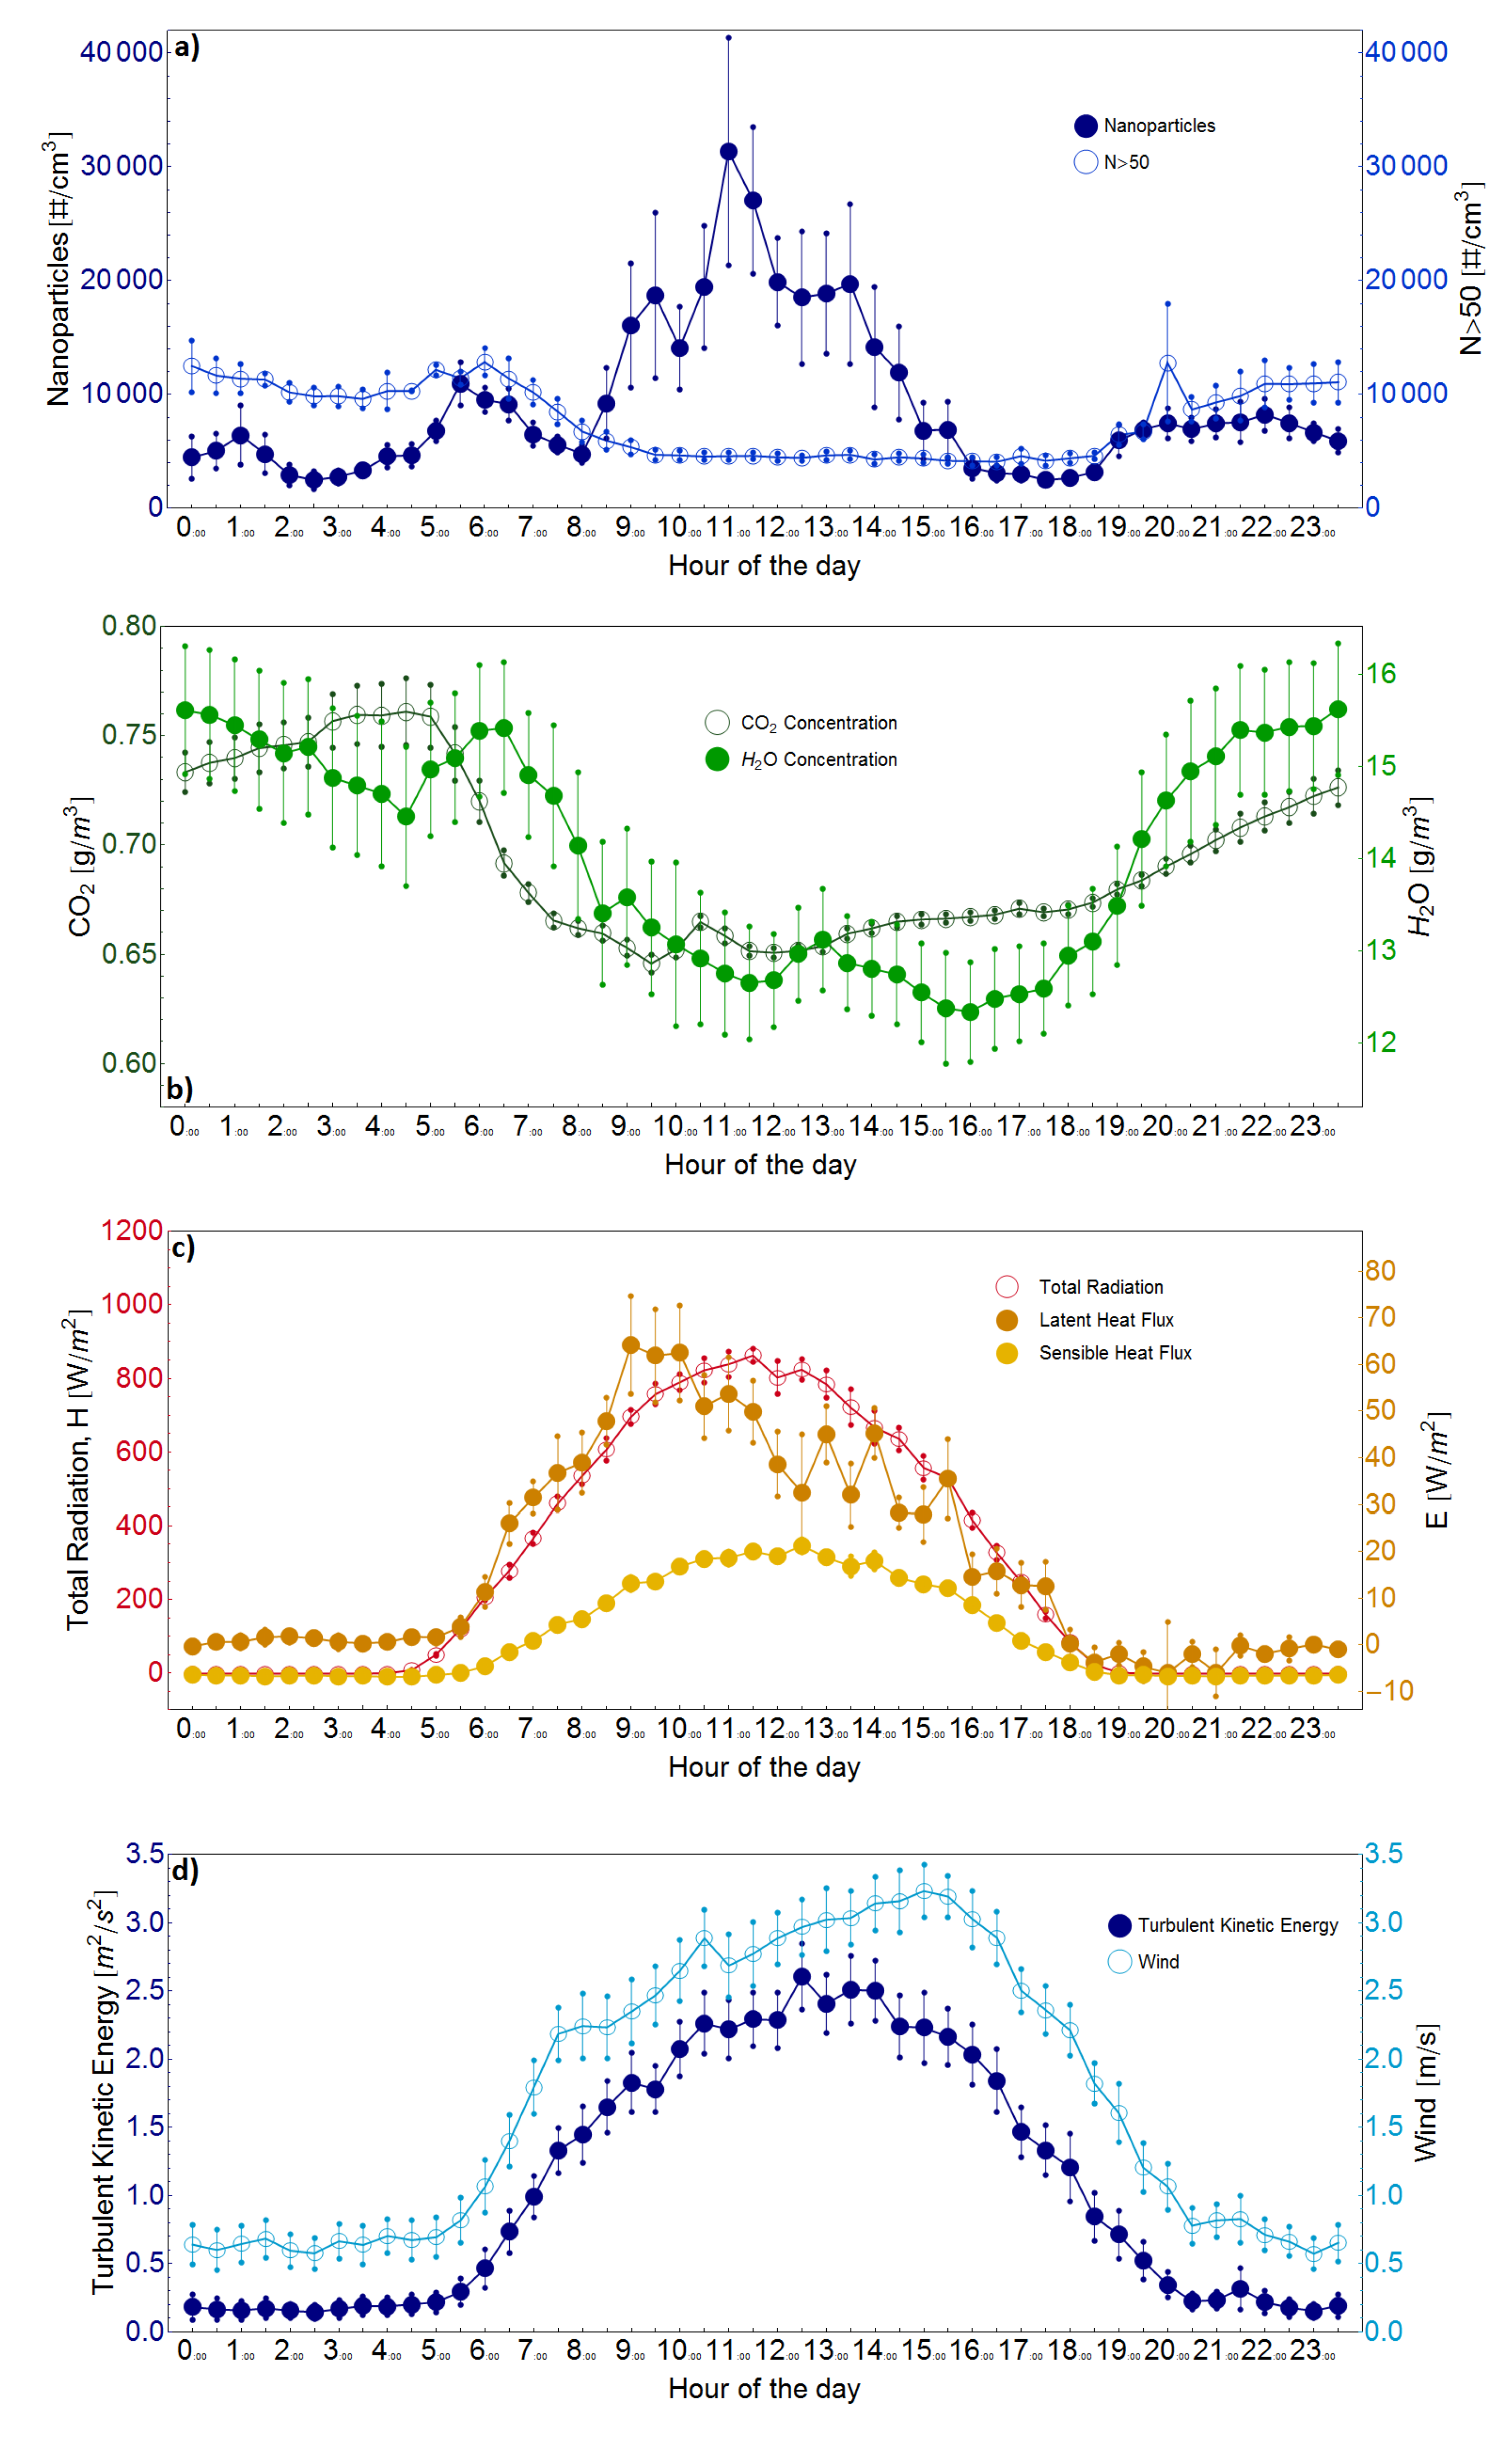
3.1. Characterization of Measured Concentrations and Size Distributions

The average daily concentration patterns of Np and N > 50 were calculated and are shown in Figure 3a.
Figure 3. Average daily concentration patterns of nanoparticles and particles larger than 50 nm (a); H2O/CO2 concentrations (b); solar radiation, sensible heat flux H and latent heat flux E (c); wind velocity and turbulent kinetic energy (d). Vertical bars represent standard errors.
Atmosphere 06 00942 g003
A similar analysis was done for H2O/CO2 concentrations (Figure 3b) and for solar radiation, sensible heat flux H, latent heat flux E (Figure 3c) and wind velocity and turbulent kinetic energy (TKE) (Figure 3d). Results show a particle concentration peak early in the morning (between 05:00 and 07:00) and an evening broad peak (between 19:00 and 23:00) visible on both Np and N > 50 particles; the two size classes also have similar concentrations. This behavior could be related to the typical contribution of road traffic near the measurement site. In the urban area of Lecce, road traffic has characteristic rush hours coinciding with the two peaks [23].
During the daytime, there is a large concentration peak of nanoparticles between 09:00 and 16:00 not visible on particles with Dp > 50 nm whose concentration remains almost constant at the minimum daily levels throughout the period. This peak is not visible on the diurnal trend of CO2 concentration (Figure 3b). Average CO2 concentrations show a minimum in diurnal hours, similar to that of particles with Dp > 50 nm, which seems to be determined by the biogenic cycle and the diurnal evolution of the surface layer depth. This indicates that the peaks are not associated with local combustion sources of anthropogenic origin.
The average diurnal increase in nanoparticle concentration is due to several days on which nucleation and growth events of new particles occurred. The sensible and latent heat fluxes together with the total solar radiation are shown in Figure 3c. The average solar radiation in the period of the diurnal nanoparticle peak (09:00 to 16:00) was 713 W/m2. Sensible and latent heat fluxes were positive during this period with average values of 282 W/m2 and 39.7 W/m2, respectively. The relatively low values of the latent heat fluxes indicate a period of quasi-arid soil. Nucleation events are favored in this condition of high solar radiation and low humidity conditions [13,39,40]. The average wind velocity was relatively low during nocturnal hours (<1 m/s) and increased in diurnal hours. The daily pattern of TKE was similar to that of wind velocity. A clear daily pattern of prevalent wind direction was not observed. In diurnal hours, the prevalent wind direction was from the N; however, nocturnal hours were characterized by weak winds (velocity <1 m/s on average) with ample variability in wind direction.
During the period of increased nanoparticles concentration, H2O and CO2 concentrations (Figure 3b) are respectively ∼13 g/m3 and ∼0.66 g/m3; while during the rest of the day, they are ∼15 g/m3 and ∼0.71 g/m3. The Pearson correlation coefficients of measured concentrations with meteorological parameters are reported in Table 1. Nanoparticles show a good (rxy ≥ 0.5) positive correlation, suggesting a direct correlation with meteorological parameters, while larger particles show negative correlations with Pearson coefficients often higher (in absolute values) than those observed for nanoparticles. This is in agreement with the correlation data reported in Figure 2 and is likely due to different influences of chemical-physical processes and sources on particles of different sizes [41,42].
The size distributions measured in each 30-min period were used to evaluate the mean diameter (Dmean) and median diameter (Dmedian) [24] of atmospheric particles. Dmean was defined as:
D mean = 0 x f ( x ) dx
where f(x) is a step function with constant value in each size class Ii, interpreted as a (normalized) probability distribution. The function is defined, from measured data, as:
f(x) = 1 N C i δ i x I i
where N is the normalization factor, such that 0 f(x)dx = 1 , Ii is the i-th size class, δi its length and C i is the concentration of the i-th class. The median diameter was defined by the value for which the following equation holds:
0 D median f(x)dx = 1 2
Both Dmean and Dmedian show an inverse correlation with the concentration of nanoparticles, i.e., they decrease between 09:00 and 16:00 (Figure 4). The minimum diameters were observed around 11:00 at the time of peak in nanoparticle concentration, followed by a growth of the mean and median diameters of particles up to about 16:00. This behavior is compatible with days on which there are events of new particle formation and subsequent growth [43].
Table 1. Pearson correlation coefficients between particle concentrations, CO2 concentrations, meteorological and micrometeorological parameters.
Solar RadiationTemperatureRel.HumidityWind Velocity
W/m2%m/s
Nanoparticles0.770.50−0.490.55
Particles Dp > 50 nm−0.74−0.900.91−0.92
CO2 Conc.u *HE
g/m3m/sW/m2W/m2
Nanoparticles−0.530.530.770.71
Particles Dp > 50 nm0.84−0.88−0.77−0.63
Figure 4. Daily trends of mean and median diameters of particles evaluated throughout the measurement period.
Atmosphere 06 00942 g004

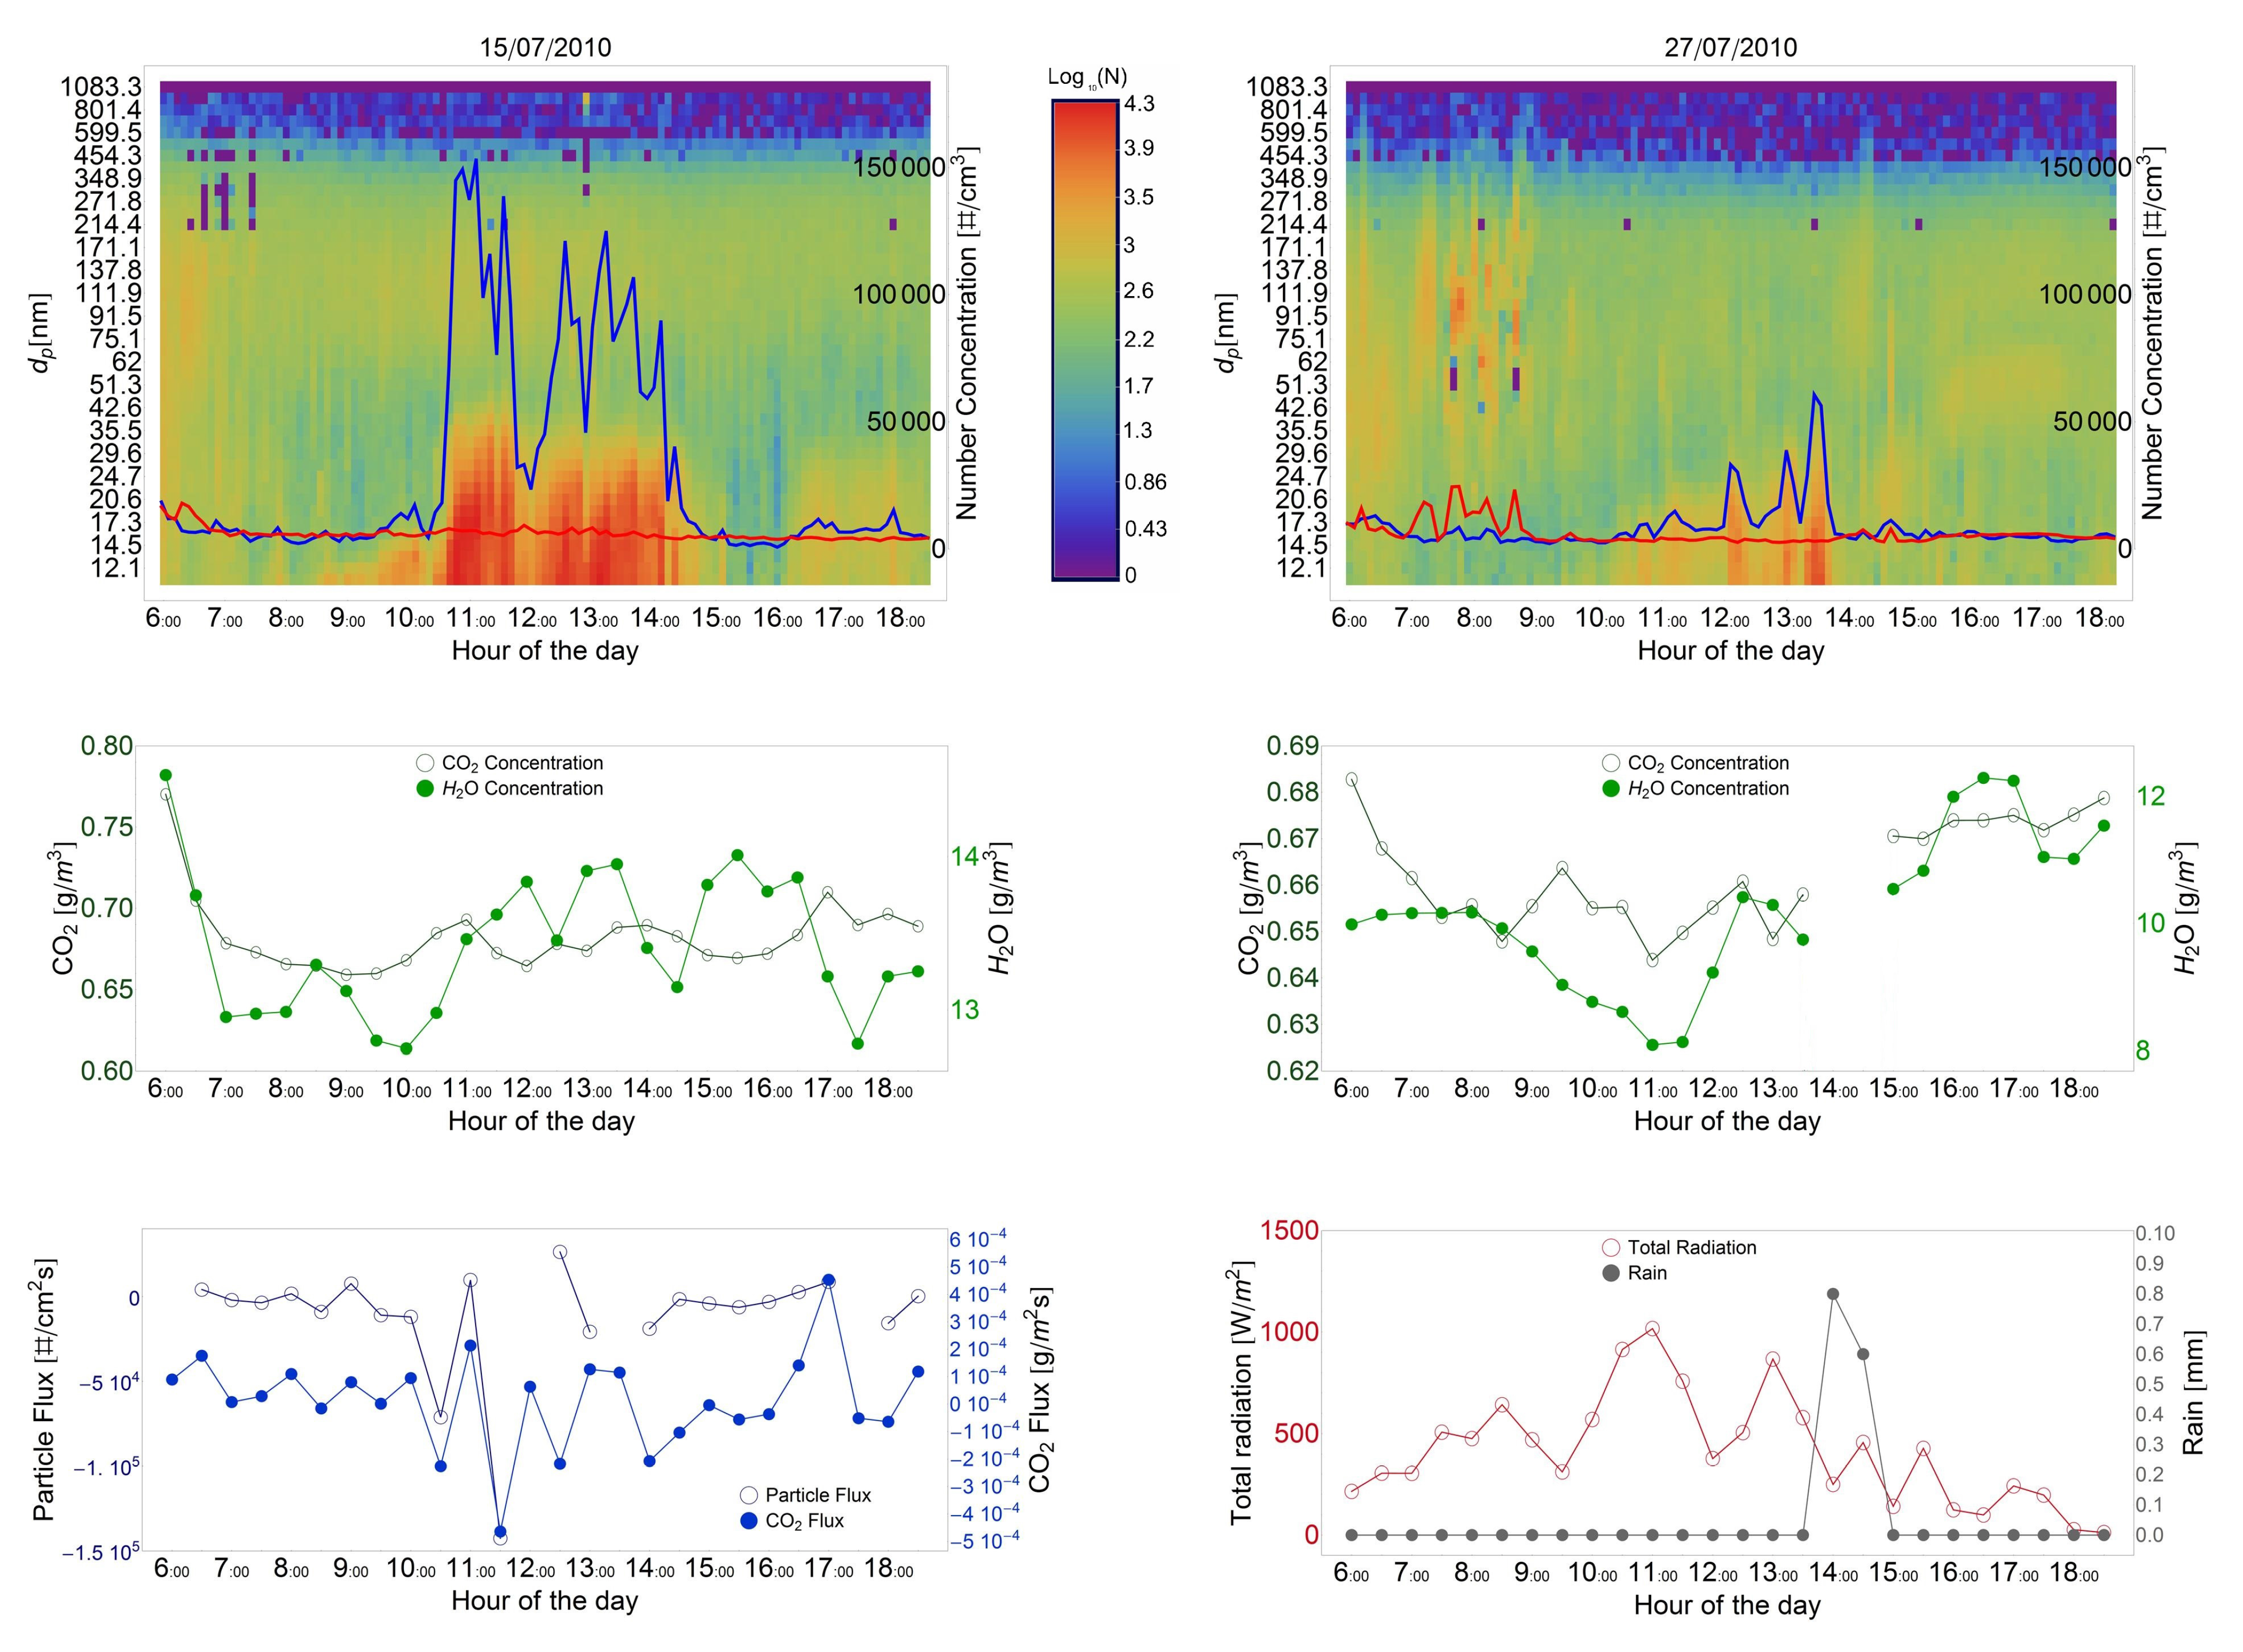
3.2. Analysis of Specific Nanoparticle Events

To investigate the dynamics of new particle formation events, the measurement period was divided into event days (E) and non-event (NE) days. Event days are those with a clear increase of concentration in the nucleation mode size range (diameter < 50 nm), starting at the lowest detectable sizes of the SMPS in diurnal hours and lasting for several hours, accompanied by a growth pattern. These correspond to new particle formation events. Specifically, a quantitative criterion has been used to evaluate the increase of nanoparticles concentration, and a day was a candidate to be considered an event day if the nanoparticles concentration contributed more than 75% to the total number concentration for more than two hours. The other days with no apparent nanoparticles concentration peaks or in which a certain period of growth in diurnal hours was not observed were classified as non-event days. Event days represent 47% of the measurement days.
Two examples of event days are shown in Figure 5 for 15 July 2010 and 27 July 2010.
Figure 5. Evolution of the size distributions during two event days (15 July 2010 in the left panel, 27 July 2010 in the right panel) with Np (blue) and N > 50 concentrations (red). CO2 and H2O concentrations are also shown for the two events. FN and FC fluxes are shown for 15 July 2010, and solar radiation and precipitation are shown for 27 July 2010.
Atmosphere 06 00942 g005
On 15 July, nanoparticles dominated the total particle number concentration and started to increase at around 09:00 in the morning with a very steep increase in concentration. No significant changes were observed for CO2 and H2O concentrations. Vertical turbulent fluxes were almost zero before 09:00 and became strongly negative afterwards, indicating a downward flux (i.e., deposition of particles). This behavior is compatible with new particle formation above the measurement height with a net transport downward towards the surface.
This behavior of aerosol flux is similar to the results obtained above forest canopies [17,18,20]. The fluctuations in the absolute values of fluxes during new particle formation and growth indicate a variability on time scales just below 30 min that is also visible on concentrations. This is not uncommon and was also observed in other measurements sites on fluxes during nucleation events [17].
27 July 2010 is interesting, as it shows the impact of meteorological parameters on the formation and growth of particles. On this day, nucleation started later, between 10:00 and 11:00, coinciding with the increase in solar radiation (Figure 5). The day was cloudy, and there were oscillations in solar radiation, as well as temperature that modulate the event (nanoparticle concentration was significantly lower with respect to the 15 July 2010 event). In the early afternoon (14:00), a light precipitation of 1 mm of water in 30 min definitively interrupted the event. The nanoparticle concentration was about 34,000 particles cm−3 just before precipitation and about 5000 particles cm−3 just after precipitation. This result emphasizes the important role of local meteorology in the dynamics of nucleation events and suggests a major effect of wet scavenging also on nanoparticles.

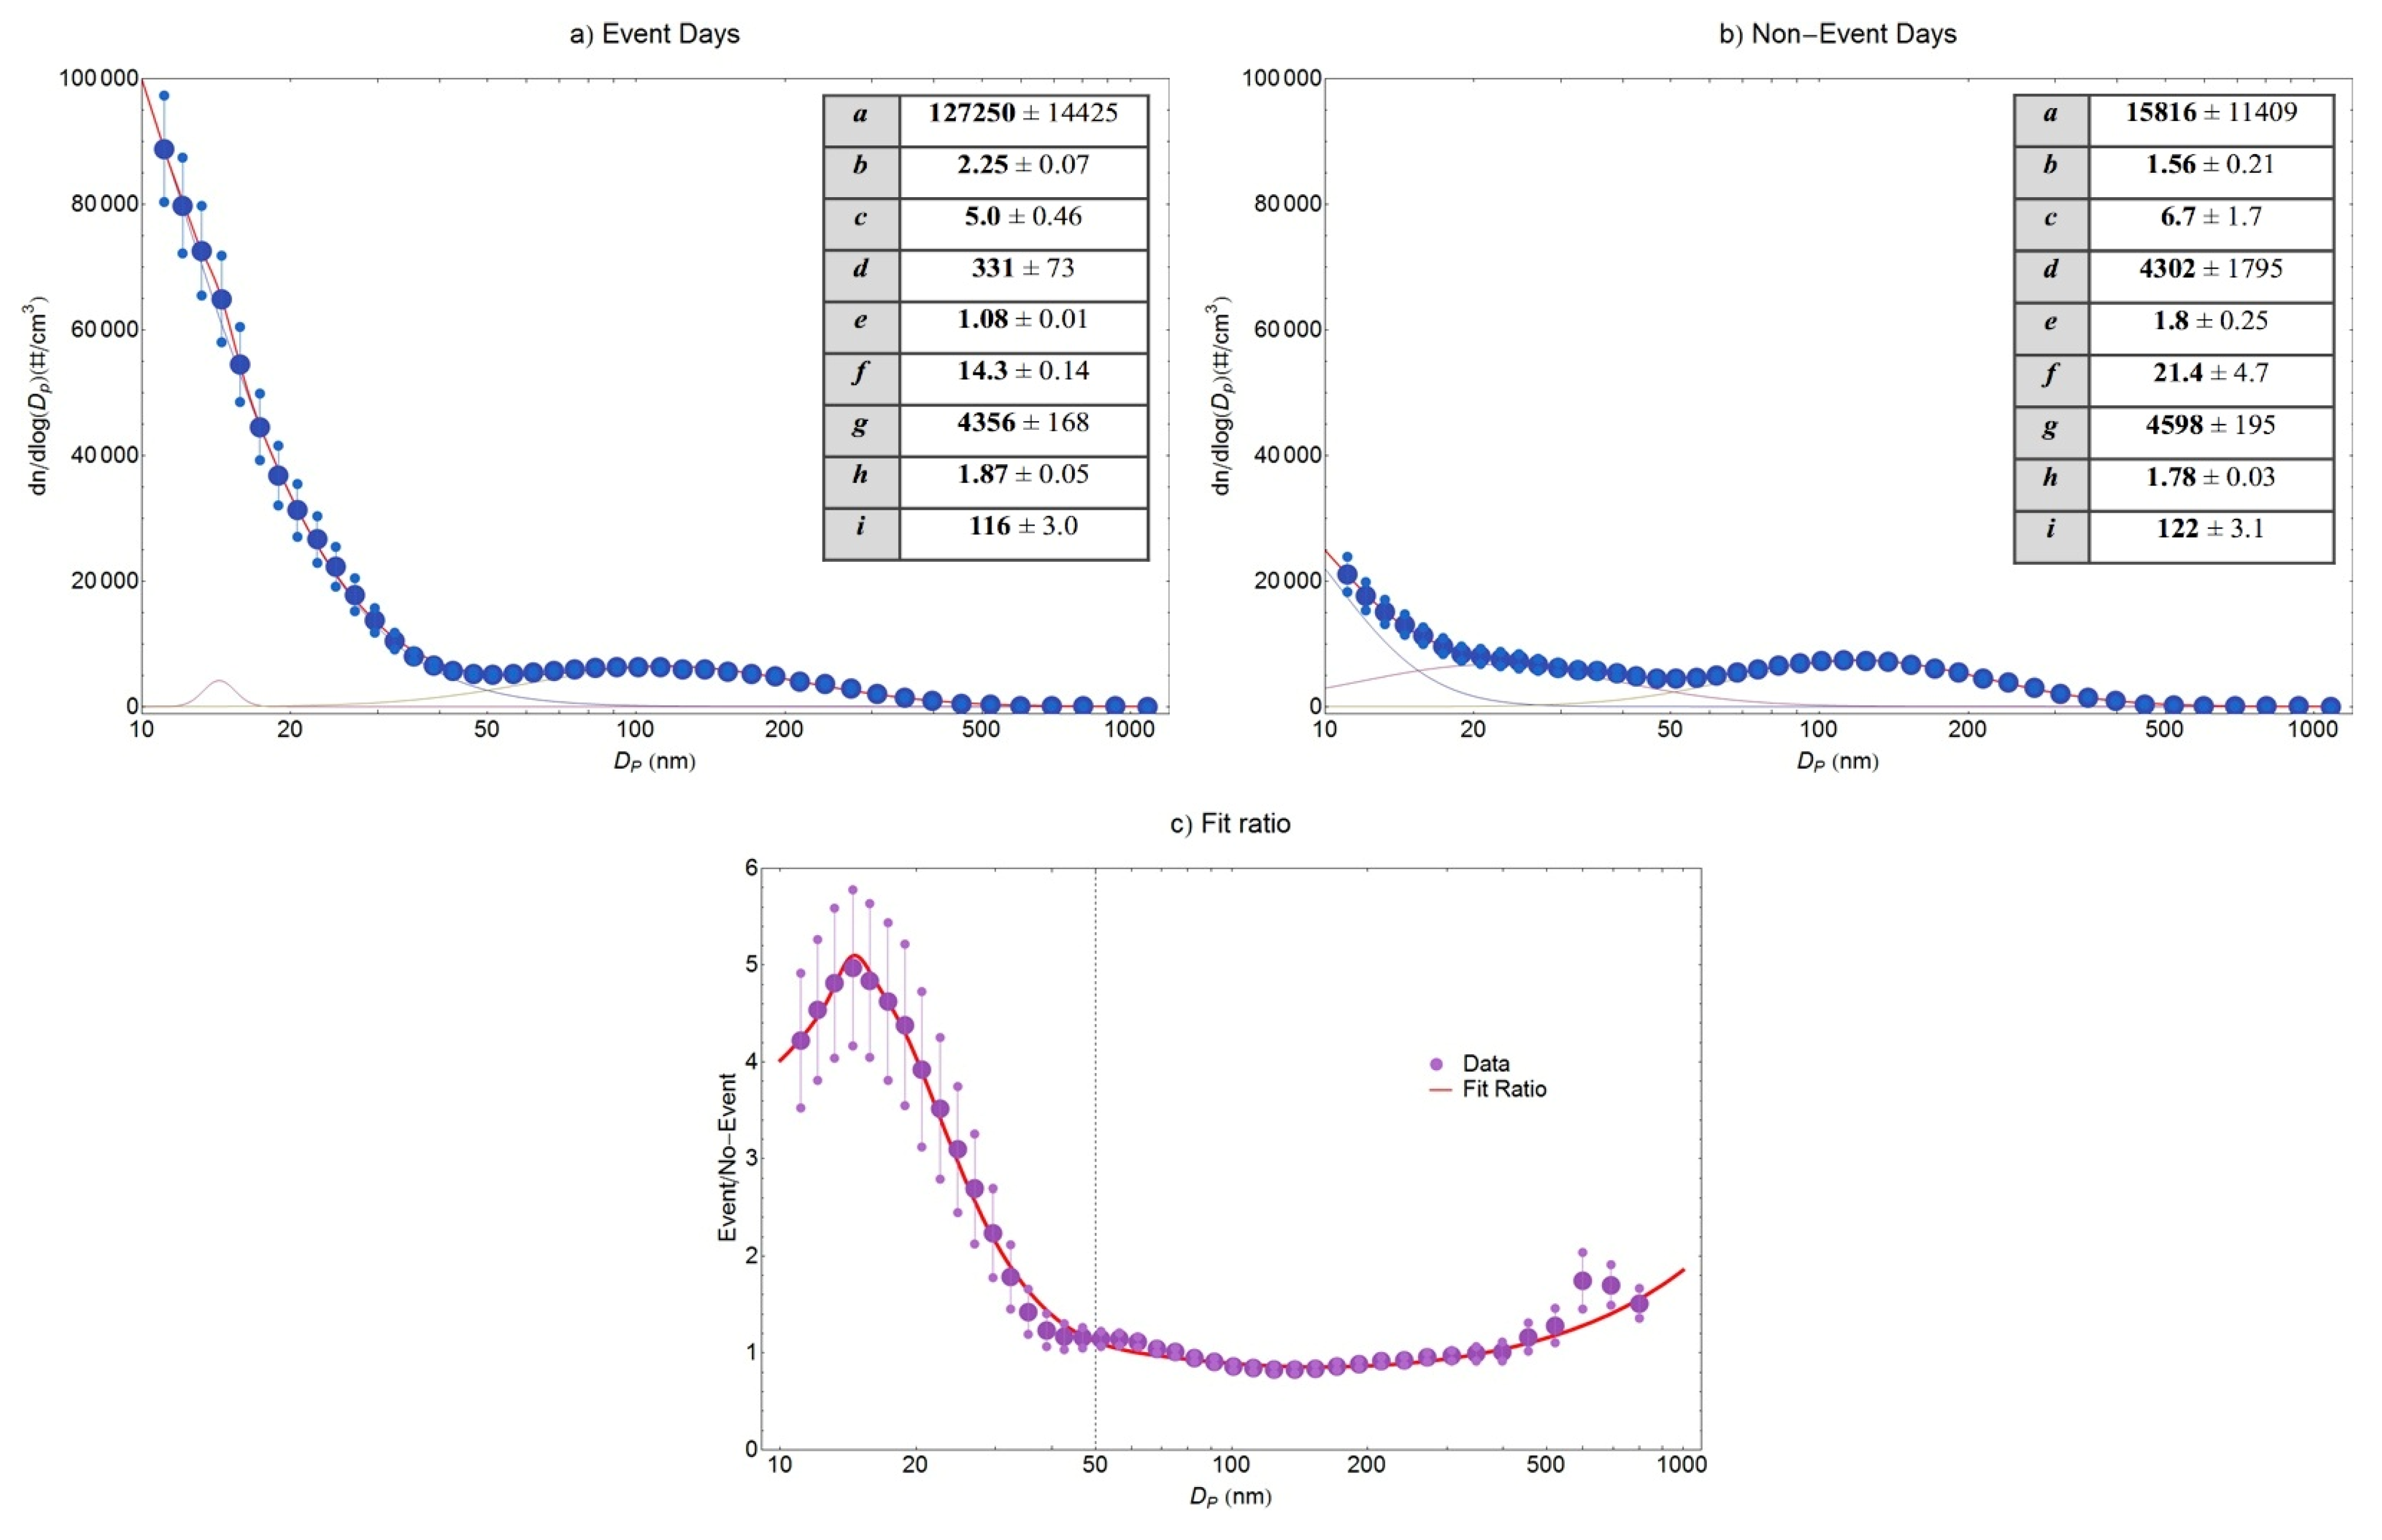
3.3. Comparison between Event and Non-Event Days
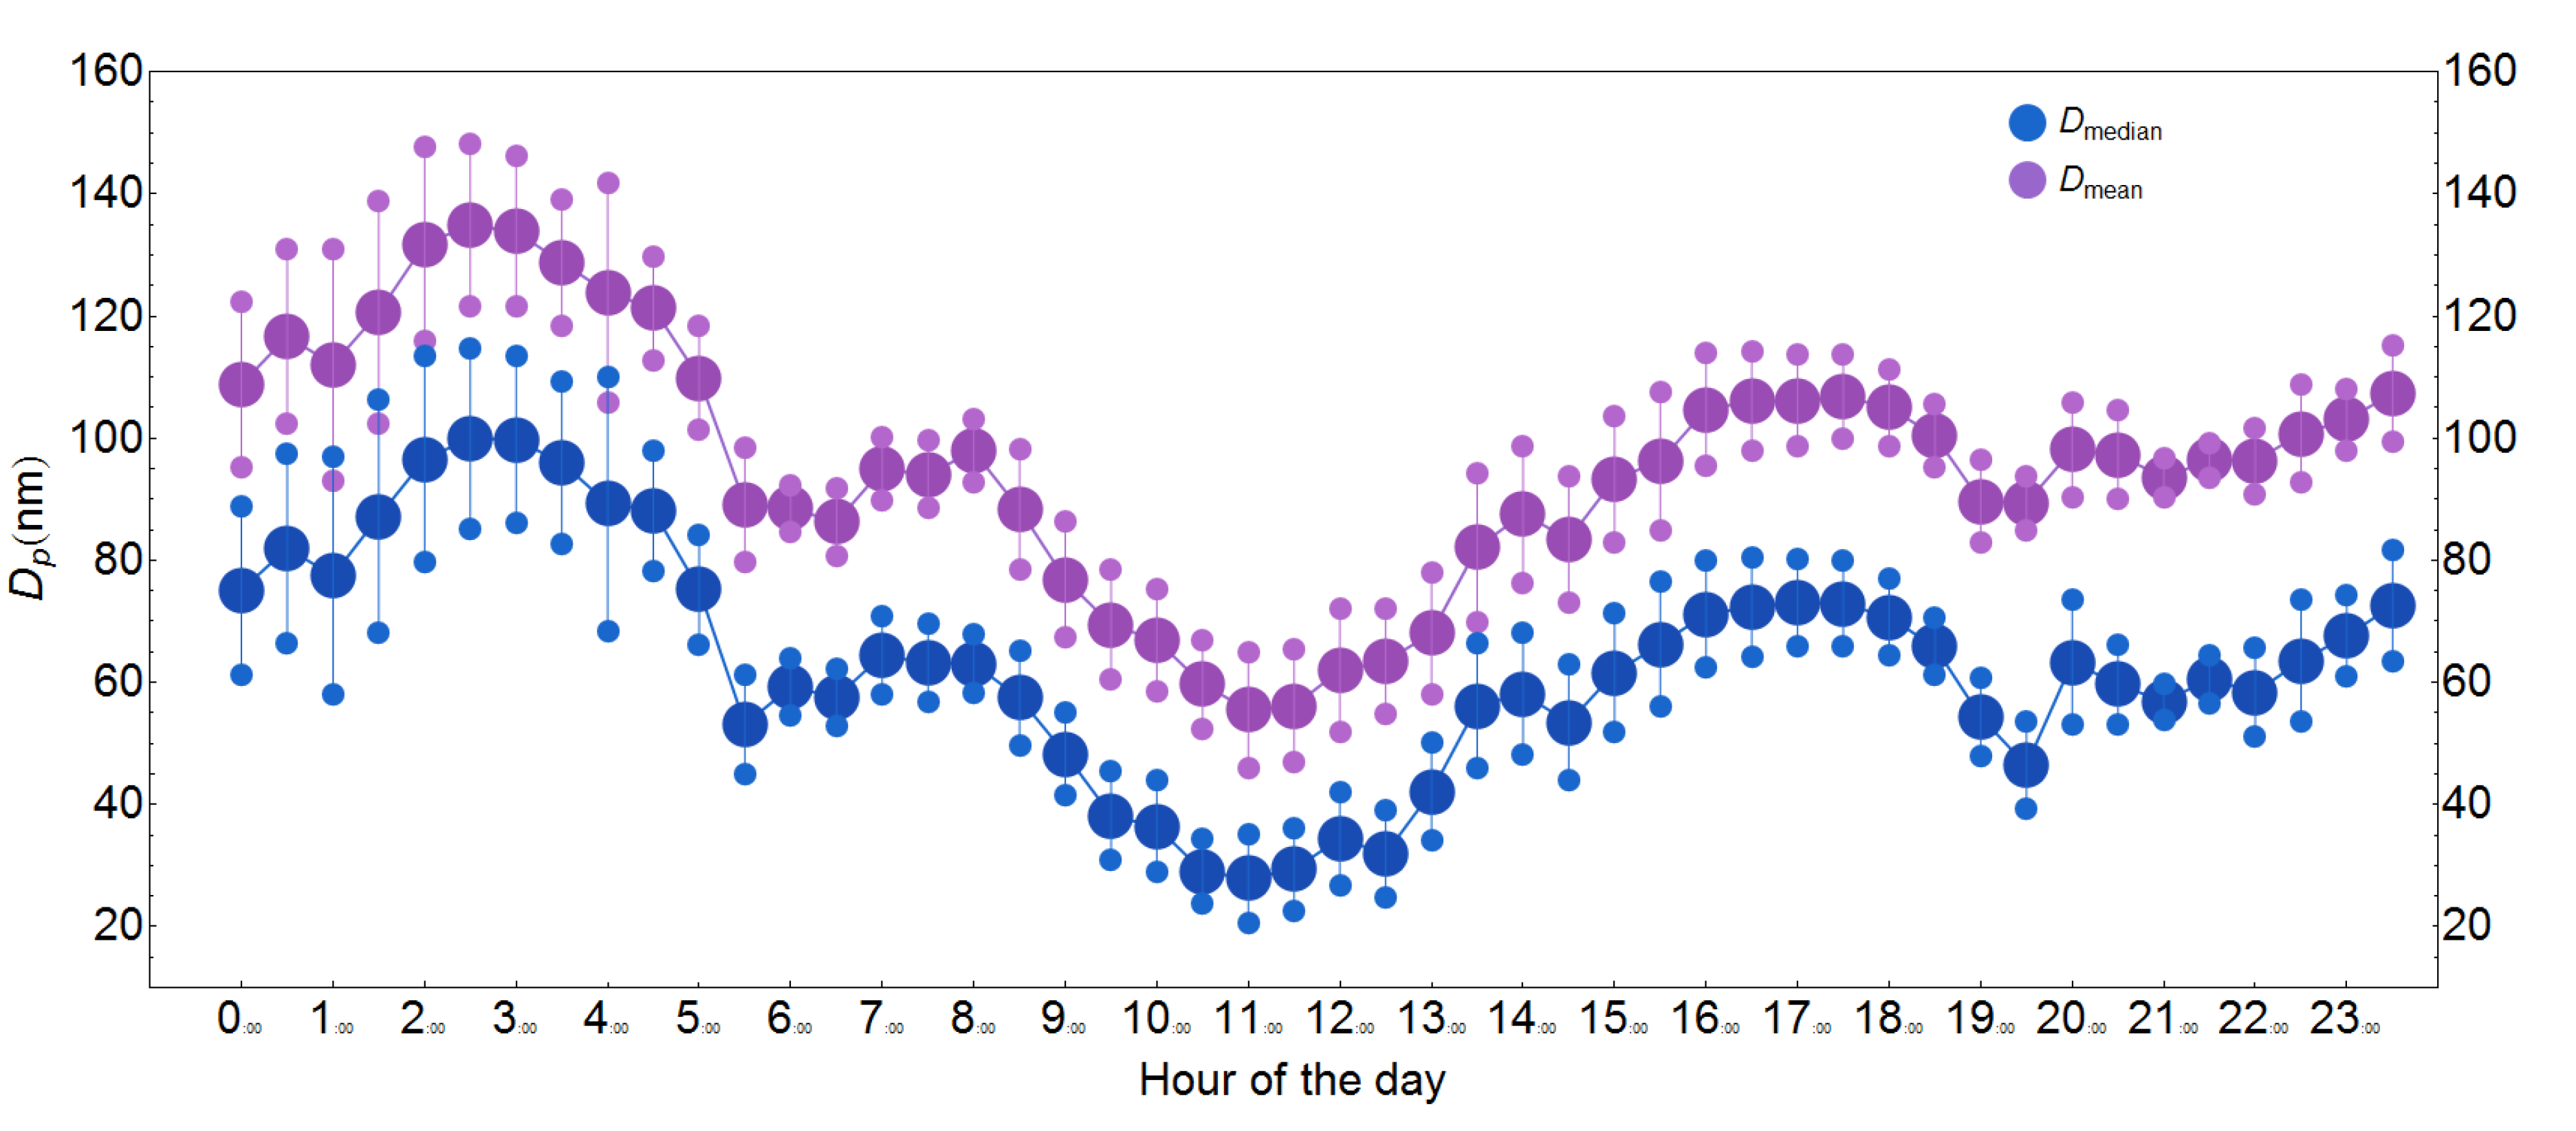
The average size distributions for the two categories (E and NE days) were obtained considering data in the period between 09:00 and 16:00. The resulting size distributions were fitted with a combination of three lognormal distributions representing the different aerosol modes. The average size distribution associated with the E days could effectively be fitted with only two lognormal distributions, but the average size distribution associated with NE days clearly showed three modes, with two of them located in the nanoparticle size range. Therefore, it was decided to fit particle size distributions, both for E and NE days, with the sum of three lognormal distributions, according to the following formula [24]:
f(x) = a e log 10 ( x ) log 10 ( c ) 2 2 log 10 ( b ) 2 2 π log 10 ( b ) + d e - log 10 ( x ) - log 10 ( f ) 2 2 log 10 ( e ) 2 2 π log 10 ( e ) + g e - log 10 ( x ) - log 10 ( i ) 2 2 log 10 ( h ) 2 2 π log 10 ( h )
There is a larger uncertainty in the fit of the first mode due to the limit of the SMPS used that is not able to detect particles smaller than 11 nm. Nonetheless, a reasonable result was obtained to investigate the approximate contribution of nucleation events in nanoparticle concentrations.
The results of the fits are reported in Figure 6 together with the values of the fitting parameters and their uncertainties. The results show that the peak value of the first mode changes significantly. On event days, the nucleation mode is about 3.7-times higher than on non-event days, whereas the accumulation mode (the third lognormal located at about 120 nm) is essentially unchanged. The second mode in nanoparticles size range (between 15 nm and 20 nm) is almost negligible during E days, but represents a large share of the total particle concentration on the NE days. The ratio of the two size distributions is shown in Figure 6c. The peak observed in the ratio (located at about 15 nm) is a direct consequence of the second nanoparticle mode during NE days. The mode associated with particles having diameters larger than 50 nm is almost unchanged for the two groups of data, and the ratio between the size distribution is essentially unitary for Dp > 50 nm. There is an increase in the ratio for particles with Dp > 50 nm that is not statistically significant and is actually due to the relatively low counting statistics in these size intervals.
Figure 6. Fit with three lognormal distributions for the event days (a) and for the non-event days (b). The ratio between event and non-event distribution is reported in (c) together with a table of the best fit parameters and their standard errors.
Atmosphere 06 00942 g006
The average statistics (in the period between 09:00 and 16:00) for different meteorological and micrometeorological parameters, including the number of particles, CO2 and H2O fluxes, were calculated separately for E and NE days. Results are reported in Table 2 with variability ranges corresponding to the standard errors. Even if the measurement period is limited, some considerations can be drawn from these results. The statistical significance of the observed differences in average parameters in E and NE days was tested using the Student t and the Mann–Whitney tests. Specifically, we used the tests to identify if the time-series of the different variables measured in E and NE days have statistically different averages. A difference is considered statistically significant if the probability to have the same averages was lower than 5% (95% confidence level). On average, the total particle concentration is about 2.5-times larger on E days with respect to NE days. This is essentially due to the average increase during E days of nanoparticles concentrations from 6127 ± 693 particles cm3 on NE days to 22,794 ± 2200 particles cm3 on E days. Particles larger than 50 nm remain at similar levels, 4694 ± 128 particles cm3 on NE days and 4376 ± 121 particles cm3 on E days. Both mean and median diameters, Dmean, Dmedian, decrease during events by a factor of two on average. On average, during event days, an increase of downward particle fluxes (i.e., deposition) is observed. This is compatible, as already mentioned, with the formation of new particles above the measurement height. During NE days, the increase of the nanoparticle concentration favors the increase of particle downward fluxes, because the deposition velocity of nanoparticles is larger than the deposition velocity of accumulation mode particles [44]. Therefore, the changes on the size distribution induced by nucleation, an increase of the weight of nanoparticles, could actually increase the average deposition velocity of particles, favoring downward fluxes. There are no systematic studies of size-segregated particle fluxes during nucleation events; however, the measurements with a twin condensation particle counter showed nucleation events with fluxes of different signs: downward for the ultrafine fraction and upward for larger particles [20].
CO2 and H2O concentrations are essentially the same during E and NE days as are CO2 fluxes, considering the variability reported in Table 2. In fact, CO2 fluxes were very low throughout the measurement period, because the site had only sparse and deciduous vegetation, limiting the biogenic cycle during the measurement campaign. Solar radiation is essentially similar, with large values observed in both periods, but average temperature is slightly lower for E days. Generally, nucleation events are observed in periods with higher solar radiation input [7,8,12]. However, measurements in Northern Italy showed that the differences in solar radiation, temperature and relative humidity between event and non-event days were significantly reduced in summer with respect to winter and spring seasons [8].
Table 2. Comparison of different average parameters calculated between 09:00 and 16:00 separately for event days and non-event days. The uncertainties are the standard errors. E, event day; NE, non-event day.
DmeanDmedianNumber Conc.CO2 Conc.Particle FluxCO2 Flux
nmnm#/cm3g/m3#/cm2 s10−5g/m2s
E35.4 ± 0.615.5 ± 0.327,170 ± 22230.66 ± 0.001−5567 ± 2386−2.0 ± 1.8
NE62.3 ± 1.229.1 ± 1.310,692 ± 7340.65 ± 0.0011231 ± 1314−0.65 ± 1.6
Total RadiationTemperatureH2O Conc.HEU
W/m2g/m3W/m2sW/m2sm/s
E702 ± 1630.0 ± 0.312.4 ± 0.2272 ± 736 ± 33.1 ± 0.1
NE735 ± 1732.0 ± 0.212.6 ± 0.3304 ± 844 ± 32.6 ± 0.1
In the dataset studied, both solar radiation and temperature are relatively high throughout the measurement period both during E and NE days. This means that high solar radiation does not automatically lead to a nucleation event, as observed also by other authors [12]. Other parameters likely have a role in the onset of nucleation, such as the concentration of gaseous precursors (e.g., SO2 as the precursor of H2SO4-mediated nucleation) or the availability of condensable vapor. Hamed et al. [8] and Stanier et al. [4] observed larger concentrations of SO2 during E days compared with NE days. Pillai et al. [7] reported that H2SO4 and biogenic volatile organic compounds play a role in nucleation. Nevertheless, local meteorology has a major impact on the phenomena, as shown in Figure 5 for the 27 July 2010 event day.
Event days showed larger average wind velocities (about 21% higher on average) than non-event days with no significant differences in wind direction. This could be interpreted considering that nucleation events are generally on relatively large spatial scales and, hence, are favored in conditions of high wind speed in which large spatial scale advection is more relevant. This was also observed in other sites [8].
The statistics of measured turbulent parameters was analyzed considering the standard deviation of wind velocity fluctuations in the vertical direction (σw), along-wind horizontal direction (σu) and cross-wind horizontal direction (σv). The statistics of turbulent kinetic energy was also evaluated.
The comparison between E and NE days (Table 3) shows that event days are characterized on average by higher absolute values of turbulence with an increase of about 23% for TKE. This is compatible with the observations reported in [17] and could indicate larger vertical mixing in E days compared with NE days. In diurnal hours, the prevalent wind direction was from the N during event and non-event days. During the night and the first hours of the morning, the wind direction was variable and associated with weak winds, and no significant difference was observed between E and NE days.
Table 3. Comparison of different average parameters calculated between 09:00 and 16:00 separately for event days and non-event days. The uncertainties are the standard errors. TKE, turbulent kinetic energy.
TKEσuσvσw
m2/s2m/sm/sm/s
E2.35 ± 0.081.41 ± 0.031.37 ± 0.030.80 ± 0.02
NE1.91 ± 0.061.29 ± 0.031.21 ± 0.030.74 ± 0.02

4. Conclusions

This work analyzed concentrations, size distributions and particle number vertical turbulent fluxes, measured by the eddy-covariance method, to investigate the influence on physical properties of airborne particles and their dynamics characterizing events of the formation and growth of new particles (i.e., nucleation events). Measurements were carried out at an urban background site (southeastern Italy) in summer. CO2/H2O concentrations and fluxes, meteorological and micrometeorological parameters were also measured to investigate their correlation with nucleation events.
Results show that particles could be divided into two size ranges presenting inversely correlated dynamics during diurnal hours: nanoparticles (Dp < 50 nm) and larger particles (Dp > 50 nm). Nanoparticles had maximum concentrations in diurnal hours due to several days with nucleation events generally occurring between 09:00 and 16:00. In this period of the day, particles larger than 50 nm showed minimum concentrations.
The analysis of particle size distributions, fitted with a combination of three lognormal distributions, showed that during nucleation events, the nanoparticle concentration increases on average by a factor of 3.7 with no significant changes in the concentration of particles larger than 50 nm. This means that during nucleation events, the mean and median diameters of particles are significantly reduced, on average, by a factor of two. During NE days, a second mode in nanoparticle size range (between 15 nm and 20 nm) is present that is almost negligible during E days. Comparing the size distributions in E and NE days, this appears to be the size range in which there is the maximum increase in concentrations (about a factor of five on average), a direct consequence of the second nanoparticle mode during NE days.
Even if the dataset is short, a significant increase in downward particle fluxes (i.e., deposition) was observed during nucleation events compatible with the formation and growth of particles localized above the measurement height and subsequently driven towards the ground by turbulent transport. On average, no significant differences were observed in CO2 concentrations and fluxes comparing event and non-event days.
The comparison of average meteorological and micrometeorological parameters during event and non-event days showed minimal differences with lower temperature and higher wind velocity and turbulence intensity during event days. However, local meteorology has a major impact on the evolution of nucleation, as shown by the correlation of nanoparticle concentration with solar radiation and by the interruption of nucleation due to clouds and light rain during the 27 July 2010 event.

Acknowledgments

The authors thank Cosimo Elefante (University of Salento) and Fabio Massimo Grasso (ISAC-CNR) for their help in setting up the experimental field and the data acquisition software.

Author Contributions

This work was completed with the collaboration of all the authors. Daniele Contini and Antonio Donateo designed the study and planned the measurements. Marianna Conte and Adelaide Dinoi performed most of the post-processing. All authors contributed to the interpretation of data and reviewed and commented on the paper.

Conflicts of Interest

The authors declare no conflict of interest.

References

  1. Kulmala, M.; Vehkamäki, H.; Petäjä, T.; Dal Maso, M.; Lauri, A.; Kerminem, V.M.W.; Birmili, W.; Mc Murry, P.H. Formation and growth rates of ultrafine atmospheric particles: A review of observations. J. Aerosol Sci. 2004, 35, 143–176. [Google Scholar] [CrossRef]
  2. Mäkelä, J.M.; Aalto, P.; Jokinen, V.; Pohja, T.; Nissinen, A.; Palmroth, S.; Markkanen, T.; Seitsonen, K.; Lihavainen, H.; Kulmala, M. Observations of ultrafine aerosol particle formation and growth in boreal forest. Geophys. Res. Lett. 1997, 24, 1219–1222. [Google Scholar] [CrossRef]
  3. Wiedensohler, A.; Covert, D.S.; Swietlicki, E.; Aalto, P.P.; Heintzenberg, J.; Leck, C. Occurrence of an ultrafine particle mode less than 20 nm in diameter in the marine boundary layer during Arctic summer and autumn. Tellus 1996, 48, 213–222. [Google Scholar] [CrossRef]
  4. Stanier, C.O.; Khlystov, A.Y.; Pandis, S.N. Nucleation events during the Pittsburgh air quality study: Description and relation to key meteorological, gas phase, and aerosol parameters. Aerosol Sci. Technol. 2004, 38, 253–264. [Google Scholar] [CrossRef]
  5. Kulmala, M.; Petäjä, T.; Mönkkönen, P.; Koponen, I.K.; Dal Maso, M.; Aalto, P.P.; Lehtinen, K.E.J.; Kerminen, V.M. On the growth of nucleation mode particles: Source rates of condensable vapor in polluted and clean environments. Atmos. Chem. Phys. 2005, 5, 409–416. [Google Scholar] [CrossRef]
  6. Petäjä, T.; Kerminem, V.M.W.; Dal Maso, M.; Junninen, H.; Koponen, I.K.; Hussein, T.; Alto, P.P.; Andronopoulos, S.; Robin, D.; Hämeri, K.; et al. Sub-micron atmospheric aerosols in the surroundings of Marseille and Athens: Physical characterization and new particle formation. Atmos. Chem. Phys. 2007, 7, 2705–2720. [Google Scholar] [CrossRef]
  7. Pillai, P.; Khlystov, A.; Walker, J.; Aneja, V. Observation and analysis of particle nucleation at a forest site in Southeastern U.S. Atmosphere 2013, 4, 72–93. [Google Scholar] [CrossRef]
  8. Hamed, A.; Joutsensaari, J.; Mikkonen, S.; Sogacheva, L.; Dal Maso, M.; Kulmala, M.; Cavalli, F.; Fuzzi, S.; Facchini, M.C.; Decesari, S.; et al. Nucleation and growth of new particles in Po Valley, Italy. Atmos. Chem. Phys. 2007, 7, 355–376. [Google Scholar] [CrossRef]
  9. O’Dowd, C.D.; Hämeri, K.; Mäkelä, J.M.; Pirjola, L.; Kulmala, M.; Jennings, S.G.; Berresheim, H.; Hansson, H.-C.; de Leeuw, G.; Kunz, G.J.; et al. A dedicated study of New Particle Formation and Fate in the Coastal Environment (PARFORCE): Overview of objectives and achievements. J. Geophys. Res. 2002, 107. [Google Scholar] [CrossRef]
  10. De Leeuw, G.; Kunz, G.J.; Buzorius, G.; O’Dowd, C. Meteorlogical influences on coastal new particle formation. J. Geophys. Res. Atmos. 2002, 107. [Google Scholar] [CrossRef]
  11. McMurry, P.H.; Fink, M.; Sakurai, H.; Stolzenburg, M.R.; Mauldin, R.L., III; Smith, J.; Eisele, F.; Moore, K.; Sjostedt, S.; Tanner, D.; et al. A criterion for new particle formation in the sulfur-rich Atlanta atmosphere. J. Geophys. Res. Atmos. 2005, 110. [Google Scholar] [CrossRef]
  12. Boy, M.; Kulmala, M. Nucleation events in the continental boundary layer: Influence of physical and meteorological parameters. Atmos. Chem. Phys. 2002, 2, 1–16. [Google Scholar] [CrossRef]
  13. Jaatinen, A.; Hamed, A.; Joutsensaari, J.; Mikkonen, S.; Birmili, W.; Wehner, B.; Spindler, G.; Wiedensohler, A.; Decesari, S.; Mircea, M.; et al. A comparison of new particle formation events in the boundary layer at three different sites in Europe. Boreal Environ. Res. 2009, 14, 481–498. [Google Scholar]
  14. Qian, S.; Sakurai, H.; McMurry, P.H. Characteristics of regional nucleation events in urban East St. Louis. Atmos. Environ. 2007, 41, 4119–4127. [Google Scholar] [CrossRef]
  15. Clement, C.F.; Pirjola, L.; Dal Maso, M.; Mäkela, J.M.; Kulmala, M. Analysis of particle formation bursts observed in Finland. J. Aerosol Sci. 2001, 32, 217–236. [Google Scholar] [CrossRef]
  16. Hussein, T.; Martikainen, J.; Junninen, H.; Sogacheva, L.; Wagner, R.; Dal Maso, M.; Riipinen, I.; Aalto, P.P.; Kulmala, M. Observation of regional new particle formation in the urban atmosphere. Tellus 2008, 60, 509–521. [Google Scholar] [CrossRef]
  17. Nilsson, E.D.; Rannik, Ü.; Buzorius, G.; Kulmala, M.; O’Dowd, C. Effects of the continental boundary layer evolution, convection, turbulence and entrainment on aerosol formation. Tellus 2001, 53, 441–461. [Google Scholar] [CrossRef]
  18. Buzorius, G.; Rannik, Ü.; Nilsson, D.; Kulmala, M. Vertical fluxes and micrometeorology during aerosol particle formation events. Tellus 2001, 53, 394–405. [Google Scholar] [CrossRef]
  19. Flanagan, R.J.; Geever, M.; O’Dowd, C. Direct measurements of new-particle fluxes in the coastal environment. Environ. Chem. 2005, 2, 256–259. [Google Scholar] [CrossRef]
  20. Held, A.; Klemm, O. Direct measurement of turbulent particle exchange with a 558 twin CPC eddy covariance system. Atmos. Environ. 2006, 40, S92–S102. [Google Scholar] [CrossRef]
  21. Ruuskanen, T.M.; Kaasik, M.; Aalto, P.P.; Hõrrak, U.; Vana, M.; Mårtensson, M.; Yoon, Y.J.; Keronen, P.; Mordas, G.; Ceburnis, D.; et al. Concentrations and fluxes of aerosol particles during the LAPBIAT measurement campaign at Värriö field station. Atmos. Chem. Phys. 2007, 7, 3683–3700. [Google Scholar] [CrossRef]
  22. Donateo, A.; Contini, D. Correlation of dry deposition velocity and friction velocity over different surfaces for PM2.5 and particle number concentrations. Adv. Meteorol. 2014. [Google Scholar] [CrossRef]
  23. Contini, D.; Donateo, A.; Elefante, C.; Grasso, F.M. Analysis of particles and carbon dioxide concentrations and fluxes in an urban area: Correlation with traffic rate and local micrometeorology. Atmos. Environ. 2012, 46, 25–35. [Google Scholar] [CrossRef]
  24. Hinds, W.C. Aerosol Technology: Properties, Behaviour, and Measurement of Airborne Particles, 2nd ed.; John Wiley & Sons: Los Angeles, CA, USA, 1999; pp. 8–10. [Google Scholar]
  25. Heim, M.; Kasper, G.; Reischl, G.P.; Gerhart, C. Performance of a new commercial electrical mobility spectrometer. Aerosol Sci. Technol. 2004, 32, 3–14. [Google Scholar] [CrossRef]
  26. McMillen, R.T. An eddy-correlation technique with extended applicability to non-simple terrain. Bound. Layer Meteorol. 1988, 43, 231–245. [Google Scholar] [CrossRef]
  27. Kaimal, J.C.; Finnigan, J.J. Atmospheric Boundary Layer Flows: Their Structure and Measurement; Oxford University Press: New York, NY, USA, 1994; pp. 33–39. [Google Scholar]
  28. Buzorius, G.; Rannik, U.; Makela, J.M.; Vesala, T.; Kulmala, M. Vertical aerosol particle fluxes measured by eddy covariance technique using condensational particle counter. J. Aerosol Sci. 1998, 29, 157–171. [Google Scholar] [CrossRef]
  29. Rannik, U.; Vesala, T. Autoregressive filtering versus linear detrending in estimation of fluxes by the eddy covariance method. Bound. Layer Meteorol. 1999, 91, 259–280. [Google Scholar] [CrossRef]
  30. Businger, J.A. Evaluation of the accuracy with which dry deposition can be measured with current micrometeorological techniques. J. Clim. Appl. Meteorol. 1986, 25, 1100–1124. [Google Scholar] [CrossRef]
  31. Mahrt, L. Flux sampling errors for aircraft and towers. J. Atmos. Ocean. Technol. 1998, 15, 416–429. [Google Scholar] [CrossRef]
  32. Cava, D.; Contini, D.; Donateo, A.; Martano, P. Analysis of short-term closure of the surface energy balance above short vegetation. Agric. For. Meteorol. 2008, 148, 82–93. [Google Scholar] [CrossRef]
  33. Cava, D.; Donateo, A.; Contini, D. Combined stationarity index for the estimation of turbulent fluxes of scalars and particles in the atmospheric surface layer. Agric. For. Meteorol. 2014, 194, 88–103. [Google Scholar] [CrossRef]
  34. Webb, E.K.; Pearman, G.I.; Leuning, R. Correction of flux measurements for density effects due to heat and water vapour transfer. Q. J. R. Meteorol. Soc. 1980, 106, 85–100. [Google Scholar] [CrossRef]
  35. Buzorius, G.; Rannik, U.; Makela, J.M.; Keronen, P.; Vesala, T.; Kulmala, M. Vertical aerosol fluxes measured by the eddy covariance method and deposition of nucleation mode particles above a Scots pine forest in southern Finland. J. Geophys. Res. Atmos. 2000, 105, 19905–19916. [Google Scholar] [CrossRef]
  36. Horst, T.W. A simple formula for attenuation of eddy fluxes measured with first-order response scalar sensors. Bound. Layer Meteorol. 1997, 82, 219–233. [Google Scholar] [CrossRef]
  37. Contini, D.; Donateo, A.; Belosi, F.; Grasso, F.M.; Santachiara, G.; Prodi, F. Deposition velocity of ultrafine particles measured with eddy-correlation method over Nanseen Ice Sheet (Antarctica). J. Geophys. Res. Atmos. 2010, 115, D16202. [Google Scholar] [CrossRef]
  38. Fairall, C.W. Interpretation of eddy correlation measurements of particulate deposition and aerosol flux. Atmos. Environ. 1984, 18, 1329–1337. [Google Scholar] [CrossRef]
  39. Hameri, K.; kumala, M.; Aalto, P.; Leszczynski, K.; Visuri, R.; Hamekoski, K. The investigations of aerosol particle formation in urban background area of Helsinki. Atmos. Res. 1996, 41, 281–298. [Google Scholar] [CrossRef]
  40. Weber, R.J.; McMurry, P.H.; Mauldin, R.L.; Tanner, D.J.; Eisele, F. L.; Clarke, A.D.; Kapustin, V. New particle formation in the remote troposphere: A comparison of observations at various sites. Geophys. Res. Lett. 1999, 26, 307–310. [Google Scholar] [CrossRef]
  41. Putaud, J.P.; van Dingenen, R.; Alastuey, A.; Bauer, H.; Birmili, W.; Cyrys, J.; Flentje, H.; Fuzzi, S.; Gehrig, R.; Hansson, H.C.; et al. A European aerosol phenomenology—3: Physical and chemical characteristics of particulate matter from 60 rural, urban and kerbside sites across Europe. Atmos. Environ. 2010, 44, 1308–1320. [Google Scholar] [CrossRef]
  42. Deshmukh, D.K.; Deb, M.K.; Mkoma, S.L. Size distribution and seasonal variation of size-segregated particulate matter in the ambient air of Raipur city, India. Air Qual. Atmos. Health 2013, 6, 259–276. [Google Scholar] [CrossRef]
  43. Morawska, L.; Bofinger, N.D.; Kocis, L.; Nwankwoala, A. Submicrometer and supermicrometer particles from diesel vehicle emissions. Environ. Sci. Technol. 1998, 32, 2033–2042. [Google Scholar] [CrossRef]
  44. Petroff, A.; Zhang, L. Development and validation of a size-resolved particle dry deposition scheme for application in aerosol transport models. Geosci. Model Dev. 2010, 3, 753–769. [Google Scholar] [CrossRef]

