Surface Water Quality Analysis Using CORINE Data: An Application to Assess Reservoirs in Poland


1
Faculty of Natural Sciences, University of Silesia in Katowice, 41-200 Sosnowiec, Poland
2
Institute of Geography, Kazimierz Wielki University, 85-033 Bydgoszcz, Poland
3
Department of Earth and Environmental Sciences, Pavia University, 27100 Pavia, Italy
*
Author to whom correspondence should be addressed.
Remote Sens. 2020, 12(6), 979; https://doi.org/10.3390/rs12060979
Submission received: 19 February 2020
/
Revised: 12 March 2020
/
Accepted: 16 March 2020
/
Published: 18 March 2020
(This article belongs to the Special Issue CORINE Land Cover System: Limits and Challenges for Territorial Studies and Planning)
Abstract
:Reservoirs are formed through the artificial damming of a river valley. Reservoirs, among others, capture polluted load transported by the tributaries in the form of suspended and dissolved sediments and substances. Therefore, reservoirs are treated in the European Union (EU) as “artificial” or “heavily modified” surface water bodies. The reservoirs’ pollutant load depends to a large extent on the degree of anthropogenic impact in the respective river catchment area. The purpose of this paper is to assess the mutual relation between the catchment area and the reservoirs. In particular, we focus on the effects of certain land use/land cover on reservoirs’ water quality. For this study, we selected twenty Polish reservoirs for an in-depth analysis using 2018 CORINE Land Cover data. This analysis allowed the identification of the main triggering factors in terms of water quality of the respective reservoirs. Moreover, our assessment clearly shows that water quality of the analysed dam reservoirs is directly affected by the composition of land use/land cover, both of the entire total reservoir catchment areas and the directly into the reservoir draining sub-catchment areas.
1. Introduction
The reservoirs are formed when a river valley is artificially blocked by a dam [1]. So far in Poland, 101 reservoirs have been built with a storage capacity of over 106 m3 [2,3]. Their total capacity constitutes only about 5–6% of the total annual discharge to the Baltic Sea [4]. According to the Water Framework Directive (WFD, Directive 2000/60/EC), dam reservoirs are treated as heavily modified water bodies, and thus, until 2021 they are required to reach at least a good ecological status.
Even though reservoirs are considered to be heavily modified river sections, they are not behaving very similarly to rivers. Rivers are regarded as open ecosystems, that are in a certain state of dynamic equilibrium [5,6]. According to the river continuum concept (RCC) introduced by Vannote et al. [7], a disturbance of this equilibrium undoubtedly influences the general hydrological conditions of river systems and hence, change the physical, chemical, and biological processes determining the quality of the water in the reservoir and thus, also in the river sections downstream of the dam [8,9,10,11].
However, dam reservoirs, despite being man-made structures, have developed rich ecosystems with a high diversity of living organisms [12,13,14,15]. Additionally, the functioning of reservoirs significantly modifies flows of energy and matter into the World Oceans due to a significantly reduced transport of all kinds of load in the river sections downstream of the dam. Less transport downstream of the dam is directly connected with reservoir accumulation [4,16,17,18,19,20]. Most of the bed load remains in the reservoir whereas suspended load and wash load is only partly retained. The effectiveness of dam reservoirs in trapping sediments is in some cases significant, amounting to 70–90% of the reservoir’s storage capacity [21]. It is assumed that worldwide, about 30–40% of matter transported as suspended load does not reach seas, oceans, or some big lakes. Instead the sediments are trapped in man-made dam reservoirs, at least for the period of existence of these infrastructures [22].
In terms of the sediments washed into and transported by the river systems, land use plays a key role. Problems with water quality are generally associated with improper land use in the catchment area and human industrial and agricultural activities as well as with the urbanization of the area [23]. Land use is one of the variables related to human activity that is heavily affecting water quality. Other important factors include (i) the morphometry of the reservoirs, (ii) precipitation characteristics, (iii) climate change effects, (iv) aquatic connection [24], and (v) in the case of dam reservoirs, the rate of water exchange in the reservoir. The quality of river, reservoir, or lake water has deteriorated in many countries over the last decades, mainly due to changes in land use in the catchment areas [25,26,27]. Agricultural, forest, urban, and industrial areas significantly affect surface water quality [23,25,28,29,30,31].
Advanced and continuously improved GIS (Geographic Information System) techniques in combination with CORINE Land Cover (CLC) data and water quality information allow a quick and very reliable assessment of reservoir water resources.
The main purpose of the present study is thus to verify whether CLC data are useful in objectively identifying and assessing the impact on water quality in reservoirs.
2. Materials and Methods
Twenty dam reservoirs located in different regions of Poland and performing different functions at the same time (e.g., flood protection, power engineering, water supply, tourism, and recreation, aiding water transport and fish harvesting) were selected for this study (Figure 1). In addition, the completeness and comparability of water quality data for the dam reservoirs was an important selection criterion. 13 reservoirs are located in the Vistula river basin and 7 in the Oder river basin. The reservoirs fall into the following sub-provinces: Western Carpathians with Subcarpathians (reservoirs: Goczałkowice, Tresna, Porąbka, Dobczyce, Czorsztyn, Rożnów, Klimkówka, Besko, Solina), Polish Highlands (reservoirs: Rybnik and Kozłowa Góra), Czech Massif (reservoirs: Pilchowice, Bukówka, Mietków, Nysa), and Central European Lowland (reservoirs: Turawa, Sulejów, Jeziorsko, Zegrze, Włocławek). The main selection criterion for the reservoirs was the availability of water quality information. Thus, in our research, we included only 20 reservoirs coming along with homogeneous monitoring time series and monitoring locations.
Land cover data for Poland was obtained from the CORINE Land Cover (CLC) 2018 database. The CLC 2018 project was implemented as part of the European Earth monitoring program—Copernicus Land Monitoring. These data are the result of the interpretation of images taken by the Sentinel-2 and Landsat-8 satellites from 2017, applying a uniform methodology for all of Europe. 44 types of land use were identified in Europe, of which, 31 exist in Poland. Land cover analyses were carried out in a GIS environment for both the entire river catchments draining into the reservoir (total area) and for the specific catchment area, which is the area around the reservoir directly draining into the reservoir lake (specific or sub-catchment area). Calculations of the land cover area of individual land use classes (CLC classes for levels 1, 2, and 3) were conducted based on the related CORINE database. The obtained data were then subjected to mathematical and statistical analyses.
Spearman’s statistics were applied to assess the relationship between individual CLC types and the water quality in the study reservoirs. We chose Spearman’s statistic because analysis of the distribution (e.g., Shapiro–Wilk test) showed that the variables have a non-normal distribution (p < 0.05) (probably due to the small number of sets). The relationship between water quality and selected total catchment and sub-catchment parameters was performed using a non-parametric Spearman correlation. We statistically assessed the land use in each catchment area (total and sub catchment) as well as the amount of average total nitrogen (TN), average total phosphorus (TP), and the variability of R (max−min) for TN and TP.
In turn, we utilized an open source GIS software to build matrixes of relationships between individual types of land use for specific ranges of TN and TP content. For this purpose, thematic maps were compiled based on CLC data. Natural breaks were used, which create intervals according to an algorithm that uses the average of each interval to more evenly distribute the data in intervals. Individual values are assigned to individual ranges in such a way that the average for each range differs as little as possible from each value in a given range. Thanks to this, all ranges are well represented by their averages, and the data values in each range differ as little as possible [32].
In this way, CLC data in the total catchments and in the sub-catchments were analysed to determine the impact of each CLC on water quality of the reservoirs.
The water quality characteristics of the reservoirs were determined based on data from the State Environmental Monitoring (SEM) program. The selected reservoirs are subject to diagnostic and operational monitoring. The monitoring is carried out in four-year cycles. The current one was implemented as part of the third cycle of water management lasting from 2016 to 2021. The purpose of monitoring by the State Inspectorate for Environmental Protection is to provide knowledge about the status of the reservoir water resources in order to take action where necessary to improve the water status and to protect water resources against pollution. The test results obtained, based on the monitoring, allow for a classification of different water quality characteristics in terms of the ecological as well as the chemical status.
In agricultural areas, excessive fertilization is often the main contributor to the load of nitrates and phosphorous in water bodies, whereas phosphorous causes eutrophication of the freshwater ecosystems due to its eutrophying effect [33]. Waters drained from agricultural land have a 2–4.5 times higher content of total nitrogen (N) compared with waters of seminatural areas [34]. Eutrophication is regarded as one of the most serious threats to surface water quality. The effect of eutrophication processes is limiting the potential use of water for drinking water supply, economic activity, and recreation [35]. Nitrogen is considered as a biogen causing sea and ocean blooms, and phosphorus—inland water blooms [36]. The N:P ratio determines which element limits the development of phytoplankton. If N:P <10 then the development of algae and cyanobacteria is limited by nitrogen, when it is 10–20, there is a total limitation by both elements, if N:P > 20, the limiting element is phosphorus [36,37]. According to Ilnicki [38], the optimal N:P ratio for algae development is 7.
3. Hydrological Characteristics of the Study Reservoirs
The study reservoirs cover different scales in terms of catchment area. The Włocławek reservoir has the largest catchment area (Table 1), covering 171,468.65 km2, of which, 145,900.00 km2 are located in Poland (Figure 1). All reservoir catchment areas in the Vistula basin are sited in the Włocławek reservoir catchment area. The Kozłowa Góra reservoir has the smallest catchment area in the Vistula river basin, with 193.95 km2. In the Oder basin, on the other hand, the largest catchment area is that of the Jeziorsko reservoir, with 9006.95 km2 (Table 1). Among the analysed reservoirs in the Oder river basin, the Bukówka reservoir has the smallest catchment area, of only 57.54 km2. Table 1 gives an overview on the catchment areas of the study reservoirs.
In terms of the specific reservoir surface area, the largest reservoir is the Włocławek reservoir, with an area of 75 km2 at the full supply level, and a capacity of 370,000,000m3. The smallest of the analysed reservoirs are the Besko reservoir with an area of 1.31 km2 and a capacity of 14,180,000 m3 as well as the Bukówka reservoir with an area of 1.99 km2 and a capacity of 16,790,000 m3.
The 20 analysed reservoirs have various functions. In general, the function of a reservoir is related, among others, to hydrographic conditions as well as water and energy demands. The reservoirs of this study usually have a flood control function, except for the Zegrze and Włocławek reservoirs. The Jeziorsko reservoir has the largest flood reserve, of about 81,300,000 m3. The Solina reservoir has a slightly smaller flood reserve of ca. 80,000,000 m3. The main function of the Rożnów, Turawa, Włocławek, and Zegrze reservoirs is hydro energy production. The Rybnik reservoir serves for cooling purposes of the power generators of the Rybnik coal power plant. Dam reservoirs are also an important source for water supply of the population. This is the main function of the following reservoirs: Dobczyce, Goczałkowice, Klimkówka, Porąbka, and Tresna. Dam reservoirs can also perform the function of inland water transport. This is the case for Mietków, Nysa, Porąbka, Tresna, and Włocławek reservoirs. Dam reservoirs also play an important role in satisfying touristic and recreational needs, enriching landscape values. Most of the analysed reservoirs have a recreational function. Other functions of reservoirs include collecting water for various purposes, which are: fish farming and maintenance of biological flows or irrigation.
Elements that differentiate dam reservoirs from lakes depend, among others, on the rate of water exchange. The faster the water flows through the reservoir, the less it differs from the supplying river in terms of composition. The slower the flow, the greater the variation. A longer retention time promotes the sedimentation of organic and mineral suspended load. On the basis of the rate of water exchange, the reservoirs can be divided into: (i) reolimnic reservoirs with a water retention period shorter than 20 days, (ii) transitory reservoirs with a retention period of 20 to 40 days, and (iii) limnic reservoirs with the retention period of over 40 days—the latter reservoirs are more similar to lakes. This classification was developed for a systematic monitoring and assessment of the ecological potential of dam reservoirs in Poland [39].
The Włocławek reservoir shows the shortest retention time of only 4.5 days followed by the Zegrze reservoir with 8.2 days. These reservoirs are classified as reolimnic. The longest exchange period is registered for Kozłowa Góra reservoir, where the exchange time is up to 307 days. Limnic reservoirs include the following dam reservoirs: Solina, Czorsztyn, Jeziorsko, Goczałkowice, Dobczyce, Nysa, Turawa, Tresna, Mietków, Klimkówka, Rybnik, Kozłowa Góra, Bukówka, and Besko. The average water retention time in the analysed limnic reservoirs is 138.13 days. Transitional reservoirs in the presented list are: Rożnów, Sulejów, Pilchowice, and Porąbka, with an average retention time of 32 days. Table 2 illustrates the main reservoir functions, morphometric parameters, and retention times.
Water pollution is mainly triggered by point and non-point sources. The load of pollutants in reservoirs depends mainly on the degree of human pressure in the supplying catchment. Today, rivers in Poland are still heavily loaded with sewage and agricultural pollution [40]. In the case of wastewater, toxic substances such as heavy metals, polycyclic aromatic hydrocarbons (PAHs), and oil or oil derivatives may be discharged into the water. Surface runoff from agricultural areas introduces substances derived from fertilisation (organic and mineral) and from plant protection products (herbicides and pesticides). Both point and non-point pollution sources introduce mainly biogenic substances (phosphorus and nitrogen). The process of eutrophication caused by human activity is called cultural eutrophication [41].
4. Results
4.1. Land Use
Urban areas reduce interception, surface retention, infiltration, and transpiration, and at the same time cause an increase in surface runoff and accelerated drainage through the road and rainwater drainage system [42]. In rural areas with water supply systems but no sewage systems, sewage is discharged to wastewater holding tanks or septic tanks. If these tanks are leaking, they provoke the pollution of surface and ground water.
The Rybnik reservoir catchment has the largest share of artificial surfaces among the total reservoir catchments analysed (Figure 2, Table 3). In the sub-catchment of the Rybnik reservoir, this share is 36.1% (Figure 3), including the portion of urban fabric (1.1) of 20.8% and industrial areas (1.2) of 12.1%. This is due to the specific function of this reservoir serving for cooling purposes of the close by Rybnik power plant. The Tresna sub-catchment reservoir catchment basin has the second largest share of artificial surfaces (Table 3). The lowest portion of artificial surfaces is found in the total catchments of the following reservoirs: Besko, Klimkówka, and Solina. In their sub-catchments, the share of artificial surfaces increases (Table 3).
The analysed reservoirs very often also perform a recreational function. Generally, the areas covered by the CORINE class “1.4.2 Urban sport and leisure facilities” are located in the immediate vicinity of the reservoirs. The following reservoirs have the highest shares of these areas in the following sub-catchments: Rybnik (3.2%), Solina (2.9%), Turawa (2.7%), Zegrze (2.2%), and Porąbka (1.8%). These areas also exert a significant impact on the quality of reservoir waters. For example, the functioning of centres providing services related to recreation and catering outlets, causes an increase in vehicle traffic and thus, the possibility of pollutions related to, for example, petroleum substances (Table 3).
Agricultural activities may cause pollution of ground and surface waters with nitrogen and phosphorus compounds. This is due to the use of excessive fertilization [43]. High concentrations of nitrogen compounds pose a threat to human and animal health, and in the case of surface waters (lakes, seas, and rivers), they may cause eutrophication, leading to a disturbed biological balance in the aquatic environment [34,44]. Intensive agricultural measures cause, among others, surface erosion in exposed areas, including facilitated washing and transportation of eroded material. The share of arable land in total catchments is high. The inflow of waters enriched with biogens due to surface runoff from agricultural areas increase the sediments in the reservoir, inducing phytoplankton blooms.
The highest portion of agricultural areas in the total catchment area was identified in the catchment basins of Zegrze, Mietków (Figure 4), Jeziorsko, Włocławek, Sulejów, and Nysa (Table 3). The lowest portion of agricultural land was found in the total catchment area of the Solina reservoir (Table 3). In the sub-catchments of the study reservoirs, the highest amount of agricultural land occurs in the reservoirs of Besko and Bukówka, up to more than 60%, whereas the lowest area was found in the sub-catchments of the following reservoirs: Solina, Porąbka, Rybnik, and Turawa (Figure 4, Table 3).
Concerning the input of sediments and pollutants from agricultural land, the type of crops grown and the related cropping techniques also play a crucial role for the reservoir water quality. The type of agricultural land can be identified using the CLC CORINE database. In both total catchments, pasture (2.3.1) has a larger extent than arable land (2.1), permanent crops (2.2.), and heterogeneous agricultural areas (2.4). The situation is different in the reservoir sub-catchments. In most of these catchments, arable land predominates (2.1), except for the sub-catchments of Klimkówka and Porąbka reservoirs, where this land use type was not found. Pastures (2.3) and heterogeneous agricultural areas (2.4) dominate in the catchments of the latter two reservoirs.
Forest and seminatural areas cover the largest percentage of the surface area in the total catchments of the following reservoirs: Solina, Besko Klimkówka, Tresna, and Turawa (Table 3), even more than 60%. In sub-catchments, the largest share of forests was identified for Solina and Klimkówka reservoirs (Figure 4). The smallest share of this land use type was found in the sub-catchments of Jeziorsko, Mietków, and Nysa reservoirs (Figure 4). Generally, forests (3.1) dominate over the seminatural areas in all the analysed catchments (Table 3).
Finally, wetlands (4) represent a very small percentage of the area. The Zegrze reservoir has the largest percentage of inland wetlands with 1.1% of the total catchment area. However, in the other catchments, wetlands do not exceed 0.6%. There were no wetlands in the catchment areas of the 11 reservoirs. In sub-catchments, inland wetlands (4.1) occur only in the following reservoirs: Sulejów, Jeziorsko, Goczałkowice (Figure 2 and Figure 3), and Nysa. They are located mostly on the inflow to the reservoirs (Figure 4, Table 3).
The water stored in the wetlands is naturally purified—some of the nutrients contained in the water are accumulated in peats. Wetlands and deposits of biogenic sediments are natural reservoirs of organic carbon, which is thus not entering the atmosphere. Therefore, they have a mitigating effect on the “greenhouse effect” and on climate change in general. However, again, damaged wetlands stop storing carbon and become sources of greenhouse gas emissions.
The portion of inland waters (5.1) in total catchments ranges from 0.6% (the Pilchowice and Besko reservoirs) to 7.5% (the Goczałkowice reservoir). In sub-catchments, the share of these areas increases significantly. The Jeziorsko catchment has the largest share of inland waters (5.1), almost half. The lowest share of these areas in the total area of the sub-catchment is found in the basins of the Besko and Zegrze reservoirs (Figure 4, Table 3).
4.2. Water Quality in Main Dam Reservoirs
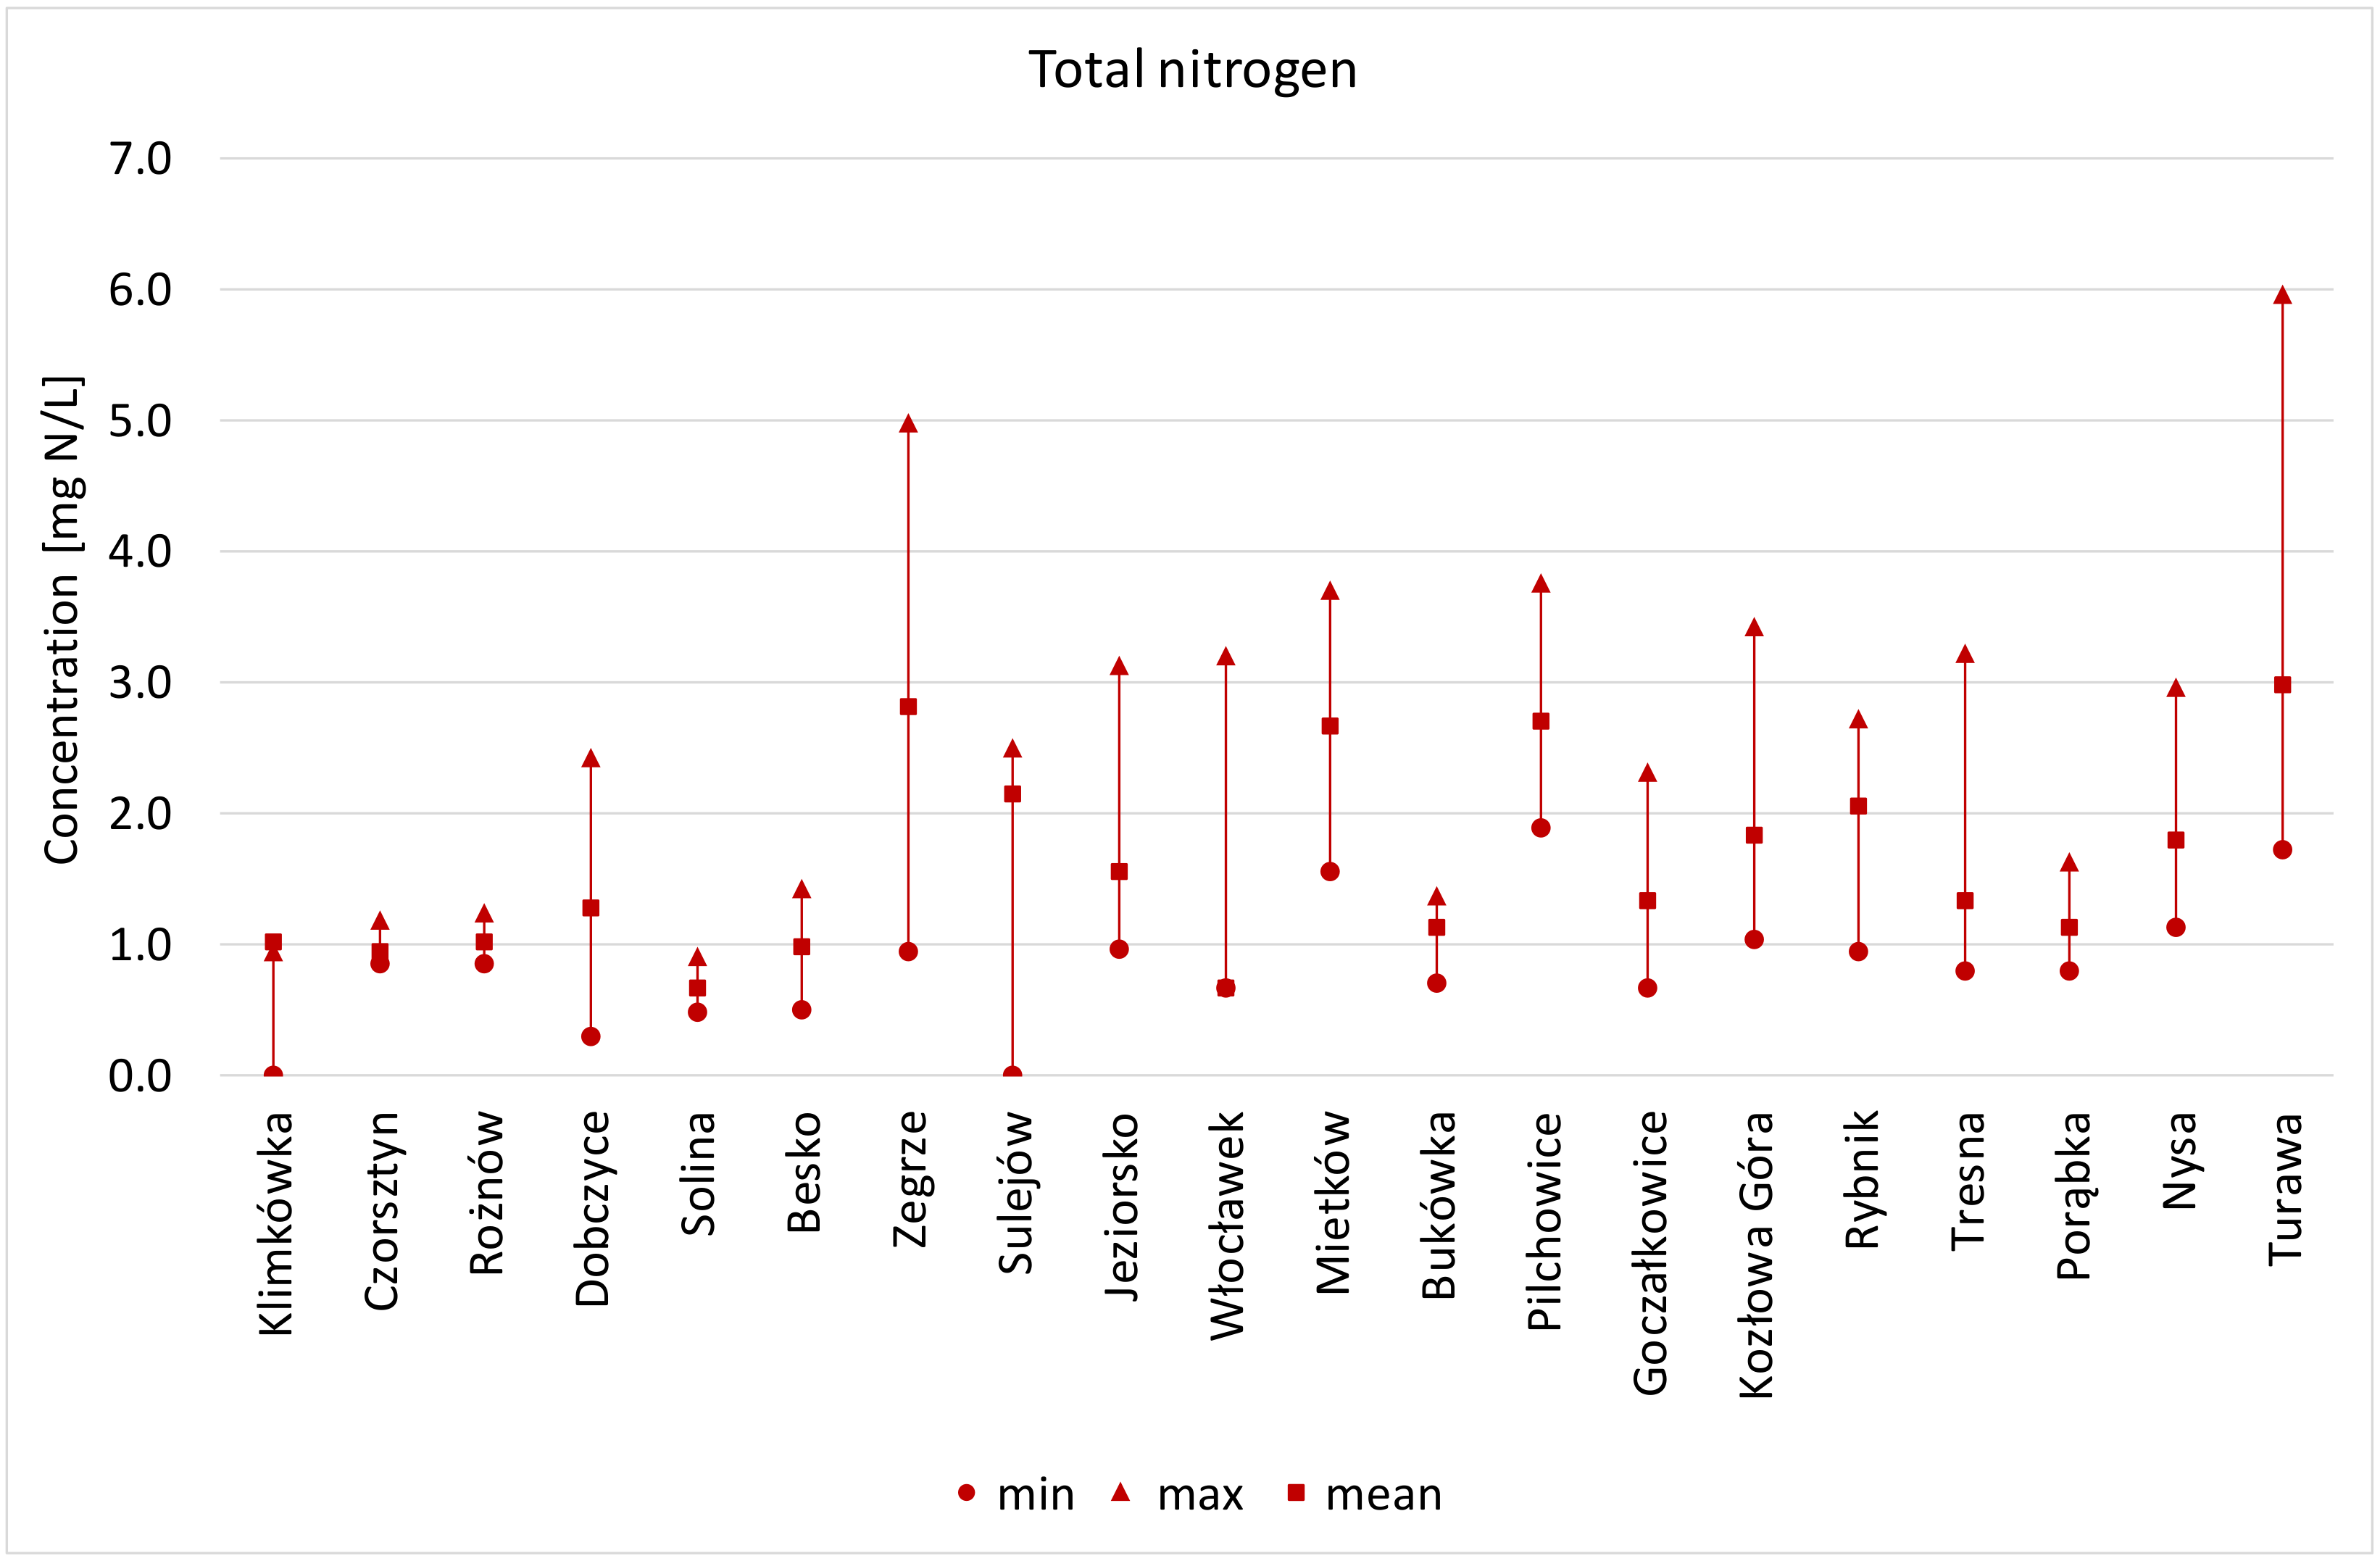
The threshold value for TN for water quality class I in dam reservoirs is ≤5.0 mg N/L. Average concentrations of TN in the analysed reservoirs thus may be classified as class I water quality. The lowest values are found in reservoirs located in the Carpathians and in waters of the Włocławek reservoir. The lowest average values are 0.67 mg N/L for Włocławek and 0.68 mg N/L for Solina. The highest average value of TN is recorded for the Turawa reservoir—2.98 mg N/L. This reservoir also had the highest maximum TN value—6.04 mg N/L, and the greatest variability of this parameter was also recorded for this reservoir (Figure 5).
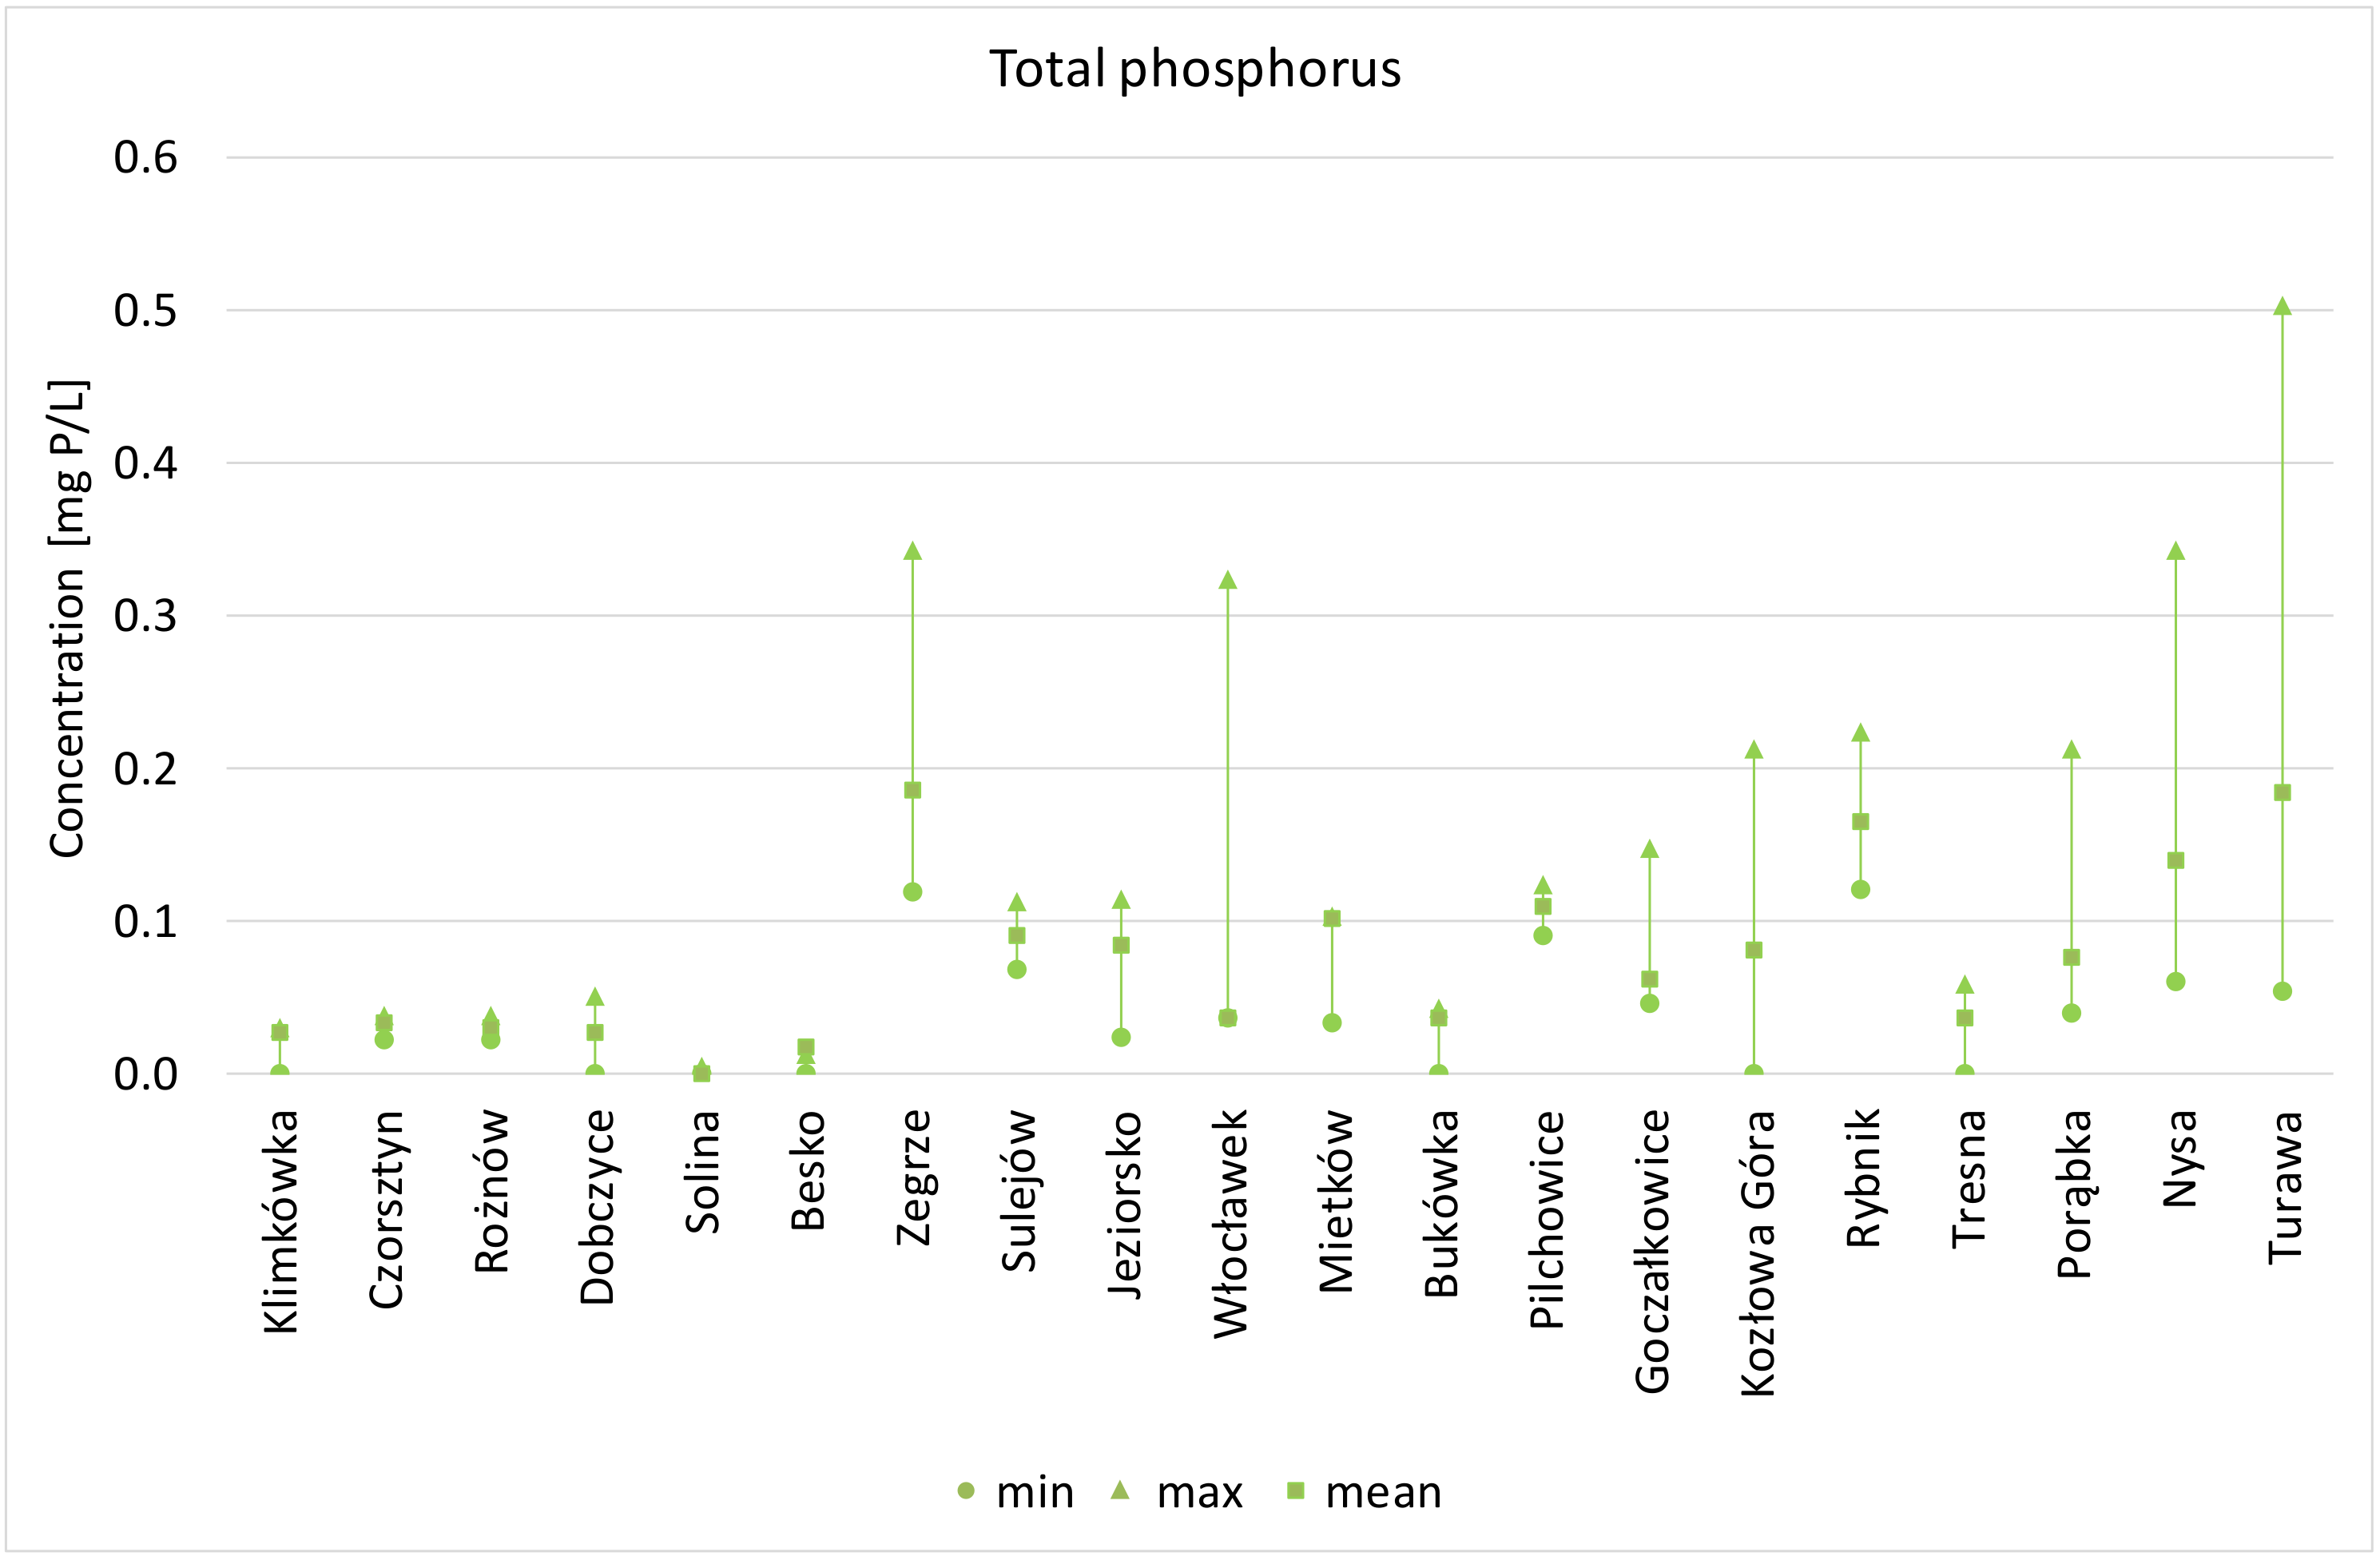
The threshold value for TP for water quality class I is ≤0.20 mg/L. The water of all analysed reservoirs does not exceed this value. Average concentrations of TP reflect distinctive differences. In Carpathian reservoirs, average concentrations are more than six times lower than in reservoirs with the highest concentrations, such as Dębe, Rybnik, and Turawa, with values above 0.180 mg P/L. The maximum value of TP of 0.51 mg P/L was recorded for the Turawa reservoir. The largest variability of TP is also observed in this reservoir (Figure 6).
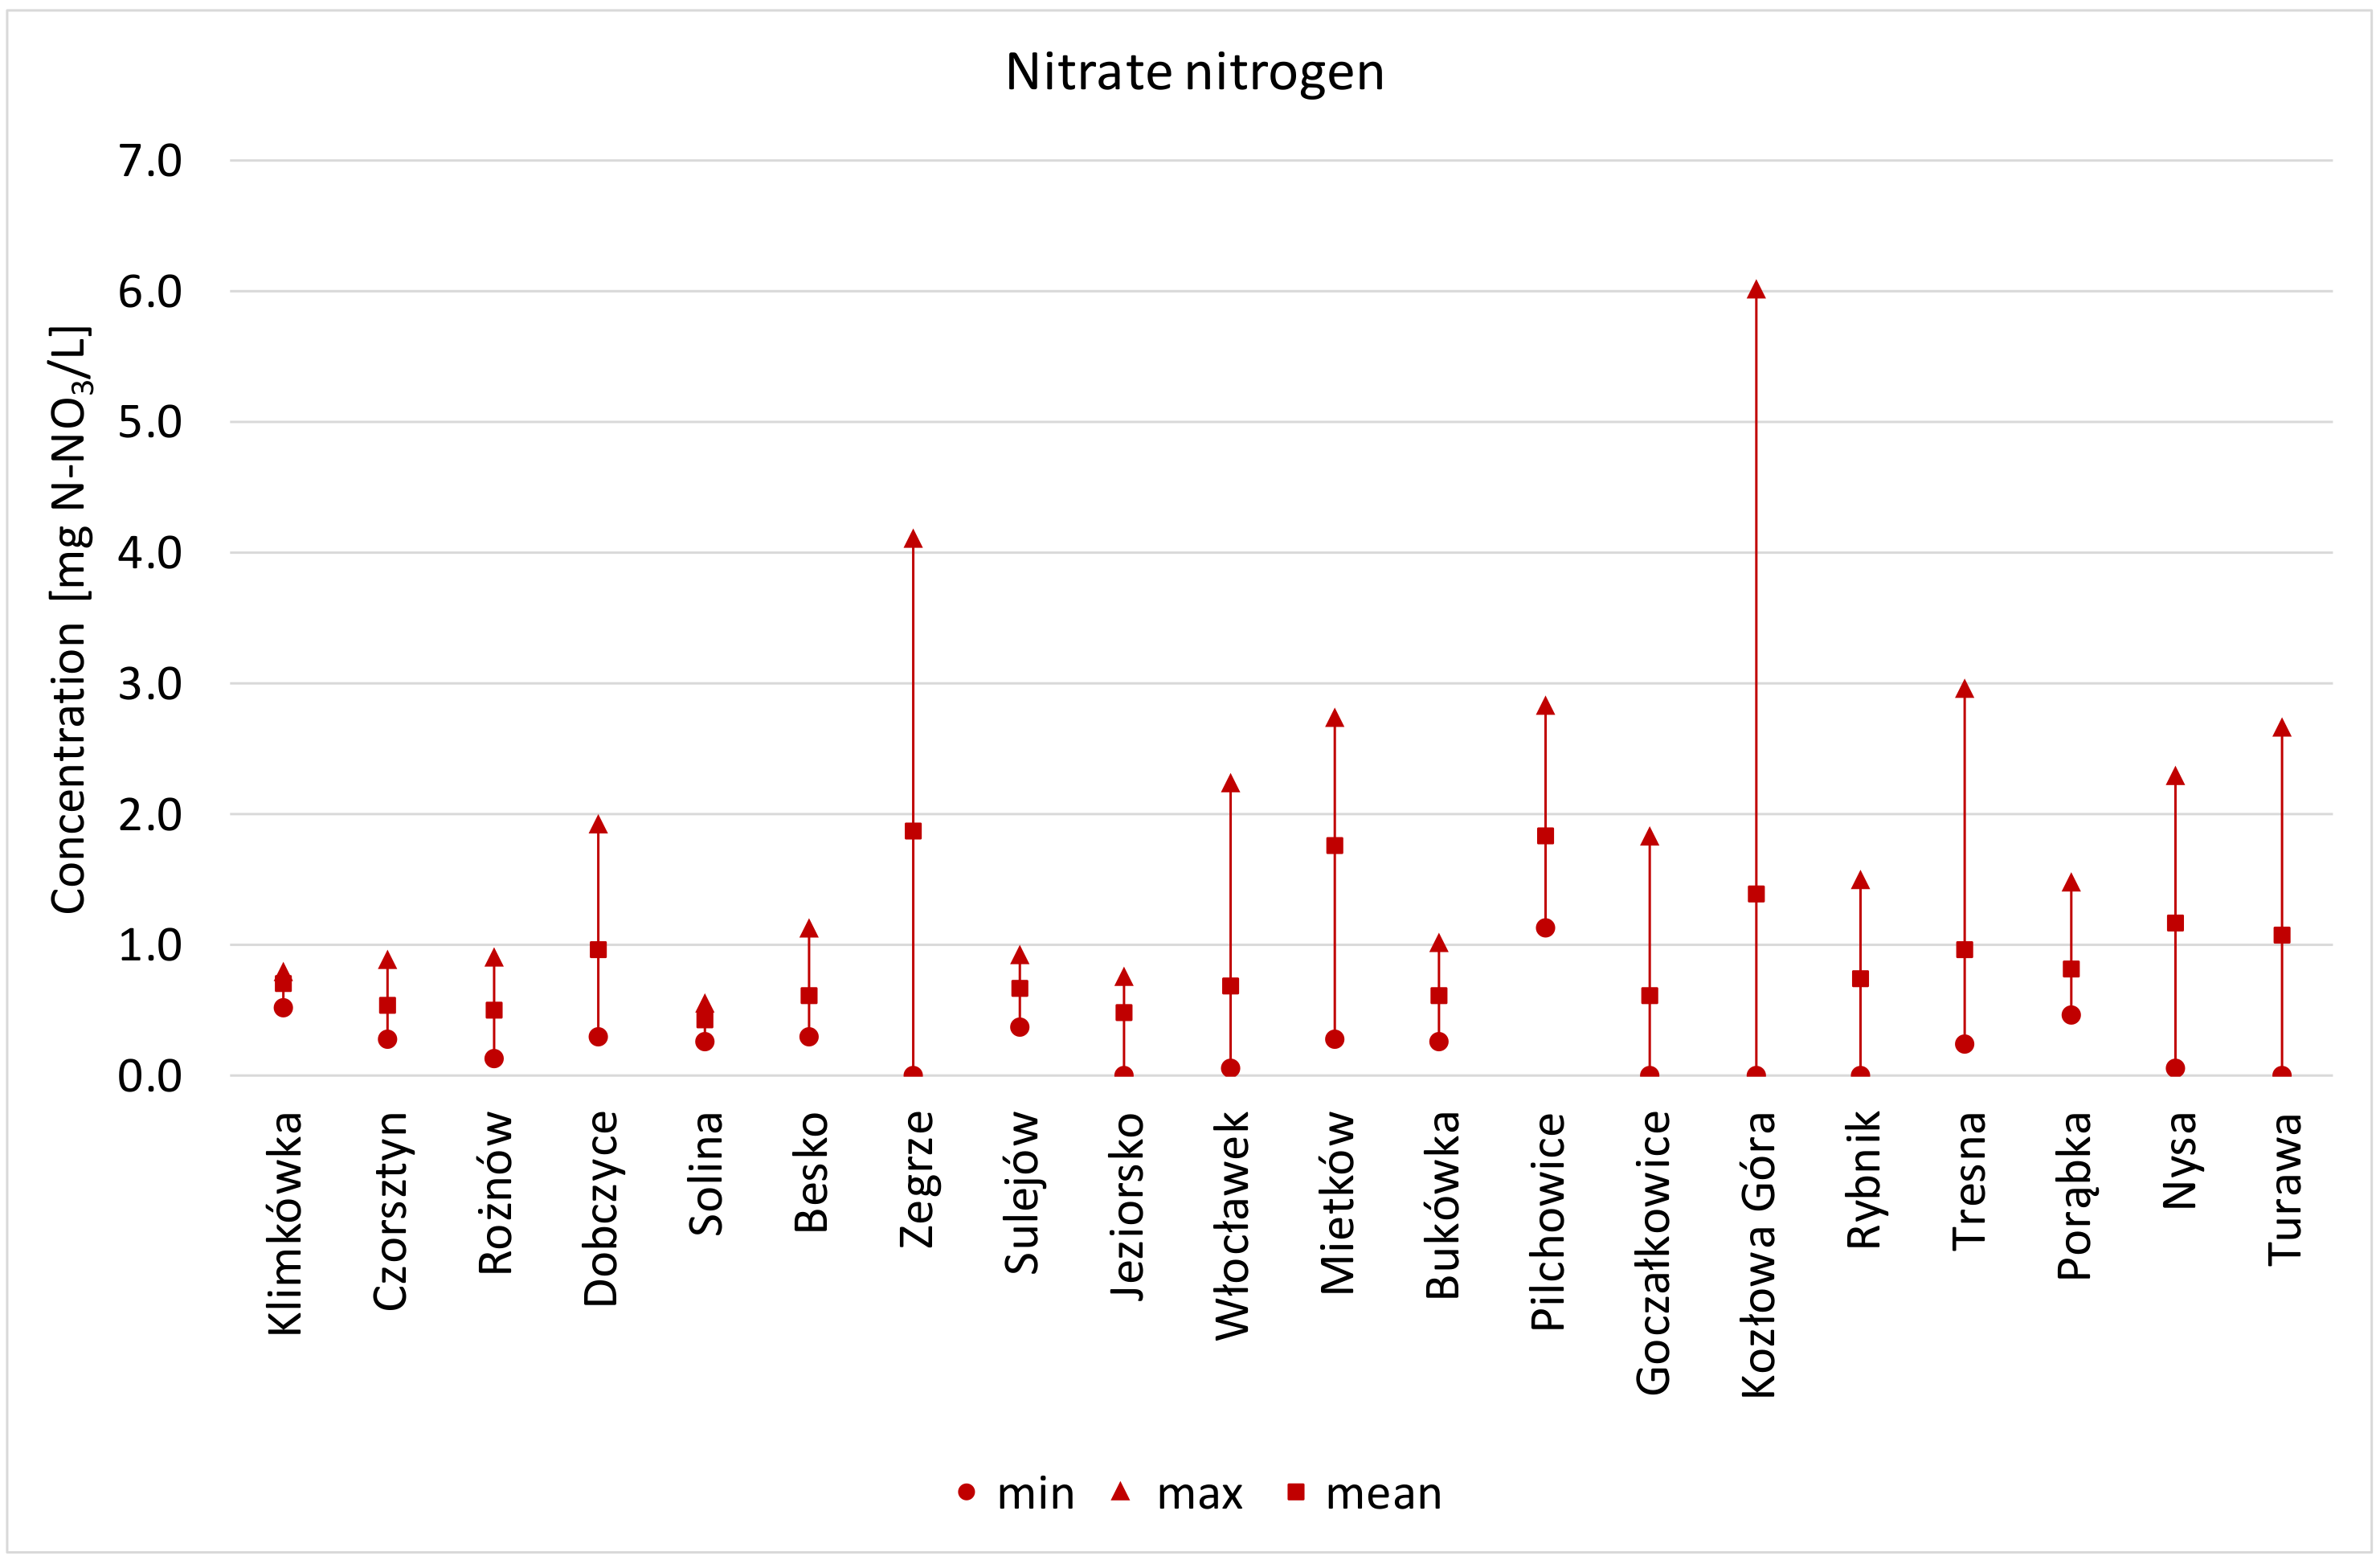
In most of the analysed reservoirs, average concentration of nitrate nitrogen did not exceed 1.0 mg N–NO3/L. Only in Dębe, Mietków, Pilchowice, Kozłowa Góra, Nysa, and Turawa reservoirs did the average concentrations of nitrate nitrogen exceed 1.0 mg N–NO3/L. The maximum value of nitrate nitrogen was recorded for the Porąbka reservoir, with 7.10 N–NO3/L. The greatest variability of nitrate nitrogen was also found in this reservoir (Figure 7).
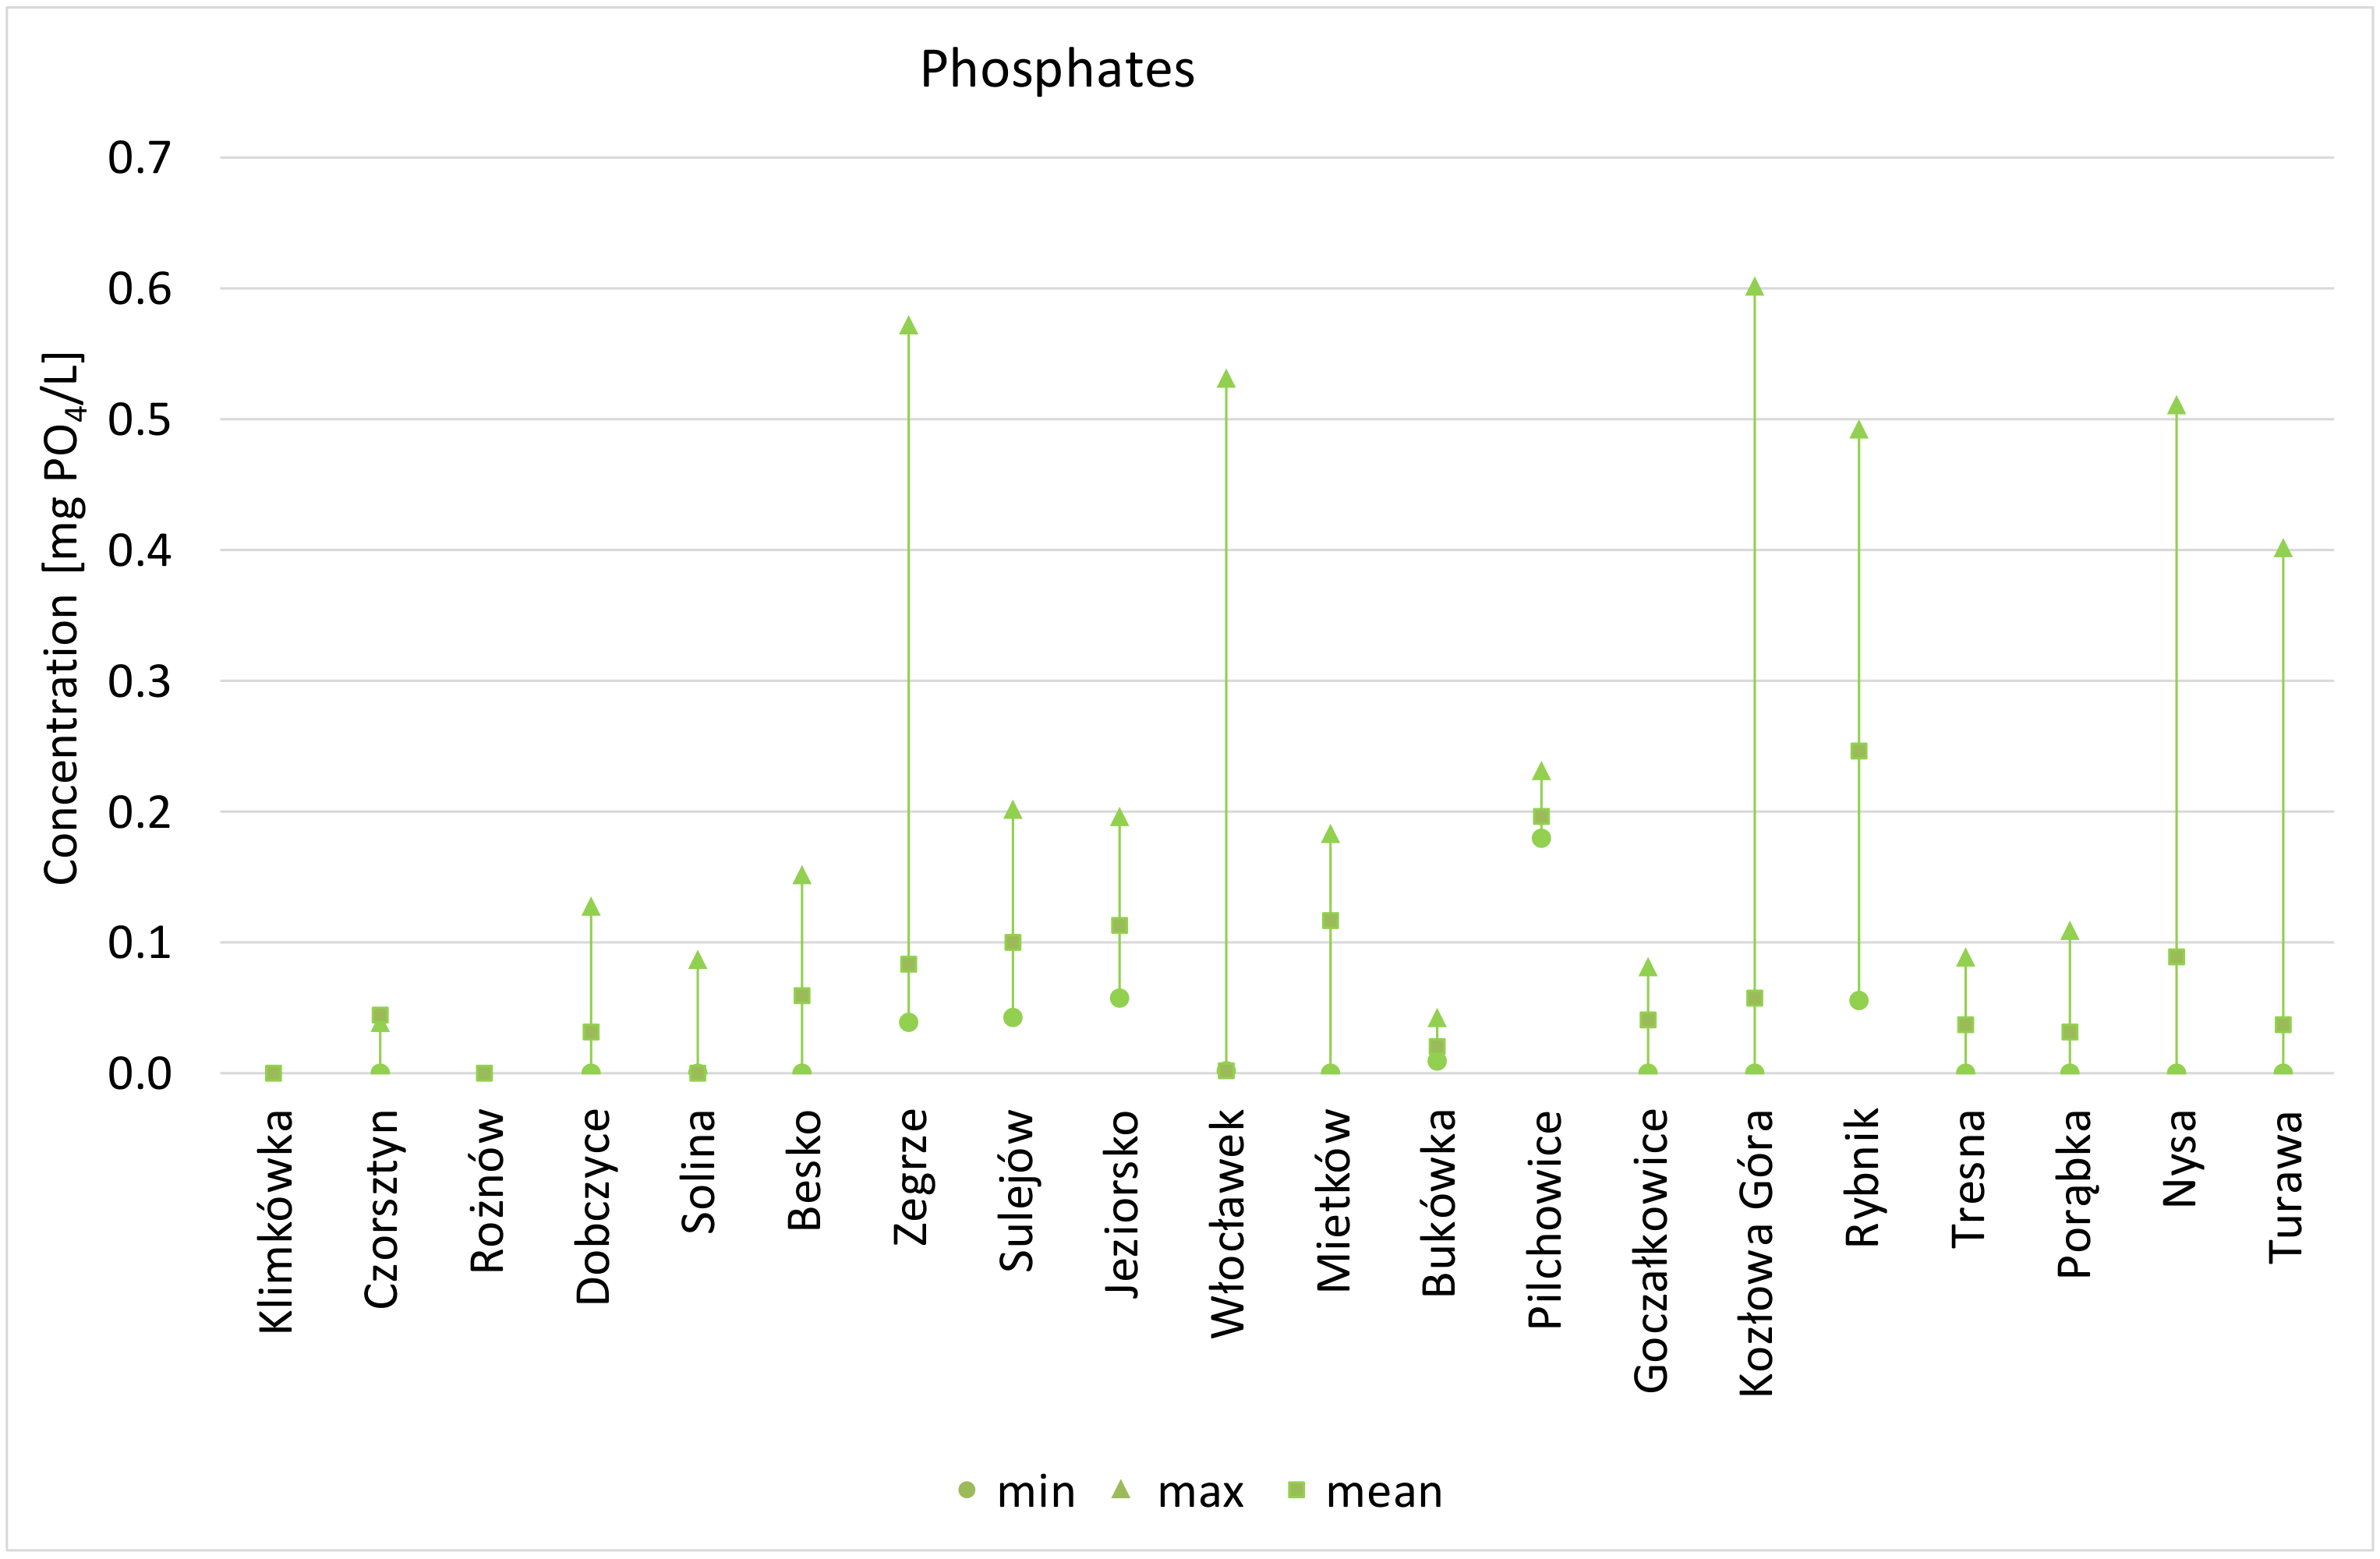
The highest average concentration of phosphates is found in the Rybnik reservoir, where this value is amounting to 0.247 mg P–PO4/L. The threshold value for water quality class II is ≤0.130 P–PO4/L. The main impact in the reservoir catchment is industry and municipal economy. The lowest average concentration of phosphates is found in the Włocławek reservoir, with 0.03 mg P–PO4/L, which is similar to the values recorded for the Solina reservoir of 0.05 mg P–PO4/L. In most of the analysed reservoirs, average phosphate concentrations do not exceed the threshold value for quality class I with ≤0.065 mg P–PO4/L. Reservoirs with average concentrations reflecting water quality class II for dam reservoirs include Dębe, Sulejów, Jeziorsko, Mietków, and Nysa. Exceeding values for water quality class II was found only in the Rybnik reservoir with 0.247 mg P–PO4/L and in the Pilchowice reservoir with 0.197 mg P–PO4/L, respectively. The Kozłowa Góra reservoir has the highest maximum value of 0.61 P–PO4/L (Figure 8).
The analysed reservoirs are mainly characterised by a N:P ratio >20, which means that the factor limiting phytoplankton development is phosphorus, and nitrogen supply will not cause further cell growth. In seven reservoirs (Jeziorsko, Nysa, Porąbka, Rybnik, Turawa, Włocławek, Zegrze) the N:P ratio is in the range of 10–20, i.e., both elements are responsible for excessive phytoplankton development.
4.3. Ecological Status
The ecological status of water is based on the assessment of biological parameters such as the indexes of phytoplankton (IFPL), macrophytes (MIR), phytobenthos (IO), benthic macroinvertebrates (MMI), and ichthyofauna as well as of supporting hydromorphological and physico-chemical parameters. The ecological status is normally assessed for artificial or heavily modified water bodies. The evaluation is made on the basis of the classified biological, physicochemical, and hydromorphological elements. The ecological status is assessed as maximum, good, moderate, poor, or bad according to the Water Framework Directive [45] and the Polish Journal of Law, 2019 [46].
Twelve of the tested reservoirs have a good ecological status. These include: Klimkówka, Czorsztyn, Rożnów, Dobczyce, Solina, Besko, Jeziorsko, Bukówka, Goczałkowice, and the Soła Cascade dam reservoirs: Tresna and Porąbka. The reservoirs: Zegrze, Sulejów, Włocławek, Mietków, Pilchowice, Kozłowa Góra, Rybnik, Turawa, and Nysa have a moderate ecological status.
The classification of the chemical status was based on the results of tested priority substances. Eight reservoirs have a good chemical status: Klimkówka, Czorsztyn, Rożnów, Dobczyce, Solina, Besko, Włocławek, and Nysa. The other reservoirs have a bad chemical status. In most reservoirs, a bad chemical status was due to exceeded concentrations of polycyclic aromatic hydrocarbons (PAH): Benzo(g,h,i)perylen, Indeno(1,2,3-cd)piren.
Generally, the ecological status classification indicates a good status for reservoirs located in the Carpathians: Klimkówka, Czorsztyn, Rożnów, Solina, Besko, and Dobczyce. All other reservoirs have a bad ecological status of water resources.
4.4. Relationships between Land Use and Water Quality
The relationship between water quality and selected total catchment parameters was found to have a statistically significant negative correlation between the use of forest and semi-natural areas (3) and TP as well as TP variability (R). This means that a larger percentage of forest and semi-natural areas within the entire catchment area reduces the concentration of TP and TP variability (R) in the reservoir itself. No statistically significant correlation was observed between TN content and land use (classes 1–5) (Table 4). Interesting results were obtained for the TP variability (R) and TN (R) in the sub-catchments. Statistical analysis showed a significant positive correlation between artificial surfaces (1) and TP variability (R). A significant positive correlation was found for sub-catchments regarding artificial surfaces (1) and TN variability (R). Therefore, the increase in the area of artificial surfaces (1) in the catchments causes greater variability of TP and TN in the reservoir (Table 5).
5. Discussion
Land use itself does not affect water quality. However, human activities on land use changes could influence the types and degree of pollution. Therefore, measuring the proportions of certain land use types in a watershed might enable us to characterise and predict water quality [23]. The use of agricultural, urban (anthropogenic), and forest lands has a significant impact on water quality [27,29,30,47]. Most studies reveal that forest, natural ecosystem, and grassland areas have a positive impact on surface water quality [27,48,49], whereas agricultural and artificial surfaces tend to deteriorate this quality [29,50,51,52,53]. Agricultural use mainly causes an increase in water pollution with nitrogen compounds, and urban areas cause an increase in water pollution with phosphorus compounds [27,54,55]. Jiao Ding et al. [28] presented different conclusions, stating that agricultural land use did not have a significant impact on water quality, and instead forest and urban land use had a significant impact on water quality. Moreover, Cheng Peixuan et al. [32] states the positive impact of agricultural use on water. However, it has also been found that the impact of agriculture on water quality can be masked by the impact of urban land use. In addition, the impact of agricultural land use on water quality depends on agricultural management practices [28].
Forest areas in sub-catchments of reservoirs can affect the increase in pollution with phosphorus and nitrogen compounds, and thus cause eutrophication of reservoir waters. Ayhan Usta et al. [30] shows a significant impact of deciduous forests on the increase in the content of nitrogen compounds. Decomposition of litterfall as well as excess nitrogen in soil increase the amount of nitrogen in water causing eutrophication, which is important in the case of a dam reservoir being a source of drinking water [30]. Soluble P is the most important form exported from grasslands and forestry. Grasslands lose most P in soluble form due to their dense vegetative cover which precludes particulate losses [56]. However, generally, forest land use essentially acts as a nutrient/nitrogen retention zone for plants [28]. Generally, if point sources of pollution are absent, water quality is potentially the best in reservoirs characterised by a large water depth, a huge water volume, and a small total catchment area. Consequently, a different and normally lower quality of water is found in shallow reservoirs with scarce water resources, and large catchment areas, that are used for agriculture, and have a dense settlement network.
Total nitrogen (TN) and total phosphorus (TP) are indexes characterising biogenic conditions. High values of biogenic substances in reservoirs, particularly phosphorus, lead to their eutrophication, often triggering algal bloom. Poland-wide, the main factor causing nitrogen and phosphorus pollution from dispersed sources is agriculture, producing 79.24% of nitrogen load and 96.7% of phosphorus load.
In the case of the analysed reservoirs, it is noted that the Rybnik reservoir has the highest average concentrations of PO43- and the high contents of TP, since artificial surfaces in the total catchment area constitute 23.9% and in the sub-catchment 36.1% of the area (Table 6 and Table 7).
High average concentrations of PO43- and TP also characterise the water of the Pilchowice reservoir, where the share of artificial surfaces in the total catchment is 10.4% (Table 8). In the case of this reservoir, the share of TN and N-NO3- is greater, which is influenced by agricultural areas in total and sub-catchments occupying over 40% of the area (Table 9 and Table 10).
A clear impact of agricultural land on high values of TN concentration can be observed for the Zegrze and Mietków reservoirs, where the average TN values exceed 2.5 mg/L. The water of both reservoirs is characterised by similar average concentrations of N-NO3- (1.87 and 1.77 mg/L). The share of agricultural land in total catchments of these reservoirs exceeds 60%, and in sub-catchments it is close to 48% (Table 10 and Table 11).
The average concentration of TN exceeding 2.0 mg/l is found in the water of the Sulejów reservoir—the share of agricultural land in the total catchment of this reservoir is 54% and in the sub-catchment—29%. The water of this reservoir is characterised by low concentrations of N-NO3—0.67 mg/l. In this case, nitrogen is supplied from agricultural areas from the catchment draining into the reservoir. Agricultural areas in the sub-catchment and total catchment of the Nysa reservoir have the same portions—53%. An elevated average TN value of 1.84 mg/L can be observed in the water of this reservoir. Also, in this reservoir, increased concentrations of TP are found—0.140 mg/l, which may similarly result from the almost 9% share of artificial surfaces in the sub-catchment (Table 8 and Table 6). The concentration of TN in the water of these reservoirs is characterised by high variability, which results from the periodic inflow of larger amounts of nutrients during the fertilization of arable land, whereas lower values correspond to the growing season.
In the Turawa reservoir, the share of agricultural land in the total catchment is 32.4%, and in the sub-catchment, only 18.0%. The share of artificial surfaces is similar in both catchments, 6% (total catchment) and 5.3% (sub-catchment). The highest average and maximum concentrations of TP and TN among all analysed reservoirs are recorded in this reservoir. The main type of land use in the catchment of this reservoir is forests. Their share in the total catchment is 60%, and in the sub-catchment, 45% (Table 7 and Table 12). According to CLC Land Cover, these are deciduous forests. The increased contents of TP and TN do not result from land use, and most likely come from point sources of pollution, which may be inefficient sewage treatment plants and illegal discharge of sewage from unsewered areas.
An unfavourable ratio of the share of agricultural land area to forests occurs in the sub-catchments of the Goczałkowice and Dobczyce reservoirs. In the sub-catchment of the Goczałkowice reservoir, agricultural areas cover 34%, and forest areas 14%. In the sub-catchment of the Dobczyce reservoir, 46% of the area is agricultural and forests cover only 17% (Table 7, Table 11, Table 12 and Table 13). In these reservoirs, we can observe increased levels of TN, and these are drinking water reservoirs.
Generally, no negative impact on the increase of TN content was found for forests located in sub-catchments. In sub-catchments of the Klimkówka and Solina reservoirs, forest areas occupy 63% of the area and these are mainly deciduous forests. Consequently, the water of these reservoirs has low TN and TP values (Table 12 and Table 13). There is a significant difference between total catchment and sub-catchment land use. Figure 4 illustrates that the percentages of the different land use in the total- and the sub-catchment area are showing a quite similar distribution. Obviously, the waterbody percentage is much larger in the sub-catchment areas due to the presence of the reservoir itself. However, in the Rybnik and Tresna sub-catchment areas, the artificial land use is much larger than in the total catchment due to the sub-catchment consisting mainly of industrialised and urbanised areas of the Upper Silesian Metropolitan Area with a population of 5.3 million.
6. Conclusions
In addition to fulfilling the main functions, the creation of dam reservoirs created a great opportunity for the development of adjacent areas, especially in sub-catchments of the reservoirs. In spatial development plans and other planning documents, these areas should be excluded from further investment in the form of, for example, the creation of new buildings, recreational and leisure areas, or intensive agriculture. In the reservoir sub-catchments, the functioning of existing natural structures should be strengthened and mainly forest utilisation and natural ecosystems should be introduced. The conservation of rushes and wetlands in sub-catchments has a significant impact on reducing the direct supply of nutrients to the reservoirs. All planning documents for these areas should include water protection issues.
Dam reservoirs play an important role for the adaptation to climate change. The primary role should be to maintain the reservoirs’ water quality. The improvement of water quality can be achieved by limiting the inflow of pollutants from the catchment area of the reservoir. The analysis of land use data clearly indicates a possible negative impact of area pollution sources on water quality. CLC data facilitate the implementation of sustainable development principles in the reservoir basins by introducing measures to prevent water pollution and improve water quality management. One solution may be to introduce ecotone zones to reduce nitrogen inflow from agricultural areas. Moreover, increasing the share of forest and semi-natural areas has a positive effect on water quality. Based on the analysis of CLC data, it is therefore possible to analyse the current development of the reservoir catchment areas in order to properly plan its future use. In catchments of reservoirs with poor or endangered water quality, artificial and agricultural areas should be limited, and forest and semi-natural areas expanded, especially in sub-catchments.
In this article we showed that an important factor influencing water quality of the analysed dam reservoirs is the way of land use/land cover of the area of both the entire reservoir catchment and the sub-catchment. In addition, we believe that CLC data are useful in objectively identifying and assessing impacts on water quality in reservoirs exerted by land use in their catchment areas.
Author Contributions
Conceptualization, M.M. (Magdalena Matysik), D.A.; funding acquisition, M.H., D.A.; investigation, M.M. (Magdalena Matysik), D.A., M.H., and M.M. (Michael Maerker); methodology, M.M. (Magdalena Matysik), D.A.; supervision, M.M. (Michael Maerker); validation, M.M. (Magdalena Matysik), D.A., M.H., and M.M. (Michael Maerker); visualisation, M.M. (Magdalena Matysik), D.A.; writing—original draft, M.M. (Magdalena Matysik), D.A., and M.H.; writing—review and editing, M.M. (Magdalena Matysik), D.A., M.H., and M.M. (Michael Maerker). All authors have read and agree to the published version of the manuscript.
Funding
The APC was funded by University of Silesia in Katowice and Kazimierz Wielki University by regular financial support from the Polish Ministry of Science and Education.
Conflicts of Interest
The authors declare no conflict of interest.
References
- Głodek, J. Jeziora Zaporowe Świata; Państwowe Wydawnictwo Naukowe: Warsaw, Poland, 1985. [Google Scholar]
- Choiński, A. Limnologia Fizyczna Polski; Wydawnictwo Naukowe UAM: Poznań, Poland, 2007; p. 547. [Google Scholar]
- Statistical Yearbook 2014; Główny Urząd Statystyczny w Warszawie: Warsaw, Poland, 2015.
- Łajczak, A. Studium nad Zamulaniem Wybranych Zbiorników Zaporowych w Dorzeczu Wisły; Monografie Komitetu Gospodarki Wodnej PAN: Warsaw, Poland, 1995; Volume 8, p. 106. [Google Scholar]
- Allan, J.D. Ekologia wód Płynących; Państwowe Wydawnictwo Naukowe: Warsaw, Poland, 1998. [Google Scholar]
- Kajak, Z. Hydrobiologia—Limnologia. Ekosystemy wód Śródlądowych; Państwowe Wydawnictwo Naukowe: Warsaw, Poland, 1998. [Google Scholar]
- Vannote, R.L.; Minshall, G.W.; Cummins, K.W.; Sedell, J.R.; Cushing, C.E. The River Continuum Concept. Can. J. Fish. Aquat. Sci. 1980, 37, 130–137. [Google Scholar] [CrossRef]
- Znamenski, V.A. The role of hydrological factors with respect to water quality in reservoirs. In The Effects of Storage on Water Quality; Water Research Centre: Medmenham, UK, 1975; pp. 567–573. [Google Scholar]
- Ward, J.S.; Stanford, J.A. The intermediate—Disturbance hypothesis: An explanation for biotic diversity patterns in lotic ecosystems. In Dynamic of Lotic Ecosystems; Fontaine, T.D., Bartell, S.M., Eds.; Ann Arbor Science Publishers, The Butterworth Group: Ann Arbor, MI, USA, 1983; pp. 347–356. [Google Scholar]
- Kajak, Z. Changes in river water quality in reservoirs, exemplified by studies in Poland. In Regulated Rivers; Lillehamer, A., Saltveit, S.J., Eds.; Publ. Universitetsforlanget AS: Oslo, Norway, 1984; pp. 521–531. [Google Scholar]
- Galicka, W.; Kruk, A.; Zięba, G. Bilans Azotu i Fosforu w Zbiorniku Jeziorsko; Wyd. Akademii Rolniczej im. A. Cieszkowskiego: Poznań, Poland, 2007. [Google Scholar]
- Giziński, J. Hydroelectricity and ecological considerations. Falsification of the environmental reality by the opponents of hydropower. Acta Energetica 2013, 3, 32–44. [Google Scholar] [CrossRef]
- Kentzer, A.; Dembowska, E.; Giziński, A.; Napiórkowski, P. Influence of the Włocławek Reservoir on hydrochemistry and plankton of a large, lowland river (the Lower Vistula River, Poland). Ecol. Eng. 2010, 36, 1747–1753. [Google Scholar] [CrossRef]
- Napiórkowski, P.; Kentzer, A.; Dembowska, E. Zooplankton of the lower Vistula River: The effect of Włocławek Dam Reservoir (Poland) on community structure. Ver. Theor. Angew. Limnol. 2006, 29, 2109–2114. [Google Scholar] [CrossRef]
- Giziński, A.; Kentzer, A.; Żytkowicz, R. Ekologiczne skutki kaskadowej zabudowy dolnej Wisły (prognoza oparta na wynikach badań zbiornika włocławskiego) [Ecological Consequences of Cascade Development of the Lower Vistula River (Forecast Based on Findings of Research of the Włocławek Reservoir)]. In Uwarunkowania Przyrodnicze i Społeczno-Ekonomiczne Zagospodarowania Dolnej Wisły [Environmental and Socio-Economic Considerations of Development of the Lower Vistula River]; Churski, Z., Ed.; Wyd. Uniwersytetu Mikołaja Kopernika: Torun, Poland, 1993; pp. 179–188. [Google Scholar]
- Cheng, X. Reservoir sedimentation at Chinese hydro systems. Water Power Dam Constr. 1992, 44, 44–47. [Google Scholar]
- Babiński, Z. Transport rumowiska unoszonego i wleczonego dolnej Wisły. Przegląd Geogr. 1994, 67, 82–95. [Google Scholar]
- Morris, G.L. Reservoir serimentation and sustiainable development in India. In Proceedings of the Sixth International Symposium on River Sedimentation, New Delhi, India, 7–11 November 1995; p. 227. [Google Scholar]
- Gierszewski, P.; Zakonnov, V.; Kaszubski, M.; Kordowski, J. Transformacja właściwości wody i osadów w profilu podłużnym zbiorników zaporowych Kaskady Górnej Wołgi. Przegląd Geogr. 2017, 89, 391–412. [Google Scholar]
- Szatten, D.; Habel, M.; Pellegrini, L.; Maerker, M. Assessment of Siltation Processes of the Koronowski Reservoir in the Northern Polish Lowland Based on Bathymetry and Empirical Formulas. Water 2018, 10, 1681. [Google Scholar] [CrossRef] [Green Version]
- Wildi, W. Environmental hazards of dams and reservoirs. Nat. Environ. Sci. 2010, 88, 187–197. [Google Scholar]
- Vörosmarty, C.J.; Sharma, K.P.; Fekete, B.M.; Copeland, A.H.; Holden, J.; Marble, J.; Lough, J.A. The storage and aging of continental runoff in large reservoir systems of the world. Ambio 1997, 26, 269–278. [Google Scholar]
- Bu, H.; Meng, W.; Zhang, Y.; Wan, J. Relationships between land use patterns and water quality in the Taizi River basin. China. Ecol. Indic. 2014, 41, 187–197. [Google Scholar] [CrossRef]
- Zorzal-Almeida, S.; Salim, A.; Andrade, M.R.M.; Nascimento, M.N.; Bini, L.M.; Bicudo, D.C. Effects of land use and spatial processes in water and surface sediment of tropical reservoirs at local and regional scales. Sci. Total Environ. 2018, 644, 237–246. [Google Scholar] [CrossRef] [PubMed]
- Li, X.Y.; Ma, Y.J.; Xu, H.Y.; Wang, J.H.; Zhang, D.S. Impact of land use and land cover change on environmental degradation in lake Qinghai watershed, northeast Qinghai-Tibet Plateau. Land Degrad. Dev. 2009, 20, 69–83. [Google Scholar] [CrossRef]
- Effendi, H.; Muslimah, S.; Permatasari, P.A. Relationship between land use and water quality in Pesanggrahan River. IOP Conf. Ser. Earth Environ. Sci. 2018, 149, 12022. [Google Scholar] [CrossRef] [Green Version]
- Tolera, M.; Taffa, T. Effects of Land Use/Cover Type On Surface Water Quality: In The Case Of Chancho and Sorga Watershed, 010 East Wollega Zone, Oromia, Ethiopia. Int. J. Environ. Sci. Nat. Res. 2018, 12, 555842. [Google Scholar]
- Ding, J.; Jiang, Y.; Fu, L.; Liu, Q.; Peng, Q.; Kang, M. Impacts of Land Use on Surface Water Quality in a Subtropical River Basin: A Case Study of the Dongjiang River Basin, Southeastern China. Water 2015, 7, 4427–4445. [Google Scholar] [CrossRef] [Green Version]
- Somura, H.; Yuwono, S.B.; Ismono, H.; Arifin, B.; Fitriani, F.; Kada, R. Relationship between water quality variations and land use in the Batutegi Dam Watershed, Sekampung, Indonesia. Lakes Reserv. 2018, 24, 93–101. [Google Scholar] [CrossRef] [Green Version]
- Usta, A.; Yilmaz, M.; Kocamanoglu, Y.O. The Impacts on Water Quality Parameters of Different Land Uses on Catak Formation: Case of Galyan Dam, Trabzon. Int. J. Sci. Technol. Res. 2018, 4, 8. [Google Scholar]
- Cheng, P.; Meng, F.; Wang, Y.; Zhang, L.; Yang, Q.; Jiang, M. The Impacts of Land Use Patterns on Water Quality in a Trans-Boundary River Basin in Northeast China Based on Eco-Functional Regionalization. Int. J. Environ. Res. Public Health 2018, 15, 1872. [Google Scholar] [CrossRef] [Green Version]
- Jenks, G.F.; Caspall, F.C. Error on choroplethic maps: Definition, measurement, reduction. Ann. Assoc. Am. Geogr. 1971, 61, 217–244. [Google Scholar] [CrossRef]
- Campling, P.; Terres, J.M.; Vande Walle, S.; Van Orshoven, J.; Crouzet, P. Estimation of nitrogen balances from agriculture for EU-15: Spatialisation of estimates to river basins using the CORINE Land Cover. Phys. Chem. Earth 2005, 30, 25–34. [Google Scholar] [CrossRef]
- Koc, J.; Ciećko, C.; Janicka, R.; Rochwerger, A. Czynniki kształtujące poziom mineralnych form azotu w wodach obszarów rolniczych. Zesz. Probl. Postępów Nauk Rol. 1996, 440, 175–183. [Google Scholar]
- Smoroń, S. Zagrożenie eutrofizacją wód powierzchniowych wyżyn lessowych małopolski. Woda-Środowisko-Obsz. Wiej. 2012, 12, 181–191. [Google Scholar]
- Dąbrowska, J.; Moryl, A.; Kucharczak-Moryl, E.; Żmuda, R.; Lejcuś, I. Zawartość związków azotu w wodach rzeki Strzegomki powyżej zbiornika Dobromierz. Desalin. Acta Sci. Pol. Form. Circumiectus 2016, 15, 57–69. [Google Scholar] [CrossRef]
- Ji, Z.G. Hydrodynamics and Water Quality: Modeling Rivers, Lakes, and Estuaries; John Wiley & Sons, Inc.: New York, NY, USA, 2007. [Google Scholar]
- Ilnicki, P. Polskie Rolnictwo a Ochrona Środowiska; Wyd. AR: Poznań, Poland, 2004. [Google Scholar]
- Picińska-Fałtynowicz, J.; Błachuta, J. Wytyczne Metodyczne do Przeprowadzenia Monitoringu i Oceny Potencjału Ekologicznego Zbiorników Zaporowych w Polsce; Inspekcja Ochrony Środowiska: Warszawa, Poland, 2012; p. 65. [Google Scholar]
- Krengel, F.; Bernhofer, C.; Chalov, S.; Efimov, E.; Efimova, L.; Gorbachova, L.; Habel, M.; Helm, B.; Kruhlov, I.; Nabyvanets, Y.; et al. Challenges for Transboundary River Management in Eastern Europe—Three Case Studies. Erde 2018, 149, 1–16. [Google Scholar]
- Solarczyk, A. Jakość wody oraz stan ekologiczny jezior i zbiorników zaporowych. In Hydrologia Polski; Jokiel, P., Marszelewski, W., Pociask-Karteczka, J., Eds.; Państwowe Wydawnictwo Naukowe: Warsaw, Poland, 2017; pp. 247–255. [Google Scholar]
- Ciupa, T.; Łajczak, A.; Babiński, Z. Rumowisko klastyczne. In Hydrologia Polski; Jokiel, P., Marszelewski, W., Pociask-Karteczka, J., Eds.; Państwowe Wydawnictwo Naukowe: Warsaw, Poland, 2017; pp. 146–152. [Google Scholar]
- Pulikowski, K.; Czyżyk, F.; Pawęska, K.; Strzelczyk, M. Udział azotu azotanowego w ogólnej zawartości azotu w wodach odpływających ze zlewni użytkowanych rolniczo. Infrastrukt. Ekol. Teren. Wiej. 2012, 3/I, 155–165. [Google Scholar]
- Smoroń, S. Obieg fosforu w rolnictwie i zagrożenie dla jakości wody. Zesz. Eduk. 1996, 1, 86–104. [Google Scholar]
- Water Framework Directive 2000/60/EC of the European Parliament and of the Council of 23 October 2000 Establishing a Framework for Community Action in the Field of Water Policy. Available online: https://eur-lex.europa.eu/legal-content/EN/TXT/?uri=CELEX:32000L0060 (accessed on 17 March 2020).
- Rozporządzenie Ministra Gospodarki Morskiej i Żeglugi Śródlądowej z Dnia 9 Października 2019 r. w Sprawie Form i Sposobu Prowadzenia Monitoringu Jednolitych Części Wód Powierzchniowych i Jednolitych Części Wód Podziemnych (Journal of Laws of 2019, item 2149). 2019. Available online: http://prawo.sejm.gov.pl/isap.nsf/DocDetails.xsp?id=WDU20190002147 (accessed on 17 March 2020).
- Li, S.; Gu, S.; Liu, W.; Han, H.; Zhang, Q. Water quality in relation to land use and land cover in the upper Han River Basin, China. Catena 2008, 75, 216–222. [Google Scholar] [CrossRef]
- Teixeira, Z.; Teixeira, H.; Marques, J.C. Systematic processes of land use/land cover change to identify relevant driving forces: Implications on water quality. Sci. Total Environ. 2014, 470–471, 1320–1335. [Google Scholar] [CrossRef] [Green Version]
- Zampella, R.A.; Procopio, N.A.; Lathrop, R.G.; Dow, C.L. Relationship of land-use/land-cover patterns and surface-water quality in the Mullica river basin. J. Am. Water Resour. Assoc. 2007, 43, 594–604. [Google Scholar] [CrossRef]
- Matysik, M.; Absalon, D.; Ruman, M. Surface Water Quality in Relation to Land Cover in Agricultural Catchments (Liswarta River Basin Case Study). Pol. J. Environ. Stud. 2015, 24, 87–96. [Google Scholar] [CrossRef]
- Baker, A. Land use and water quality. Hydrol. Process. 2003, 17, 2499–2501. [Google Scholar] [CrossRef]
- Schoonover, J.E.; Lockaby, B.G. Land cover impacts on stream nutrients and fecal coliform in the lover Piedmont of West Georgia. J. Hydrol. 2006, 331, 371–382. [Google Scholar] [CrossRef]
- Kazi, T.G.; Arain, M.B.; Jamali, M.K.; Jalbani, N.; Afridi, H.I.; Sarfaz, R.A.; Baig, J.A.; Shah, A.Q. Assessment of water quality of polluted lake using multivariate statistical techniques: A case study. Ecotoxicol. Environ. Saf. 2009, 72, 301–309. [Google Scholar] [CrossRef] [PubMed]
- Meng, F.; Wang, Y.; Zhang, L.; Cheng, P.; Xue, H.; Meng, D. Organic pollutant types and concentration changes of the water from Songhua river, China in 1975–2013. Water Air Soil Pollut. 2016, 227, 214. [Google Scholar] [CrossRef]
- Dow, C.L.; Arscott, D.B.; Newbold, J.D. Relating major ions and nutrients to watershed conditions across a mixed-use water-supply watershed. J. N. Am. Benthol. Soc. 2006, 25, 887–991. [Google Scholar] [CrossRef]
- McGuckin, S.O.; Jordan, C.; Smith, R.V. Deriving phosphorus export coefficients for Corine Land Cover types. Water Sci. Technol. 1999, 39, 47–53. [Google Scholar] [CrossRef]
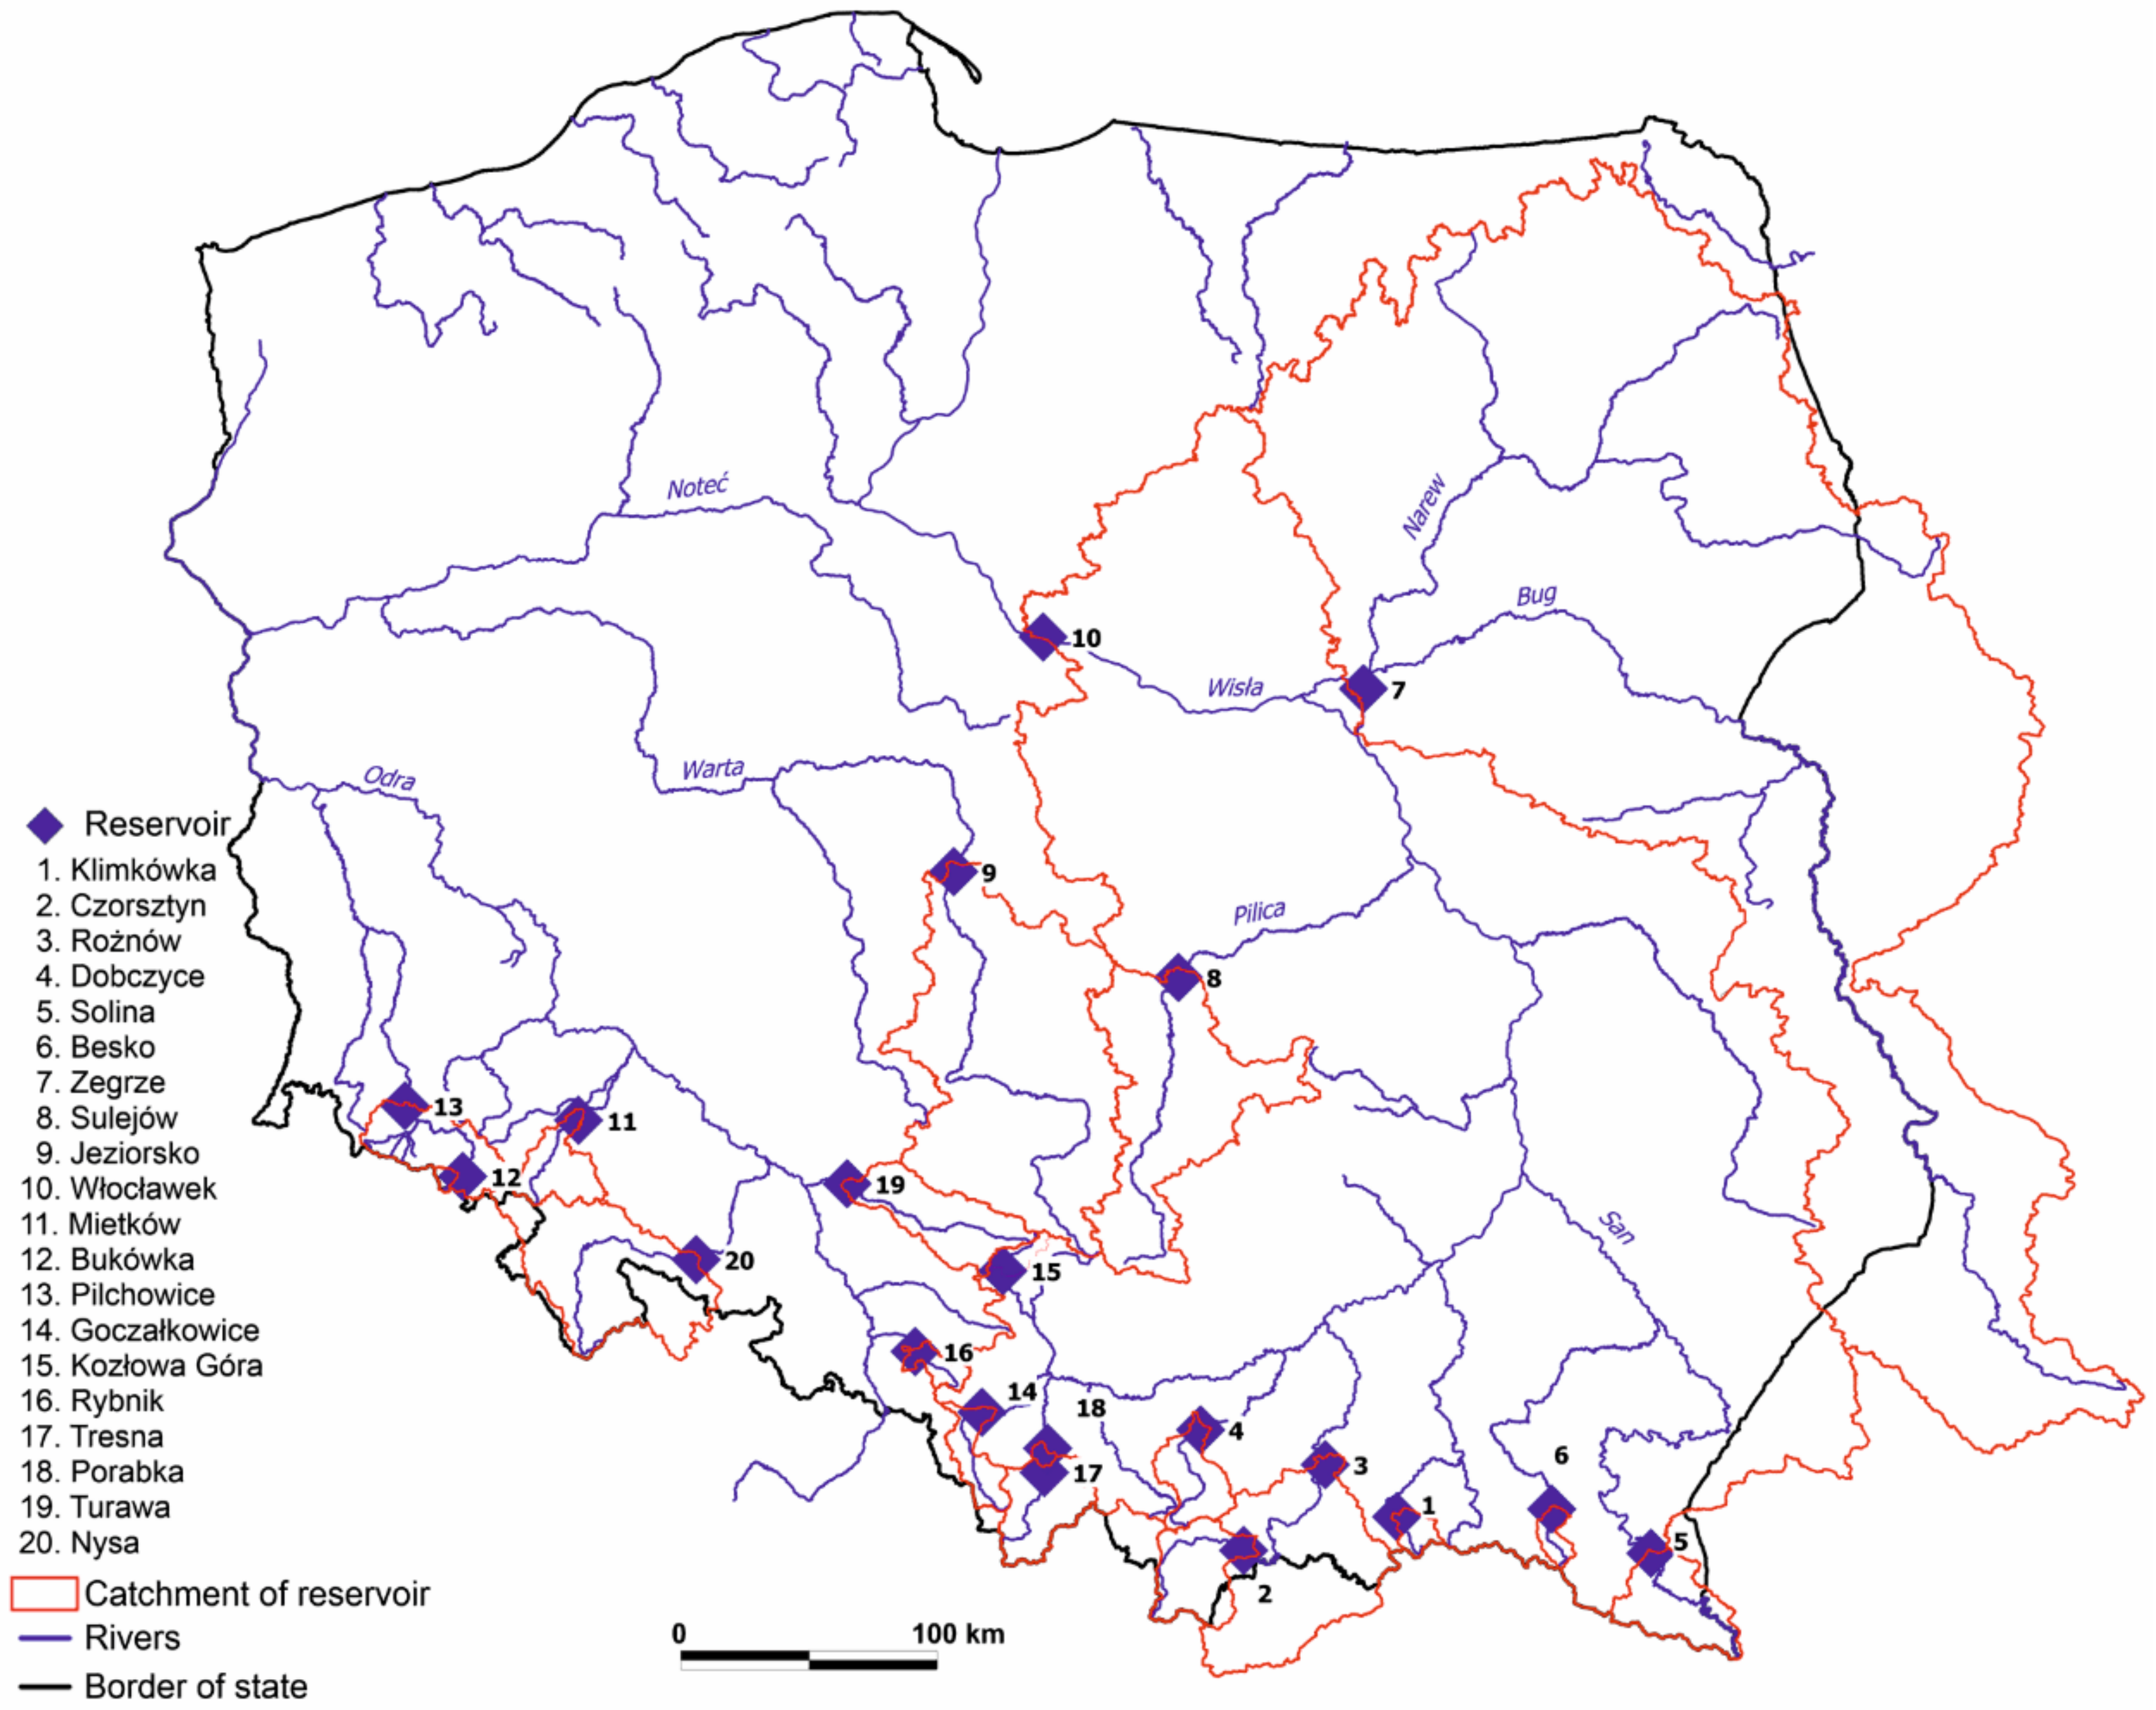
Figure 1.
Map of the river network with the location of study sites in Poland.

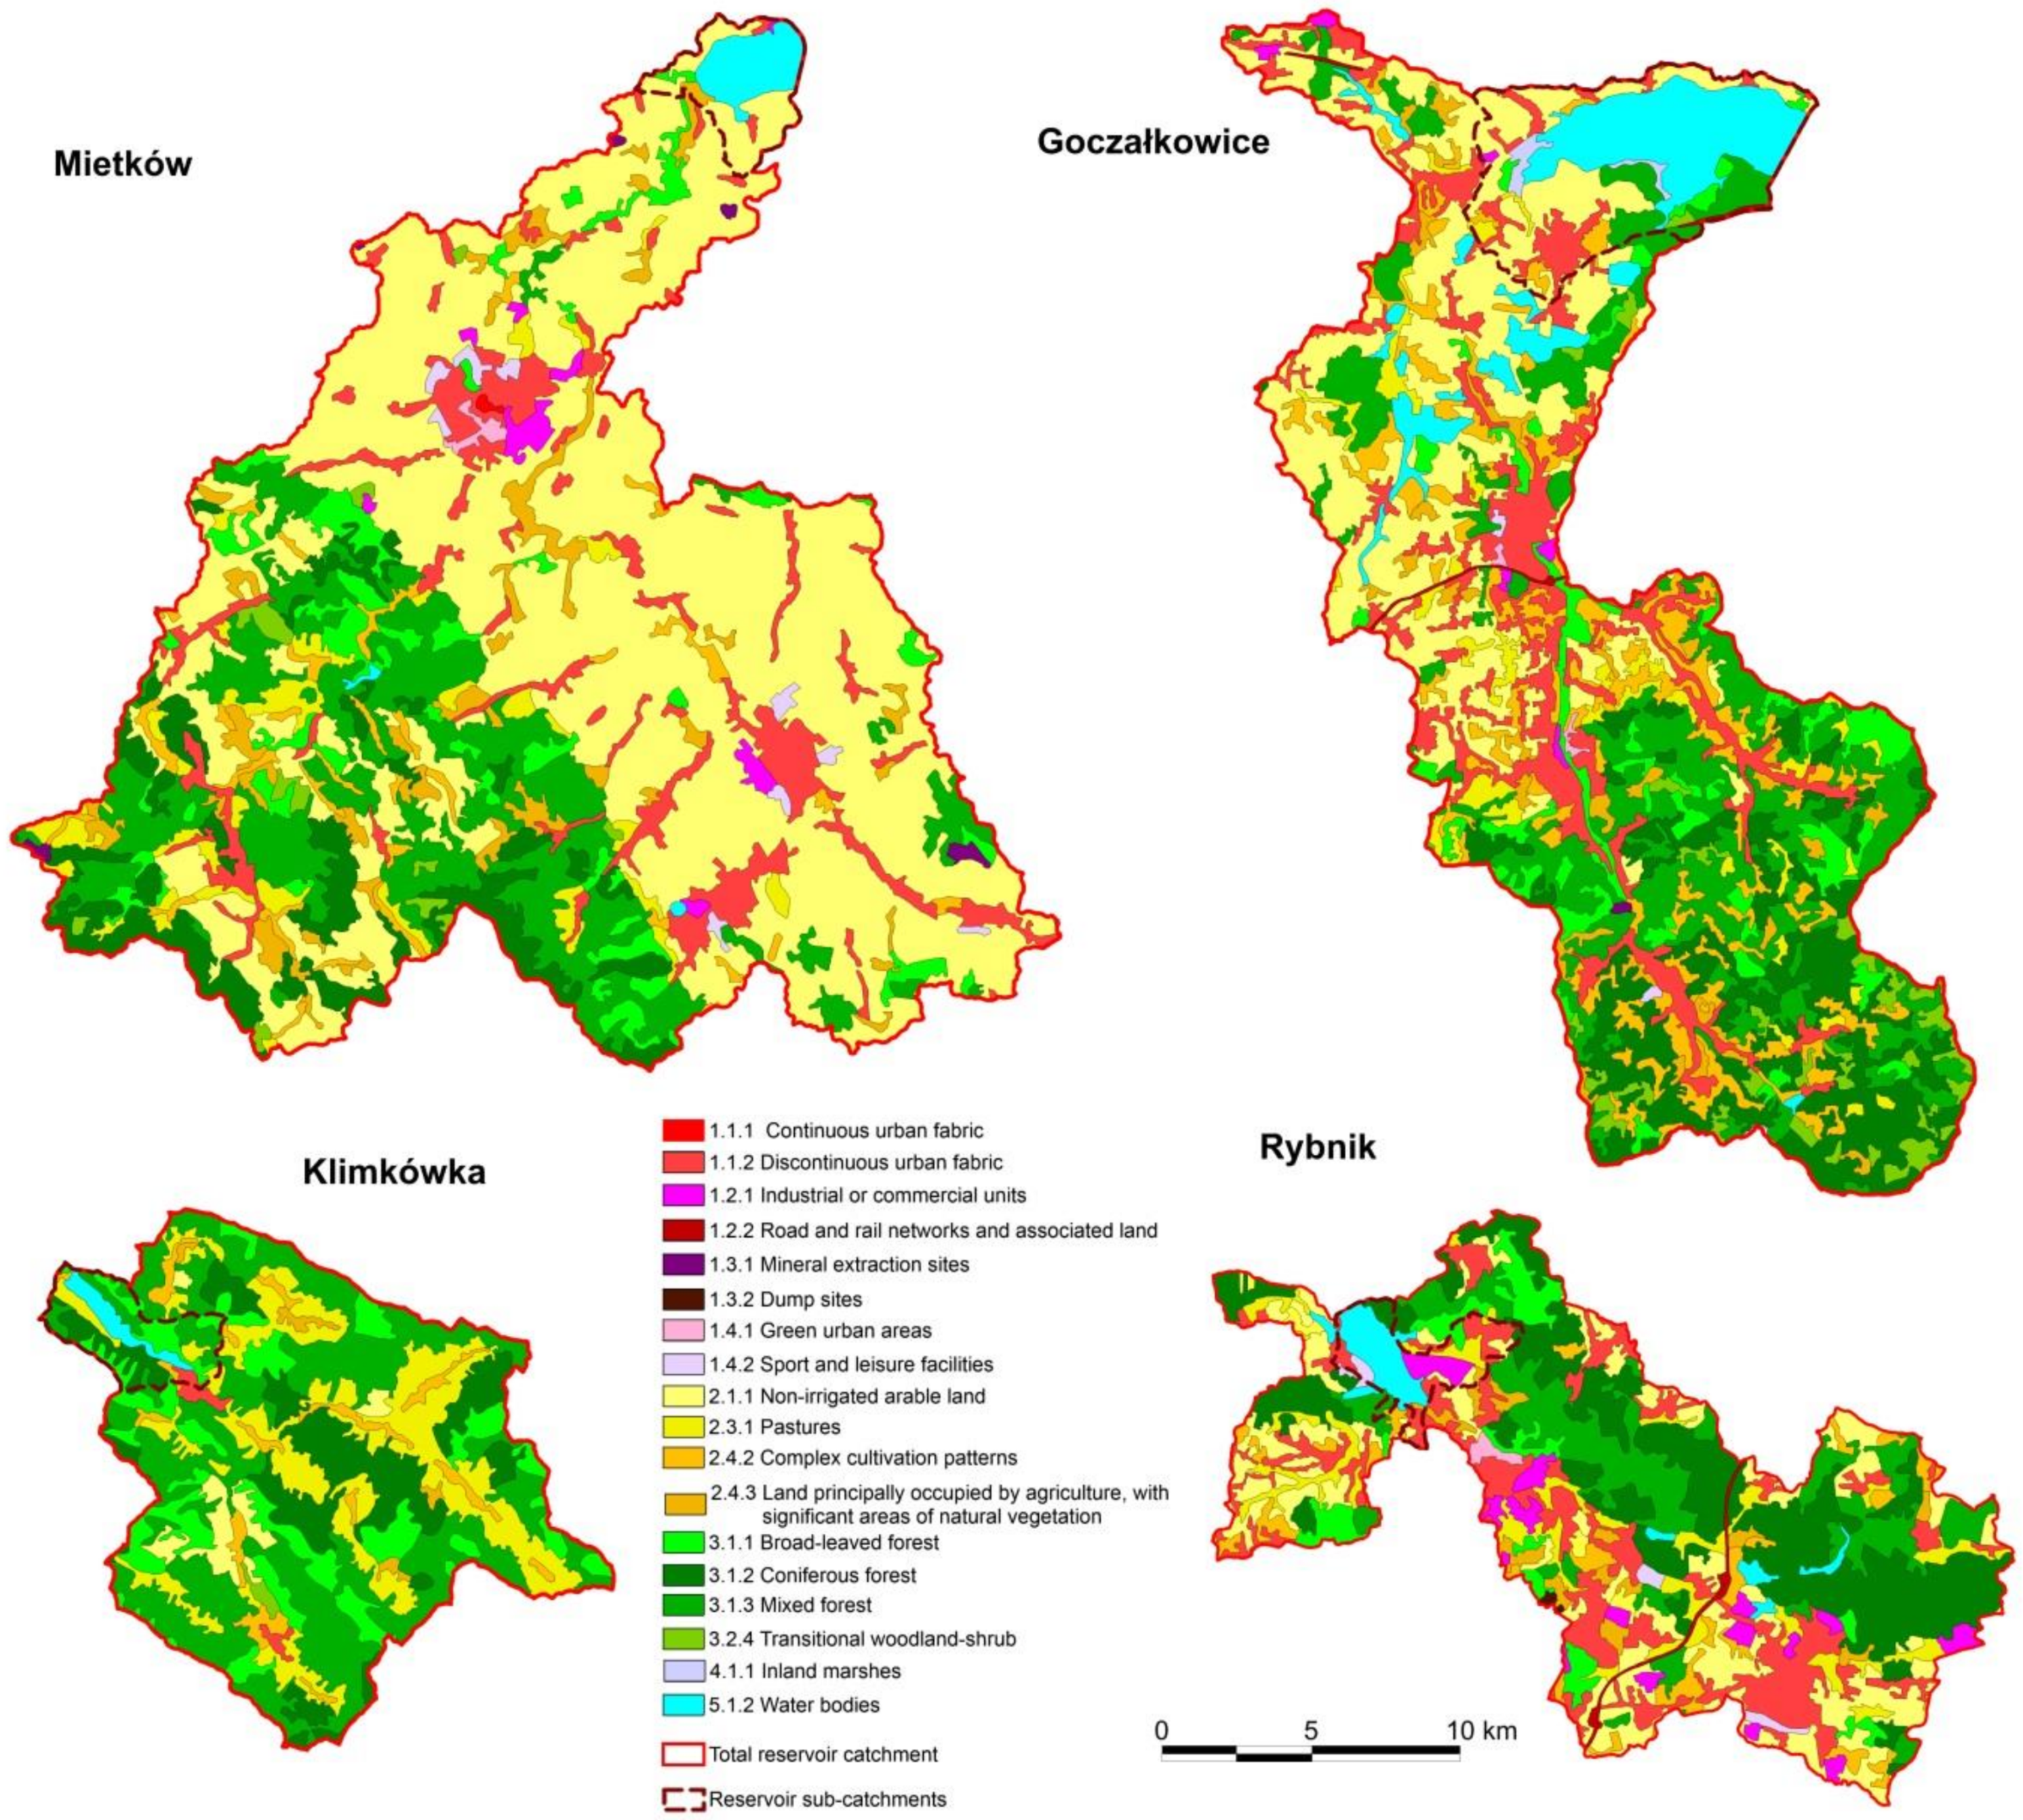
Figure 2.
Selected examples of the spatial distribution of land use types in the total reservoir catchments based on CORINE Land Cover 2018.
Figure 2.
Selected examples of the spatial distribution of land use types in the total reservoir catchments based on CORINE Land Cover 2018.

Figure 3.
Selected examples of the spatial distribution of land use types in the reservoir sub-catchments based on CORINE Land Cover 2018.
Figure 3.
Selected examples of the spatial distribution of land use types in the reservoir sub-catchments based on CORINE Land Cover 2018.

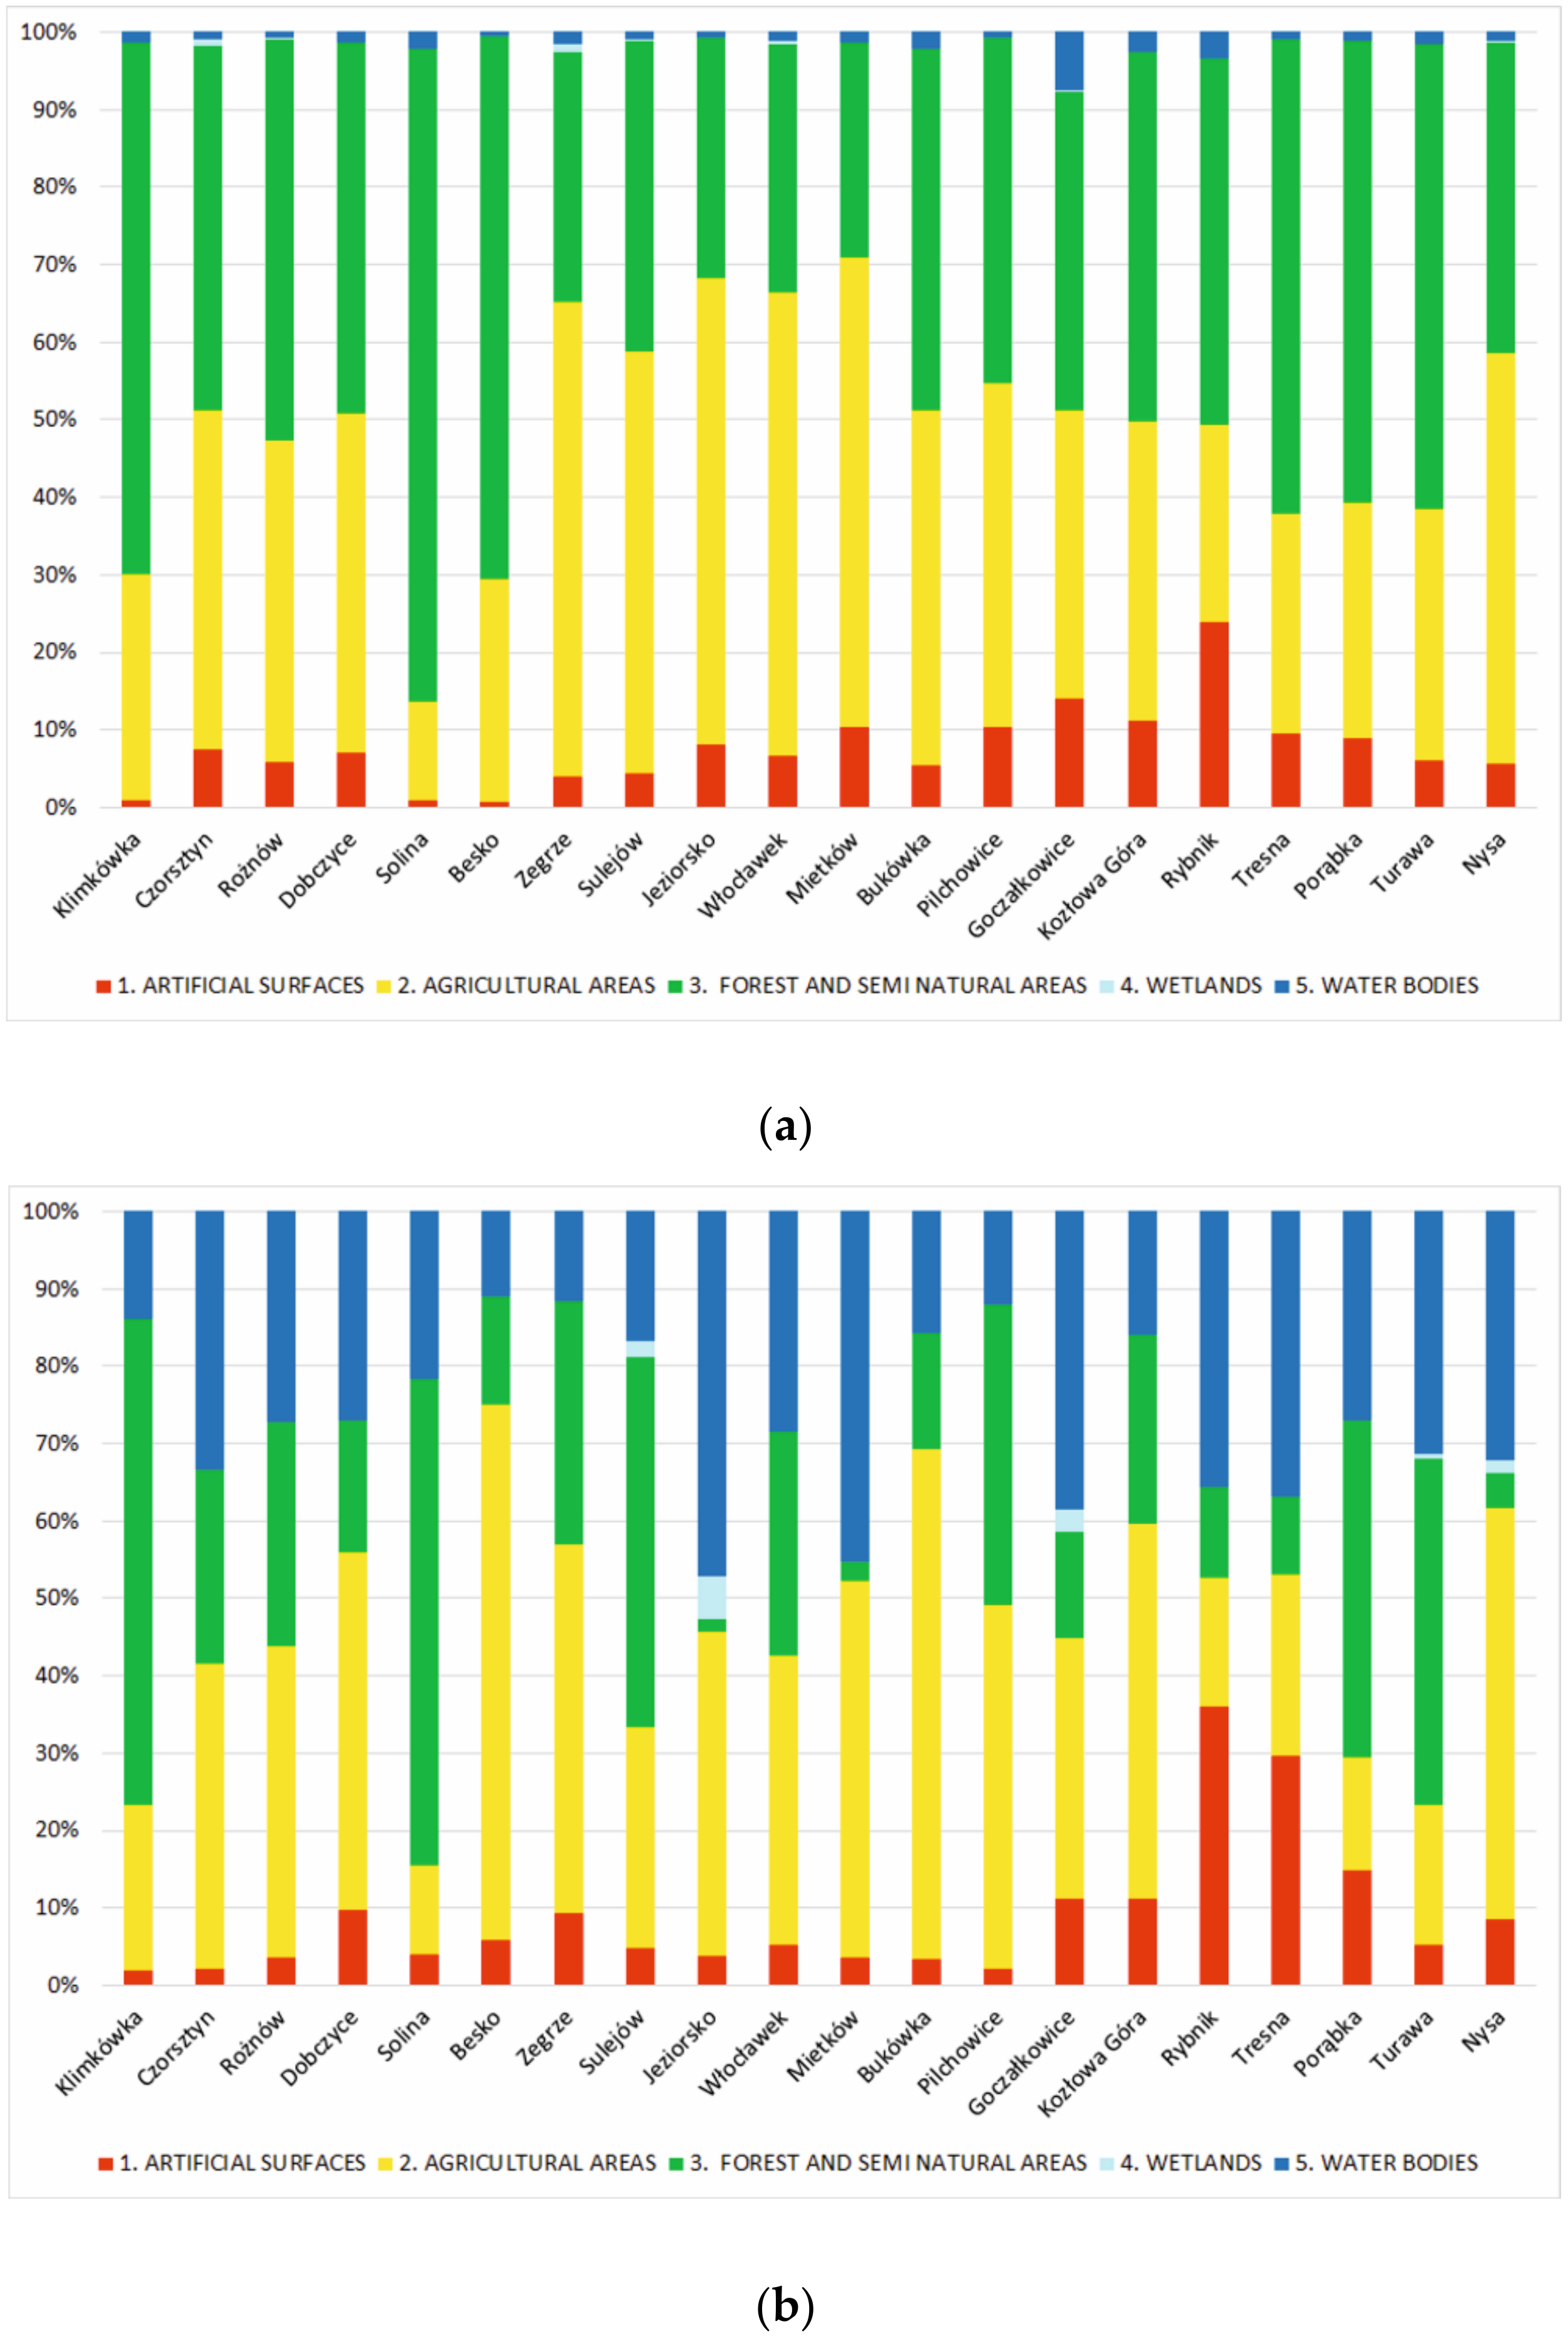
Figure 4.
Percentages of particular land use types according to the CORINE classification in the catchments of the analysed reservoirs: (a) total catchment, (b) sub-catchment.
Figure 4.
Percentages of particular land use types according to the CORINE classification in the catchments of the analysed reservoirs: (a) total catchment, (b) sub-catchment.

Figure 5.
Total nitrogen distribution in analysed reservoirs.

Figure 6.
Total phosphorus distribution in analysed reservoirs.

Figure 7.
Distribution of nitrate nitrogen N-NO3 in analysed reservoirs.

Figure 8.
Distribution of phosphates in analysed reservoirs.


Table 1.
Basic characteristics of the analysed reservoirs.
| Reservoir | River Name | Main River Basin Name | Main Catchment Area (km2) | Sub-Catchment Area (km2) |
|---|---|---|---|---|
| Besko | Wisłok | Vistula | 207.1 | 11.24 |
| Bukówka | Bóbr | Oder | 57.54 | 8.16 |
| Czorsztyn | Dunajec | Vistula | 1126.28 | 30.55 |
| Dobczyce | Raba | Vistula | 765.58 | 36.77 |
| Goczałkowice | Vistula | Vistula | 523.47 | 67.83 |
| Jeziorsko | Warta | Oder | 9006.95 | 76.96 |
| Klimkówka | Ropa | Vistula | 214.8 | 16.89 |
| Kozłowa Góra | Brynica | Vistula | 193.95 | 24.60 |
| Mietków | Bystrzyca | Oder | 716.58 | 18.50 |
| Nysa | Nysa Kłodzka | Oder | 3264.95 | 46.48 |
| Pilchowice | Bóbr | Oder | 1207.28 | 11.70 |
| Porąbka | Soła | Vistula | 1091.77 | 11.70 |
| Rożnów | Dunajec | Vistula | 4855.54 | 47.00 |
| Rybnik | Ruda | Oder | 240.59 | 13.16 |
| Solina | San | Vistula | 1191.14 | 89.66 |
| Sulejów | Pilica | Vistula | 4933.14 | 114.02 |
| Tresna | Soła | Vistula | 1036.56 | 24.45 |
| Turawa | Mała Panew | Oder | 1419.12 | 52.40 |
| Włocławek | Vistula | Vistula | 171,468.65 | 208.19 |
| Zegrze | Narew | Vistula | 68,973.57 | 238.86 |
Table 2.
Basic parameters and indicators of the analysed reservoirs.
| Reservoir | Total Storage Capacity (m3) | Flood Storage Capacity (m3) | Full Supply Level (FSL) (m) | Surface Area of Reservoir at FLS (km2) | Water Exchange/Retention Time Day | Main Purpose * |
|---|---|---|---|---|---|---|
| Besko | 14,180,000 | 4,430,000 | 29.00 | 1.31 | 60 | F, S, E |
| Bukówka | 16,790,000 | 3.870,000 | 22.00 | 1.99 | 194 | F, S |
| Kozłowa Góra | 17,582,000 | 5,190,000 | 7.00 | 6.04 | 307 | F, R |
| Rybnik | 23,400,000 | 1,380,000 | 1.30 | 4,635 | 76 | E, F, R |
| Porąbka | 27,190,000 | 4,580,000 | 21.20 | 3.35 | 22 | S, E, N, R |
| Klimkówka | 42,590,000 | 6,45,000–8,000,000 | 37.70 | 3.06 | 148 | S, E, F, R |
| Pilchowice | 50,000,000 | 17,000,000–26,000,000 | 46.70 | 2.40 | 37 | F, R, S |
| Mietków | 71,850,000 | 15,050,000 | 15.30 | 9.05 | 128 | N, F, R |
| Sulejów | 84,330,000 | 9,220,000 | 11.25 | 23.80 | 38 | F, S, E, R |
| Zegrze | 89,960,000 | none | 7.02 | 33.00 | 8,2 | E, R, S, W |
| Tresna | 96,110,000 | 31,010,000–39,450,000 | 25.40 | 9.64 | 90 | S, F, N, R |
| Turawa | 106,180,000 | 13,680,000 | 13.60 | 20.80 | 115 | E, R, W, R |
| Nysa | 123,440,000 | 43,790,000–72,550,000 | 13.30 | 20.77 | 59 | F, N, S, E |
| Dobczyce | 141,740,000 | 25,740,000 | 31.00 | 9.64 | 146 | S, F, E |
| Rożnów | 159,290,000 | 0–50,000,000 | 31.50 | 16.00 | 31 | E, F, R |
| Goczałkowice | 161,250,000 | 43,180,000 | 14.00 | 32.00 | 80 | S, F, W |
| Jeziorsko | 202,800,000 | 81,300,000 | 11.50 | 36.65 | 56 | F, E, W |
| Czorsztyn | 231,900,000 | 63,000,000 | 54.50 | 12.26 | 116 | F, E, R |
| Włocławek | 370,000,000 | none | 12.70 | 75.00 | 4,5 | E, N, R, W |
| Solina | 472,400,000 | 80.00 | 60.00 | 22.00 | 299 | F, E, R |
* F—flood control, R—recreation, S—water supply, W—water storage, E—hydroelectric power generation, N—navigation.
Table 3.
Percentages of particular land use types according to the CORINE classification.
| Reservoir | 1.1 | 1.2 | 1.3 | 1.4 | 2.1 | 2.2 | 2.3 | 2.4 | 3.1 | 3.2 | 3.3 | 4.1 | 5.1 |
|---|---|---|---|---|---|---|---|---|---|---|---|---|---|
| Besko total catchment | 0.7 | 0.0 | 0.0 | 0.0 | 9.7 | 0.0 | 16.4 | 2.7 | 69.1 | 0.8 | 0.0 | 0.0 | 0.6 |
| Besko sub-catchment | 5.7 | 0.0 | 0.0 | 0.0 | 49.4 | 0.0 | 9.9 | 10.1 | 8.2 | 5.8 | 0.0 | 0.0 | 11.0 |
| Bukówka total catchment | 5.5 | 0.0 | 0.0 | 0.0 | 23.1 | 0.0 | 15.1 | 7.4 | 44.2 | 2.4 | 0.0 | 0.0 | 2.2 |
| Bukówka sub-catchment | 3.3 | 0.0 | 0.0 | 0.0 | 43.2 | 0.0 | 14.7 | 8.0 | 14.2 | 0.8 | 0.0 | 0.0 | 15.7 |
| Czorsztyn total catchment | 7.1 | 0.1 | 0.0 | 0.3 | 14.1 | 0.0 | 22.4 | 7.1 | 32.1 | 11.3 | 3.8 | 0.6 | 1.0 |
| Czorsztyn sub-catchment | 2.1 | 0.1 | 0.0 | 0.0 | 23.5 | 0.0 | 8.7 | 7.3 | 24.9 | 0.0 | 0.0 | 0.0 | 33.4 |
| Dobczyce total catchment | 6.7 | 0.2 | 0.2 | 0.0 | 19.6 | 0.0 | 8.4 | 15.8 | 47.1 | 0.7 | 0.0 | 0.0 | 1.3 |
| Dobczyce sub-catchment | 9.7 | 0.1 | 0.0 | 0.0 | 17.8 | 0.0 | 0.7 | 27.6 | 14.6 | 2.6 | 0.0 | 0.0 | 27.0 |
| Goczałkowice total catchment | 13.0 | 0.7 | 0.0 | 0.3 | 21.1 | 0.0 | 3.3 | 12.7 | 38.1 | 2.9 | 0.0 | 0.4 | 7.5 |
| Goczałkowice sub-catchment | 10.2 | 1.0 | 0.0 | 0.0 | 29.3 | 0.0 | 1.2 | 3.1 | 13.3 | 0.5 | 0.0 | 2.7 | 38.6 |
| Jeziorsko total catchment | 6.2 | 0.7 | 1.1 | 0.1 | 40.4 | 0.1 | 11.2 | 8.5 | 28.5 | 2.4 | 0.0 | 0.1 | 0.7 |
| Jeziorsko sub-catchment | 3.1 | 0.0 | 0.0 | 0.7 | 35.1 | 0.0 | 2.6 | 4.3 | 1.6 | 0.1 | 0.0 | 5.5 | 47.1 |
| Klimkówka total catchment | 0.9 | 0.0 | 0.0 | 0.0 | 3.2 | 0.0 | 20.8 | 5.2 | 68.3 | 0.4 | 0.0 | 0.0 | 1.3 |
| Klimkówka sub-catchment | 2.0 | 0.0 | 0.0 | 0.0 | 0.0 | 0.0 | 9.4 | 11.9 | 58.6 | 4.2 | 0.0 | 0.0 | 13.9 |
| Kozłowa Góra total catchment | 5.2 | 4.6 | 0.9 | 0.4 | 23.0 | 13.1 | 0.0 | 2.7 | 46.2 | 1.4 | 0.0 | 0.0 | 2.5 |
| Kozłowa Góra sub-catchment | 9.3 | 1.9 | 0.0 | 0.0 | 27.1 | 0.0 | 20.7 | 0.6 | 24.4 | 0.0 | 0.0 | 0.0 | 16.0 |
| Mietków total catchment | 8.4 | 0.8 | 0.2 | 0.8 | 51.3 | 0.0 | 3.1 | 6.3 | 26.9 | 0.8 | 0.0 | 0.0 | 1.3 |
| Mietków sub-catchment | 3.1 | 0.5 | 0.0 | 0.0 | 45.8 | 0.0 | 0.0 | 2.9 | 2.5 | 0.0 | 0.0 | 0.0 | 45.2 |
| Nysa total catchment | 4.8 | 0.3 | 0.2 | 0.3 | 35.7 | 0.0 | 9.3 | 7.9 | 36.8 | 3.3 | 0.0 | 0.1 | 1.2 |
| Nysa sub-catchment | 6.1 | 1.5 | 0.9 | 0.0 | 45.0 | 0.0 | 7.1 | 1.0 | 4.6 | 0.0 | 0.0 | 1.6 | 32.1 |
| Pilchowice total catchment | 9.2 | 0.3 | 0.3 | 0.7 | 23.5 | 12.9 | 0.0 | 7.7 | 40.0 | 4.5 | 0.2 | 0.0 | 0.6 |
| Pilchowice sub-catchment | 2.2 | 0.0 | 0.0 | 0.0 | 39.6 | 0.0 | 0.0 | 7.4 | 38.1 | 0.7 | 0.0 | 0.0 | 12.0 |
| Porąbka total catchment | 8.0 | 0.7 | 0.0 | 0.2 | 11.7 | 0.0 | 9.7 | 9.1 | 49.7 | 9.8 | 0.0 | 0.0 | 1.2 |
| Porąbka sub-catchment | 13.2 | 0.0 | 0.0 | 1.8 | 0.0 | 0.0 | 4.9 | 9.6 | 43.4 | 0.0 | 0.0 | 0.0 | 27.1 |
| Rożnów total catchment | 4.9 | 0.4 | 0.1 | 0.3 | 17.0 | 0.5 | 12.4 | 11.5 | 45.6 | 4.3 | 1.9 | 0.2 | 0.8 |
| Rożnów sub-catchment | 3.6 | 0.0 | 0.0 | 0.0 | 15.2 | 3.4 | 1.4 | 20.2 | 28.9 | 0.0 | 0.0 | 0.0 | 27.2 |
| Rybnik total catchment | 18.2 | 4.4 | 0.1 | 1.2 | 18.1 | 0.0 | 0.0 | 7.4 | 46.6 | 0.7 | 0.0 | 0.0 | 3.3 |
| Rybnik sub-catchment | 20.8 | 12.1 | 0.0 | 3.2 | 6.4 | 0.0 | 7.7 | 2.5 | 11.5 | 0.0 | 0.0 | 0.0 | 35.7 |
| Solina total catchment | 0.7 | 0.0 | 0.0 | 0.2 | 1.1 | 0.0 | 9.5 | 2.2 | 80.0 | 4.1 | 0.0 | 0.0 | 2.1 |
| Solina sub-catchment | 1.1 | 0.0 | 0.0 | 2.9 | 6.4 | 0.0 | 2.8 | 2.4 | 62.4 | 0.4 | 0.0 | 0.0 | 21.6 |
| Sulejów total catchment | 4.2 | 0.1 | 0.0 | 0.1 | 35.9 | 0.0 | 11.3 | 7.1 | 36.8 | 3.3 | 0.0 | 0.2 | 0.9 |
| Sulejów sub-catchment | 4.2 | 0.0 | 0.3 | 0.3 | 19.3 | 0.0 | 2.3 | 7.0 | 45.6 | 2.1 | 0.3 | 1.9 | 16.8 |
| Tresna total catchment | 8.5 | 0.8 | 0.0 | 0.2 | 12.7 | 0.0 | 10.4 | 5.2 | 50.5 | 10.7 | 0.0 | 0.0 | 0.9 |
| Tresna sub-catchment | 21.1 | 8.6 | 0.0 | 0.0 | 11.4 | 0.0 | 3.0 | 9.1 | 10.1 | 0.0 | 0.0 | 0.0 | 36.8 |
| Turawa total catchment | 4.9 | 0.8 | 0.1 | 0.2 | 23.5 | 0.0 | 5.1 | 3.8 | 58.9 | 1.1 | 0.0 | 0.1 | 1.5 |
| Turawa sub-catchment | 2.6 | 0.0 | 0.0 | 2.7 | 8.7 | 0.0 | 8.0 | 1.4 | 43.0 | 1.7 | 0.0 | 0.5 | 31.4 |
| Włocławek total catchment | 5.6 | 0.6 | 0.2 | 0.2 | 39.6 | 1.1 | 10.9 | 8.3 | 29.8 | 2.1 | 0.1 | 0.4 | 1.2 |
| Włocławek sub-catchment | 4.6 | 0.6 | 0.0 | 0.2 | 24.1 | 0.0 | 5.4 | 7.8 | 26.1 | 2.3 | 0.5 | 0.0 | 28.5 |
| Zegrze total catchment | 3.5 | 0.3 | 0.1 | 0.1 | 39.1 | 0.1 | 15.4 | 6.5 | 30.4 | 1.7 | 0.0 | 1.1 | 1.6 |
| Zegrze sub-catchment | 6.3 | 0.6 | 0.2 | 2.2 | 28.6 | 0.0 | 6.8 | 12.3 | 30.4 | 0.9 | 0.0 | 0.0 | 11.6 |
Table 4.
Spearman correlation coefficient values for total catchments describing the relation between parameters of reservoir water quality and the type of CORINE Land Cover.
Table 4.
Spearman correlation coefficient values for total catchments describing the relation between parameters of reservoir water quality and the type of CORINE Land Cover.
| Water Quality Parameters | Artificial Surfaces | Agricultural Areas | Forest and Semi-Natural Areas | Wetlands | Water Bodies |
|---|---|---|---|---|---|
| TP | 0.36412 | 0.36110 | −0.57218 * | 0.42127 | 0.19224 |
| TN | 0.37759 | 0.18052 | −0.24295 | −0.01969 | 0.06995 |
| TP (R) | 0.36104 | 0.37082 | −0.47762 * | 0.35522 | 0.27529 |
| TN (R) | 0.38210 | 0.24671 | −0.27755 | −0.02130 | 0.09703 |
* statistically significant at p < 0.05. TP—Total phosphorus, TN—Total nitrogen, TP (R)—variability Total phosphorus, TN (R)—variability Total nitrogen.
Table 5.
Spearman correlation coefficient values for sub-catchments describing the relation between parameters of reservoir water quality and the type of CORINE Land Cover.
Table 5.
Spearman correlation coefficient values for sub-catchments describing the relation between parameters of reservoir water quality and the type of CORINE Land Cover.
| Water Quality Parameters | Artificial Surfaces | Agricultural Areas | Forest and Semi-Natural Areas | Wetlands | Water Bodies |
|---|---|---|---|---|---|
| TP | 0.30833 | −0.06182 | 0.01282 | 0.21599 | 0.09046 |
| TN | 0.31215 | 0.03761 | −0.19030 | 0.25900 | 0.14742 |
| TP (R) | 0.50320 * | −0.02256 | −0.13689 | 0.38157 | 0.29033 |
| TN (R) | 0.48214 * | 0.16698 | −0.36029 | 0.25900 | 0.22715 |
* statistically significant at p < 0.055. TP—Total phosphorus, TN—Total nitrogen, TP (R)—variability Total phosphorus, TN (R)—variability Total nitrogen
Table 6.
Matrix of relationships between the main types of sub-catchment area use and total nitrogen (TN) content in reservoir waters.
Table 6.
Matrix of relationships between the main types of sub-catchment area use and total nitrogen (TN) content in reservoir waters.
| TN mg N/L | Artificial Surfaces 0.0–5.0% | Artificial Surfaces 5.1–10% | Artificial Surfaces 10.1–20% | Artificial Surfaces 20.1–30.0% | Artificial Surfaces >30.1% | Agricultural Areas 10.0–20.0% | Agricultural Areas 20.1–30.0% | Agricultural Areas 30.1–40.0% | Agricultural Areas 40.1–50.0% | Agricultural Areas 50.1–60.0% | Agricultural areas >60.0% |
|---|---|---|---|---|---|---|---|---|---|---|---|
| 0.50–1.00 R < 1.0 | Solina | Besko | Solina | Czorsztyn | Besko | ||||||
| Czorsztyn | |||||||||||
| 0.50–1.00 R > 1.0 | Włocławek | Porąbka | Porąbka | Włocławek | |||||||
| 1.01–1.50 R < 1.0 | Rożnów | Klimkówka | Rożnów | Bukówka | |||||||
| Klimkówka | |||||||||||
| Bukówka | |||||||||||
| 1.01–1.50 R > 1.0 | Goczałkowice | Goczałkowice | |||||||||
| 1.01–1.50 R > 2.0 | Dobczyce | Tresna | Tresna | Dobczyce | |||||||
| 1.51–2.0 R < 1 | |||||||||||
| 1.51–2.0 R > 1 | Nysa | Nysa | |||||||||
| 1.51–2.0 R > 2 | Jeziorsko | Kozłowa Góra | Jeziorsko | ||||||||
| Kozłowa Góra | |||||||||||
| 2.01–2.50 R > 1 | |||||||||||
| 2.01–2.50 R < 1.9 | Sulejów | Rybnik | Rybnik | Sulejów | |||||||
| 2.01–2.50 R > 2.0 | |||||||||||
| 2.51–3.00 R < 1.0 | |||||||||||
| 2.51–3.00 R < 2.0 | Pilchowice | Pilchowice | |||||||||
| 2.51–3.00 R > 2.0 | Mietków | Zegrze | Turawa | Mietków | |||||||
| Turawa | Zegrze |
Table 7.
Matrix of relationships between the main types of sub-catchment land use and total phosphorus (TP) content in reservoir waters.
Table 7.
Matrix of relationships between the main types of sub-catchment land use and total phosphorus (TP) content in reservoir waters.
| TP mg P/L | Forest and Semi-Natural Areas 0.0–10.0% | Forest and Semi-Natural Areas 10.1–20.0% | Forest and Semi-Natural Areas 20.1–30.0% | Forest and Semi-Natural Areas 30.1–40.0% | Forest and Semi-Natural Areas 40.1–60.0% | Forest and Semi-Natural Areas >60.0% | Wetlands 0.0–0.5% | Wetlands 0.6–1.0% | Wetlands 1.1–2.0% | Wetlands 2.1–5.0% | Wetlands >5.0% |
|---|---|---|---|---|---|---|---|---|---|---|---|
| 0.01–0.02 R < 0.010 | Besko | Solina | Solina | ||||||||
| Besko | |||||||||||
| 0.01–0.02 R > 0.011 | Dobczyce | Klimkówka | Klimkówka | ||||||||
| Dobczyce | |||||||||||
| 0.021–0.03 R < 0.020 | Bukówka | Bukówka | |||||||||
| 0.021–0.03 R > 0.021 | Jeziorsko | Czorsztyn | Rożnów | Tresna | Czorsztyn Rożnów Tresna | Jeziorsko | |||||
| 0.031–0.04 R < 0.020 | |||||||||||
| 0.031–0.04 R > 0.021 | Mietków | Goczałkowice | Kozłowa Góra | Porąbka | Mietków Kozłowa Góra Porąbka | Goczałkowice | |||||
| 0.041–0.05 R < 0.020 | |||||||||||
| 0.041–0.05 R > 0.021 | |||||||||||
| 0.051–0.09 R < 0.020 | |||||||||||
| 0.051–0.09 R > 0.021 | Nysa | Pilchowice | Sulejów Turawa | Pilchowice Turawa | Sulejów | ||||||
| Nysa | |||||||||||
| >0.091 R < 0.109 | |||||||||||
| >0.091 R > 0.110 | Rybnik | Włocławek | Zegrze | Zegrze Włocławek Rybnik |
Table 8.
Matrix of relationships between the main types of total catchment area use and total nitrogen (TN) content in reservoir waters.
Table 8.
Matrix of relationships between the main types of total catchment area use and total nitrogen (TN) content in reservoir waters.
| TN mg N/L | Forest and Semi-Natural Areas 0.0–10.0% | Forest and Semi-Natural Areas 10.1–20.0% | Forest and Semi-Natural Areas 20.1–30.0% | Forest and Semi-Natural Areas 30.1–40.0% | Forest and Semi-Natural Areas 40.1–60.0% | Forest and Semi-Natural Areas >60.0% | Wetlands 0.0–0.5% | Wetlands 0.6–1.0% | Wetlands 1.1–2.0% | Wetlands 2.1–5.0% | Wetlands >5.0% |
|---|---|---|---|---|---|---|---|---|---|---|---|
| 0.50–1.00 R < 1.0 | Czorsztyn | Solina | Solina | Czorsztyn | |||||||
| Bukówka | Bukówka | ||||||||||
| 0.50–1.00 R > 1.0 | Włocławek | Besko | Besko | ||||||||
| 1.01–1.50 R < 1.0 | Porąbka Rożnów | Klimkówka | Porąbka | ||||||||
| Rożnów | |||||||||||
| Klimkówka | |||||||||||
| 1.01–1.50 R > 1.0 | Goczałkowice | Goczałkowice | |||||||||
| 1.01–1.50 R > 2.0 | Dobczyce | Dobczyce | |||||||||
| 1.51–2.0 R < 1 | |||||||||||
| 1.51–2.0 R > 1 | Nysa | Nysa | |||||||||
| 1.51–2.0 R > 2 | Jeziorsko | Kozłowa Góra | Jeziorsko Kozłowa Góra | ||||||||
| 2.01–2.50 R > 1 | |||||||||||
| 2.01–2.50 R < 1.9 | Rybnik | Rybnik | |||||||||
| 2.01–2.50 R > 2.0 | Sulejów | Sulejów | |||||||||
| 2.51–3.00 R < 1.0 | |||||||||||
| 2.51–3.00 R < 2.0 | Pilchowice | Pilchowice | |||||||||
| 2.51–3.00 R > 2.0 | Mietków | Zegrze | Turawa | Tresna | Mietków | Zegrze |
Table 9.
Matrix of relationships between the main types of total catchment area use and total phosphorus (TP) content in reservoir waters.
Table 9.
Matrix of relationships between the main types of total catchment area use and total phosphorus (TP) content in reservoir waters.
| TP mg P/L | Forest and Semi-Natural Areas 0.0–10.0% | Forest and Semi-Natural Areas 10.1–20.0% | Forest and Semi-Natural Areas 20.1–30.0% | Forest and Semi-Natural Areas 30.1–40.0% | Forest and Semi-Natural Areas 40.1–60.0% | Forest and Semi-Natural Areas >60.0% | Wetlands 0.0–0.5% | Wetlands 0.6–1.0% | Wetlands 1.1–2.0% | Wetlands 2.1–5.0% | Wetlands >5.0% |
|---|---|---|---|---|---|---|---|---|---|---|---|
| 0.01–0.02 R < 0.010 | Solina | Solina | |||||||||
| Besko | Besko | ||||||||||
| 0.01–0.02 R > 0.011 | Dobczyce | Klimkówka | Klimkówka Dobczyce | ||||||||
| 0.021–0.03 R < 0.020 | Bukówka | Bukówka | |||||||||
| 0.021–0.03 R > 0.021 | Jeziorsko | Czorsztyn Rożnów | Tresna | Jeziorsko Tresna | Czorsztyn Rożnów | ||||||
| 0.031–0.04 R < 0.020 | |||||||||||
| 0.031–0.04 R > 0.021 | Mietków | Goczałkowice | Mietków | ||||||||
| Goczałkowice | |||||||||||
| Kozłowa Góra | Kozłowa Góra | ||||||||||
| Porąbka | Porąbka | ||||||||||
| 0.041–0.05 R < 0.020 | |||||||||||
| 0.041–0.05 R > 0.021 | |||||||||||
| 0.051–0.09 R < 0.020 | |||||||||||
| 0.051–0.09 R > 0.021 | Sulejów | Pilchowice | Sulejów | ||||||||
| Turawa | Pilchowice | ||||||||||
| Nysa | Turawa | ||||||||||
| Nysa | |||||||||||
| >0.091 R < 0.109 | |||||||||||
| >0.091 R > 0.110 | Zegrze | Rybnik | Rybnik | Zegrze | |||||||
| Włocławek | Włocławek |
Table 10.
Matrix of relationships between the main types of sub-catchment land use and total phosphorus (TP) content in reservoir waters.
Table 10.
Matrix of relationships between the main types of sub-catchment land use and total phosphorus (TP) content in reservoir waters.
| TP mg P/L | Artificial Surfaces 0.0–5.0% | Artificial Surfaces 5.1–10% | Artificial Surfaces 10.1–20% | Artificial Surfaces 20.1–30.0% | Artificial Surfaces >30.1% | Agricultural Areas 10.0–20.0% | Agricultural Areas 0.1–30.0% | Agricultural Areas 30.1–40.0% | Agricultural Areas 40.1–50.0% | Agricultural Areas 50.1–60.0% | Agricultural Areas >60.0% |
|---|---|---|---|---|---|---|---|---|---|---|---|
| 0.01–0.02 R < 0.010 | Solina | Besko | Solina | Besko | |||||||
| 0.01–0.02 R > 0.011 | Klimkówka | Dobczyce | Klimkówka | Dobczyce | |||||||
| 0.021–0.03 R < 0.020 | Bukówka | Bukówka | |||||||||
| 0.021–0.03 R > 0.021 | Czorsztyn | Tresna | Tresna | Czorsztyn | Jeziorsko Rożnów | ||||||
| Rożnów | |||||||||||
| Jeziorsko | |||||||||||
| 0.031-0.04 R<0.020 | |||||||||||
| 0.031–0.04 R > 0.021 | Mietków | Kozłowa Góra | Porąbka | Mietków | |||||||
| Porąbka | Kozłowa Góra | ||||||||||
| 0.041–0.05 R < 0.020 | Goczałkowice | Goczałkowice | |||||||||
| 0.041–0.05 R > 0.021 | |||||||||||
| 0.051–0.09 R < 0.020 | |||||||||||
| 0.051–0.09 R > 0.021 | Turawa | Nysa | Turawa | Sulejów | Pilchowice | Nysa | |||||
| Sulejów | |||||||||||
| Pilchowice | |||||||||||
| > 0.091 R < 0.109 | Rybnik | Rybnik | |||||||||
| > 0.091 R > 0.110 | Włocławek | Zegrze | Włocławek | Zegrze |
Table 11.
Matrix of relationships between the main types of total catchment area use and total phosphorus (TP) content in reservoir waters.
Table 11.
Matrix of relationships between the main types of total catchment area use and total phosphorus (TP) content in reservoir waters.
| TP mg P/L | Artificial Surfaces 0.0–5.0% | Artificial Surfaces 5.1–10% | Artificial Surfaces 10.1–20% | Artificial Surfaces 20.1–30.0% | Artificial Surfaces >30.1% | Agricultural Areas 10.0–20.0% | Agricultural Areas 20.1–30.0% | Agricultural Areas 30.1–40.0% | Agricultural Areas 40.1–50.0% | Agricultural Areas 50.1–60.0% | Agricultural Areas >60.0% |
|---|---|---|---|---|---|---|---|---|---|---|---|
| 0.01–0.02 R < 0.010 | Solina | Solina | Besko | ||||||||
| Besko | |||||||||||
| 0.01–0.02 R > 0.011 | Klimkówka | Dobczyce | Klimkówka | Dobczyce | |||||||
| 0.021–0.03 R < 0.020 | |||||||||||
| 0.021– 0.03 R > 0.021 | Czorsztyn | Czorsztyn | |||||||||
| Rożnów | Rożnów | ||||||||||
| Jeziorsko | Jeziorsko | ||||||||||
| 0.031–0.04 R < 0.020 | Bukówka | Bukówka | |||||||||
| 0.031–0.04 R > 0.021 | Tresna | Tresna | Mietków | ||||||||
| Mietków | |||||||||||
| 0.041–0.05 R < 0.020 | |||||||||||
| 0.041–0.05 R > 0.021 | Kozłowa Góra | Goczałkowice | Porąbka | Kozłowa Góra | |||||||
| Porąbka | Goczałkowice | ||||||||||
| 0.051–0.09 R < 0.020 | Sulejów | ||||||||||
| 0.051–0.09 R > 0.021 | Sulejów | Turawa | Pilchowice | Turawa | Pilchowice | Nysa | |||||
| Nysa | |||||||||||
| > 0.091 R < 0.109 | |||||||||||
| > 0.091 R > 0.110 | Zegrze | Włocławek | Rybnik | Rybnik | Włocławek | Zegrze |
Table 12.
Matrix of relationships between the main types of sub-catchment area use and total nitrogen (TN) content in reservoir waters.
Table 12.
Matrix of relationships between the main types of sub-catchment area use and total nitrogen (TN) content in reservoir waters.
| TN mg N/L | Forest and Semi-Natural Areas 0.0–10.0% | Forest and Semi-Natural Areas 10.1–20.0% | Forest and Semi-Natural Areas 20.1–30.0% | Forest and Semi-Natural Areas 30.1–40.0% | Forest and Semi-Natural Areas 40.1–60.0% | Forest and Semi-Natural Areas >60% | Wetlands 0.0–0.5% | Wetlands 0.6–1.0% | Wetlands 1.1–2.0% | Wetlands 2.1–5.0% | Wetlands >5.0% |
|---|---|---|---|---|---|---|---|---|---|---|---|
| 0.50–1.00 R < 1.0 | Czorsztyn | Solina | Czorsztyn | ||||||||
| Solina | |||||||||||
| 0.50–1.00 R > 1.0 | Besko | Włocławek | Besko | ||||||||
| Włocławek | |||||||||||
| 1.01–1.50 R < 1.0 | Bukówka | Rożnów | Porąbka | Klimkówka | Rożnów | ||||||
| Bukówka | |||||||||||
| Porąbka | |||||||||||
| Klimkówka | |||||||||||
| 1.01–1.50 R > 1.0 | Nysa | Goczałkowice | Nysa | Goczałkowice | |||||||
| 1.01–1.50 R > 2.0 | Dobczyce | ||||||||||
| 1.51–2.0 R < 1 | |||||||||||
| 1.51–2.0 R > 1 | |||||||||||
| 1.51–2.0 R > 2 | Jeziorsko | Kozłowa Góra | Kozłowa Góra | Jeziorsko | |||||||
| 2.01–2.50 R > 1 | |||||||||||
| 2.01–2.50 R < 1.9 | Rybnik | Rybnik | |||||||||
| 2.01–2.50 R > 2.0 | Sulejów | Sulejów | |||||||||
| 2.51–3.00 R < 1.0 | |||||||||||
| 2.51–3.00 R < 2.0 | Pilchowice | Pilchowice | |||||||||
| 2.51–3.00 R > 2.0 | Mietków | Tresna | Zegrze | Turawa | Mietków | Zegrze | |||||
| Tresna | |||||||||||
| Włocławek | Turawa | ||||||||||
| Włocławek |
Table 13.
Matrix of relationships between the main types of total catchment area use and total nitrogen (TN) content in reservoir waters.
Table 13.
Matrix of relationships between the main types of total catchment area use and total nitrogen (TN) content in reservoir waters.
| TN mg N/L | Artificial Surfaces 0.0–5.0% | Artificial Surfaces 5.1–10% | Artificial Surfaces 10.1–20% | Artificial Surfaces 20.1–30.0% | Artificial Surfaces >30.1% | Agricultural Areas 10.0–20.0% | Agricultural Areas 20.1–30.0% | Agricultural Areas 30.1–40.0% | Agricultural Areas 40.1–50.0% | Agricultural Areas 50.1–60.0% | Agricultural Areas >60.0% |
|---|---|---|---|---|---|---|---|---|---|---|---|
| 0.50–1.00 R <1.0 | Besko | Czorsztyn | Besko | Czorsztyn | |||||||
| 0.50–1.00 R > 1.0 | |||||||||||
| 1.01–1.50 R < 1.0 | Klimkówka | Rożnów | Klimkówka | Rożnów | |||||||
| Bukówka | |||||||||||
| Porąbka | Porąbka | Bukówka | |||||||||
| 1.01–1.50 R > 1.0 | Goczałkowice | Goczałkowice | |||||||||
| 1.01–1.50 R > 2.0 | Dobczyce | Tresna | Dobczyce | ||||||||
| Tresna | |||||||||||
| 1.51–2.0 R < 1 | Nysa | Nysa | |||||||||
| 1.51–2.0 R > 1 | |||||||||||
| 1.51–2.0 R > 2 | Jeziorsko | Kozłowa Góra | Kozłowa Góra | Jeziorsko | |||||||
| 2.01–2.50 R > 1 | |||||||||||
| 2.01–2.50 R < 1.9 | Sulejów | Rybnik | Rybnik | Sulejów | |||||||
| 2.01–2.50 R > 2.0 | |||||||||||
| 2.51–3.00 R < 1.0 | |||||||||||
| 2.51–3.00 R < 2.0 | Pilchowice | Pilchowice | |||||||||
| 2.51–3.00 R > 2.0 | Mietków | Turawa | Mietków | ||||||||
| Zegrze | |||||||||||
| Turawa | Zegrze |
© 2020 by the authors. Licensee MDPI, Basel, Switzerland. This article is an open access article distributed under the terms and conditions of the Creative Commons Attribution (CC BY) license (http://creativecommons.org/licenses/by/4.0/).
Share and Cite
MDPI and ACS Style
Matysik, M.; Absalon, D.; Habel, M.; Maerker, M. Surface Water Quality Analysis Using CORINE Data: An Application to Assess Reservoirs in Poland. Remote Sens. 2020, 12, 979. https://doi.org/10.3390/rs12060979
AMA Style
Matysik M, Absalon D, Habel M, Maerker M. Surface Water Quality Analysis Using CORINE Data: An Application to Assess Reservoirs in Poland. Remote Sensing. 2020; 12(6):979. https://doi.org/10.3390/rs12060979
Chicago/Turabian StyleMatysik, Magdalena, Damian Absalon, Michał Habel, and Michael Maerker. 2020. "Surface Water Quality Analysis Using CORINE Data: An Application to Assess Reservoirs in Poland" Remote Sensing 12, no. 6: 979. https://doi.org/10.3390/rs12060979
Note that from the first issue of 2016, this journal uses article numbers instead of page numbers. See further details here.