

Abstract
El Niño events generate periods of relatively low precipitation, low cloud cover and high temperature over the rainforests of Southeast Asia, but their impact on tree physiology remains poorly understood. Here we use remote sensing and functional trait approaches—commonly used to understand plant acclimation to environmental fluctuations—to evaluate rainforest responses to an El Niño event at a site in northern Borneo. Spaceborne measurements (i.e. normalised difference vegetation index calculated from Moderate Resolution Imaging Spectroradiometer data) show the rainforest canopy greened throughout 2015, coinciding with a strengthening of the El Niño event in Sabah, Malaysia, then lost greenness in early 2016, when the El Niño was at its peak. Leaf chemical and structural traits measured for mature leaves of 65 species (104 branches from 99 tree canopies), during and after this El Niño event revealed that chlorophyll and carotenoid concentrations were 35% higher in mid 2015 than in mid 2016. Foliar concentrations of the nutrients N, P, K and Mg did not vary, suggesting the mineralisation and transportation processes were unaffected by the El Niño event. Leaves contained more phenolics, tannins and cellulose but less Ca and lignin during the El Niño event, with concentration shifts varying strongly among species. These changes in functional traits were also apparent in hyperspectral reflectance data collected using a field spectrometer, particularly in the shortwave infrared region. Leaf-level acclimation and leaf turnover could have driven the trait changes observed. We argue that trees were not water limited in the initial phase of the El Niño event, and responded by flushing new leaves, seen in the canopy greening trend and higher pigment concentrations (associated with young leaves); we argue that high evaporative demand and depleted soil water eventually caused leaves to drop in 2016. However, further studies are needed to confirm these ideas. Time-series of vegetation dynamics obtained from space can only be understood if changes in functional traits, as well as the quantity of leaves in canopies, are monitored on the ground.
Export citation and abstract BibTeX RIS

Original content from this work may be used under the terms of the Creative Commons Attribution 3.0 licence. Any further distribution of this work must maintain attribution to the author(s) and the title of the work, journal citation and DOI.
Introduction
El Niño events bring periods of low rainfall and reduced cloud cover to tropical rainforests that are typically supplied with plentiful water (Lopes et al 2016), but the responses of tropical rain forests to these events remain poorly understood. The Southern Oscillations responsible for El Niño events have occurred for at least 130 000 years (Tudhop et al 2001) suggesting ample opportunity for natural selection to enhance the capability of trees to tolerate irregular drought events (Harrison 2000, Detto et al 2018). However, climate change is increasing the severity and frequency of El Niño events (Breshears et al 2005, Allen et al 2010, Thirumalai et al 2017, Wang et al 2017, Freund et al 2019); and higher than average temperatures recorded across Southeast Asia in 2015 and early 2016 were attributed to a climate-change amplified El Niño event (Thirumalai et al 2017, Susskind et al 2019). Higher temperatures increase evaporative demand and therefore exacerbate the severity of drought events (Adams et al 2009). Recent research has demonstrated a variety of biotic responses to El Niño-induced droughts (e.g. O'Brien et al 2017, Qie et al 2017, Detto et al 2018, Santos et al 2018). While there is evidence of increased mortality in the Amazon (Phillips et al 2009, Doughty et al 2015), West African forests appear more resilient due to a gradual shift in species composition toward drought-tolerant species (Fauset et al 2012). There is also evidence of greening of tropical tree canopies during dry periods in the Amazon based on optical remote sensing (Saleska et al 2007). One explanation for this greening is that trees continue to access water through deep root systems (Huete et al 2006) and acclimatise to greater direct solar irradiance (i.e. reduced cloud cover) by up-regulating photosynthetic and protective pigments (Saleska et al 2007, Saleska et al 2016). An alternative explanation is that greening during dry periods is related to the flush of new leaves (Lopes et al 2016, Wu et al 2016, Wagner et al 2017). However, interpretation of remotely sensed data is challenging and there is continued debate over tropical forest responses to variability in temperature, irradiance and precipitation (Samanta et al 2010, Morton et al 2014, Bi et al 2015).
Plant functional traits provide a way of predicting tropical forest responses to short- and long-term climate changes in terms of physiological mechanisms (Reich 2012, Reich 2014, Doughty et al 2018). Traits help explain differences in growth and survival across resource gradients; for example, plant trait diversity might act as an insurance against climate change impacts on Amazon forests biomass, and considering the possible plasticity of traits, fast shifts of functional dominance enhance biomass resilience (Sakschewski et al 2016). Nevertheless, repeated trait measurements on the same plants are infrequent. Recent studies have measured traits over time to investigate leaf aging impacts (Chavana-Bryant et al 2017), but this approach has not been used previously to track traits changes in response to fluctuating environmental conditions such as an El Niño event.
If variation in leaf traits result in changes to leaf spectral reflectance, then these changes should be observable using remote sensing methods. Reflectance signatures are affected by the optical properties of leaves in a range of wavelengths; the visible (400–750 nm) portion of the spectrum is mainly driven by pigments (Sims and Gamon 2002), the near infrared (751–1300 nm) and shortwave infrared (1301–2400 nm) driven by internal and external leaf structure (Slaton et al 2001), including water content (Tucker 1980, Ustin et al 2004), phenolics (Kokaly et al 2009) and organic constituents (Petisco et al 2006, Asner et al 2011). The diversity of leaf reflectance signatures within a community arises from the functional and evolutionary divergence among the constituent species, and may be used to predict ecosystem function (Schweiger et al 2018). Remote sensing studies using Moderate Resolution Imaging Spectroradiometer (MODIS) satellite spectroscopy have reported positive impacts of dry seasons on EVI—an enhanced vegetation index which is a combination of chlorophyll content and leaf area that does not saturate in dense forests—indicating a 'greening up' phenomenon associated with increased irradiance during dry seasons (Huete et al 2006, Saleska et al 2007). However, it remains controversial whether trees are actually investing in photosynthetic apparatus or whether this phenomenon is an artefact of optical sensors (Morton et al 2014). We propose that leaf-level reflectance obtained from proximal sensing using field spectroscopy can provide an accurate method for monitoring short-term climate fluctuations, on the basis that trait variation affects reflectance in different portions of the spectrum that can be captured using field measurements.
This paper presents observations of changing leaf traits in a Bornean tropical forest associated with the 2015/16 E Niño drought, and tests whether those changes can be detected from leaf spectroscopy and in situ sampling. In terms of drought stress, there may be species-specific responses at the leaf level (Maréchaux et al 2015). Changes in leaf functional traits could indicate a combination of leaf physiological and structural responses to drought, but no studies have previously reported such acclimation from repeated measurements in tropical forests. We investigate changes in 17 foliar traits and leaf spectral reflectance in response to the El Niño event to address the following questions: (1) how do foliar traits change with El Niño events? (2) Can responses to El Niño be detected from leaf spectral properties? Leaf samples and field spectroscopy data were acquired in two field campaigns, one during the El Niño event (September 2015) and one after the rains had returned (October 2016). By taking repeated measurements of physico-chemical and spectral properties on the same trees, this is the first study to measure leaf-level responses to an El Niño event, providing a unique perspective on the acclimation response of tropical rain forest trees to short-term climatic variation.
Material and methods
Description of field site and environmental time-series
The study was conducted in a lowland mixed dipterocarp forest (Fox 1972) on clay soils (Wright 1975) in the Danum Valley Conservation Area in the Malaysian state of Sabah, Borneo (Reynolds et al 2011). Data collection was carried out within two 1 ha plots located in an old growth forest (plot coordinates 4.951 °N, 117.796 °E and 4.953 °N, 117.793 °E) characterised by high species richness and tall emergent trees without evidence of logging or recent human disturbance (Riutta et al 2018).
Daily rainfall, temperature and sunshine duration data were systematically recorded at a weather station located at Danum Valley Field Centre, which is located adjacent to the Conservation Area. These data are freely available and can be downloaded from the South-East Asian Rainforest Research Partnership (www.searrp.org/scientists/available-data/) and were used to derive time-series of meteorological variables during the study period. Normalised difference vegetation index (NDVI) time-series were computed from the MODIS Multi-Angle Implementation of Atmospheric Correction Daily Land Surface (MCD19A1) product (Lyapustin et al 2011a, 2011b, 2018). Detailed methods and an overview of environmental conditions before, during and after the 2015/2016 El Niño event in Danum Valley are provided in supplementary information is available online at stacks.iop.org/ERL/14/085005/mmedia.
Leaf litterfall occurs throughout the year in these forests and South-East Asia rainforests. To investigate whether leaf litter was higher during the El Niño, leaf litter was collected from 25 traps, measuring 0.25 m2, placed in the two plots, over collection intervals ranging from 7 to 29 d (Riutta et al 2018). Leaf litter dry mass was divided by the collection interval and multiplied by 30 to get a monthly estimate in MgC h−1. Leaf litter carbon content was assumed to be 50%.
Sampling design and field data collection
Seventeen functional traits were measured on 38 sunlit and 66 shaded branches (104 branches in total) from 99 individual trees ≥ 10 cm diameter at breast height, representing 65 species from 44 genera in 24 families and tree height ranging from 2.3 to 73.7 m. The first measurements were conducted in September 2015, during a dry period, and the second measurements were taken a year later, after the rains had returned (figure 1(b)). The sampling design, analysis of leaf biochemistry and extraction of other traits were carried out in accordance with previous trait campaigns, as described by Both et al (2019) and more fully described in the SI.

Figure 1. (a) Oceanic Niño Index based upon ocean surface temperature anomalies (Source: NOAA); (b) running 30 d precipitation (mm) recorded at Danum Valley Field Centre in Malaysian Borneo; (c) Hargreaves potential evapotranspiration (mm) computed from recorded temperature data. Grey points represent recorded or computed daily values in a month, solid black line represent cubic smoothing spline, and dashed red lines represent the date of trait collection during and after the 2015/2016 El Niño event.
Download figure:
Standard image High-resolution imageAnalyses were performed within the R statistics framework (R Core Team 2018). We conducted analyses that considered the hierarchical structure of the data, and analyses focussing on species-level responses. First, to examine the influence of El Niño at the canopy level, we fitted linear mixed effects model to the change of each trait using the lme4 package in R, with species identity as a random effect (i.e. a grouping variable allowing 'paired comparisons' to be made; Messier et al 2010). Secondly, to evaluate the relative influence of the drought, shading and taxonomic level on each trait, we developed hierarchical models using the lme4 package in R. We included the phylogenetic levels of family, genus nested within family, species nested within genus, and branch type (shaded or sunlit) nested within species, as well as a temporal effect. All effects were treated as random. In each model, the response variable (y) is any chemical trait for each canopy sample. The total variance of the mean for a given trait was quantitatively separated into variance explained by each taxonomic level, El Niño and unexplained variance was treated as a residual comprised of micro-environment, sample selection and measurement errors associated with laboratory analyses.
Spectroscopy collection
For both surveys, five leaves attached to the branches were selected at random, avoiding damaged and young leaves. Reflectance spectra (350–2500 nm) were acquired using a FieldSpec 4, produced by Analytical Spectral Devices (ASD, Boulder, Colorado, USA). The spectroradiometer's contact probe was mounted on a clamp and firmly pushed down onto the sample against a black background so that no extraneous light was included in the measurement. The spectral measurements were taken at the midpoint between the main vein and the leaf edge, approximately halfway between the petiole and leaf tip, with the abaxial surface pointing towards the probe. The readings were calibrated against a Spectralon white reference panel every five samples. In all statistical analyses, the spectral data were trimmed to the 400–2500 nm range, and the mean reflectance values of the five spectra per branch were used.
Partial least squares regression (PLSR) was initially used to predict leaf traits from spectral reflectance. There is strong autocorrelation in reflectance values, so PLSR involves dimensionality reduction, to produce orthogonal uncorrelated latent vectors containing the maximum explanatory power in relation to the trait data (Wold et al 2001). To avoid overfitting the calibration models, the number of latent variables was chosen according to the 'one standard error' rule that selects the least complex model with the average cross-validated accuracy within one standard error from that in the optimal model (Breiman et al 1984). We determined the contribution of individual ASD wavebands within the visible (VIS; 400–750 nm), near infrared (NIR; 751–1300) and shortwave infrared (SWIR; 1301–2400 nm) to the model performance (Serbin et al 2014, Nunes et al 2017). We also combined two or more spectral regions to evaluate performance. In general, previous research indicates that the SWIR contains absorption features for most traits (Curran 1989, Kokaly et al 2009, Nunes et al 2017), with the visible being useful for pigments (Curran et al 1991, Sims and Gamon 2002), and the NIR for leaf mass per area (LMA; Asner et al 2011). Performance of the final models was evaluated using an 80/20 split of the data for calibration/validation, respectively, over 100 randomised permutations of the dataset. For each such permutation, we tracked the model fit (R2) and the percentage root-mean-square error over the data range (%RMSE). These analyses generated a distribution of model coefficients and fit statistics and allowed for the assessment of model stability as well as uncertainty in predictions. Models were built using the packages caret and vegan in R (www.r-project.org). Additionally, we explored whether the data collected using spectroscopy could be used as a surrogate for the validation data to determine the effect of El Niño on leaf traits. To test this question, we used calculated the variation with 95% confidence intervals for both reference and predicted data.
Results
Time-series of environmental change
Borneo experiences variability in climate due to influences from both the Pacific and Indian Oceans. The National Oceanic and Atmospheric Administration (NOAA) considers El Niño conditions to be present when the Oceanic Niño Index is +0.5 or higher. The strong El Niño of 2015–16 (figure 1(a)) coincided with a period of higher diurnal range in surface air temperatures across the island, peaking during the months November 2015–April 2016 which were on average 0.6°–1.2° higher than average seasonal temperatures (Whitfield et al 2019). Precipitation during 2015 and 2016 varied considerably across the region, but in North-eastern Borneo seasonal total rainfall in May to October 2015 was between 75% and 100% of the 1981–2010 seasonal average, reducing to 50%–75% of normal rainfall for the period November 2015–April 2016, returning to long-term seasonal average amounts for May to October 2016 (typically 900–1000 mm) (Colledge 2017). At Danum Valley Conservation Area itself, mean daily rainfall (mm) in the latter half of 2015 and early 2016 was lower than typically recorded for the site (figure 1(b)), before increasing rapidly in the latter half of 2016. In the months immediately preceding the two surveys (May–August) the average number of days when no rain was recorded was 16 in 2015 and 10 in 2016, whilst the longest run of consecutive days without rain was 10 in 2015, and just 3 in 2016. Coupled with reduced rainfall, an increase in sunshine duration was also recorded at Danum Valley, with mean daily sunshine of 5.9 h in May–August 2015, reducing to 5.4 h for the same months in 2016. Thus, at Danum Valley Conservation Area, the forest experienced a period of relatively low rainfall (figure 1(b)) and high potential evapotranspiration (figure 1(c)) before and during the first survey (September 2015).
Leaf loss was greater in the period running up to the first field campaign and increased again toward the end of the El Nino in April 2016 (figure 2(a)). NDVI values increase in the early El Niño period in 2015 (figure 2(b)), and then a sharp decrease late in the El Niño. By the time of the second field survey, NDVI is similar to the first survey despite evidence of major upheavals in the interim.

Figure 2. (a) Leaf litterfall (MgC ha−1 month−1) and (b) MODIS-derived NDVI time-series (MCD19A1). Grey points represent collected leaf litter from 25 traps in both plot (a) and daily greenness values over 18 pixels (b); solid black line represent cubic smoothing spline, and dashed red lines represent the date of trait collection during and after the 2015/2016 El Niño event.
Download figure:
Standard image High-resolution imageThe influence of the El Niño event on traits
Pigment concentrations, and several other traits, varied between field campaigns that sampled species during and after the 2015/2016 El Niño event (table 1). Pigment concentrations, namely chlorophyll a + b and carotenoids, were about a third higher during the El Niño event than afterwards, when heavy rain and low irradiance conditions had returned (figure 3); the El Niño effect was much stronger than the position of the branch within the canopy, or species identity (figure 4). Phenolic and tannin concentrations were 18% and 16% higher during the El Niño, while δ13 C, cellulose, LMA and water were 9%, 5%, 4% and 3%. higher, respectively. Calcium and lignin were the only leaf traits that increase in concentration after the El Niño by 17% and 13%. The other carbon fractions, including soluble and hemicellulose, as well as N, δ15 N and the rock-derived nutrients P, K and Mg did not change between sampling periods. Correlation analysis (figure S1) indicates that plants with higher LMA have more phenolics and pigments but less water and lower N concentrations.
Table 1. Comparison of foliar trait of 65 species of Bornean rainforest tree, sampled during during and after an El Niño event. Mean traits value (with 95% confidence interval) are given. Mixed effects modelling, with species identity as a grouping variable, was used to assess the statistical significance of trait changes (95% CIs predicted by model; bold indicates significance at P < 0.05), adjusted for multiple comparisons using approach of Benjamini and Hochberg (1995).
| Foliar trait | During El Niño | After El Niño | Change (During–After) | P-value |
|---|---|---|---|---|
| LMA (g cm−2) | 95.8 (91.0–100.7) | 90.4 (86.5–94.3) | 4.03 (1.08–6.98) | 0.010 |
| Water content (%) | 58.8 (57.5–60.2) | 57.2 (55.8–58.7) | 1.62 (0.70–2.54) | 0.001 |
| N (%) | 1.79 (1.70–1.89) | 1.85 (1.76–1.94) | −0.04 (−0.10 to 0.02) | 0.176 |
| δ13 C (‰) | −32.0 (−32.3 to 31.8) | −32.5 (−32.8 to 32.3) | 0.49 (0.28–0.70) | < 0.001 |
| δ15 N (‰) | 1.16 (0.72–1.60) | 0.73 (0.50–0.97) | 0.42 (0.0–0.84) | 0.052 |
| Chl a + b (mg m−2) | 323.2 (307.1–339.5) | 225.1 (206.8–243.3) | 101.5 (81.4–121.6) | < 0.001 |
| Car (mg m−2) | 58.8 (55.5–62.0) | 42.1 (38.6–45.6) | 17.7 (13.7–21.7) | < 0.001 |
| Sol. carbon (%) | 50.2 (48.3–52.0) | 50.2 (48.4–52.1) | 0.17 (−1.12 to 1.46) | 0.790 |
| Phenolics (mg g−1) | 36.2 (32.4–39.9) | 29.7 (26.0–33.3) | 6.5 (3.5–9.5) | < 0.001 |
| Tannin (mg g−1) | 8.5 (7.5–9.6) | 7.3 (6.4–8.2) | 1.32 (0.42–2.22) | 0.005 |
| Hemicellulose (%) | 11.9 (11.2–12.6) | 11.7 (11.1–12.4) | 0.17 (−0.11 to 0.45) | 0.251 |
| Cellulose (%) | 21.3 (20.4–22.1) | 20.0 (19.2–20.8) | 1.03 (0.41–1.65) | 0.001 |
| Lignin (%) | 16.7 (15.5–17.8) | 17.9 (16.7–19.2) | −1.33 (−2.22 to −0.44) | 0.005 |
| P (mg g−1) | 1.33 (1.23–1.42) | 1.28 (1.21–1.35) | 0.02 (−0.06 to 0.10) | 0.555 |
| K (mg g−1) | 10.4 (9.0–11.7) | 9.7 (8.6–10.7) | 0.58 (−0.25 to 1.41) | 0.180 |
| Mg (mg g−1) | 4.5 (3.8–5.1) | 4.4 (3.8–5.0) | 0.05 (−0.19 to 0.29) | 0.652 |
| Ca (mg g−1) | 12.7 (11.2–14.3) | 14.1 (12.6–15.6) | −1.11 (−2.16 to −0.06) | 0.043 |

Figure 3. Percentage differences in the ratio of each canopy chemical trait during and after El-Niño induced droughts. Differences (coloured boxes) were calculated from the species average value and error bars represent relative 95% confidence intervals of the average change. Percentage difference for δ15 N and δ13 C isotopes were calculated as trait change/trait range ratio.
Download figure:
Standard image High-resolution image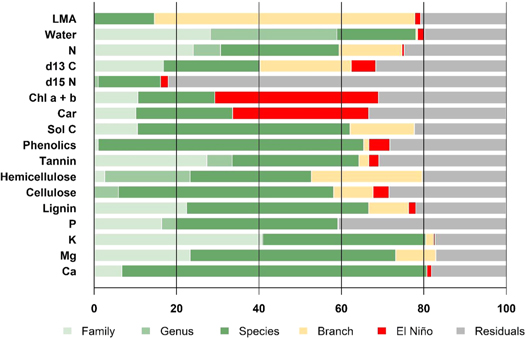
Figure 4. Variance partitioning of functional traits into taxonomic level (family/genus/species), branch (sun exposed versus shaded), the El Niño event (during and after), and unexplained residual components from 104 branches from 99 tree canopies in an old growth forest in Danum Valley Conservation Area, Malaysian Borneo.
Download figure:
Standard image High-resolution imageOrganisation of traits by taxonomy, light exposure and El Niño
Using hierarchical models for variance partitioning to analyse the dataset, we found evidence for strong taxonomy organisation of multiple traits operating independently of variation in climate (figure 4). Our analysis also incorporated branch type (sunlit or shaded branches) to test whether traits were variable within canopies. Residual variation may result from variation in micro-environment, sample selection and analytical error. High trait diversity among coexisting trees is driven by differences between taxa rather than by environmental conditions. Water content, rock-derived nutrient concentrations, lignin, phenolics and tannin were all strongly phylogenetically conserved; species-level differences were usually greater than family- or genus-level differences, although K, water, tannins, N, Mg and lignin had strong family-level effects. Pigments had the highest impact by El Niño and δ15 N was the least taxonomically organised trait with the highest unexplained variation. For most traits, branch type accounted for more variance than the El Niño event, in particular LMA, N, δ13 C and carbon fractions. LMA was conspicuously variable within canopies, indicating the dependence of environmental attributes associated with the vertical canopy profile, and is less affected by short-term climatic variation. Our analysis suggests that sun exposed leaves can have variable responses to El Niño.
Spectral analyses of leaf trait responses to El Niño
Several foliar traits were successfully estimated from leaf spectral reflectance (table 2). Variation in water content, LMA, and concentrations of N, phenolics and cellulose was estimated particularly well, while concentration of P, K, δ13 C and δ15 N were poorly estimated. In general, the highest absolute spectral sensitivity was observed in the SWIR portion between 1301 and 2400 nm, with all traits influencing this spectral region. The visible portion of the spectrum (400–750 nm) was influenced only by chlorophyll a + b, carotenoids and LMA, while the near infrared (751–1300 nm) was influenced only by LMA, phenolics and P.
Table 2. Spectroscopy estimation of leaf chemical and structural properties using leaf spectral reflectance of 104 trees in Malaysian Borneo during and after an El Niño event. NComp is the number of latent components using partial least square regression and the average ± standard deviation of metrics to assess the predictive power. Performance of the final models was evaluated using an 80/20 split of the data for calibration/validation, respectively, over 100 randomized permutations of the dataset. Regions of the spectrum selected for hyperspectral analyses were the visible (VIS; 400–750 nm), near infrared (NIR; 751–1300) and shortwave infrared (SWIR; 1301–2400 nm); different regions were selected for each trait, based on comparisons of the performance of alternative PLSR models.
| Trait | Region | ncomp | R2 | %RMSE |
|---|---|---|---|---|
| LMA(g cm−2) | VIS–NIR–SWIR | 10 | 59.2 ± 9.4 | 14.1 ± 1.4 |
| Water content (%) | SWIR | 5 | 67.3 ± 8.0 | 7.1 ± 0.9 |
| N (%) | SWIR | 16 | 58.8 ± 8.8 | 17.4 ± 2.7 |
| δ13 C (‰) | SWIR | 14 | 32.6 ± 10.7 | 17.1 ± 1.6 |
| δ15 N (‰) | SWIR | 1 | 3.2 ± 3.1 | 7.5 ± 2.5 |
| Chl a + b (mg m−2) | VIS–SWIR | 8 | 40.0 ± 12.5 | 28.4 ± 2.6 |
| Car (mg m−2) | VIS–SWIR | 7 | 41.2 ± 12.7 | 28.3 ± 2.9 |
| Soluble carbon (%) | SWIR | 18 | 38.8 ± 10.8 | 14.2 ± 1.6 |
| Phenolics (mg g−1) | NIR–SWIR | 9 | 53.8 ± 10.1 | 40.3 ± 4.6 |
| Tannin (mg g−1) | SWIR | 11 | 42.9 ± 9.9 | 47.6 ± 4.8 |
| Hemicellulose (%) | SWIR | 12 | 45.1 ± 9.7 | 21.3 ± 2.3 |
| Cellulose (%) | SWIR | 19 | 53.3 ± 10.1 | 15.2 ± 1.7 |
| Lignin (%) | SWIR | 17 | 34.8 ± 11.9 | 30.0 ± 4.3 |
| P (mg g−1) | NIR–SWIR | 10 | 27.7 ± 14.6 | 27.9 ± 6.1 |
| K (mg g−1) | SWIR | 9 | 24.5 ± 10.7 | 50.4 ± 7.0 |
| Mg (mg g−1) | SWIR | 13 | 43.0 ± 11.3 | 57.8 ± 7.6 |
| Ca (mg g−1) | SWIR | 11 | 36.7 ± 9.3 | 47.1 ± 6.6 |
Differences in leaf traits between the two surveys could generally be detected with hyperspectral reflectance data (table 3): changes predicted by PLSR of spectral data are similar to laboratory-measured differences for all traits except water content and calcium (figure 5). However, the residuals are mostly negative in the upper half of x-axe values for some traits, e.g. pigments, indicating that spectroscopy underestimate pigment concentrations of leaves with high concentrations. However, the influence of El Niño on pigment concentrations is apparent in the separation of during- and after-classes, indicating the ability to detect the leaf-greening phenomenon from spectral data.
Table 3. Temporal changes in foliar trait values predicted from spectral reflectance compared with temporal changes observed in traits significantly affected by El Niño. Partial-least square regression was used to generate models relating leaf traits measured during and after an El Niño event to spectral reflectance data collected by field spectroscopy. Regression analyses did not include sampling date in model calibration, so the predicted during and after El Niño values indicate predictive power to detect El Niño influences on each trait. Mean (and 95% CI) of each spectranomic trait change is provided.
| Foliar trait | Predicted change | Observed change |
|---|---|---|
| LMA (g cm−2) | 3.44 (1.02–5.86) | 4.03 (1.08–6.98) |
| Water content (%) | −0.72 (−1.47 to 0.03) | 1.62 (0.70–2.54) |
| δ13 C (‰) | 0.41 (0.24–0.58) | 0.49 (0.28–0.70) |
| Chl a + b (mg m−2) | 79.8 (70.1–89.5) | 101.5 (81.4–121.6) |
| Car (mg m−2) | 15.2 (13.5–16.9) | 17.7 (13.7–21.7) |
| Phenolics (mg g−1) | 9.0 (7.4–10.6) | 6.5 (3.5–9.5) |
| Tannin (mg g−1) | 1.71 (1.28–2.14) | 1.32 (0.42–2.22) |
| Cellulose (%) | 1.03 (0.62–1.44) | 1.03 (0.41–1.65) |
| Lignin (%) | −1.53 (−2.07 to −0.99) | −1.33 (−2.22 to −0.44) |
| Ca (mg g−1) | −0.61 (−1.26 to 0.04) | −1.11 (−2.16 to −0.06) |

Figure 5. Observed traits against traits predicted from spectral reflectance data, using Partial-Least Square regression, for traits significantly influenced by the El Niño event. The findings show that remote sensing is able to detect accurately most traits during (yellow) and after (black) El Niño.
Download figure:
Standard image High-resolution image
Discussion
Changes in rainfall and temperature observed during the the El Niño event of 2015/2016 varied markedly across South-East Asia (Thirumalai et al 2017). Even on the island of Borneo there were significant differences in both the duration and severity of reduced rainfall and increased temperatures (Colledge 2017, Whitfield et al 2019). This paper provides the first analysis of how rainforest leaf traits respond to El Niño events at a single site within this region, and uses trends in satellite-derived canopy greenness to interpret these changes. Measurements of leaf functional traits reveal that pigment concentrations were consistently higher during the El Niño event than afterwards, and a number of other traits varied to lesser extents. There are two non-exclusive explanations for these trait changes: that trees exchanged leaves in response to changing conditions and that the new leaf cohort had different traits to those that had been discarded, and/or that individual leaves acclimatised to the new environmental conditions brought about by the El Niño event. With functional trait data from just two points in time, it is challenging to distinguish between these two mechanisms. We start by looking at the NDVI trends, then explore possible ecophysiological explanations for the leaf-level trait changes, before returning to the question of whether leaf turnover or leaf acclimation or both contributed to the changes observed.
Ecophysiological explanations for functional trait shifts in response to El Niño
Pigment concentrations were about a third higher during the El Niño event than afterwards, which suggests that trees responded to having more light by upregulating photosynthetic processes. Greater foliar chlorophyll concentrations ensures that more photosynthetically active radiation is utilised for electron transport (Poorter et al 2009). Increased light availability during the relative dry phase of the El Niño cycle can result in high rates of photosynthesis (Guan et al 2015). However, it remains unclear whether higher rates of photosynthesis occur in Sabah, as N and P concentrations are similar during and after the El Niño, suggesting that the total concentration of leaf proteins (including Rubisco) remain unchanged (Evans 1989); this is a topic in need of further research. Carotenoids protect leaves from photoinhibition (i.e. damage caused by solar radiation when supply outstrips demand) by releasing excess energy as heat via the xanthophyll cycle (Ustin et al 2009). The ratio of carotenoids to chlorophyll remains similar between surveys, suggesting leaves retain similar commitment to protection against photoinhibition.
Leaves had higher δ13 C values during the El Niño event, consistent with greater water use efficiency in a period of increased evaporative demand. Water-use efficiency can be effectively measured with foliar δ13C values (Farquhar et al 1989) because changes in stomatal conductance in response to leaf water balance changes intercellular/ambient CO2 ratios and discrimination against the heavier isotope in metabolic processes.
The observed increases in phenolic compounds are consistent with other studies showing increased production in response to heat stress and higher irradiation (Rivero et al 2001, Caldwell et al 2007, Poorter et al 2009). Phenolic compounds are secondary metabolites with antioxidant effects in plants exposed to oxidative stress (Olsson et al 1998, Tattini et al 2004, Tatinni et al 2005, Mansori et al 2015). Phenolic compounds accumulate in large quantities in the vacuoles of epidermal cells and effectively attenuate the UV component of sunlight with minimal change in the visible region of the spectrum.
The ecophysiological responses outlined above could have resulted from rapid acclimation of existing leaves or from the production of new leaves with different properties in response to the El Niño environment. The next section considers evidence supporting the latter hypothesis.
Evidence for increased leaf turnover
Shedding of leaves has been observed as a response to both intense short and long period droughts in the north of Borneo (Ichie et al 2004) and most trees flush new young leaves with the end of drought and increase in rainfall (Itioka and Yamauti 2004). If leaf loss was greater in the period running up to the first field campaign, and if new leaves were flushed almost immediately, then we could have inadvertently sampled younger leaves in the first campaign which are known to have higher concentrations of photosynthetic pigments (Doughty and Goulden 2008, Hilker et al 2017). Recent studies have demonstrated strong relationships of leaf traits and spectra with leaf age (Chavana-Bryant et al 2017, Wu et al 2017). By selecting what appeared to be mature leaves on each branch we attempted to minimise any effects of leaf turnover, but leaf age was not determined.
Our NDVI time series is likely as a result of both leaf biochemistry and canopy structure (i.e. leaf area, crown geometry and leaf demography) (Wu et al 2016, 2017, 2018). We see greening in the early El Niño period in 2015 (figure 2(b)), probably because there was more PAR and sufficient water, which resulted in more chlorophyll and increased LAI. We see a sharp decrease in greeness late in the El Niño which possibly indicates loss of leaves associated with strong evaporative demand and depleted soil water (figure 2(b)). By the time of the second field survey, the NDVI is similar to the first survey despite evidence of major upheavals in the interim.
Some—but not all—functional trait responses vary among species
By concentrating on functional traits without reference to species identities or individuals, we are able to account for intra-specific variability, often neglected when functional diversity is indirectly calculated from taxonomic data. Strong taxonomic organisation probably indicates low plasticity within species (Asner and Martin 2011). Our results suggest that most traits have strong phylogenetic signals; among those traits that do not have strong taxonomic contribution to the overall variance partitioning, changes in LMA and δ13C concentration are primarily driven by sun/shade branch conditions whereas pigments are primarily driven by the El Niño event. LMA has a tight relationship with the photosynthetic capacity of plants (Poorter et al 2009), and is highly modulated by the total photon irradiance over the day (Niinemets et al 2004) and the vertical light-gradient and light quality along plants play a crucial role in determining LMA (Niinemets 2007). Our results suggest that variation in irradiance may be the underlying mechanism behind changes in LMA between the two sampling events, especially if the onset of drier conditions was associated with reduced cloud cover and lower irradiance during the El Niño event. On the other hand, nutrients and water content had particularly strong taxonomic organisation. Although plants can quickly adjust investment in the photosynthetic machinery and water-use efficiency (δ13C), nutrients stored in tissues may be reused and changes in those traits may take longer to manifest. The strong taxonomic pattern in water content may indicate selective pressure among coexisting species.
A clearer sense of the diversity and organisation of canopy chemical traits may help us to forecast the species that will suffer or gain from an increasing frequency of El Niño events. Some old growth forests of Borneo have high levels of interspecific variability associated with high biological diversity (Asner et al 2012). The rapid shift in water-use efficiency indicates the ability of plants to adapt to these short-term climate variation, but may also suggest that more frequent droughts could increase selection for species with greater intrinsic water-use efficiency (Cernusak et al 2009).
Application of spectroscopy to predict trait variation
To our knowledge, our study is the first to analyse the morphological (LMA) and a range of chemical traits along with spectral reflectance of leaves of emergent canopies and tropical tree species during and after El Niño. Many previous studies have shown that leaf reflectance can predict the morphological and chemical leaf traits in the tropics that are commonly used for determining functional diversity (Asner et al 2012, Asner et al 2014, Doughty et al 2017) and also capture variation that is not traditionally measured (Schweiger et al 2018). We evaluated the variation of 17 leaf traits using spectral reflectance and were able to validate these measurements against field data. In particular, the variation of traits affected by El Niño such as pigments, δ13C and phenolics were successfully detected, which suggests that repeated reflectance measurements can also predict physiologically relevant variation of the El Niño effects at the leaf level. The effects of El Niño on leaves accompanied by high pigment concentrations were detected from the visible (400–750 nm) portion of the spectra, as expected from previous studies (Curran et al 1991, Sims and Gamon 2002, Serbin et al 2014). From a remote sensing perspective, a potential leaf-level greening phenomenon during El Niño could be then a factor contributing to the greening observed during the dry season.
Concluding thoughts
Greening of forest canopies during short and long-term drought have been reported previously in the Amazon basin, using satellite remote sensing (Saleska et al 2007, Manoli et al 2018). Ground-based spectral data and NDVI trends measured by spaceborne spectroradiometers in this study suggest canopy-level greening in response to the initial phase of the El Niño drought, similar to those observed in several studies and attributed to greater irradiance when cloud cover is reduced and/or to leaf demography (Nemani et al 2003, Huete et al 2006, Wu et al 2016). Manoli et al (2018) recreated dry-season greening in the Amazon using an eco-hydrological model, providing further support for the idea that leaf development and synchronised dry season litterfall and dry conditions are in agreement with evolutionary strategies aimed at increasing the efficiency of photosynthesis and water consumption during periods of abundant light but potentially low water availability. We observed the greening with both ground-based sensor and spaceborne analyses in the early part of the El Niño, quite possibly because plants were not initially droughted despite increased evaporative demand, but then towards its climax forest greeness reduced, presumably because of leaf shedding in response to water availability.
The short and long-term impacts of El Niño may differ and are likely to depend on species (Slik 2004) and tree age and height (Giardina et al 2018). Despite the greening observed, plot-based estimates demonstrated that a previous 2005 drought negatively affected forest carbon through increased mortality (Phillips et al 2009). Although our study provides evidence of a rapid shift to maximise water use efficiency, as well as a large investment in photosynthetic and defensive machineries, we cannot infer information about mortality and productivity of trees from our data. Leaf-level traits do not account for all important aspects of functional traits that do not interact with light (e.g. rooting depth) or canopy-level functional traits such LAI, canopy height or tree architecture hence the difficulties to predict future responses to El Niño events. However, these events have been documented for at least 130 000 years (Tudhop et al 2001), which allows abundant time for selection on plant functional responses to El Niño and supporting the idea that the ability to change traits over short time frames is adaptive. More integrative work is needed to link remote sensing time-series with ground-based surveys of trait and population-level changes.
Our results demonstrate that trees do increase chlorophyll concentration in their leaves during El Niño and this change can be detected from spectral reflectance. In our analysis we have analysed the spectral information at specific wavelengths within broad regions of the electromagnetic spectrum, i.e. visible, near infrared and shortwave infrared regions of the spectrum. Future work will examine changes in spectral response associated with specific absorption and reflectance features within each spectra. This will likely yield better predictive and explanatory models of changing leaf traits with hyperspectral remote sensing in an era when airborne spectrometers are mapping large areas of the Earth (e.g. Asner et al 2017) and new spaceborne hyperspectral missions (e.g. ESA's EnMap) are being developed, thus paving the way for changing leaf and canopy traits to be observed at landscape-scales. The implication of this study thus extends beyond the Borneo region and suggests that remote sensing-based observations will soon enable vegetation and ecosystem function, and their responses to short-term climate changes, to be characterised at the global scale. Providing evidence that plant strategies during short-term climate change can be accurately predicted using spectrometers paves the way for new research on tropical forest responses to a changing climate using sensors in space.
Acknowledgments
Field data were acquired through the DfID/NERC project Spatio-Temporal Dynamics of Forest Response to ENSO Drought (STEED) (NE/P004806/1) and NERC's Human Modified Tropical Forests research programme (grant number NE/K016377/1 awarded to the BALI consortium). We thank the NERC Field Spectroscopy Facility for loaning the ASD spectrometer used in the first campaign, and Doreen Boyd (University of Nottingham) for loaning the one used in the second campaign. M H N was supported by a PhD scholarship from the Conselho Nacional de Pesquisa e Desenvolvimento (CNPq). We thank the Sabah Biodiversity Council and the Danum Valley Management Committee for permission to conduct this work. We acknowledge the assistance and support from the South East Asia Rainforest Research Partnership (SEARRP), Laura Kruitbos, Unding Jami, research assistants and the Sabah Forestry Department.