Article

Extending Hyperspectral Imaging for Plant Phenotyping to the UV-Range

1
Institute for Crop Science and Resource Conservation (INRES)—Plant Diseases and Plant Protection, University of Bonn, Nussallee 9, 53115 Bonn, Germany
2
Institute for Sugar Beet Research, Holtenser Landstraße 77, 37079 Göttingen, Germany
3
LemnaTec GmbH, Pascalstraße 59, 52076 Aachen, Germany
4
Kuratorium für Versuchswesen und Beratung im Zuckerrübenanbau, Maximilianstraße 10, 68165 Mannheim, Germany
5
Technical University Darmstadt, Computer Science Department and Centre for Cognitive Science, Hochschulstrasse 1, 64289 Darmstadt, Germany
*
Author to whom correspondence should be addressed.
Remote Sens. 2019, 11(12), 1401; https://doi.org/10.3390/rs11121401
Submission received: 29 April 2019 / Revised: 3 June 2019 / Accepted: 7 June 2019 / Published: 12 June 2019
(This article belongs to the Special Issue Advanced Imaging for Plant Phenotyping)

Abstract

:
Previous plant phenotyping studies have focused on the visible (VIS, 400–700 nm), near-infrared (NIR, 700–1000 nm) and short-wave infrared (SWIR, 1000–2500 nm) range. The ultraviolet range (UV, 200–380 nm) has not yet been used in plant phenotyping even though a number of plant molecules like flavones and phenol feature absorption maxima in this range. In this study an imaging UV line scanner in the range of 250–430 nm is introduced to investigate crop plants for plant phenotyping. Observing plants in the UV-range can provide information about important changes of plant substances. To record reliable and reproducible time series results, measurement conditions were defined that exclude phototoxic effects of UV-illumination in the plant tissue. The measurement quality of the UV-camera has been assessed by comparing it to a non-imaging UV-spectrometer by measuring six different plant-based substances. Given the findings of these preliminary studies, an experiment has been defined and performed monitoring the stress response of barley leaves to salt stress. The aim was to visualize the effects of abiotic stress within the UV-range to provide new insights into the stress response of plants. Our study demonstrated the first use of a hyperspectral sensor in the UV-range for stress detection in plant phenotyping.

1. Introduction

Plant phenotyping using hyperspectral imaging involves the acquisition of specific parts of the electromagnetic spectrum. When light strikes a leaf the light is either transmitted through the leaf, absorbed by leaf chemicals or reflected from the leaf surface or internal structures [1]. Hyperspectral non-imaging sensors measure the average spectral information over the investigated area but lack further spatial information, while imaging hyperspectral sensors combine spectral and spatial resolutions [2]. Previous studies using hyperspectral sensors focused on the visible (400–700 nm), near-infrared (700–1000 nm) and short-wave infrared (1000–2500 nm) range [1]. Reflectance in the visible range can be correlated to leaf pigment content since plants tend to reduce leaf chlorophyll concentration [3], while the near-infrared range is mostly influenced by the leaf structure (e.g., leaf trichome density or leaf thickness) and leaf water content [4]. In addition to the leaf water content, the short-wave infrared range is also influenced by the chemical compositions of the leaf [5,6] like lignin or cellulose [7]. The ultraviolet range (200–380 nm) has not yet been used in plant phenotyping. A number of plant molecules like flavonoids, amino acids, anthocyanins and nucleoside feature absorption maxima in the UV-range [8,9,10]. The aromatic compound phenol for example shows a maximum absorption at 270–274 nm and is produced by a multiplicity of plants as protection against stress [11]. Flavonoids are described to be important in plant resistance against fungi [12] and have two absorption maxima at 240–290 nm and 310–370 nm (flavones and flavonols) [13]. Previous studies show that saline stress in barley seedlings leads to an increase of flavonoids and total phenolic compounds [14].
In order to measure the reflectance of leaves in the UV-range there are special requirements for the measuring platform. A suitable sensor and a light source with a sufficiently homogeneous illumination over the measured spectrum from 250–500 nm have to be integrated. UV-radiation consists of the UV-C (200–280 nm), UV-B (280–320 nm) and UV-A (320–400 nm) range of which the UV-C range is the most hazardous [15]. UV-radiation has been shown to damage the DNA, amino acids, proteins, lipids and plant growth regulators, leading to changes in growth and general development [15]. As a response to UV-radiation, mitochondria and chloroplasts can produce reactive oxygen species (ROS) like hydrogen peroxide (H2O2), activating programmed cell death [16,17]. To ensure that no tissue damage is induced by using a UV-light source for hyperspectral imaging, irradiated plants have to be examined for the production of ROS. Previous studies also showed that UV-radiation can cause an accumulation of phenolic compounds to protect the photosynthetic apparatus [18] thus low UV-intensities have to be chosen for the experiment.
The hypothesis of this study is that host-pathogen interactions have an influence on plant-derived compounds such as secondary plant metabolites and thereby changing the reflectance properties in the UV-range. It is assumed that hyperspectral imaging in the UV-range can provide further important information about changes in plant substances during pathogenesis.
In this study we introduce an imaging hyperspectral sensor system in the range of 250–430 nm for the assessment of plant stress. To evaluate hyperspectral imaging using a UV-based sensor three different experiments were performed: (1) comparing the performance of the UV line scanner to a non-imaging UV-sensor (Flame Spectrometer S, Ocean Optics, Largo, MD, USA) with measurements of different plant-based substances, (2) the phototoxic effects of the required illumination were qualitatively assessed and (3) based on insights of the first two experiments, an application study was performed with barley leaves induced with salt stress.

2. Materials and Methods

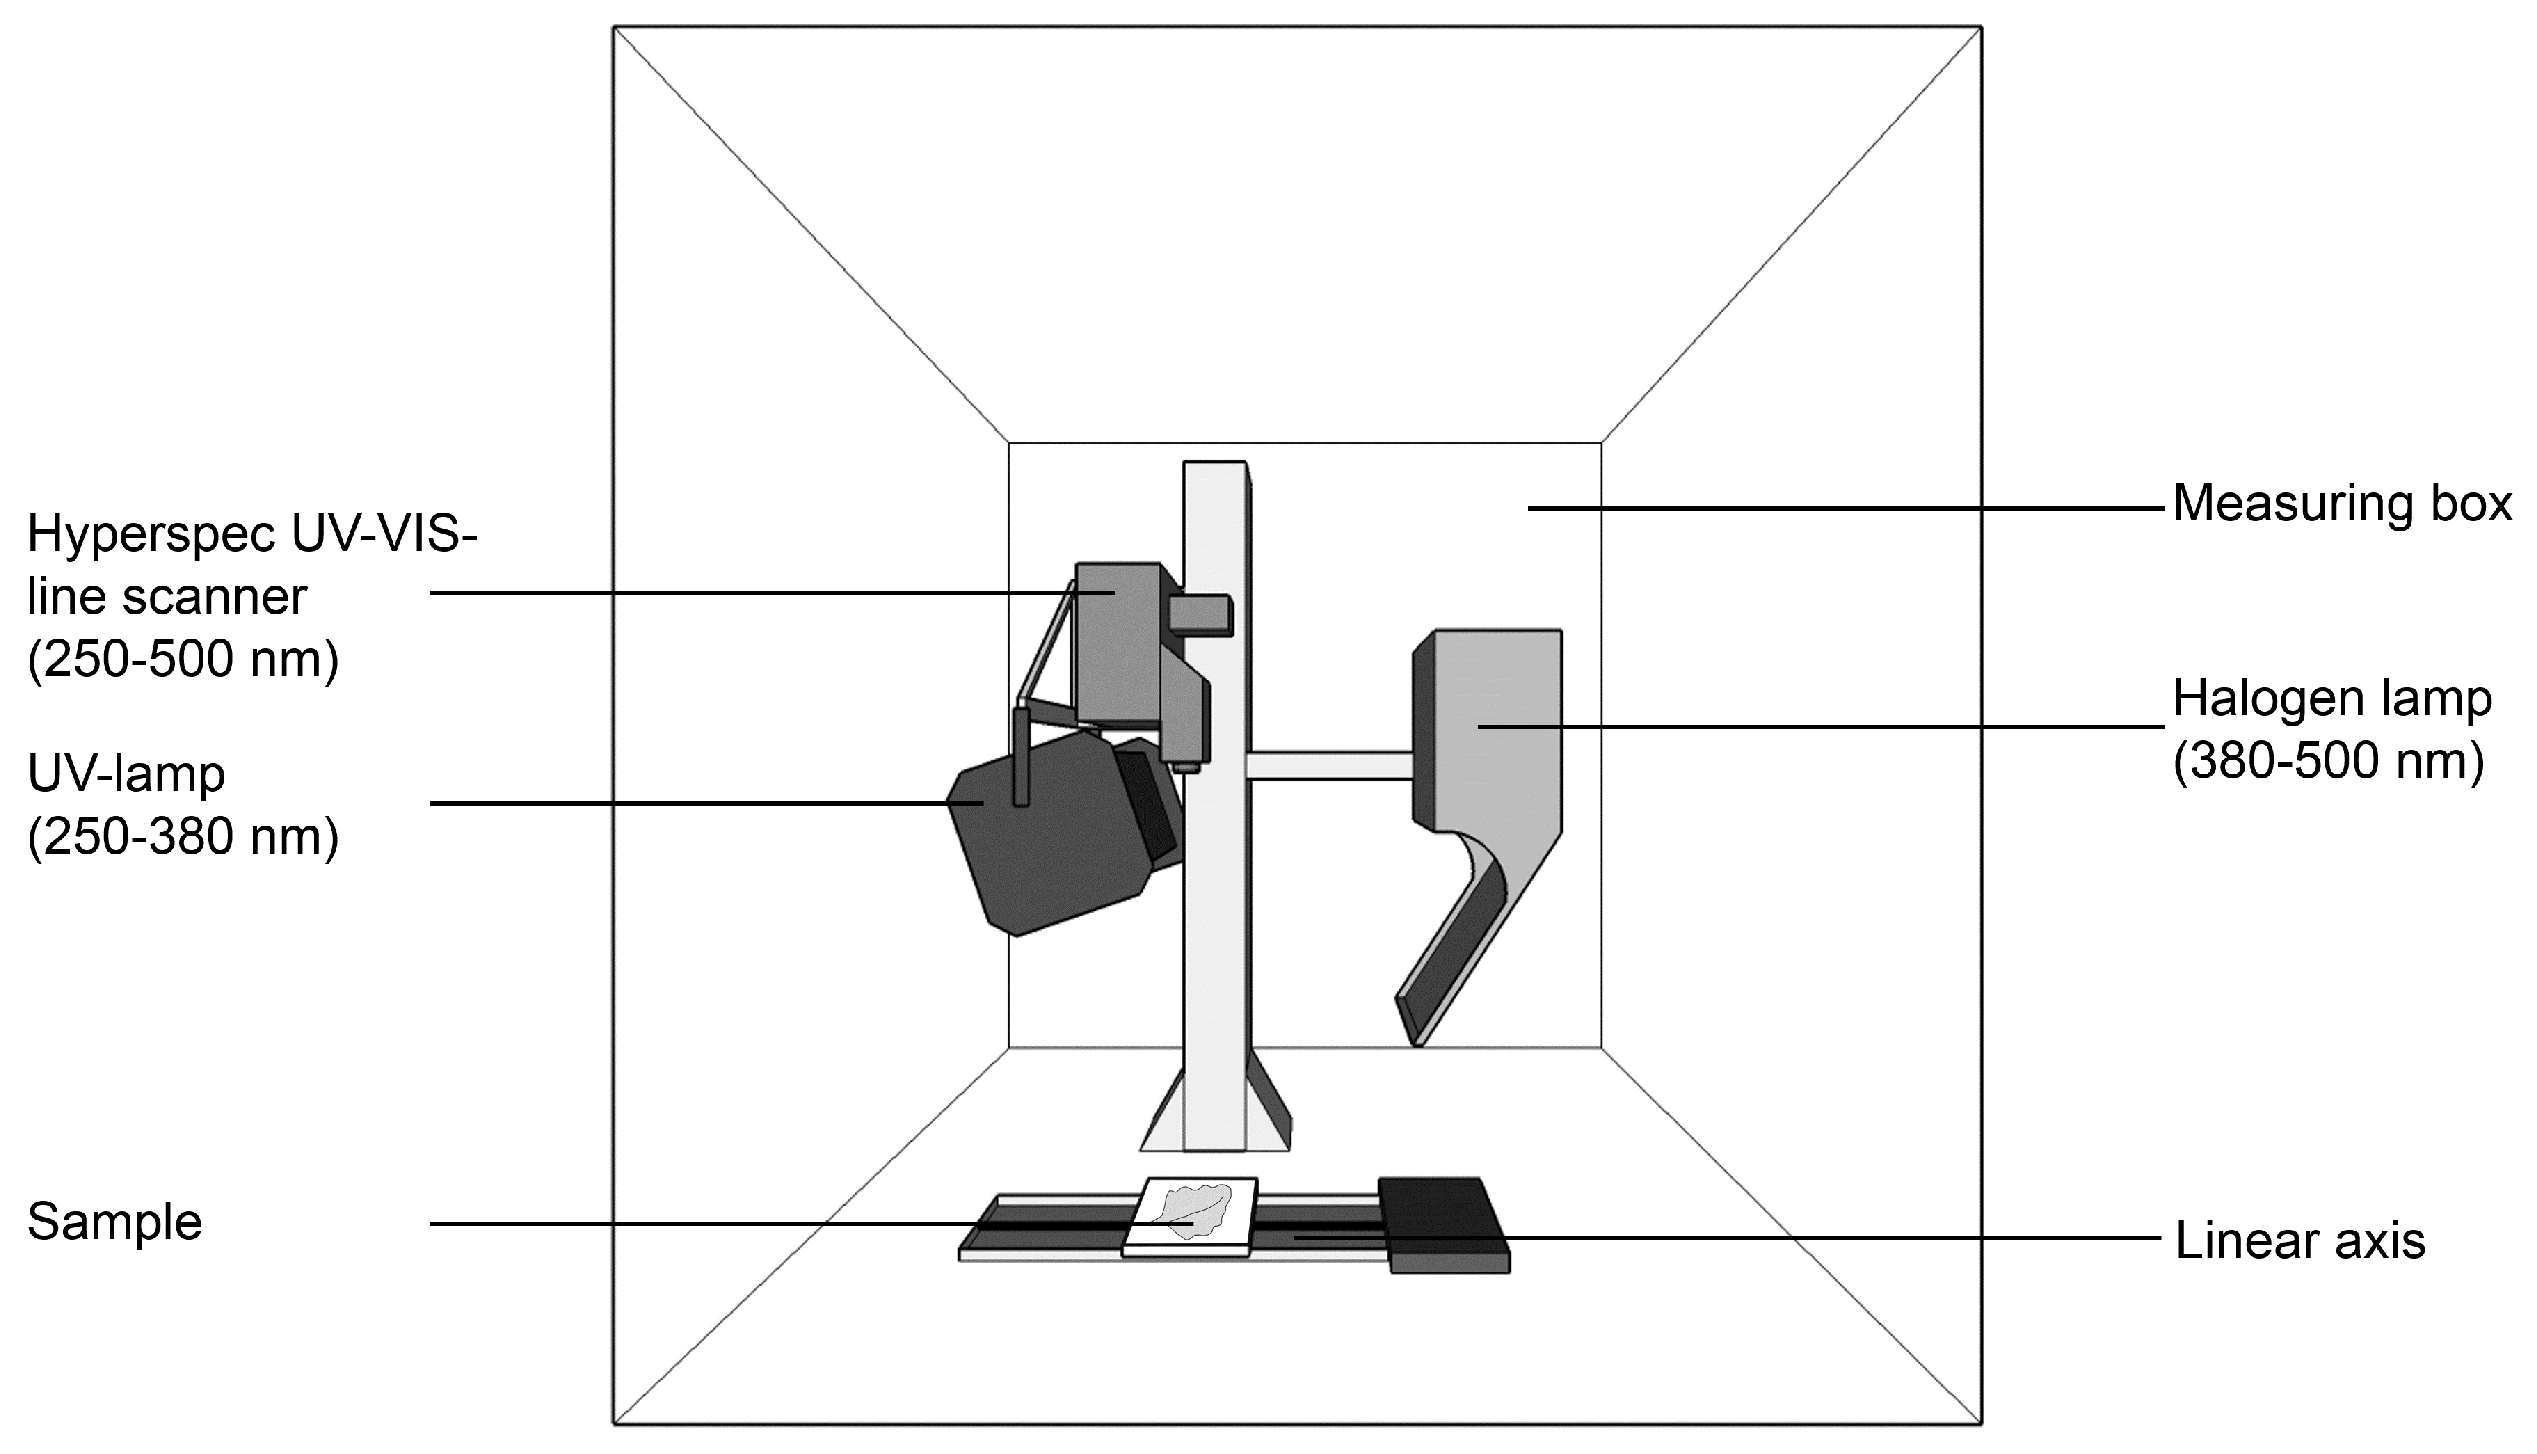
2.1. Imaging Setup and Hyperspectral Imaging

A hyperspectral UV-VIS imaging sensor set up has been established to record reflectance of plants or substances (Figure 1). The UV line scanner (Headwall Photonics, Bolton, MA, USA) consists of a Hyperspec UV-VIS-Interline CCD Sensor in the range of 240–500 nm with a spectral resolution of 1.4 nm and a pixel pitch of 5.5 μ m. The UV-VIS lens provides a focal distance of 28.3 mm and a maximum lens aperture of f/3.5. Illumination is provided by a halogen lamp 21 DC (TechniQuip, Pleasanton, CA, USA) and a distinct UV-lamp (UniLux, Guardian, Saddle Brook, NJ, USA) with adjustable intensities of 300–5000 lx. The UV-lamp was attached at a distance of 45 cm above the linear stage with a vertical orientation of 70 , the halogen lamp was attached at a distance of 38 cm. The camera was placed at a distance of 40 cm above a linear stage. The measurements were performed within a light-proof box (92 cm × 61 cm × 92 cm) to ensure controlled illumination conditions and protect operators against UV-radiation. Exposure times of 800 and 2500 ms were used with a framerate of 0.4 frames per second and a speed of 0.141 mm/s of the linear axis to move the sample below the camera. A white reference image of 95% barium sulfate and a dark current image were recorded before every measurement to obtain the relative reflectance, which was calculated using the software Headwall Hyperspec III (Headwall Photonics, Bolton, MA, USA). The data was analysed using the software ENVI 5.5 (Exelis Visual Information Solutions, Boulder, CO, USA) (Table 1). An amount of 2000 pixel was used to extract the average reflectance of barley leaves while 40,000 pixel were used for pure substances. To evaluate the performance of the measuring set up three scenarios have been investigated. The interaction between UV-light and plant tissue was studied to exclude any phototoxic effects (Section 2.2), the measurement quality of the imaging line scanner was compared to a non-imaging UV-spectrometer (Section 2.3) and the effects of abiotic stress within the UV-range were tested (Section 2.4).

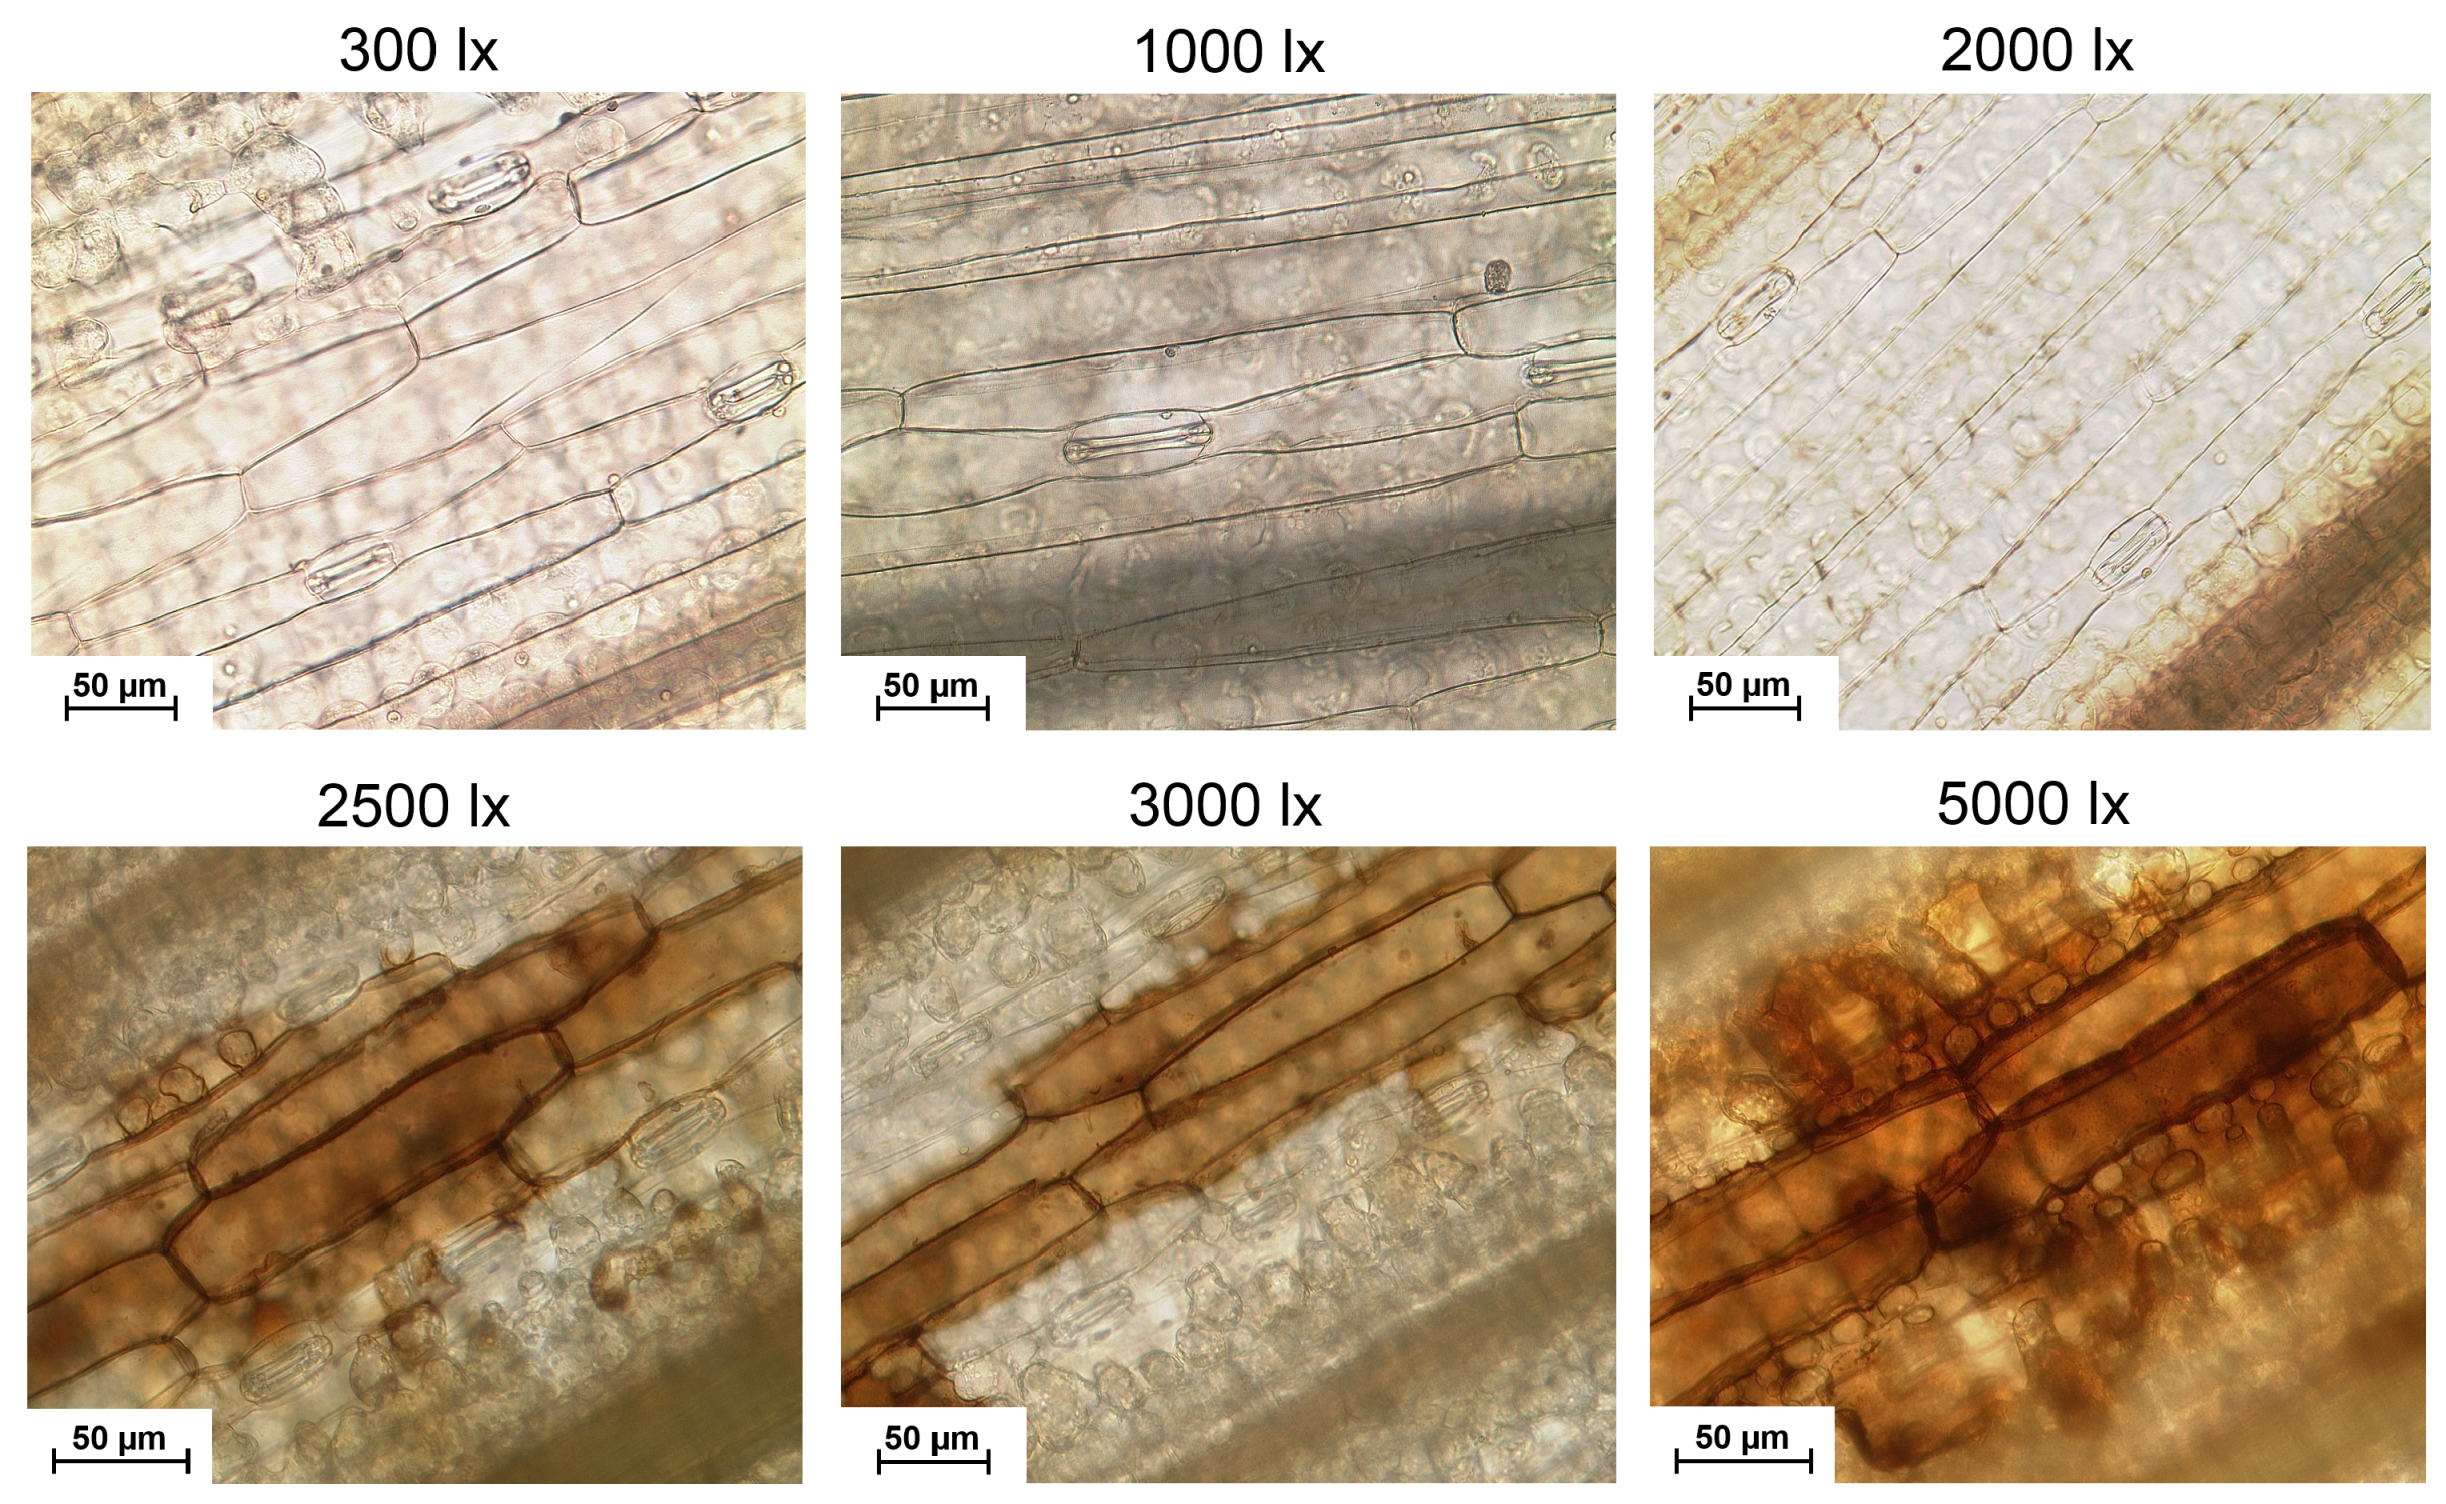
2.2. Qualitative Assessment of UV-Light Plant Tissue Interaction

To determine the maximum intensity of UV-radiation at which no tissue damage of plant material is caused, a series of intensity measurements was conducted. Barley cv. Ingrid was grown in plastic pots (5 × 5 cm) on commercial substrate (Topfsubstrat 1.5, Balster Erdenwerk GmbH, Sinntal-Altengronau, Germany) in a greenhouse environment and watered as necessary. After reaching growth stage 11 according to BBCH scale [19] the plants were illuminated for 30 min with 20 different UV-radiations from 300–5000 lx. For each intensity, three pots with two barley plants each were illuminated and three samples of every plant with a size of 1 × 1 cm were used for microscopic investigation. Tissue damage was investigated by H2O2 detection using 3,3-diaminobenzidine (DAB). The leaves were placed in 1mg/ml DAB-HCl, pH 3.8 [20] for 24 h, followed by 24 h in fixation solution (75% ethanol, 25% chloroform, 0.15% trichloroacetic acid, [21]). H2O2 detection was indicated by brown stained cell components and analyzed by microscopy (Leica Leitz DMBRB, Leica, Wetzlar, Germany). Images were taken with a digital camera mounted on the microscope (HV-C20A, Hitachi, Tokyo, Japan).

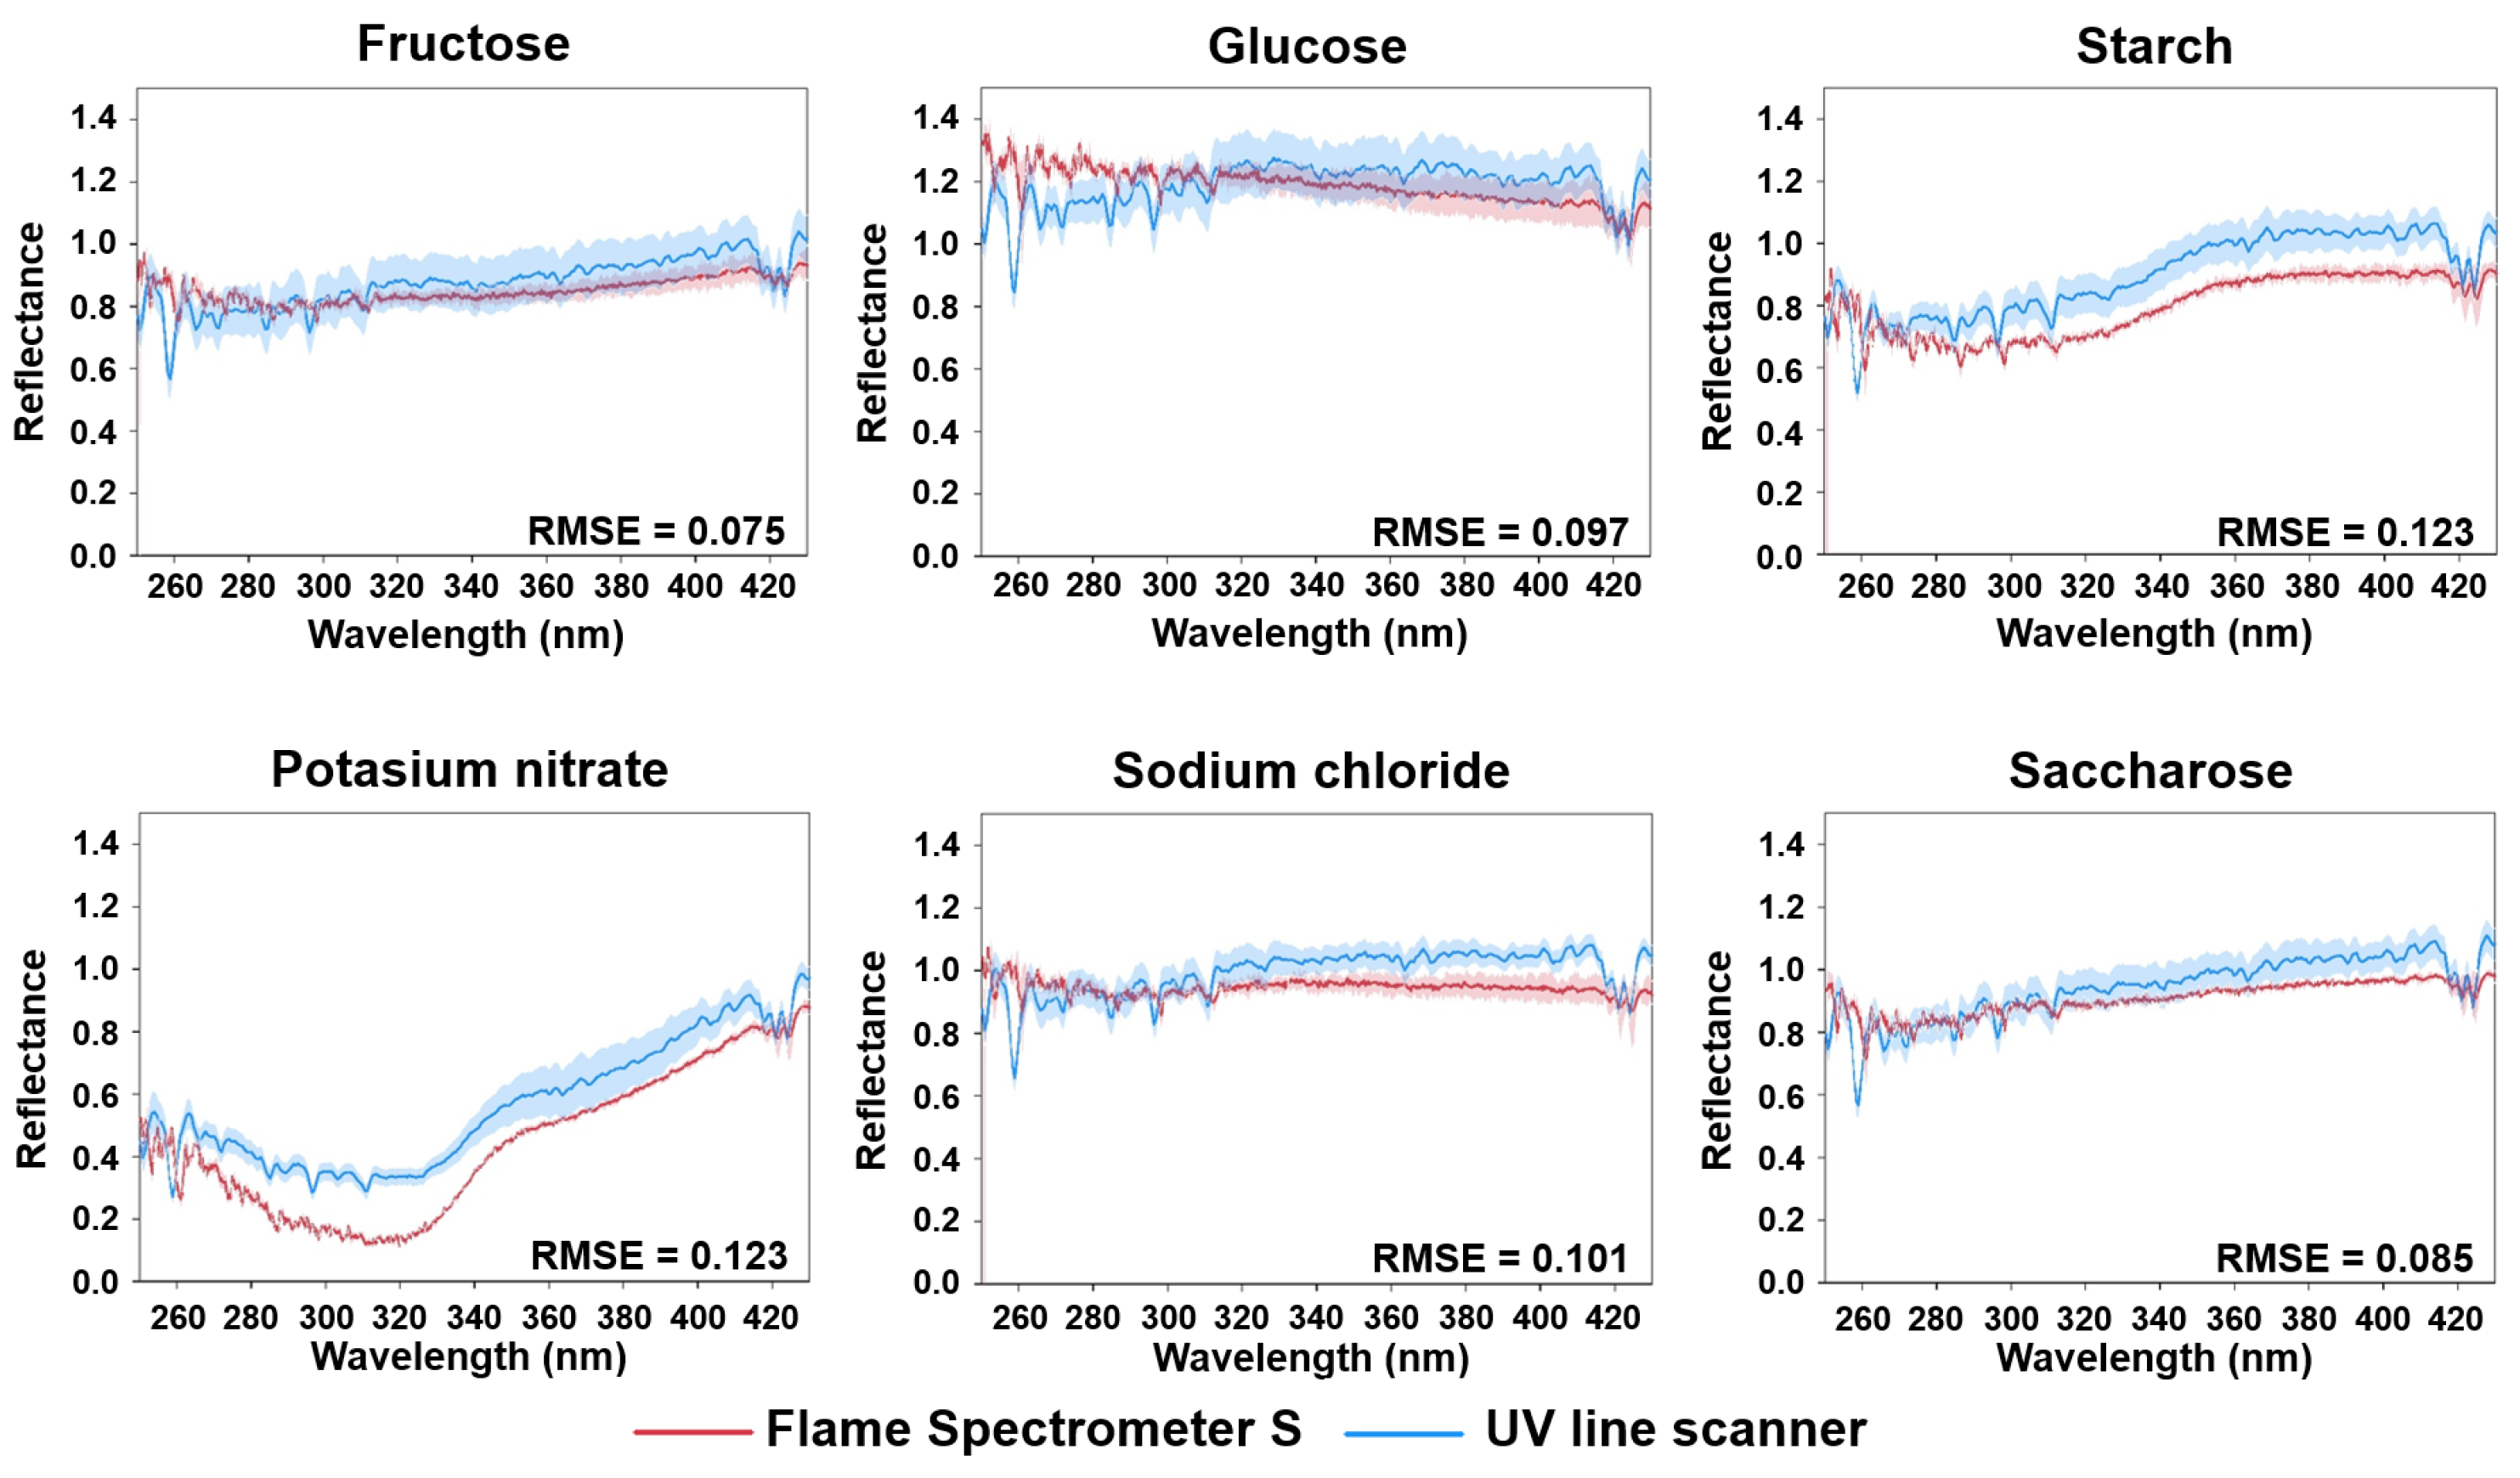
2.3. Evaluation of Spectral Accuracy

To exclude systemic effects, noise and to evaluate the accuracy of the hyperspectral sensor system in the UV-range, measurements of different homogeneous substances were conducted with the UV line scanner and the non-imaging Flame Spectrometer S. It provids a wavelength range from 190–1100 nm and a spectral resolution of 0.11 nm. The pure substances measured were fructose (Carl Roth, Karlsruhe, Germany), glucose (Carl Roth, Karlsruhe, Germany), saccharose (Carl Roth, Karlsruhe, Germany), potassium nitrate (Sigma Aldrich, St. Louis, MI, USA), sodium chloride (Merck KGaA, Darmstadt, Germany) and starch (Merck KGaA, Darmstadt, Germany). The substances were each placed in one well of a black coloured 6-well plate with a filling volume of 5 mL and filled up to the edge to avoid shadows. The reflectance of each substance was captured separately, during the measurement of one individual substance the remaining substances were covered by black paperboard. Each measurement was repeated five times for the UV line scanner and 20 times for the Flame Spectrometer S. An exposure time of 800 ms was used for the UV line scanner and 1000 ms for the Flame Spectrometer S. UV- and halogen-illumination were kept constant for both measurements with UV-intensities of 1000 lx. Spectral signatures were extracted from 40,000 pixel for each measurement conducted with the UV line scanner. Calculation of root-mean-square error (RMSE) was generated with R (R Studio 1.1456). RMSE was calculated according
R M S E = 1 n ( F l a m e S p e c t r o m e t e r S U V l i n e s c a n n e r ) 2

2.4. Monitoring Abiotic Salt Stress of Barley Leaves in the UV-Vis Spectrum

Primary leaves of barley cv. Ingrid were cut after reaching growth stage 11 according to BBCH scale [19] at a approximate length of 10 cm. The leaves were placed on 10 g/L phytoagar (Duchefa Biochemie B.V, Haarlem, Netherlands), containing 0.34 mM benzimidazole [22]. To visualize an abiotic stress, salt stress was chosen due to an easy induction and availability of studies. To induce salt stress, phytoagar plates with 20 g/L NaCl and 80 g/L NaCl were prepared. Five plates were kept untreated and five technical replications with four leaves each were used for the experiment. The agar plates were sealed and incubated at 19 C in a controlled environment with 1100 cd × m−2 illuminance and a photo-period of 16 h per day. UV- and halogen-illumination were kept constant for all measurements with UV-intensities of 1000 lx. Hyperspectral imaging and RGB visualization was performed 0–5 days after stress induction. Figures were generated with SigmaPlot 14 (Systat Software GmbH, Erkrath, Germany). To compare individual absorption features from a common baseline the continuum removal was calculated according to the continuum Removal function in the R prospector package (Version 0.1.3).

3. Results

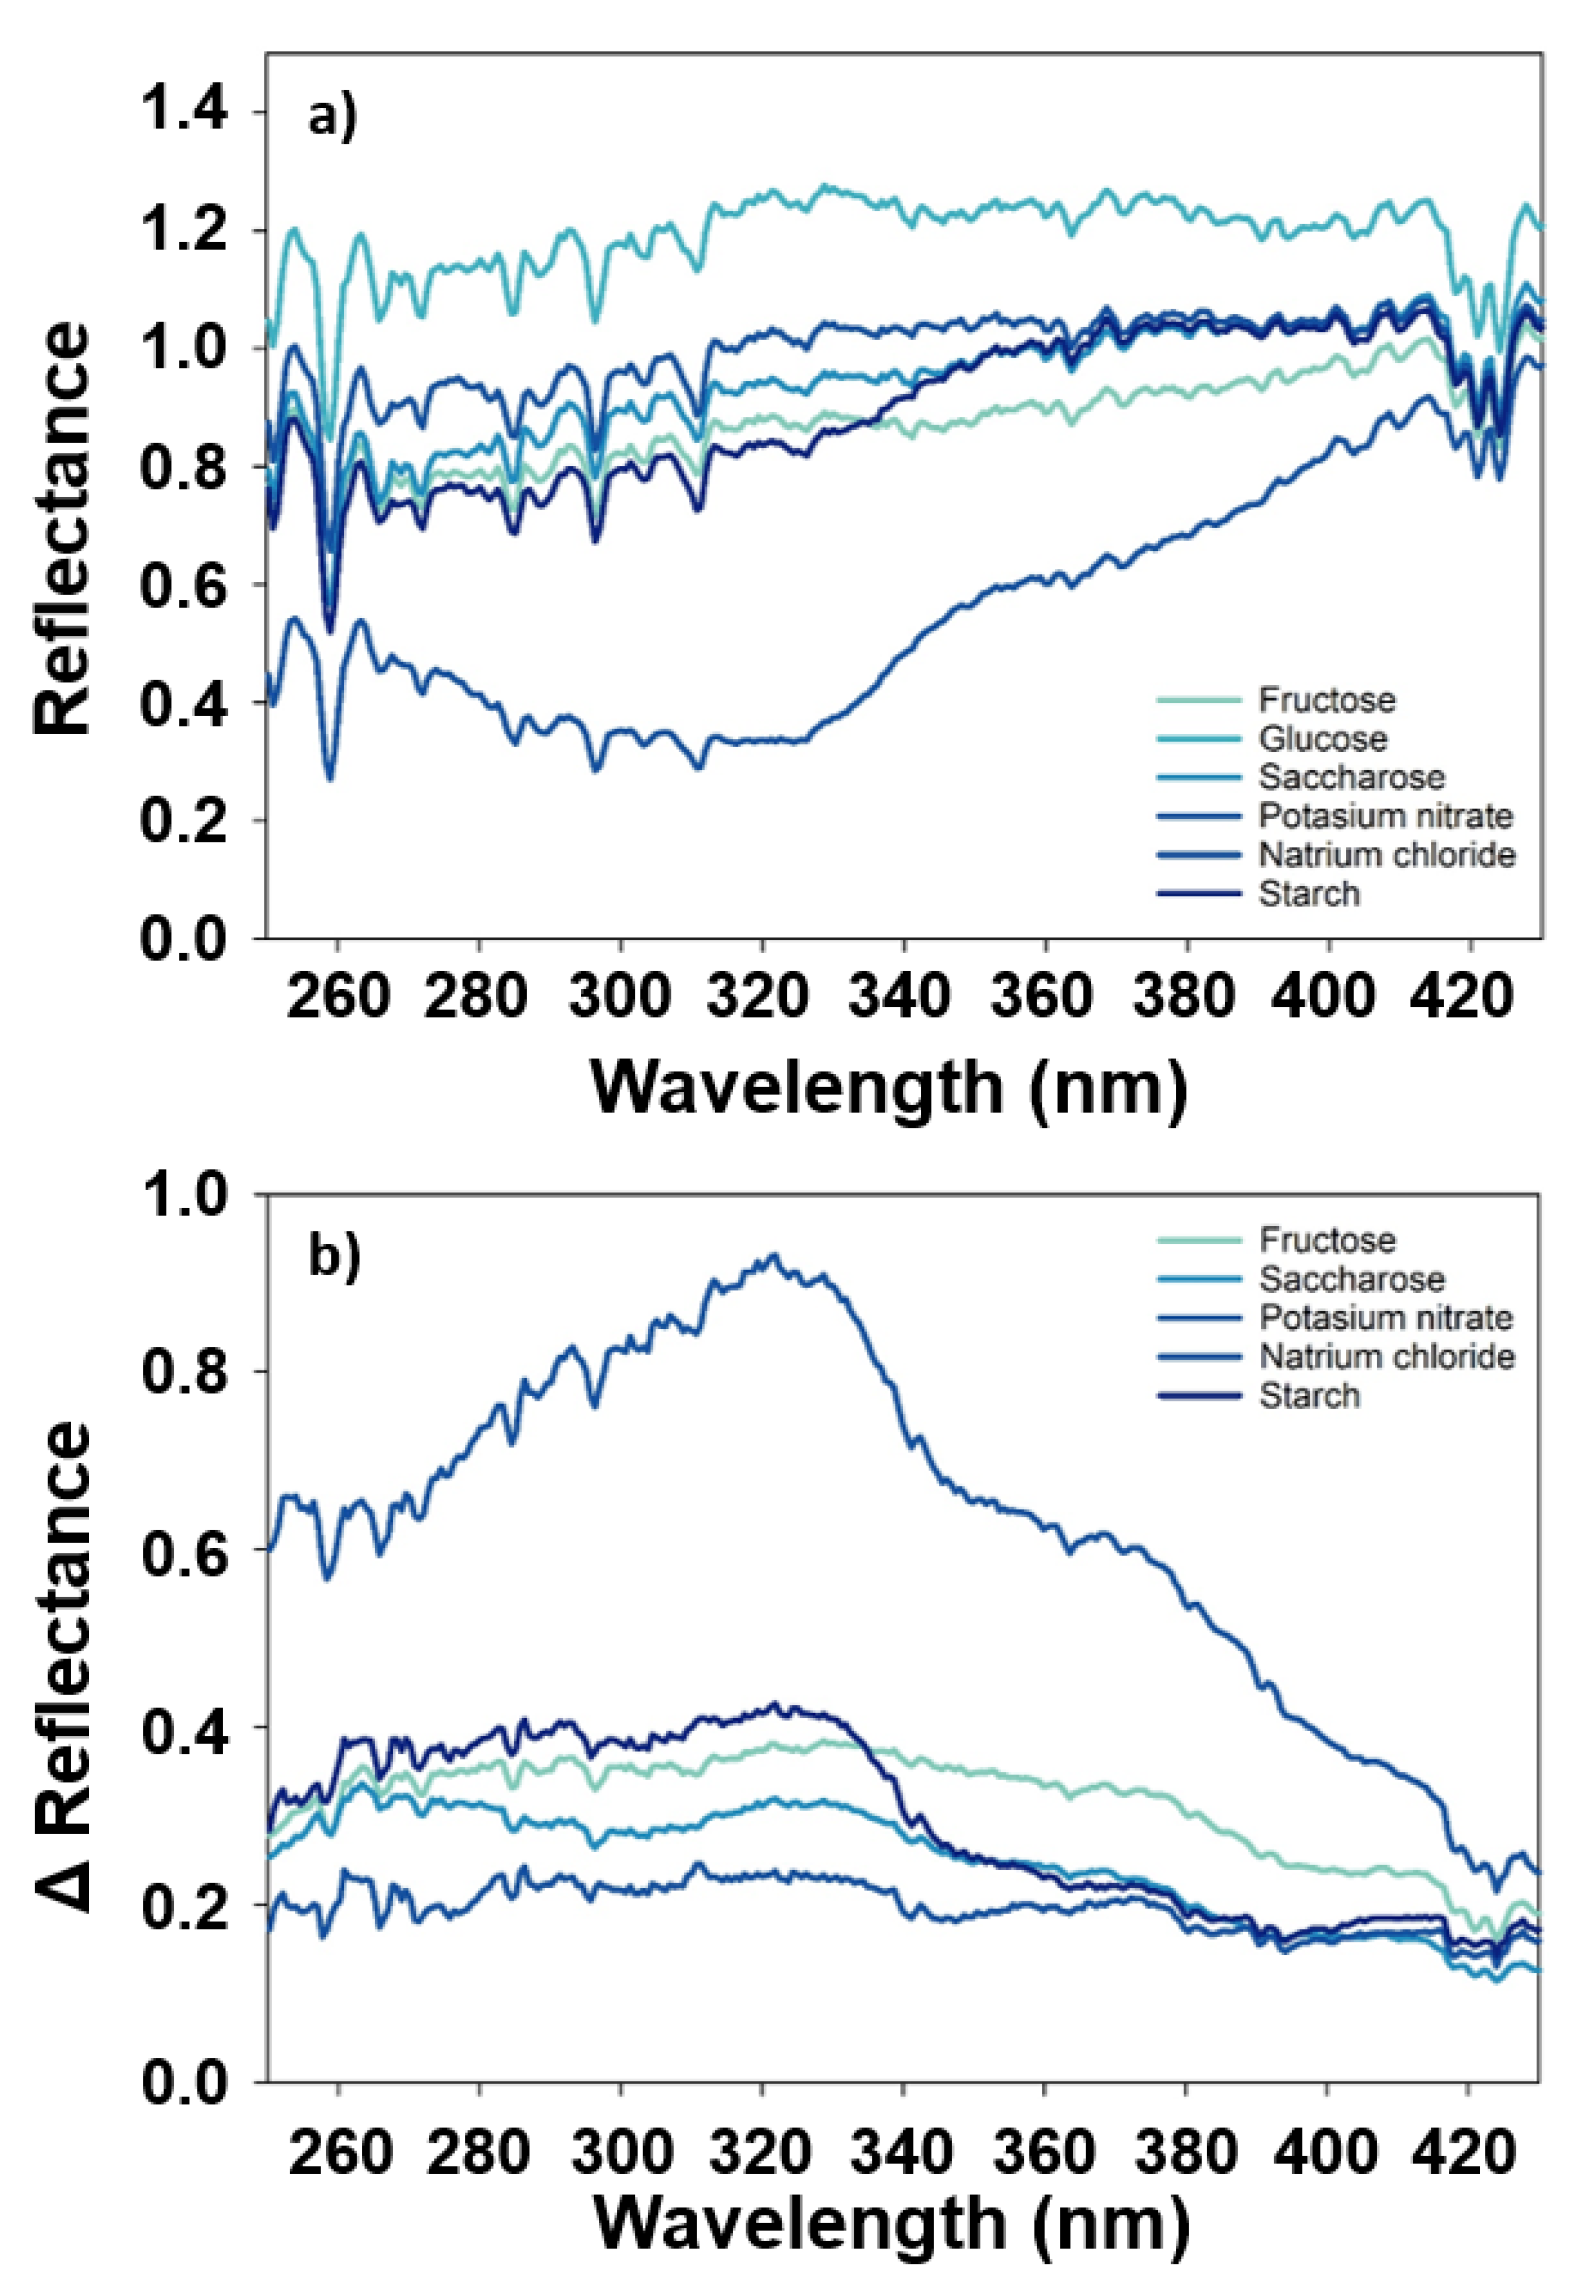
3.1. Comparison of Measurement Systems Observing Different Substances

To compare the non-imaging sensor Flame Spectrometer S with the imaging UV line scanner, six different pure substances were measured with both systems. Reflectance patterns observed by both sensor showed distinct peaks between 250–312 nm and 410–430 nm but these peaks were more significant in measurements of the UV line scanner. All measurements of the UV line scanner displayed a higher reflectance of about 0.2 starting at 300 nm compared to measurements of the Flame Spectrometer S (Figure 2). The reflectance patterns of fructose, glucose, saccharose and sodium chloride showed mostly constant reflectance from 250–430 nm with glucose showing the highest reflectance of 1.2 measured with both sensors. In addition, the reflectance of glucose measured with the UV line scanner was represented by an increase of reflectance from 250–310 nm. Potassium nitrate decreased in reflectance from 250–320 nm before increasing until 430 nm. Both sensors revealed a similar course reaching reflectance levels of about 0.8 at 430 nm. The reflectance pattern of starch also decreased from 250–300 nm before increasing until 430 nm, reaching similar reflectance levels as at 250 nm. For a more accurate analysis of the comparative measurements the RMSE was calculated for each substances displaying values less than 0.1 for all sugars and 0.101 for sodium chloride (Figure 2). The comparison of measurements of potasium nitrate and starch demonstrated the highest values at 0.123. The standard deviation of measurements conducted with the UV line scanner was a maximum of 0.2. Measurements of the Flame Spectrometer S mostly showed standard deviations of 0.05 except for glucose with reached values of 0.2.

3.2. Investigation of Phototoxicity of UV-Light on Plants

Hyperspectral imaging measurements of barley leaves illuminated with UV-light source revealed macroscopically visible tissue damage of the leaves. To determine non-harmful intensities of UV-light, barley plants were irradiated with intensities from 300–5000 lx (Figure 3). After staining with DAB, the leaves were investigated under a microscope and H2O2 was detected in all leaves irradiated with 2250–5000 lx. Visual quantification displayed that high amounts of H2O2 generation occurs near the cell walls from where it spread throughout the cell. H2O2 could not be detected in barley leaves illuminated with 2000 lx or less.

3.3. Abiotic Salt Stress of Barley Leaves

Untreated barley leaves maintained a high vitality throughout the measurement and were represented by green leaves 1–5 days after incubation (dai) (Figure 4). This was represented by similar reflectance patterns throughout the measurement, with high reflectances at 250 nm and a decrease of reflectance until 430 nm. Barley leaves incubated on 20 g NaCl/l phytoagar showed the first indications of decreasing their green colour and turning yellow, what is called chlorosis 4 dai. The chlorosis effect was distributed unevenly over the whole leaf and was represented in an increased reflectance on day four and five after incubation at 330–430 nm (Figure 4). Barley leaves treated with 80 g NaCl/l phytoagar showed clear symptoms of chlorosis from 4 dai onwards with a chlorosis pattern of strips. The reflectance of these barley leaves increased and showed a high reflectance from 250–430 nm. All reflectance patterns were represented by distinct peaks for example at 260 nm, 311 nm or 364 nm. Absorption features were similar during all measurements and occurred mostly from 320 nm onward. In addition, they decreased 4 and 5 dai.

4. Discussion

Hyperspectral imaging in the UV-range for plant stress monitoring was investigated in this study for the first time. The measuring performance of a new UV line scanner was compared to a non-imaging UV-sensor. The interaction of sensors and UV-illumination led to significant peaks from 250–312 nm in all measurements and could not be removed by normalization. A correlation of these peaks to specific plant molecules is not possible and they cannot be taken into account for further discussion. The measurements of six different pure substances revealed that both sensors can be compared with each other which is also confirmed by low RMSE values. But while each substance is represented by a very similar course of reflectance in both measurements, an increase from 330 nm onward and greater amplitude of all peaks is presented by measurements carried out with the imaging UV line scanner. The discrepancy in reflectance between the sensors can be caused due to different measuring geometry. The Flame Spectrometer S has a wider observation angle and needs to be close to the sample. In addition, the imaging UV line scanner measures a smaller area of the sample compared to the non-imaging Flame Spectrometer S but in addition to the one-dimensional spectral information it also measured the two-dimensional spatial information. This can also lead to deviations between the measurements since all samples except of starch are not a grounded powder but substances consistent of small grains. The effect of uneven grains is eliminated in measurements of the UV line scanner where a region of interest consisting of 40,000 pixels is used to extract the reflectance properties of each substance. In conclusion, this study has shown that an imaging UV line scanner produces comparable data to the Flame Spectrometer S, but the spatial resolution allows an application in more areas. Beside starch all substances show similar reflectance patterns and levels in the visible range and a distinction between the substances is not possible (Figure A1). But in the UV-range a differentiation between the substances is possible because each substance has a unique reflectance pattern, showing the potential of the UV-range to uncover invisible differences.
Due to the fact that UV-radiation (especially UV-B radiation from 280–315 nm) is known to be hazardous safety precautions for the person performing the measurements as well as the plant material must be given. While remote controls of both light sources and the linear axis ensure the safety of the person performing the measurements the power settings of the UV-light source had to be evaluated to optimize measurement quality without damaging the plant material. To qualitatively asses the interaction between UV-light and plant tissue the production of H2O2 was microscopically observed after DAB-staining which immediately polymerizes once it comes in contact with H2O2 [20]. Reactive oxygen species like H2O2 are known to be induced as a response to abiotic or biotic stresses [23] and can be be important modulators of programmed cell death, which is a genetically controlled process resulting in selective cell death of impaired cells [24]. As a response to UV-radiation plant cells display increased levels of ROS caused by disturbances of metabolic activities and elevated levels of activity of membrane-localized NADPH-oxidase [23]. In Arabidopsis thaliana the production of ROS was microscopically observed after irradiation with UV-C and a quick rise of ROS could be detected in chloroplasts and adjacent mitochondria [25]. In this study H2O2 was detected in all barley leaves illuminated with 2250–5000 lx indicating that barley leaves have to be illuminated with less than 2250 lx during measurements to exclude any tissue damage caused by UV-radiation. In compliance with these settings changes in reflectance are linked to applied stress induction which was realized with monitoring abiotic salt stress of barley leaves. However, low amounts of light with settings of 1000 lx lead to low intensities of 0.09 μ W/cm 2 /nm in the UV-C range, 0.1 μ W/cm 2 /nm in the UV-B range and 0.16 μ W/cm 2 /nm in the UV-A range when measuring with the Flame Spectrometer S. This demonstrates that lower wavelength ranges display a decrease in light intensities and therefor in the measurement quality. Due to that a compromise must be found between a light intensity that is non-harmful to plant tissue but still leads to a sufficient measurement quality. While in previous studies measuring quality was improved with the use of additional light sources [26] this would result in tissue damage in the UV-range. Within this imaging setup a further reduction of light intensity is not possible and deductions have to be made in the measurement quality.
Since plants undergoing salt stress experience an osmotic effect caused by a decrease of the osmotic potential of water [27] and the high salt concentrations in the soil inhibit the uptake of water, lead to osmotic stress [28], symptoms of chlorosis can appear. Additionally, an ionic effect due to an enhanced accumulation of salt ions in plant cells occurs [27], reducing the energy production and resulting in toxicity symptoms like chlorosis or necrosis caused by high amounts of natrium ions disturbing the protein synthesis and enzyme activity [29]. Plants undergoing salt stress exhibit a disruption of all major metabolic processes including photosynthesis, protein synthesis, and lipid and energy metabolism of the amino acid synthesis [30]. In this study, untreated barley leaves displayed a constant reflection from 1–5 days while barley leaves treated with 20 g NaCl/l phytoagar were represented by an increased reflection from 330 nm onward 4 and 5 dai, corresponding to first indications of chlorosis 4 dai. The increase in reflectance starting at 250 nm of barley leaves treated with 80g NaCl/l phytoagar from 4 dai onward is also in accordance with chlorosis symptoms visible at 4 dai. The constant vitality of untreated barley leaves 1–5 dai was in accordance with similar reflectance patterns and can be linked to consistent amounts of plant molecules absorbing in the UV-range like flavonoids, amino acids, anthocyanins [8,9,10]. Absorption features are represented by values smaller than one [31] and were mainly seen from 320 nm onward. This signal is determined due to the sensor data quality with high noise in the lower spectral regions and biological effects. Studies on chlorotic leaves of apple trees showed a decrease of soluble proteins and most free amino acids compared to healthy leaves due to a low activity of key enzymes in the amino acid synthesis [32]. The free amino acids also include phenylalanine and tyrosine, both of which feature absorption maxima at 280 nm. This decrease of amino acids in chlorotic tissue can explain an increase in reflectance at 280 nm of barley leaves incubated on 80 g NaCl/l phytoagar after four and five days. Previous studies with chlorotic tea leaves have shown that a number of metabolites belonging to the flavonoid metabolism were decreased in chlorotic tea leaves [33]. A decrease of flavonoids in chlorotic tissue can additionally contribute to an increased reflectance from 240–270 nm but also from 310–370 nm where flavonols and flavones (most common class of flavonoids) feature absorption maxima. Procyanidin is one of the flavonoles which demonstrated a decrease in chlorotic tissue and can be found in barley [34]. Since leaf reflectance from 400–750 nm is mostly influenced by plant pigments like chlorophyll and carotenoid [35] an increase of reflectance in the blue range of barely leaves treated with 20 and 80 g NaCl/l phytoagar can be correlated to a degradation of these pigments due to the development of chlorosis symptoms caused by salt stress. As high amounts of natrium ions disturb the protein synthesis and enzyme activity [29] in plants an increase of reflectance in the UV-range might be correlated to a change in the protein concentration. Proteins and peptides absorb UV-light due to being comprised of amino acids with aromatic side chains like tryptophan or phenylalanine which show strong UV-light absorption [36]. For a in depth connection of single plant compounds with reflectance patterns a detailed analytic or molecular analysis will be conducted as a next step. In addition time-series measurements of plants undergoing biotic stress will be carried out to characterize spectral signatures in the UV-range and to establish correlations to secondary plant metabolites. But although it was shown that in the UV-range a differentiation between the measured pure organic substances is possible, high-quality data of plants can not be generated in the lower spectral regions. This can lead to a difficult evaluation of the data and can limit the linkage to individual plant molecules.

5. Conclusions

This study introduces for the first time investigations of UV-hyperspectral imaging of plants for plant stress detection and phenotyping. An experimental layout for the monitoring of abiotic salt stress has been defined based on the preliminary experiments assessing the phototoxic effect of the used UV-illumination with UV-intensities of less than 2250 lx. By measuring different white substances it was demonstrated that an imaging UV line scanner produces comparable data to the Flame Spectrometer S with additional spatial resolution. Due to interactions of the sensor and the UV-illumination significant peaks were recorded in all measurements which could not be linked to specific plant molecules. A first study with hyperspectral measurements in the UV-range revealed new signals which are connected to plant derived compounds and enable a new perspective on monitoring stress processes in plants.

Author Contributions

A.B., J.B., S.P., M.T.K., U.S. and A.-K.M. designed the study. A.B., J.B., S.P. and A.-K.M. interpreted the data and drafted the manuscript. A.B. and H.-G.L. carried out the measuring. A.B., J.B., S.P. and P.S. did the analysis. A.B. maintained the plant material. A.-K.M., U.S. and K.K. directed the research and gave initial input. All authors read and approved the final manuscript.

Funding

The project is supported by funds of the German Federal Ministry of Food and Agriculture (BMEL) based on a decision of the Parliament of the Federal Republic of Germany via the Federal Office for Agriculture and Food (BLE) under the innovation support program.

Acknowledgments

The authors are thankful to Mahsa Namini for technical support and supporting microscopy examinations.

Conflicts of Interest

The authors declare no conflict of interest.

Abbreviations

The following abbreviations are used in this manuscript:
daidays after incubation
DAB3,3-diaminobenzidine
NIRnear-infrared spectroscopy
RMSEroot-mean-square error
ROSreactive oxygen species
SWIRshort-wavelength infrared
UVultraviolett
VISvisual spectrum

Appendix A

Figure A1. Spectral signatures of fructose, glucose, saccharose, potassium nitrate, sodium chloride and starch (a) and difference spectrum to glucose (b) measured with UV line scanner.
Remotesensing 11 01401 g0a1

References

  1. Mahlein, A.K.; Kuska, M.T.; Behmann, J.; Polder, G.; Walter, A. Hyperspectral sensors and imaging technologies in phytopathology: State of the art. Annu. Rev. Phytopathol. 2018, 56, 535–558. [Google Scholar] [CrossRef] [PubMed]
  2. Thomas, S.; Kuska, M.T.; Bohnenkamp, D.; Brugger, A.; Alisaac, E.; Wahabzada, M.; Behmann, J.; Mahlein, A.K. Benefits of hyperspectral imaging for plant disease detection and plant protection: A technical perspective. J. Plant Dis. Prot. 2018, 125, 5–20. [Google Scholar] [CrossRef]
  3. Carter, G.A.; Knapp, A.K. Leaf optical properties in higher plants: Linking spectral characteristics to stress and chlorophyll concentration. Am. J. Bot. 2001, 88, 677–684. [Google Scholar] [CrossRef] [PubMed]
  4. Slaton, M.R.; Raymond Hunt, E., Jr.; Smith, W.K. Estimating near-infrared leaf reflectance from leaf structural characteristics. Am. J. Bot. 2001, 88, 278–284. [Google Scholar] [CrossRef] [PubMed]
  5. Jacquemoud, S.; Ustin, S.L. Leaf optical properties: A state of the art. In Proceedings of the 8th International Symposium of Physical Measurements & Signatures in Remote Sensing, CNES, Aussois, France, 8–12 January 2001; pp. 223–332. [Google Scholar]
  6. Kuska, M.T.; Behman, J.; Mahlein, A.K. Potential of hyperspectral imaging to detect and identify the impact of chemical warfare compounds on plant tissue. Pure Appl. Chem. 2018, 9, 1615–1624. [Google Scholar] [CrossRef]
  7. Curran, P.J. Remote sensing of foliar chemistry. Remote Sens. Environ. 1989, 30, 271–278. [Google Scholar] [CrossRef]
  8. Fischer, J. Specific detection of nucleotides, creatine phosphate, and their derivatives from tissue samples in a simple, isocratic, recycling, low-volume system. LC GC Int. 1995, 8, 254. [Google Scholar]
  9. Giusti, M.M.; Polit, M.F.; Ayvaz, H.; Tay, D.; Manrique, I. Characterization and quantitation of anthocyanins and other phenolics in native Andean potatoes. J. Agric. Food Chem. 2014, 62, 4408–4416. [Google Scholar] [CrossRef] [PubMed]
  10. Talrose, V.; Yermakov, A.; Usov, A.; Goncharova, A.; Leskin, A.; Messineva, N.; Trusova, N.; Efimkina, M. UV/visible spectra. In NIST Chemistry WebBook, NIST Standard Reference Database; National Institute of Standards and Technology: Gaithersburg, MD, USA, 2009; p. 20899. [Google Scholar]
  11. Bhattacharya, A.; Sood, P.; Citovsky, V. The roles of plant phenolics in defence and communication during Agrobacterium and Rhizobium infection. Mol. Plant Pathol. 2010, 11, 705–719. [Google Scholar] [CrossRef]
  12. Mierziak, J.; Kostyn, K.; Kulma, A. Flavonoids as important molecules of plant interactions with the environment. Molecules 2014, 19, 16240–16265. [Google Scholar] [CrossRef]
  13. Santos-Buelga, C.; García-Viguera, C.; Tomás-Barberán, F. On-line identification of flavonoids by HPLC coupled to diode array detection. Methods Polyphen. Anal. 2003, 92, 127. [Google Scholar]
  14. Ali, R.; Abbas, H. Response of salt stressed barley seedlings to phenylurea. Plant Soil Environ. 2003. [Google Scholar] [CrossRef]
  15. Hollósy, F. Effects of ultraviolet radiation on plant cells. Micron 2002, 33, 179–197. [Google Scholar] [CrossRef]
  16. A.-H.-Mackerness, S.; John, C.F.; Jordan, B.; Thomas, B. Early signaling components in ultraviolet-B responses: Distinct roles for different reactive oxygen species and nitric oxide. FEBS Lett. 2001, 489, 237–242. [Google Scholar] [CrossRef]
  17. Van Breusegem, F.; Dat, J.F. Reactive oxygen species in plant cell death. Plant Physiol. 2006, 141, 384–390. [Google Scholar] [CrossRef]
  18. Tsormpatsidis, E.; Henbest, R.; Battey, N.; Hadley, P. The influence of ultraviolet radiation on growth, photosynthesis and phenolic levels of green and red lettuce: Potential for exploiting effects of ultraviolet radiation in a production system. Ann. Appl. Biol. 2010, 156, 357–366. [Google Scholar] [CrossRef]
  19. Witzenberger, A.; Hack, H.; Van Den Boom, T. Erläuterungen zum BBCH-Dezimal-Code für die Entwicklungsstadien des Getreides—Mit Abbildungen. Gesunde Pflanze 1989, 41, 384–388. [Google Scholar]
  20. Thordal-Christensen, H.; Zhang, Z.; Wei, Y.; Collinge, D.B. Subcellular localization of H2O2 in plants. H2O2 accumulation in papillae and hypersensitive response during the barley—Powdery mildew interaction. Plant J. 1997, 11, 1187–1194. [Google Scholar] [CrossRef]
  21. Wolf, G.; Fric, F. A rapid staining method for Erysiphe Graminis F. sp. hordei Whole Barley Leaves A Protein-Specif Dye. Phytopathology 1981, 71, 596–598. [Google Scholar]
  22. Kuska, M.; Wahabzada, M.; Leucker, M.; Dehne, H.W.; Kersting, K.; Oerke, E.C.; Steiner, U.; Mahlein, A.K. Hyperspectral phenotyping on the microscopic scale: Towards automated characterization of plant-pathogen interactions. Plant Methods 2015, 11, 28. [Google Scholar] [CrossRef]
  23. Nawkar, G.; Maibam, P.; Park, J.; Sahi, V.; Lee, S.; Kang, C. UV-induced cell death in plants. Int. J. Mol. Sci. 2013, 14, 1608–1628. [Google Scholar] [CrossRef] [PubMed]
  24. Gadjev, I.; Stone, J.M.; Gechev, T.S. Programmed cell death in plants: New insights into redox regulation and the role of hydrogen peroxide. Int. Rev. Cell Mol. Biol. 2008, 270, 87–144. [Google Scholar]
  25. Gao, C.; Xing, D.; Li, L.; Zhang, L. Implication of reactive oxygen species and mitochondrial dysfunction in the early stages of plant programmed cell death induced by ultraviolet-C overexposure. Planta 2008, 227, 755–767. [Google Scholar] [CrossRef] [PubMed]
  26. Mahlein, A.K.; Hammersley, S.; Oerke, E.C.; Dehne, H.W.; Goldbach, H.; Grieve, B. Supplemental Blue LED Lighting Array to Improve the Signal Quality in Hyperspectral Imaging of Plants. Sensors 2015, 15, 12834–12840. [Google Scholar] [CrossRef] [PubMed]
  27. Kosová, K.; Prášil, I.; Vítámvás, P. Protein contribution to plant salinity response and tolerance acquisition. Int. J. Mol. Sci. 2013, 14, 6757–6789. [Google Scholar] [CrossRef] [PubMed]
  28. Wu, D.; Cai, S.; Chen, M.; Ye, L.; Chen, Z.; Zhang, H.; Dai, F.; Wu, F.; Zhang, G. Tissue metabolic responses to salt stress in wild and cultivated barley. PLoS ONE 2013, 8, e55431. [Google Scholar] [CrossRef] [PubMed]
  29. Carillo, P.; Annunziata, M.G.; Pontecorvo, G.; Fuggi, A.; Woodrow, P. Salinity stress and salt tolerance. In Abiotic Stress in Plants-Mechanisms and Adaptations; InTech: Vienna, Austria, 2011. [Google Scholar]
  30. Parida, A.; Das, A. Salt tolerance and salinity effects on plants: A review. Ecotoxicol. Environ. Saf. 2005, 60, 324–349. [Google Scholar] [CrossRef]
  31. Clark, R.N.; Roush, T.L. Reflectance spectroscopy: Quantitative analysis techniques for remote sensing applications. J. Geophys. Res. 1984, 89, 6329–6340. [Google Scholar] [CrossRef]
  32. Wang, H.; Ma, F.; L, C. Metabolism of organic acids, nitrogen and amino acids in chlorotic leaves of ’Honeycrisp’ apple (Malus Domest. Borkh) Excessive Accumul. Carbohydrates. Planta 2010, 232, 511–522. [Google Scholar] [CrossRef]
  33. Zhang, Q.; Liu, M.; Ruan, J. Metabolomics analysis reveals the metabolic and functional roles of flavonoids in light-sensitive tea leaves. BMC Plant Biology 2017. [Google Scholar] [CrossRef] [PubMed]
  34. Kamimura, A.; Takahashi, T. Procyanidin B-3, isolated from barley and identified as a hair-growth stimulant, has the potential to counteract inhibitory regulation by TGF-beta1. Exp. Dermatol. 2002, 11, 532–541. [Google Scholar] [CrossRef] [PubMed]
  35. Thomas, J.; Gausman, H. Leaf reflectance vs. leaf chlorophyll and carotenoid concentrations for eight crops. Agron. J. 1977, 69, 799–802. [Google Scholar] [CrossRef]
  36. Okoronkwo, N.E.; Kalu, C.M.; Nnorom, I.C. Estimation of protein content and amino acid compositions in selected plant aamples using UV-Vis spectrophotometeric method. Am. J. Food Sci. Health 2017, 3, 41–46. [Google Scholar]
Figure 1. Hyperspectral UV-VIS imaging System with UV-VIS-line scanner, UV-light source, halogen light and line stage.
Remotesensing 11 01401 g001
Figure 2. Spectral signatures of fructose, glucose, saccharose, potassium nitrate, sodium chloride and starch, measured with UV line scanner and non-imaging Flame Spectrometer S. Light-blue and red areas around the mean spectra indicate the standard deviation. RMSE was calculated for each substance comparing both measurements.
Remotesensing 11 01401 g002
Figure 3. Microscopic observation of H2O2 generation after staining due to tissue damage in barley leaves stained with DAB after hyperspectral imaging with UV-light source with different illuminances from 300–5000 lx.
Remotesensing 11 01401 g003
Figure 4. Spectral signatures of barley leaves on 0 g, 20 g, 80 g NaCl/l phytoagar from 1–5 days after incubation, corresponding continuum removal and RGB images of one and five dai.
Remotesensing 11 01401 g004
Table 1. Technical properties of the Flame Spetrometer S and UV line scanner used in this study.
PropertiesFlame Spectrometer SUV Line Scanner
manufacturerOcean OpticsHeadwall Photonics
sensor typenon-imagingimaging
wavelength range190–1100 nm250–500 nm
spectral resolution0.11 nm14 nm (961 bands)
spatial resolution-1392 px
frame rate 400 Hz7 Hz
movement speed between x- and y-axis-0.141 mm/s
measuring softwareFlame 1.6.7Hyperspec III
image sensor name-Intevac Microvista Kamera

