1. Introduction
Many modern spaceborne SAR systems rely on complex antenna systems to steer the radar beam [
1,
2], shape its pattern [
3] or to generate several phase centers [
4]. This is only feasible by applying sophisticated antenna models to predict the properties of the radiated electromagnetic field for the given control settings. Modern spaceborne SAR systems, like Sentinel-1, can have thousands of beam settings which cannot be measured individually [
5,
6]. Employing an antenna model reduces significantly the verification effort [
7]. The model forces physically reasonable behavior and, hence, needs only to be verified for a limited number of respective measurements. These measurements have to be performed on ground before launch (e.g., measurement of embedded patterns) and finally be verified again in space. One major task in verifying the antenna model under realistic conditions in space is ascertaining the antenna pointing in elevation and azimuth with respect to the model prediction [
8].
There are several well-established techniques to determine the antenna beam pointing: homogeneous distributed targets like the Amazon rainforest are used to determine the antenna pointing in elevation [
9]. Measurements performed with ground receivers [
10,
11] and the evaluation of the Doppler centroid are often applied to retrieve the antenna pointing in azimuth. This paper focuses on the determination of the antenna pointing in elevation, at any region, i.e., also regions without homogeneous distributed targets.
The Amazon rainforest is the most widely used target in elevation antenna pointing determination for many state-of-the-art SAR missions [
5,
12,
13]. Unfortunately, if the pointing varies along the orbit, the observation period is too limited to capture such variations. For reflector antenna based SAR missions, like Tandem-L [
14] or Biomass [
15], these kind of variations of the antenna pointing along the satellite’s trajectory are expected and have to be addressed. Furthermore the Amazon rainforest may no longer be assumed homogeneous for these low frequency SAR systems as the radar signal is not solely scattered at the canopies of the trees [
16].
In this paper we will introduce a technique to determine the elevation antenna pointing for non-homogeneous areas. We will first describe the methodology currently used to determine the antenna pointing in elevation in
Section 2 and then outline the proposed novel technique in
Section 3. The performance of the algorithm is analyzed in
Section 4 by simulation and in
Section 5, experimental data acquired with the TerraSAR-X satellite illustrate the performance of the approach under realistic conditions.
2. Antenna Pointing Determination in Elevation for Spaceborne SAR Systems
Homogeneous distributed targets are recognized as valuable references for retrieving the SAR antenna pattern in elevation. After compensating for deterministic behavior of these targets, like a known incidence angle dependency, variations of SAR data can be attributed to changes in the antenna gain. Dedicated antenna patterns like the one from a mono-pulse or notch beams provide a characteristic steep gain drop into a certain (predictable) radiation direction which can be detected and analyzed in a reliable way [
17] to determine a potential discrepancy between predicted and actual antenna pointing.
There are several homogeneous distributed targets conceivable for SAR antenna pointing estimation in elevation: The rainforest in the Amazon region is the most widely used reference target. Other rainforest areas (e.g., Cameroon) are less commonly used, mainly due to their smaller extent. Similarly, certain deserts and ice regions could be used, but they often suffer either from low backscatter or from long-term availability.
The conventional technique uses a notch pattern to extract the antenna elevation pointing from the level 1 SAR data. Antenna pattern correction is not applied to these data. The method is conducted according to the following steps:
masking of known inhomogeneities like rivers or deforested areas,
converting the radar brightness
given in the single-look (SLC) complex SAR data to normalized
-values by
where
is the local incidence angle,
averaging a sufficiently large among of range lines along azimuth to compensate for fluctuations in the backscatter of the scene,
and comparing the retrieved -profile to the expected elevation profile extracted from the antenna model. The shift between both profiles equals the expected pointing offset.
Step (1) accounts for the variation in the incidence angle and, hence, the illuminated area. In step (2) the antenna pattern estimation is improved by removing a-priori known areas which are not rainforest. These areas would increase the variability of the scene and would hence deteriorate the pattern estimate. The averaging done in step (3) is performed along azimuth direction. It assumes that the shape of the pattern is constant in azimuth direction in the focused SAR data, which is fulfilled as along as the SAR antenna pattern is stable over the integration time.
The last operation (step 4) can be conducted in several ways: The position of the notch can be evaluated by curve fitting, e.g., using a polynomial to reliably estimate the notch position instead of just finding the smallest power value over elevation [
6,
17]. Uncertainties of less than 8 mdeg have been reported using this approach [
17]. As an alternative, the offset between predicted (from antenna model) and actual (measured) notch position can be retrieved using a correlation technique. This method is described in more detail in
Section 3 as it has several advantages when used in combination with the hereafter proposed technique.
3. Coherent Pointing Estimation Using Notch and Boresight Pattern
3.1. Difference Pattern Approach
The main drawback of the conventional pointing estimation technique as described in the previous section is the requirement for homogeneous distributed targets, like the Amazon rainforest. This kind of targets are unfortunately sparsely spread around the globe. Hence, they cannot be used to track pointing variations along the orbit which may arise due to thermal and gravity induced changes in the surface shape of large deployable reflector (LDR)-based antenna systems proposed for various future SAR missions [
18].
Inhomogeneous distributed targets could be employed for more continuous elevation pointing estimation if the variations in the backscatter from ground could be compensated for. The proposed technique combines two coherent SAR datasets to mitigate the effect of the underlying scene. With the target scene vanishing, the differences in the antenna pattern become apparent (neglecting noise for the moment).
From the images of the two recorded coherent SAR datasets, a difference dataset can be generated which is modeled as follows:
The two level 1 SAR images used to form the difference image
are described as the combination of the underlying scene
, propagation effects
, the antenna pattern
,
, and noise
,
, respectively. The variables
t and
account for the two-dimensional nature of the scene in slow and fast time. All terms in the equation are complex-valued and
has the form of scattering coefficients. The variations in the underlying scene
and the propagation effects
can be neglected if the two datasets are acquired coherently at the same instant of time, i.e., in the same overpass. Hence, only the difference in the antenna pattern
remains, if noise and ambiguity contributions can be neglected:
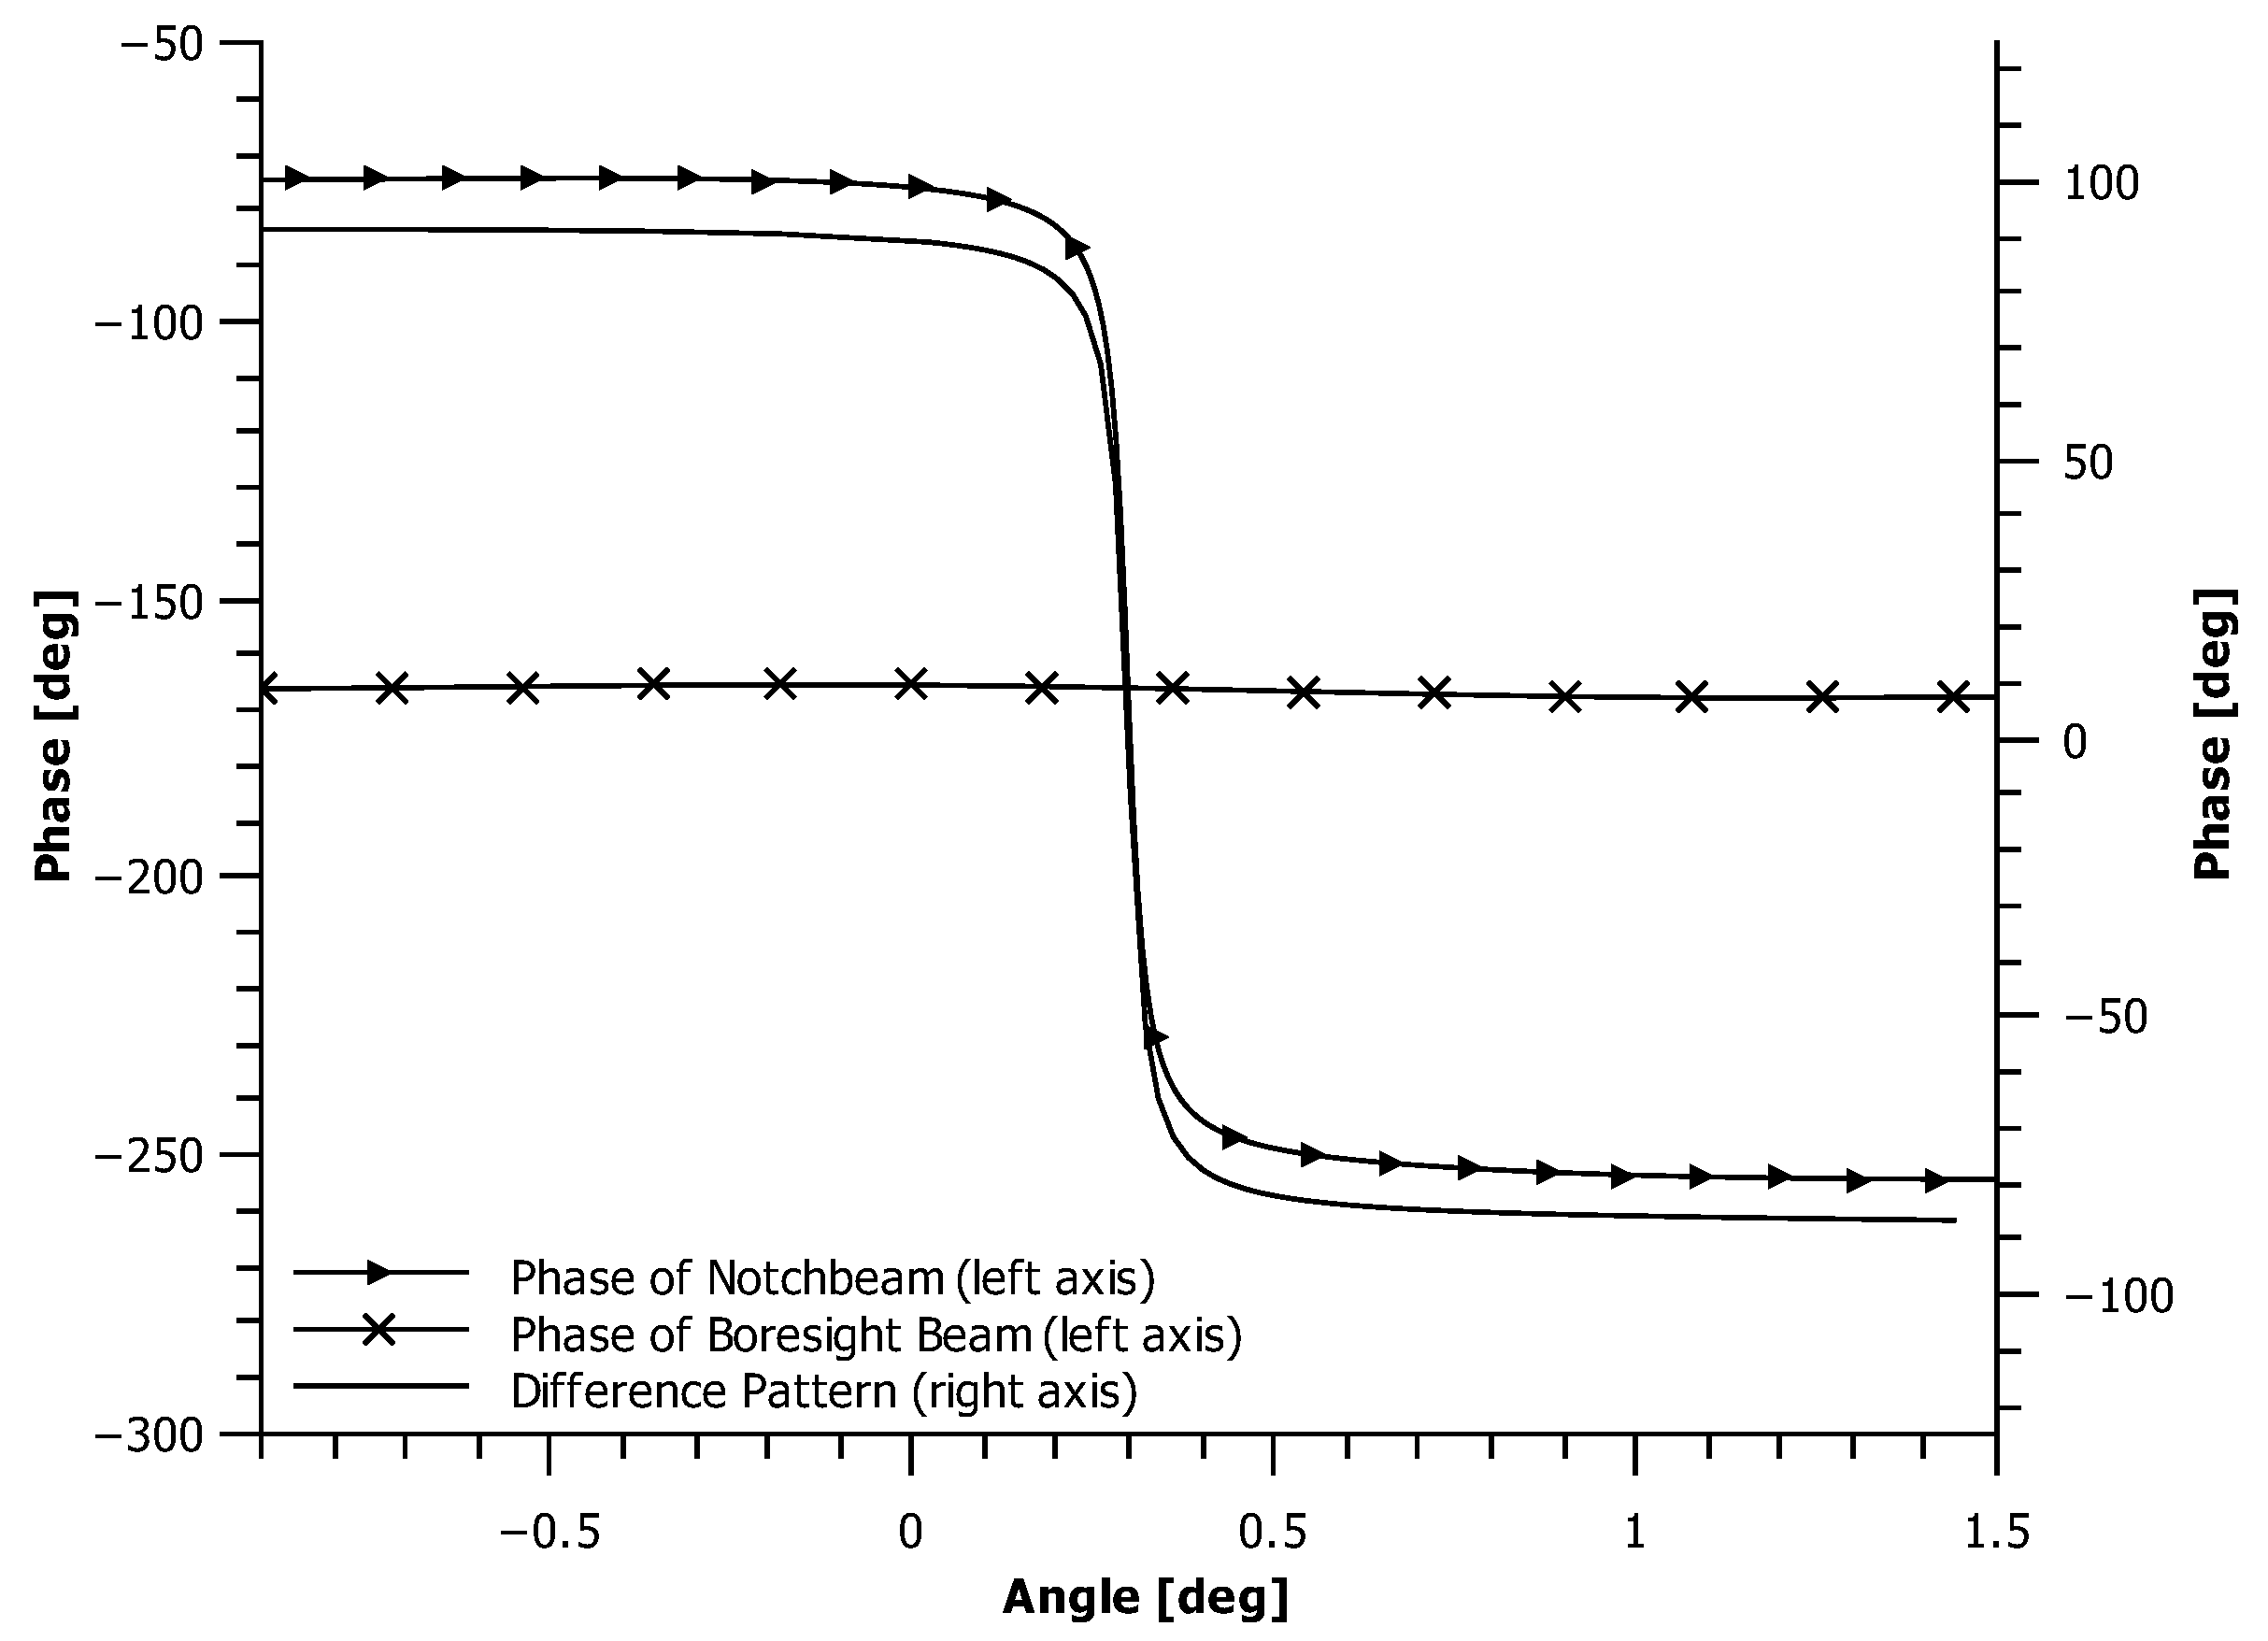
This concept is valid for any combination of antenna patterns and not limited to notch beams. By selecting characteristic patterns, their differences can be analyzed to retrieve information about the antenna pointing. One promising selection of antenna patterns is the combination of a notch/mono-pulse pattern with its steep null in elevation direction and a nominal boresight beam pattern with its nearly flat gain response along elevation. This selection yields a difference dataset with characteristic properties which can be used to estimate the antenna pointing in elevation without disturbances by the underlying scene. Hence, even the
-correction step required in the conventional method is not necessary. It should also be stressed that no assumption upon the recorded scene is necessary, not even its homogeneity has to be known for deriving the elevation pointing as long as sufficient energy is scattered back to the sensor (i.e., noise term in Equation (
2) is negligible).
A major advantage of the difference technique proposed here in comparison to the conventional technique is the availability of both amplitude and phase information for further analysis. In the conventional elevation pointing estimation technique only the power information, i.e., the gain drop of the notch pattern could be used because the amplitude behavior of the scene (homogeneous distributed target) is known while the (backscatter) phase is random. The estimation of the elevation antenna pointing using the coherent difference method as proposed here allows the extraction of both, amplitude and phase, from the difference dataset. Hence, also the unique phase shift at the notch position of the mono-pulse beam can be exploited in addition to the amplitude information for a more reliable pointing estimation.
3.2. Pointing Retrieval Using Correlation Technique
The generated complex-valued profile has two degrees of freedom: amplitude and phase. In addition to the gain drop of the notch pattern at boresight, also the
phase change at the notch position is characteristic and can be retrieved in the profile. While polynomial fitting is often used for conventional pointing estimation [
8], a joint estimation of amplitude and phase is advantageous for the here mentioned technique as more information about the antenna pointing is available. The joint estimation can e.g., be performed by complex-valued correlation between the measured elevation profile and the predicted range profile derived, e.g., from an antenna model.
The complex-valued cross-correlation function is defined as:
where
f and
g are the complex measured and predicted range profiles in gain and phase, ⋆ is the correlation operator,
denotes the complex conjugate of
f, and
N is the number of samples. From the location of the amplitude peak of the correlation function the misalignment can be estimated. To verify the accuracy of the whole pointing estimation process, the sample Pearson correlation coefficient between measured and modeled range profiles is proposed. An amplitude value close to 1 signifies a good agreement while values near 0 indicate no correlation.
3.3. Acquisition Strategies
A challenge for the proposed technique is the demand to acquire two different coherent SAR datasets at the same time using only one satellite. Two techniques are proposed to achieve this requirement:
doubling of the PRF (pulse repetition frequency): The two datasets are interleaved sampled by doubling the PRF. Even pulses are used to generate one SAR image; odd numbers are used for the other image. This approach shrinks the effective swath width to
to still satisfy the azimuth sampling requirement. The experimental data presented in
Section 5 have been acquired using this approach.
digital beam forming (DBF): Some upcoming SAR missions employ DBF to generate their receive beams, e.g., Tandem-L. The DBF concept also allows to generate the two input SAR dataset by means of digital signal processing without affecting the effective swath width. This solution will be the preferred approach in the frame of Tandem-L.
The proposed pointing retrieval technique can be summarized as follows. Two coherent datasets of the same scene have to be acquired using either of the two proposed methods. After generating the difference dataset and optionally converting it to
-values, the derivation of the range profile is to be performed in complex domain. The pixel lines along azimuth have to be consolidated to points of the range profile. Besides the commonly used mean operator which is the basis for the conventional method described in
Section 2 other operations like forming the median can be beneficial. The generated measurement profile is compared to the predicted profile from the antenna model and the offset between both profiles is retrieved using the above-discussed correlation method. Alternatively, the profiles could be matched by detecting the minimum power level in both profiles or applying a polynomial fitting.
4. Performance Prediction
Although no assumptions on the homogeneity of the scene are required some theoretical limitations for the proposed technique have to be considered:
sufficient SNR: the technique is affected by low SNR (Signal-to-Noise Ratio). Without sufficient signal power from the scene, the antenna pattern cannot be reliably estimated. This is true for all SAR acquisitions
scene length: to gain a stable and defined range profile, data of several range lines are combined. Depending on the number of samples used, the uncertainty of the estimate will be reduced. Hence, the scene length in azimuth is an important parameter for the antenna pointing estimation.
Both aspects will be analyzed in the following two sections.
4.1. SNR Dependency
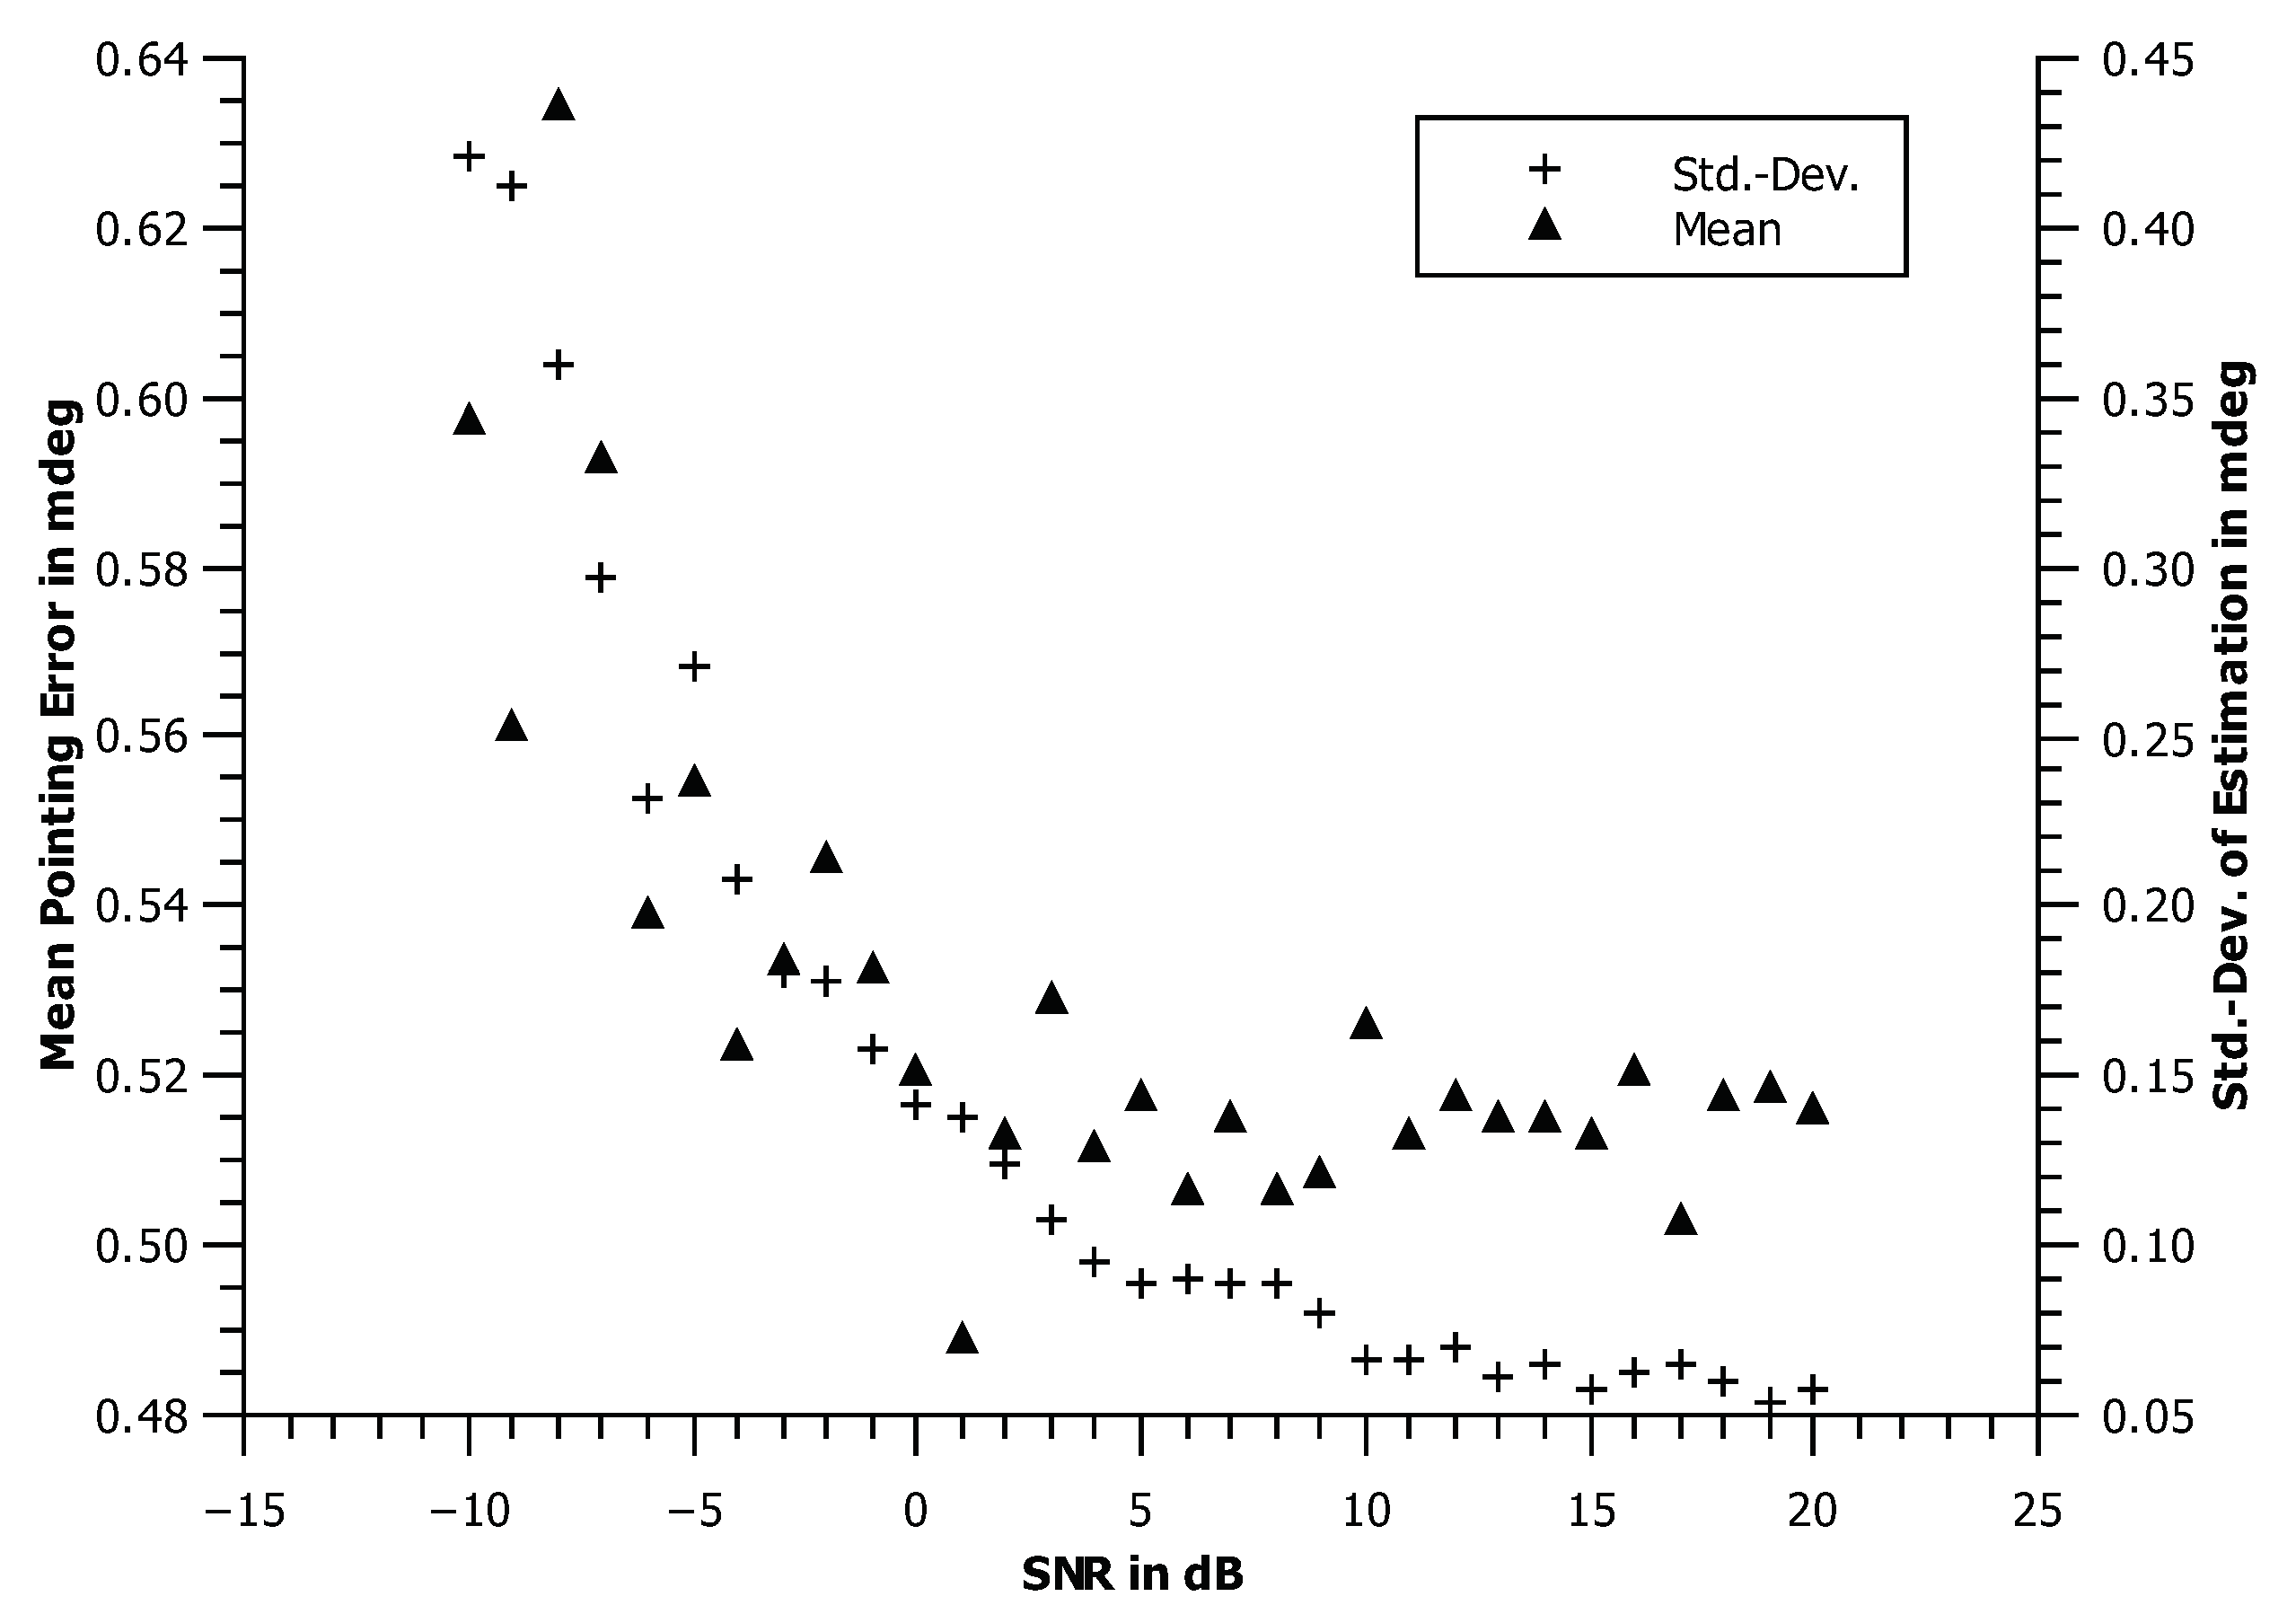
The effect of low SNR is further analyzed by Monte Carlo simulations. The simulations (parameters are listed in
Table 1) start with generating an artificial noise-like SAR scene on which the antenna pattern in elevation is applied to. After adding white noise, the pointing is estimated as described in the previous section using the correlation method. The performance for various SNR values is shown in
Figure 1.
As expected the standard deviation of the pointing estimation decreases with higher SNR (right scale, +-sign). It is always below 0.5 mdeg for the given parameters. The residual pointing error (left scale, ▴-sign) also decreases and saturates at 5dB SNR to about 0.52mdeg.
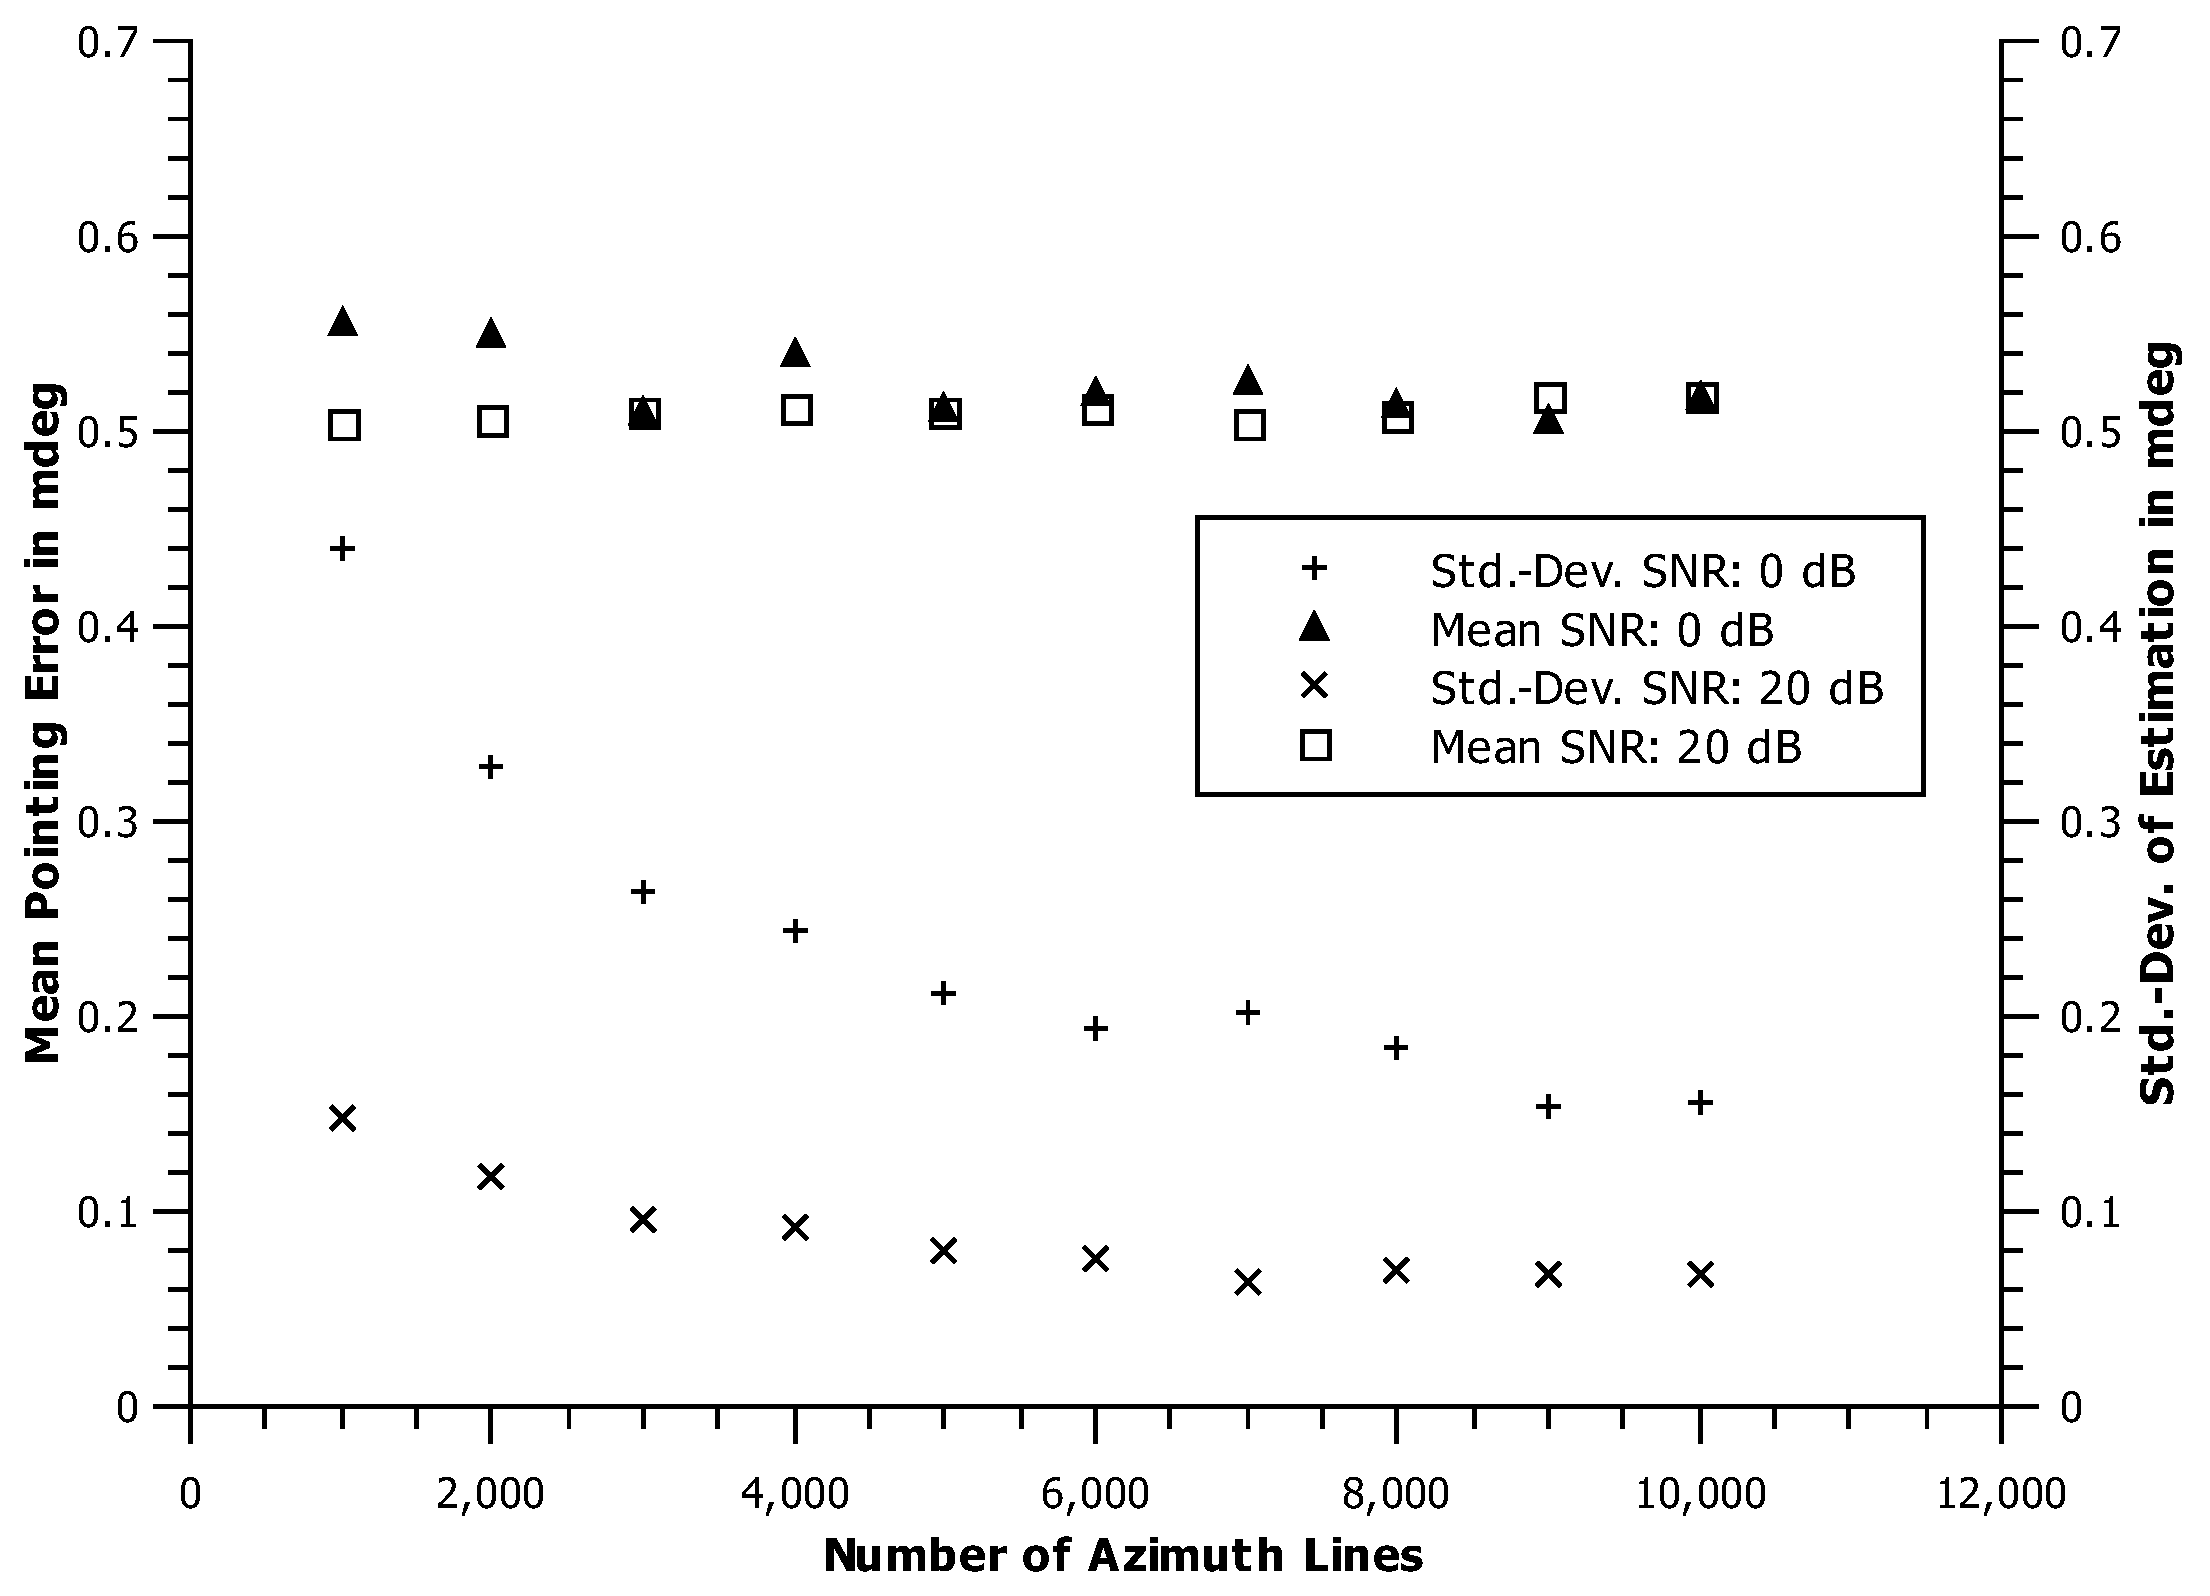
4.2. Scene Length Dependency
A second simulation was performed to estimate the influence of the scene length in azimuth on the performance of the pointing estimation. Again, the mean operator has been used to derive the
-profile. The simulation parameters are given in
Table 2 and the results are shown in
Figure 2. As expected, the standard deviation decreases with scene length. For the SNR = 20 dB case (×- and □-sign) the standard deviation is already much lower for 1000 azimuth lines than for a SNR of 0 dB (+- and ▴-sign) as analyzed in the last section (c.f.
Figure 1). The mean pointing error saturates at 0.5 mdeg very quickly with the chosen simulation parameters. The standard deviation further decreased asymptotically to about 0.1 mdeg.
It can be concluded that the SNR of the scene has an effect on the performance of the proposed technique, but can be controlled and partly compensated for by the length of the scene in azimuth. The actually required scene length and SNR strongly depend on the underlying scene and its variability.
A detailed treatment of range and azimuth ambiguities which can emerge due to improper timing and which are neglected in Equation (
2) is out of scope of this paper. The notch beam is, in general, more prone to range ambiguities as the maximum gain of a notch pattern lies on the edges of the illuminated scene while there is low gain in the central part. This stays in contrast to a nominal boresight beam and has to be considered in the timing of the SAR instrument, namely the PRF (pulse repetition frequency) and the range start time to limit range ambiguities. The impact of ambiguities on the antenna pointing estimation is found to be low, as long as the emergence of ambiguities is well controlled by adapting the timing and the length of the scene in azimuth is sufficient.
5. Demonstration Using TerraSAR-X
After analyzing the theoretical performance of the proposed method, results from acquisitions using the TerraSAR-X satellites are shown. The data were recorded using the so-called ‘Aperture Switching’ mode which is an experimental mode with dedicated commanding. The satellite was not designed for such experimental data takes which results in additional constraints and draw-backs, e.g., a too broad illumination of the scene for the given timing, which causes additional range ambiguities.
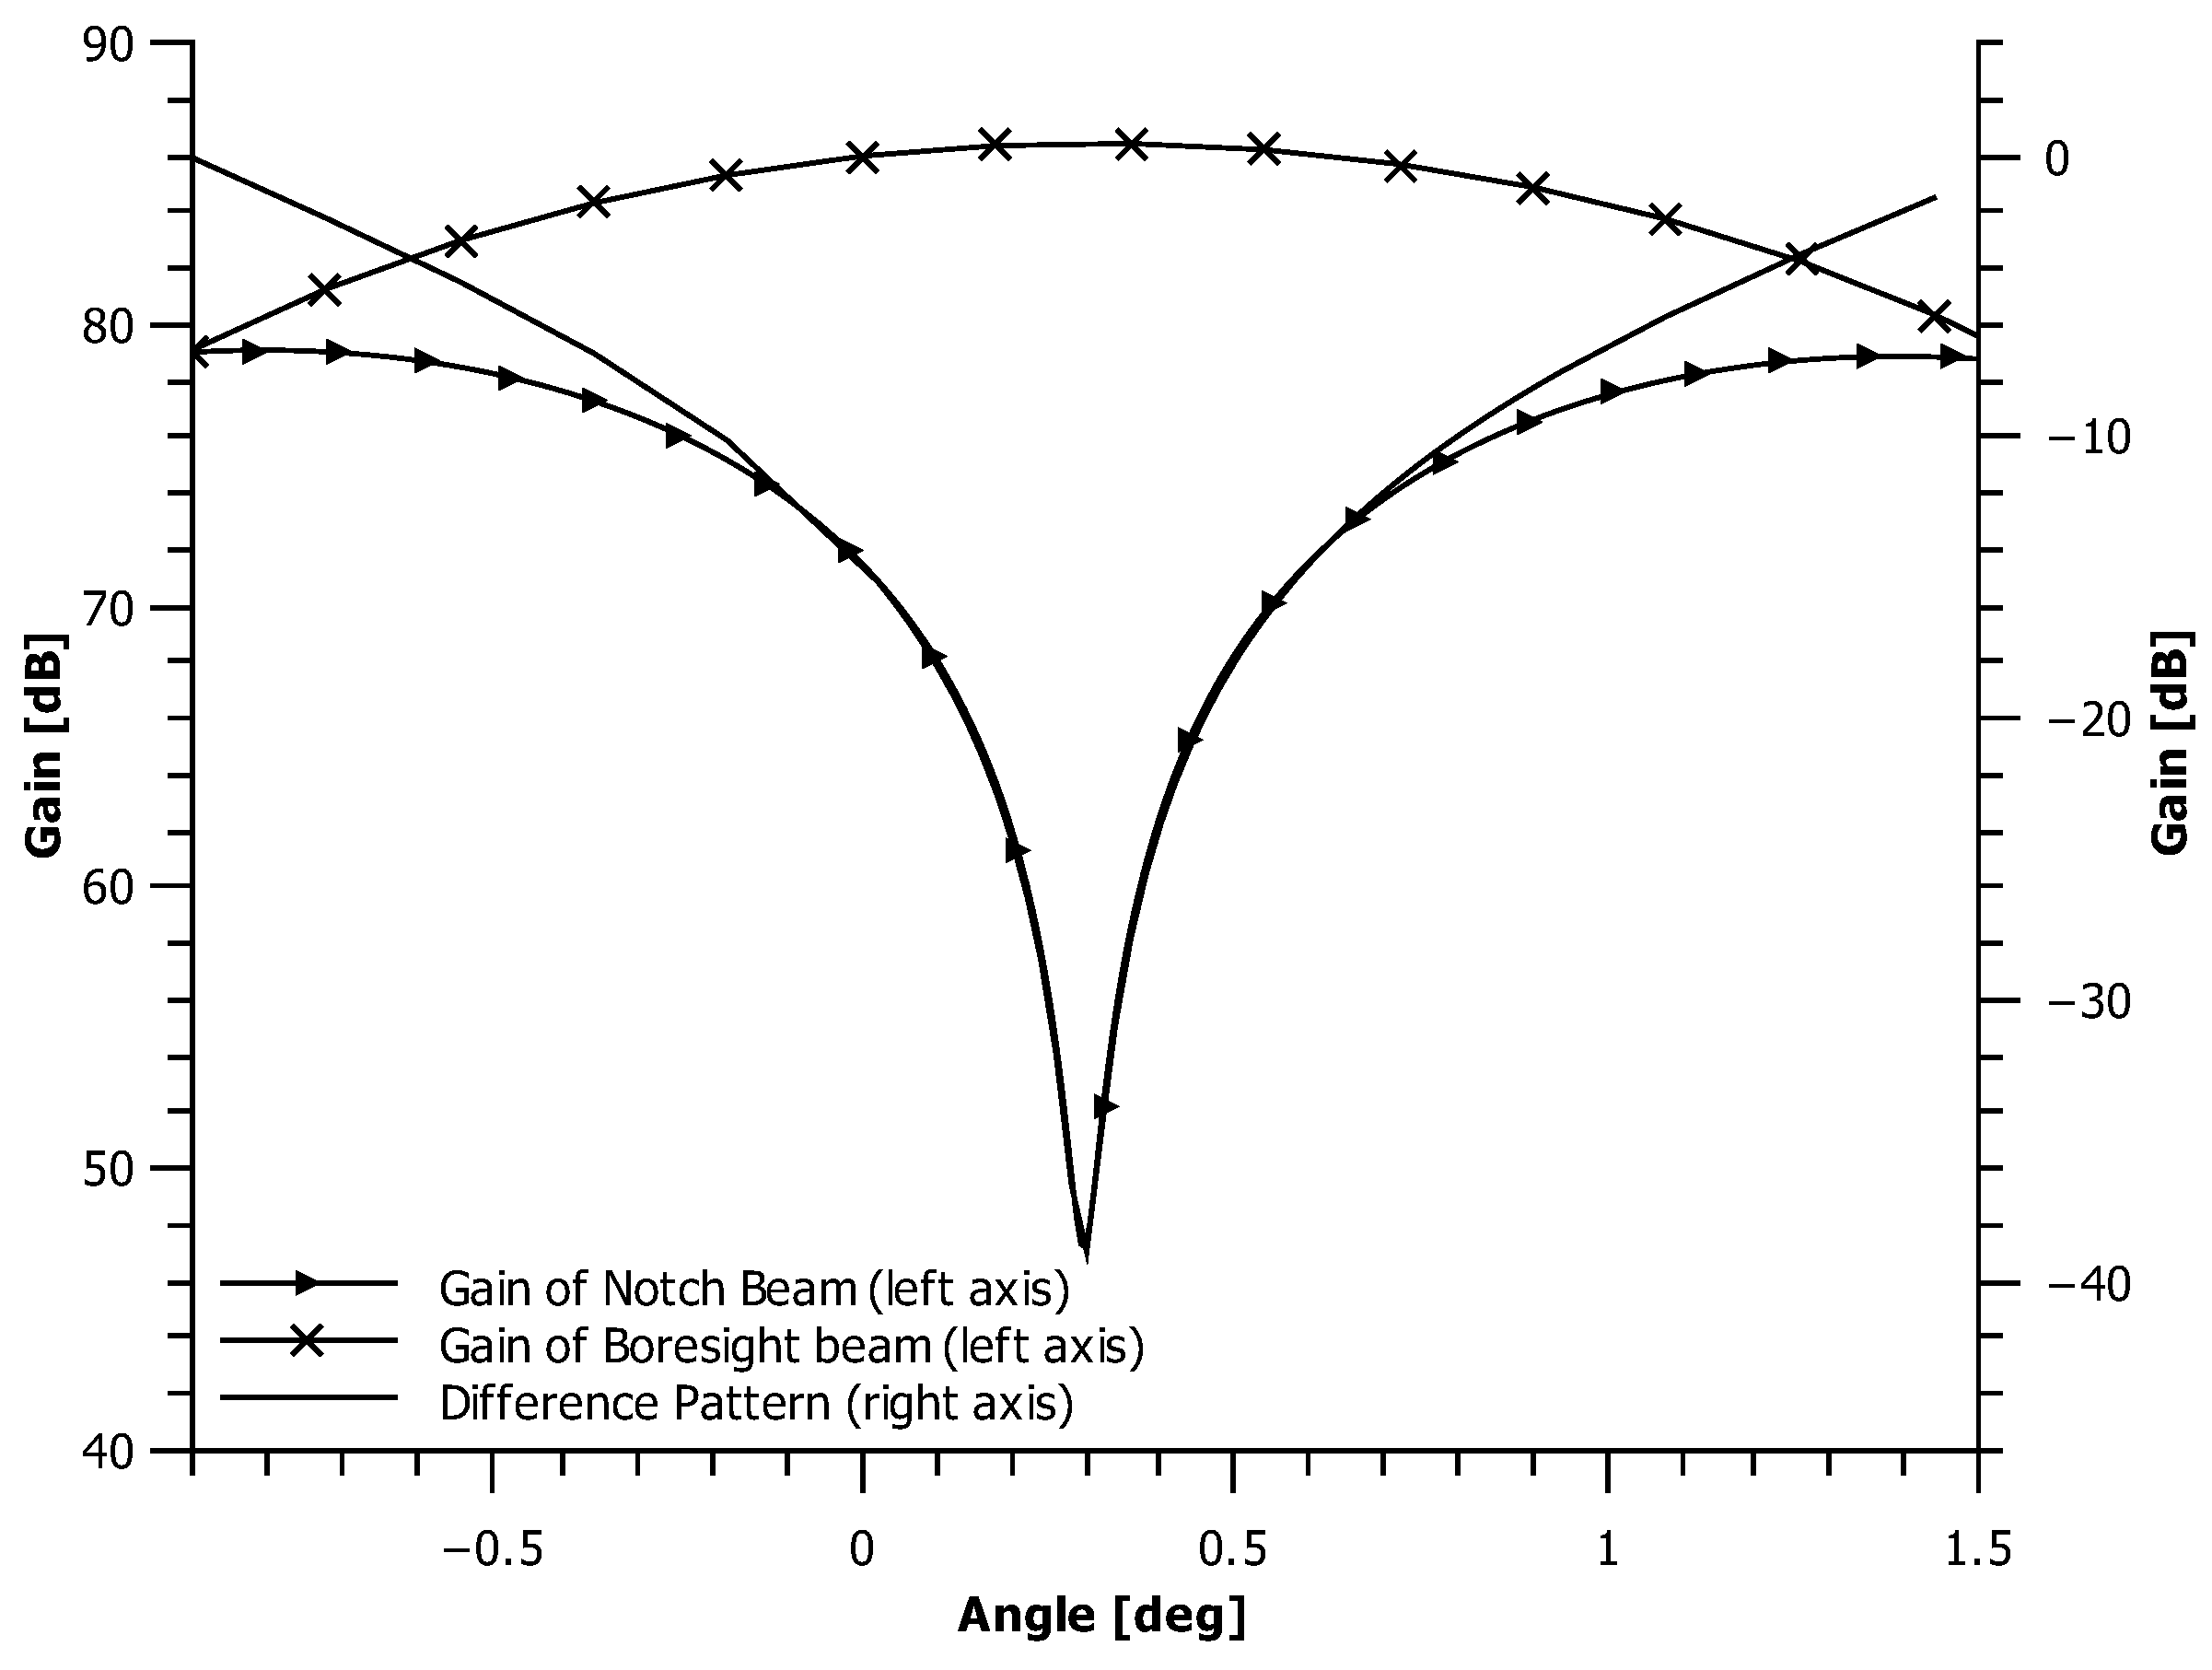
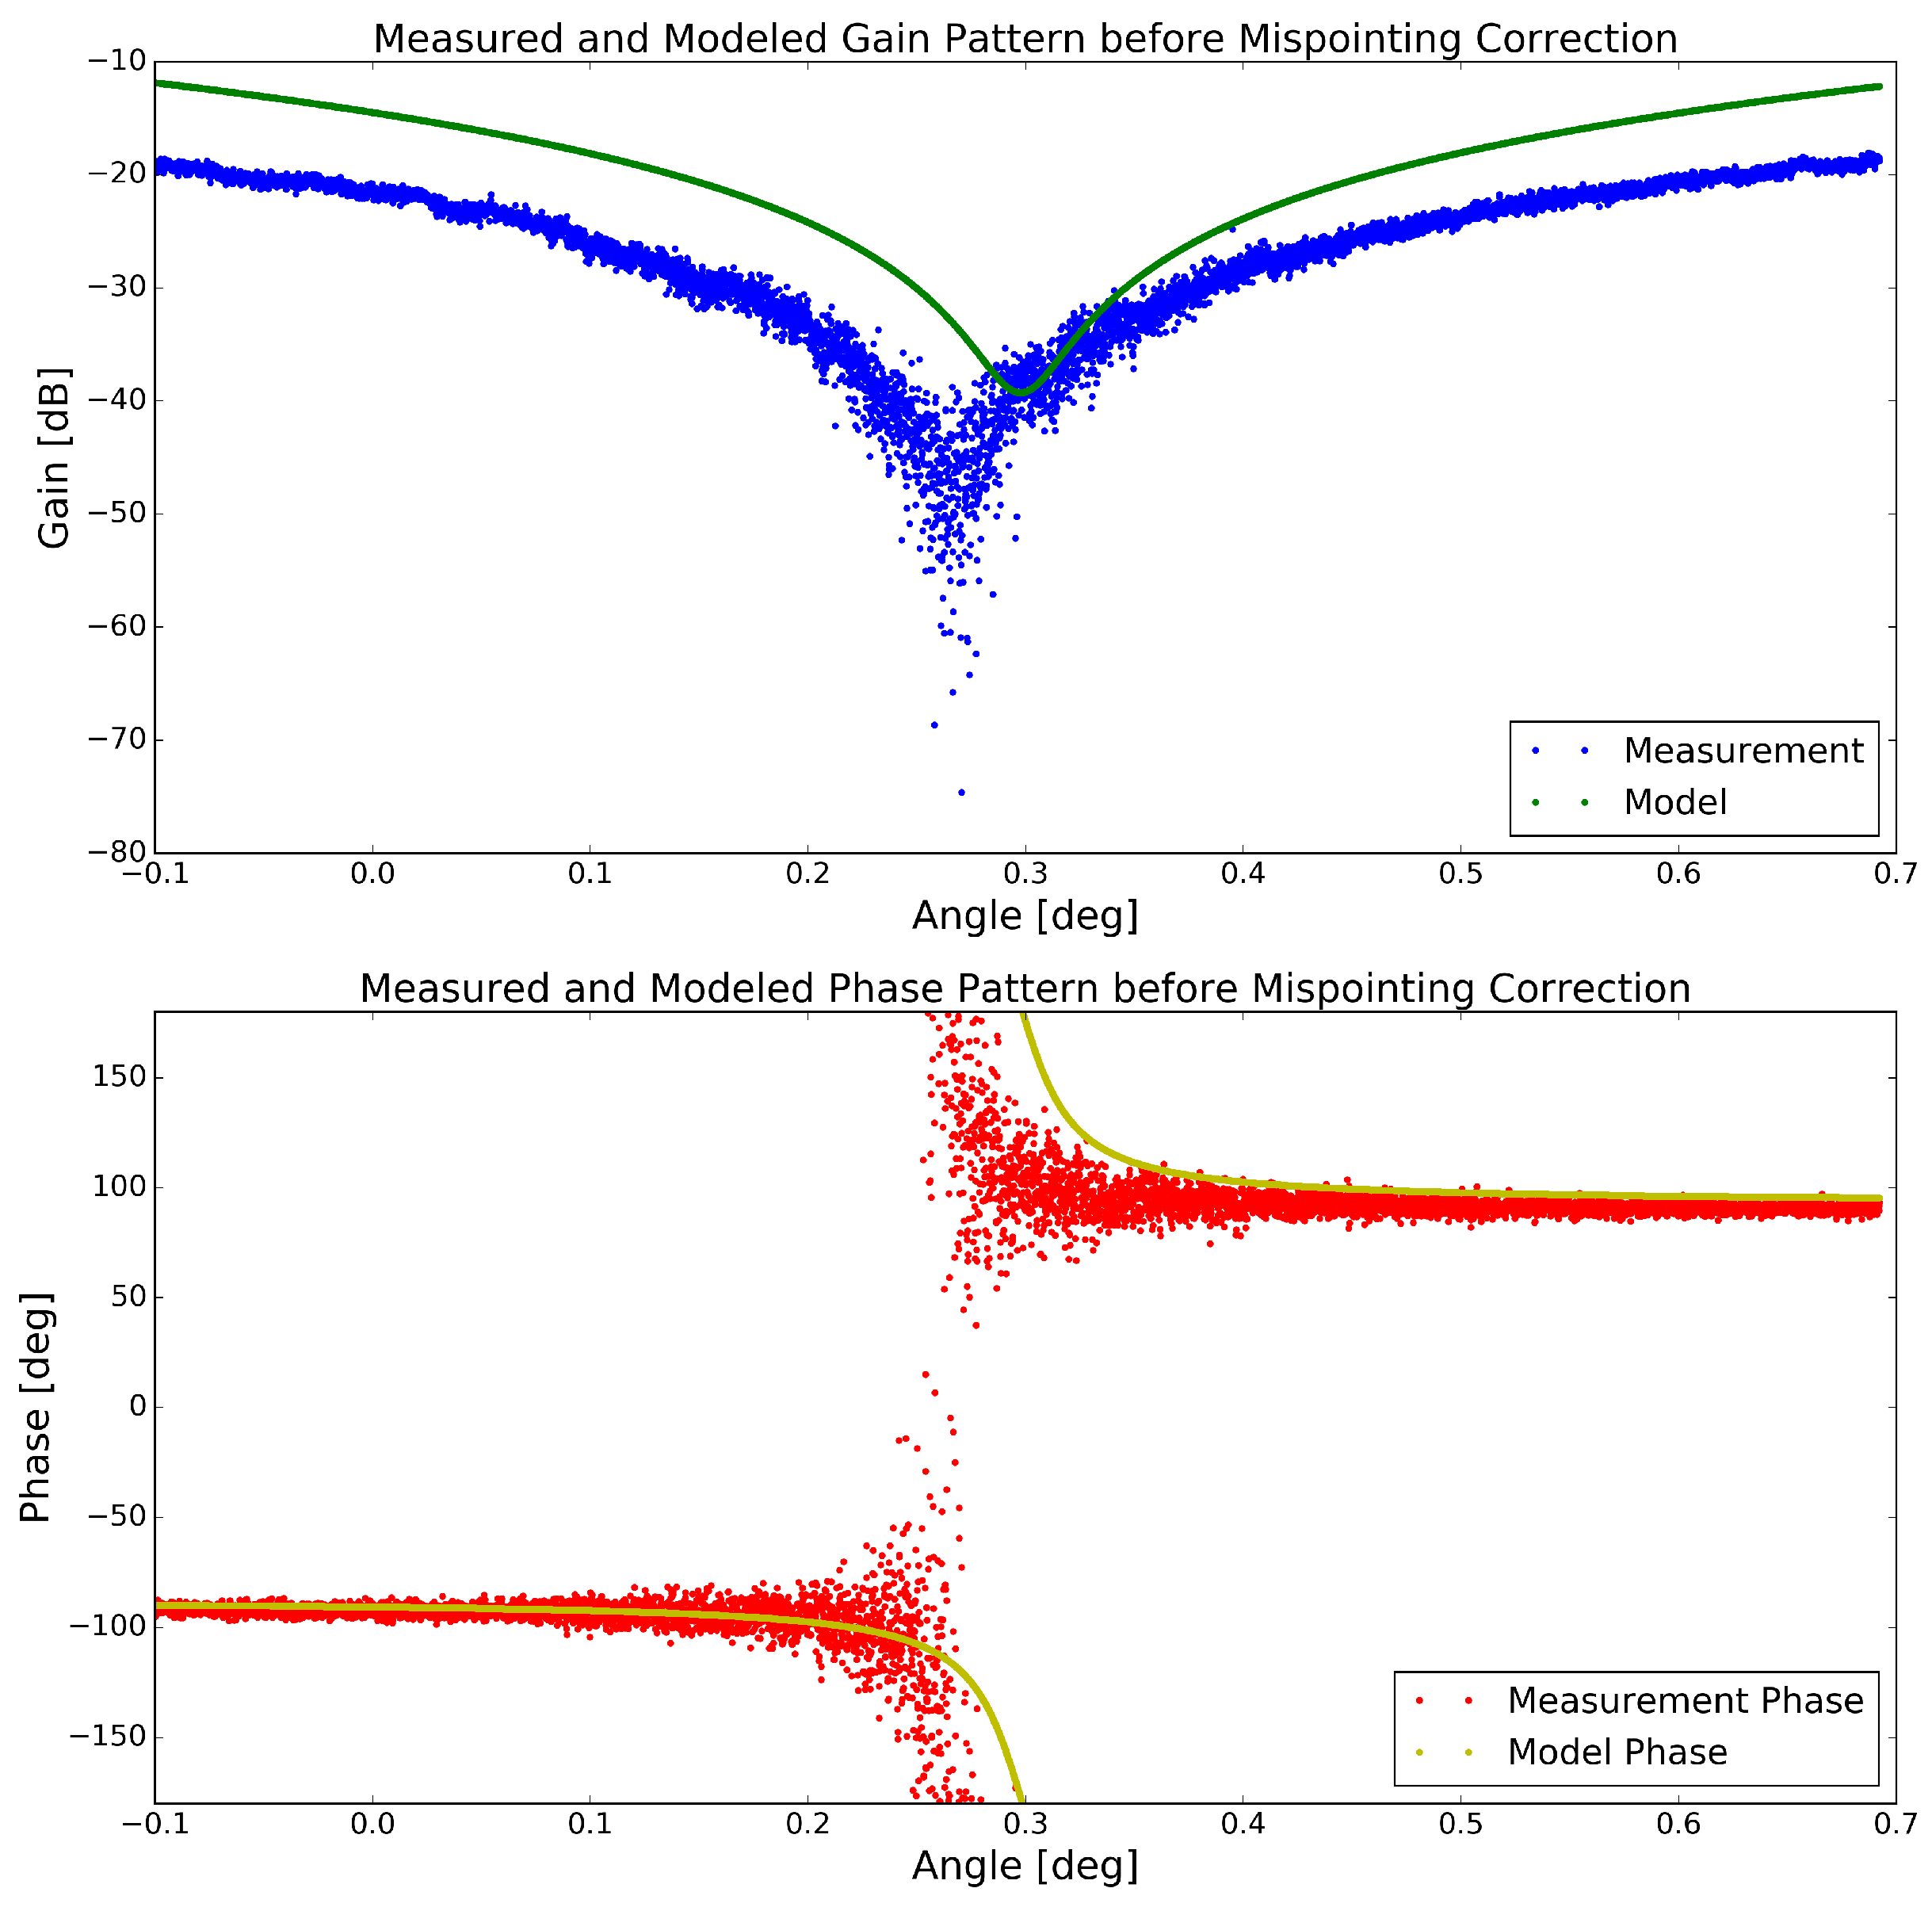
As analyzed before, a notch and a boresight beam pattern are used for the two coherent SAR datasets. The theoretical antenna pattern of both beams in power and phase as generated by the TerraSAR-X antenna model are shown in
Figure 3 and
Figure 4 along with the calculated difference pattern to be found in the measured data later. The presented data has been acquired by interleaved sampling of the two SAR datasets and doubling the PRF as described above.
5.1. Homogeneous Scene: Amazon Rainforest
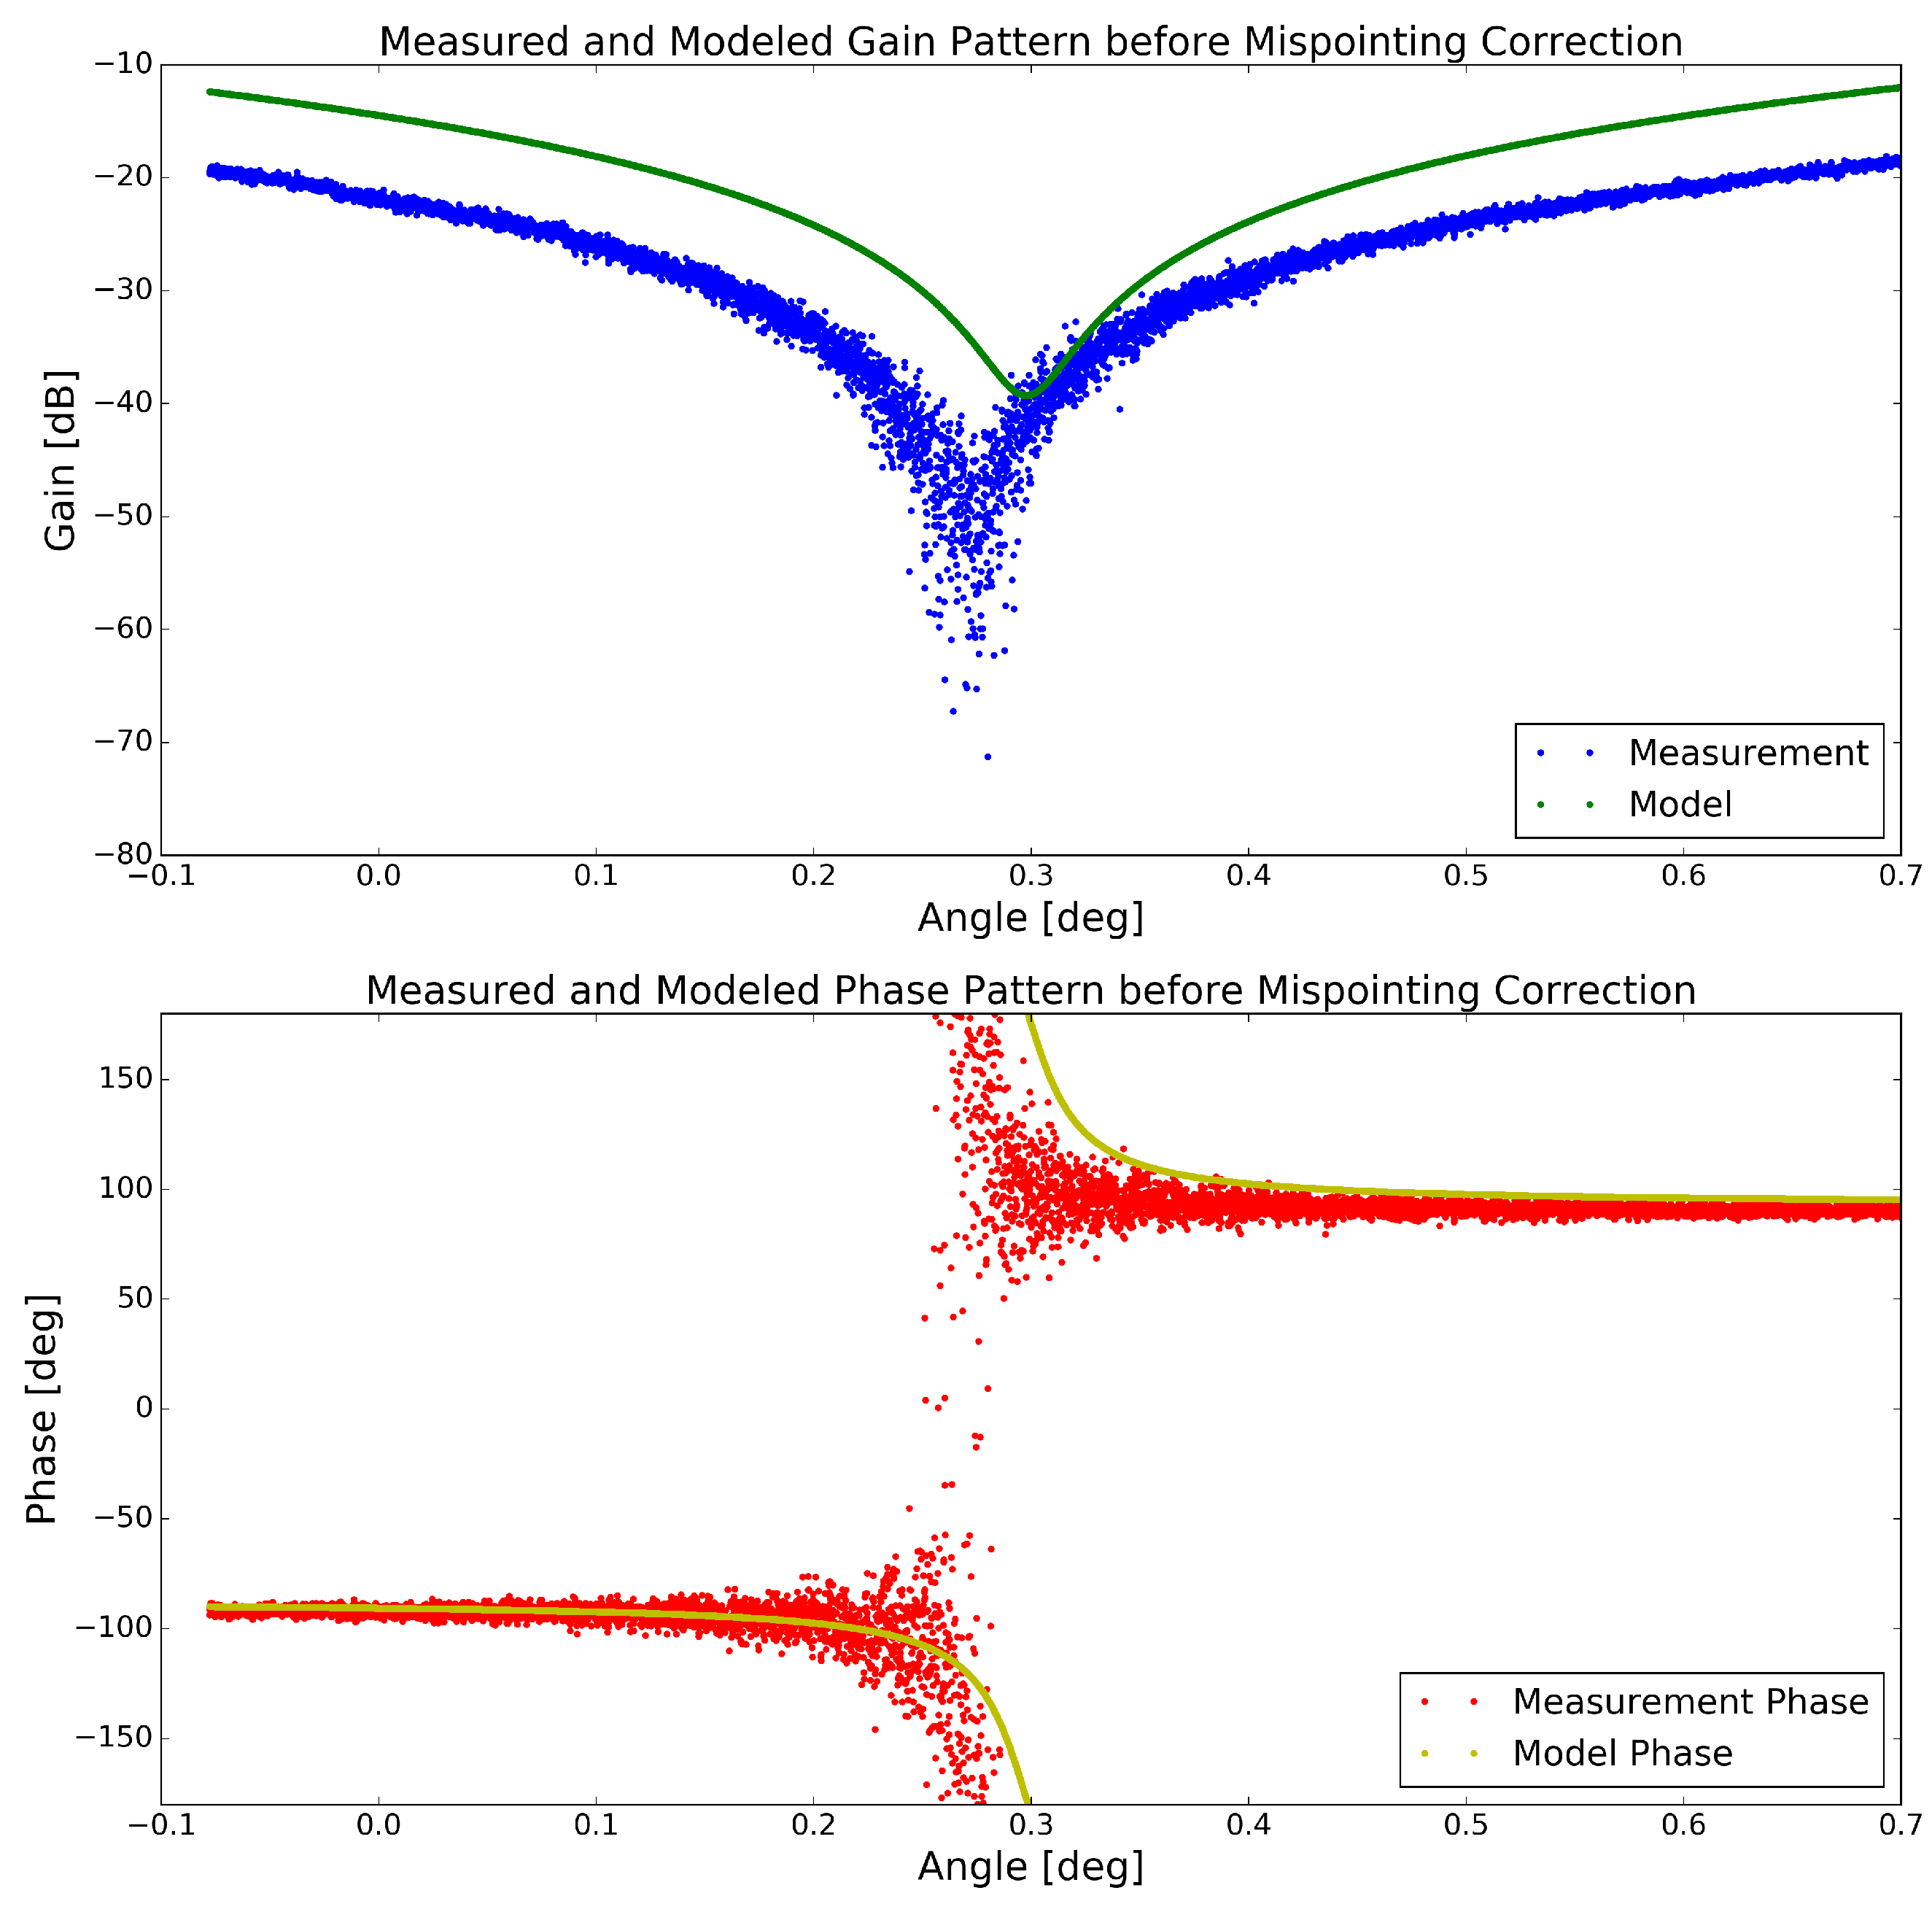
A scene of homogeneous distributed scatterers in the Amazon rainforest has been acquired as the reference scenario to compare with the conventional method. The difference dataset in amplitude and phase is shown in
Figure 5 without masking perturbations like rivers which is usually done for the conventional method [
17]. From this difference dataset, the profile shown in
Figure 6 has been generated by the complex mean operator and can be compared to the expected gain and phase profiles from
Figure 3 and
Figure 4. The steep zero in the top panel equals the expected antenna gain pattern and the
phase jump is also clearly visible in the bottom plot. The expected notch position and the gain drop in the profile are both at about
elevation angle with no visible discrepancy as expected for a well-calibrated system like TerraSAR-X [
8].
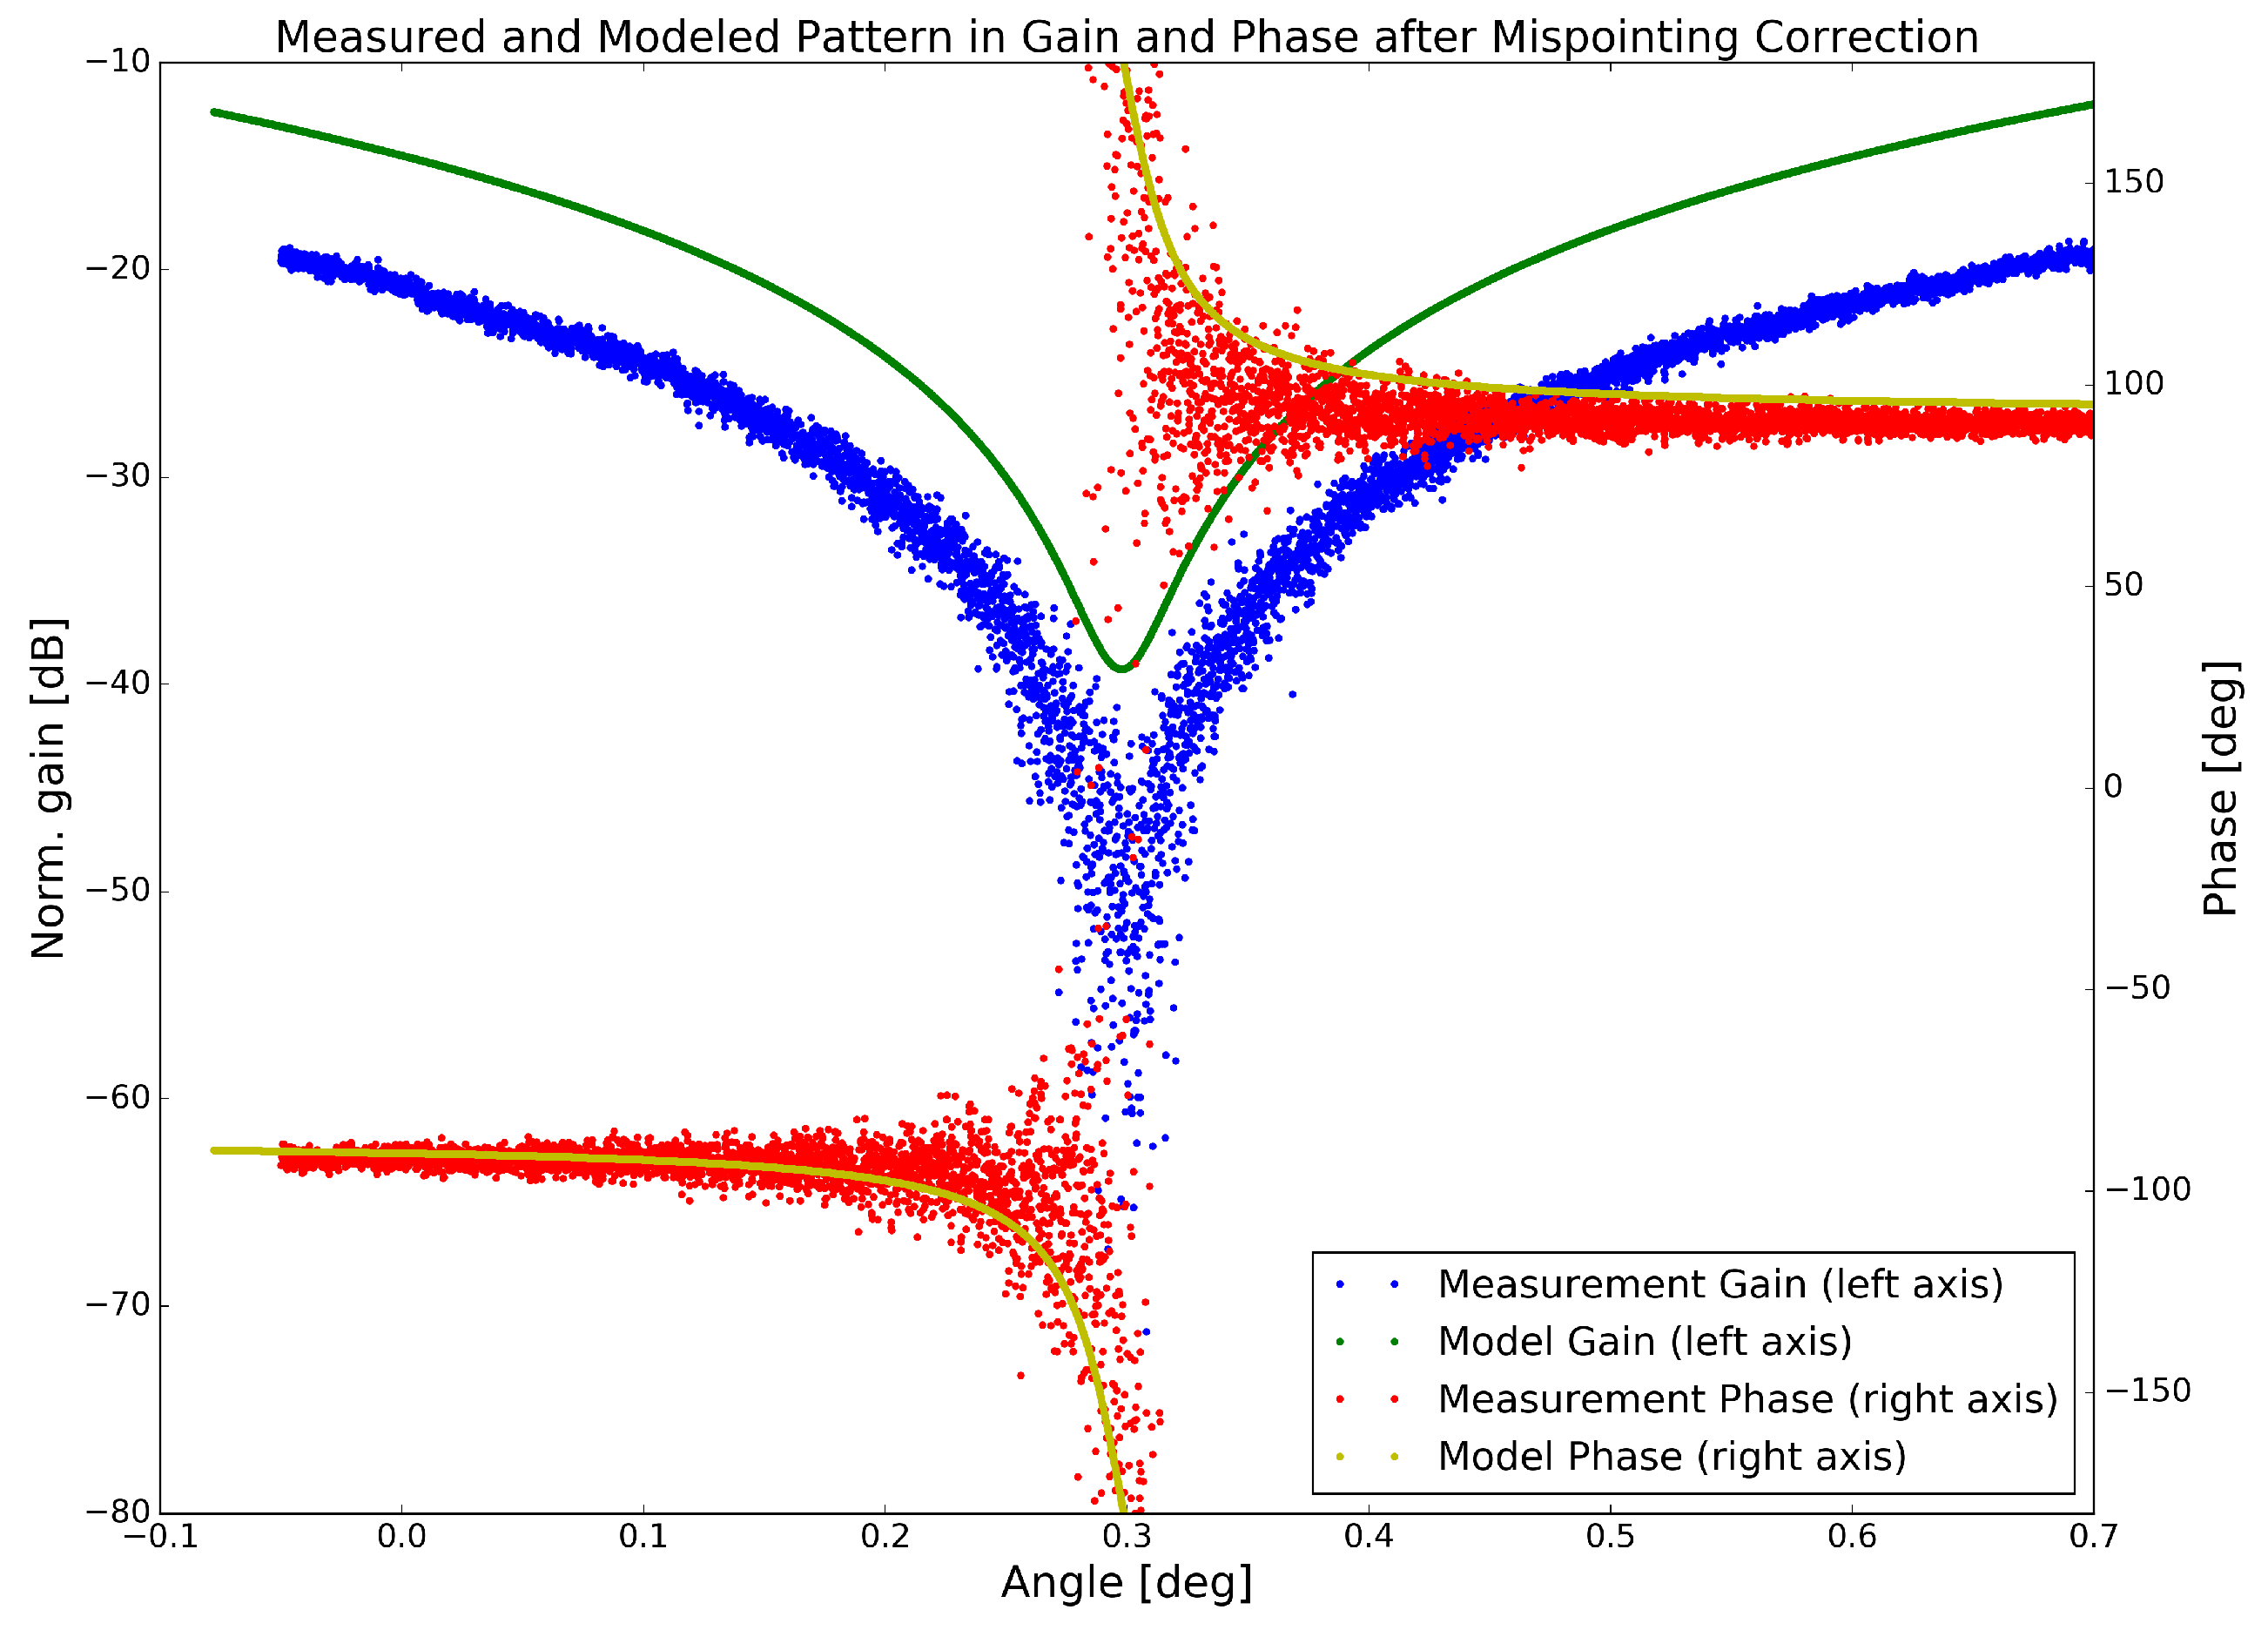
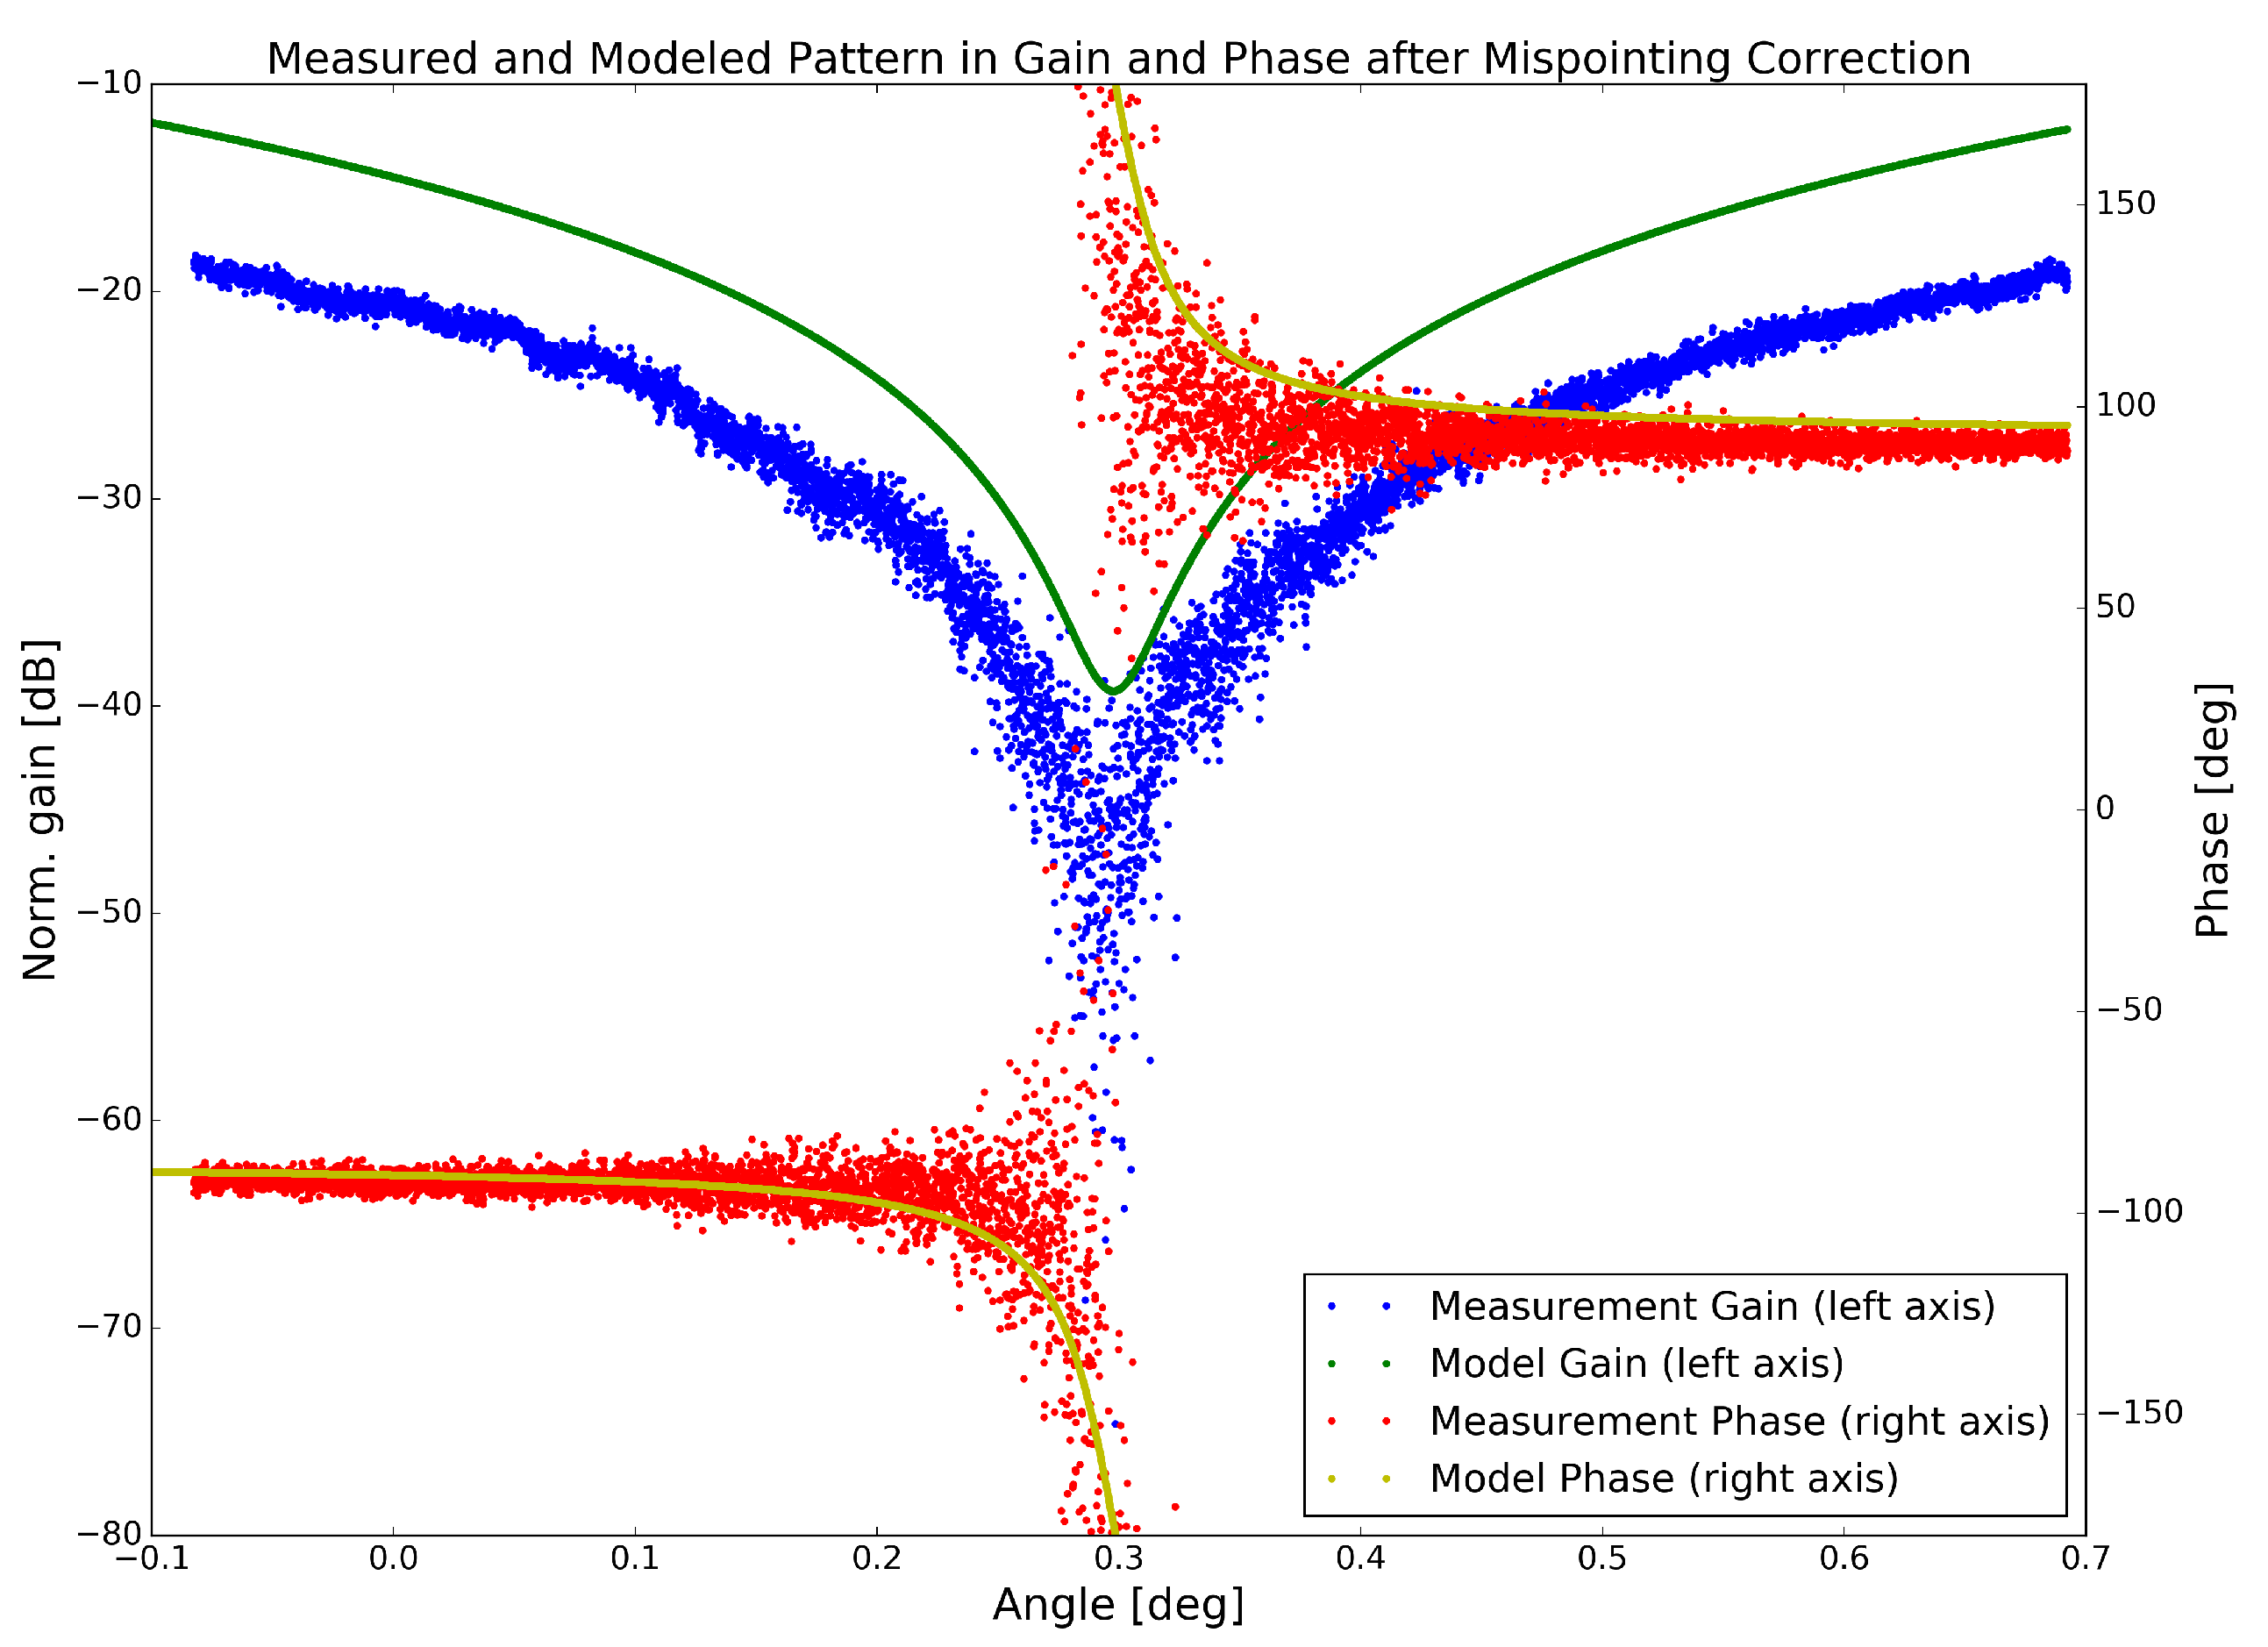
The output of the correlation process as described in
Section 3 is shown in
Figure 7. When compared to
Figure 5, the the angular offset of −27.8 mdeg retrieved from the correlation function was compensated for which equals the extant mispointing in the system. Now, the modeled antenna profile and the measured profile match in gain and phase. To verify the accuracy of the antenna pointing estimation, the sample Pearson correlation coefficient is calculated. Using the complex data, a correlation value of 0.90 is achieved. Recognizing the spread of the phase information at the position of the notch with it’s log signal levels, a higher correlation value of 0.98 is achieved for the real-valued gain only in reverse of losing valuable information. Both values indicate a very good agreement between the antenna model and measurement after mispointing correction.
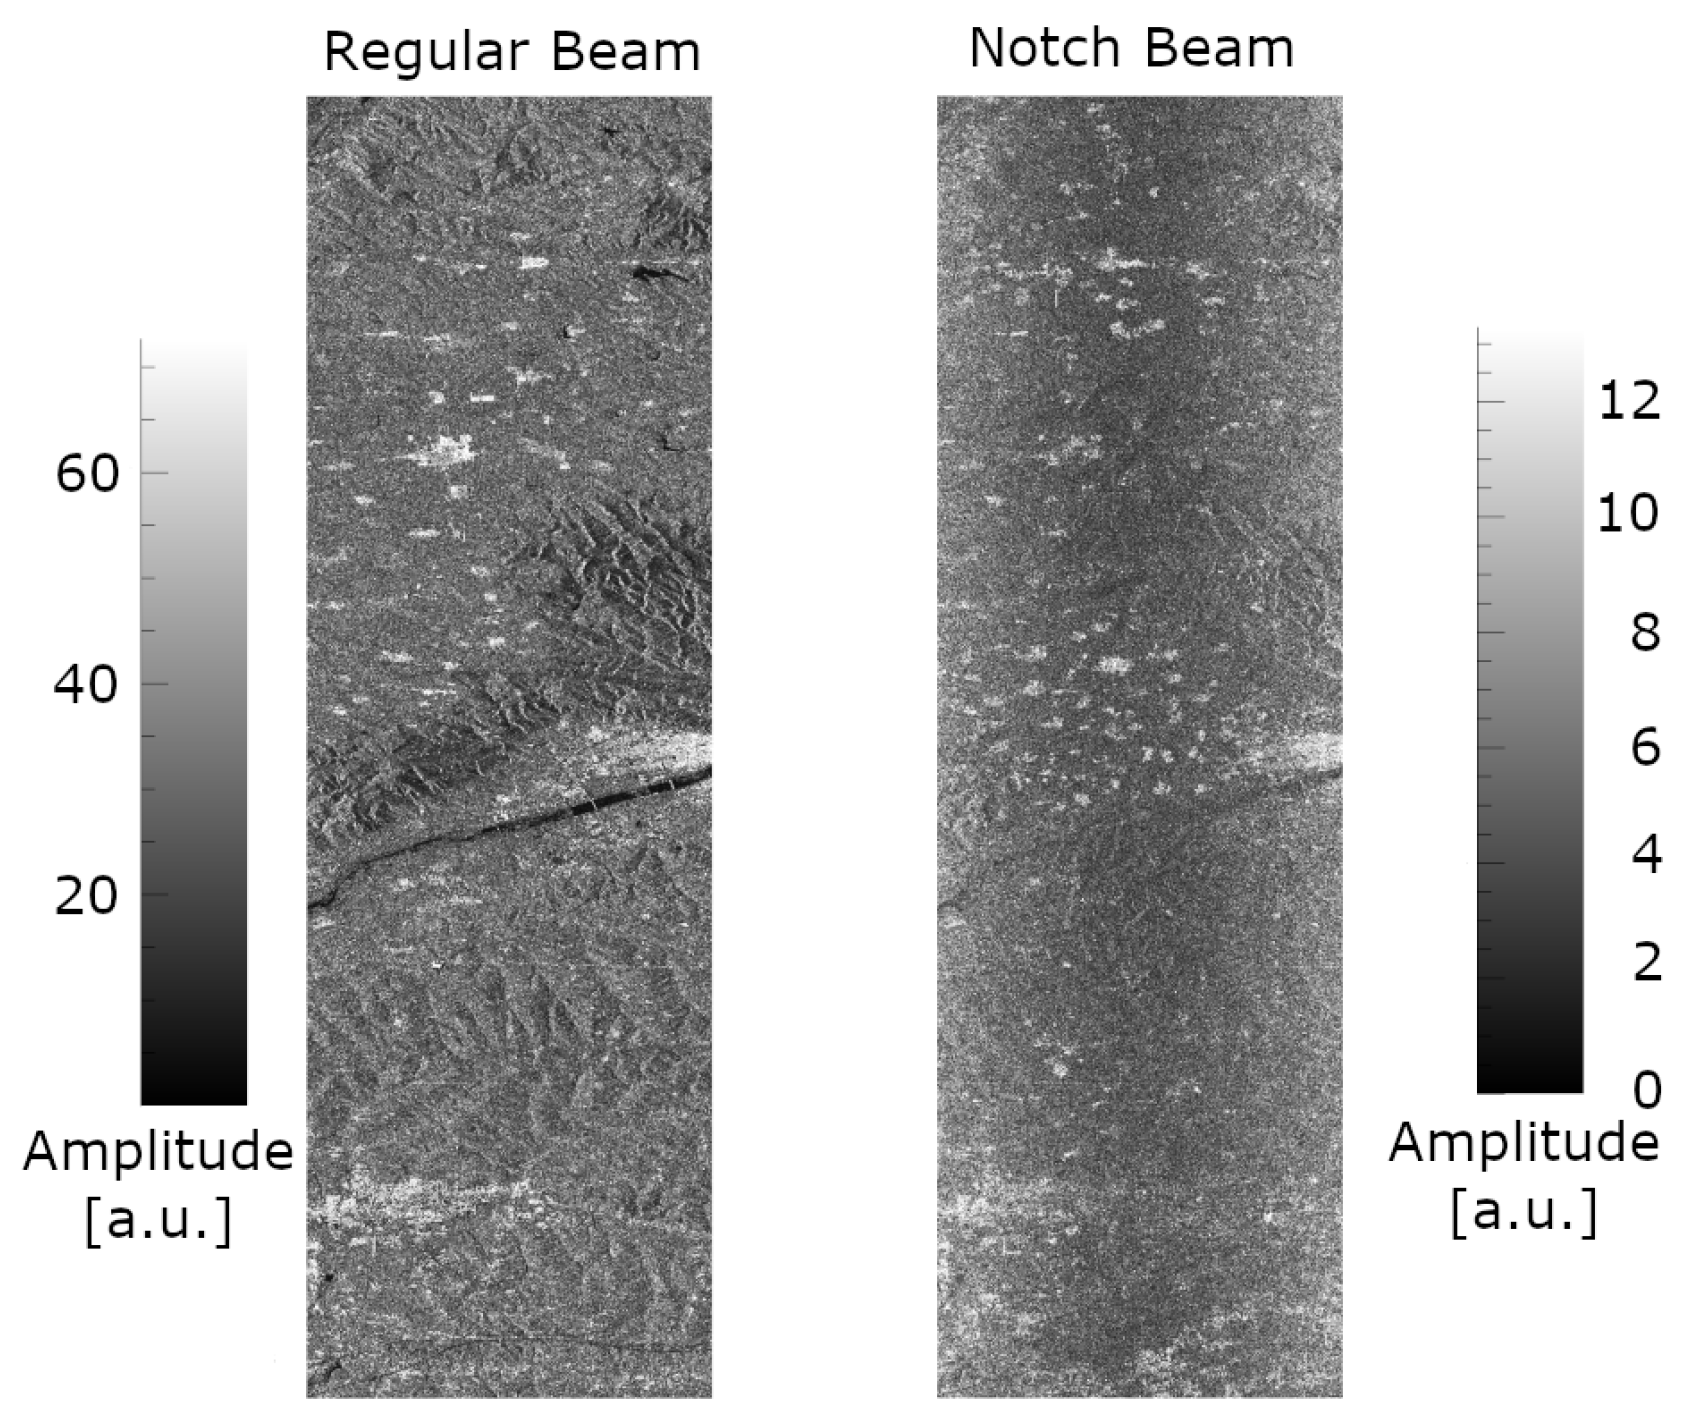
5.2. Inhomogeneous Scene: Urban Region in China
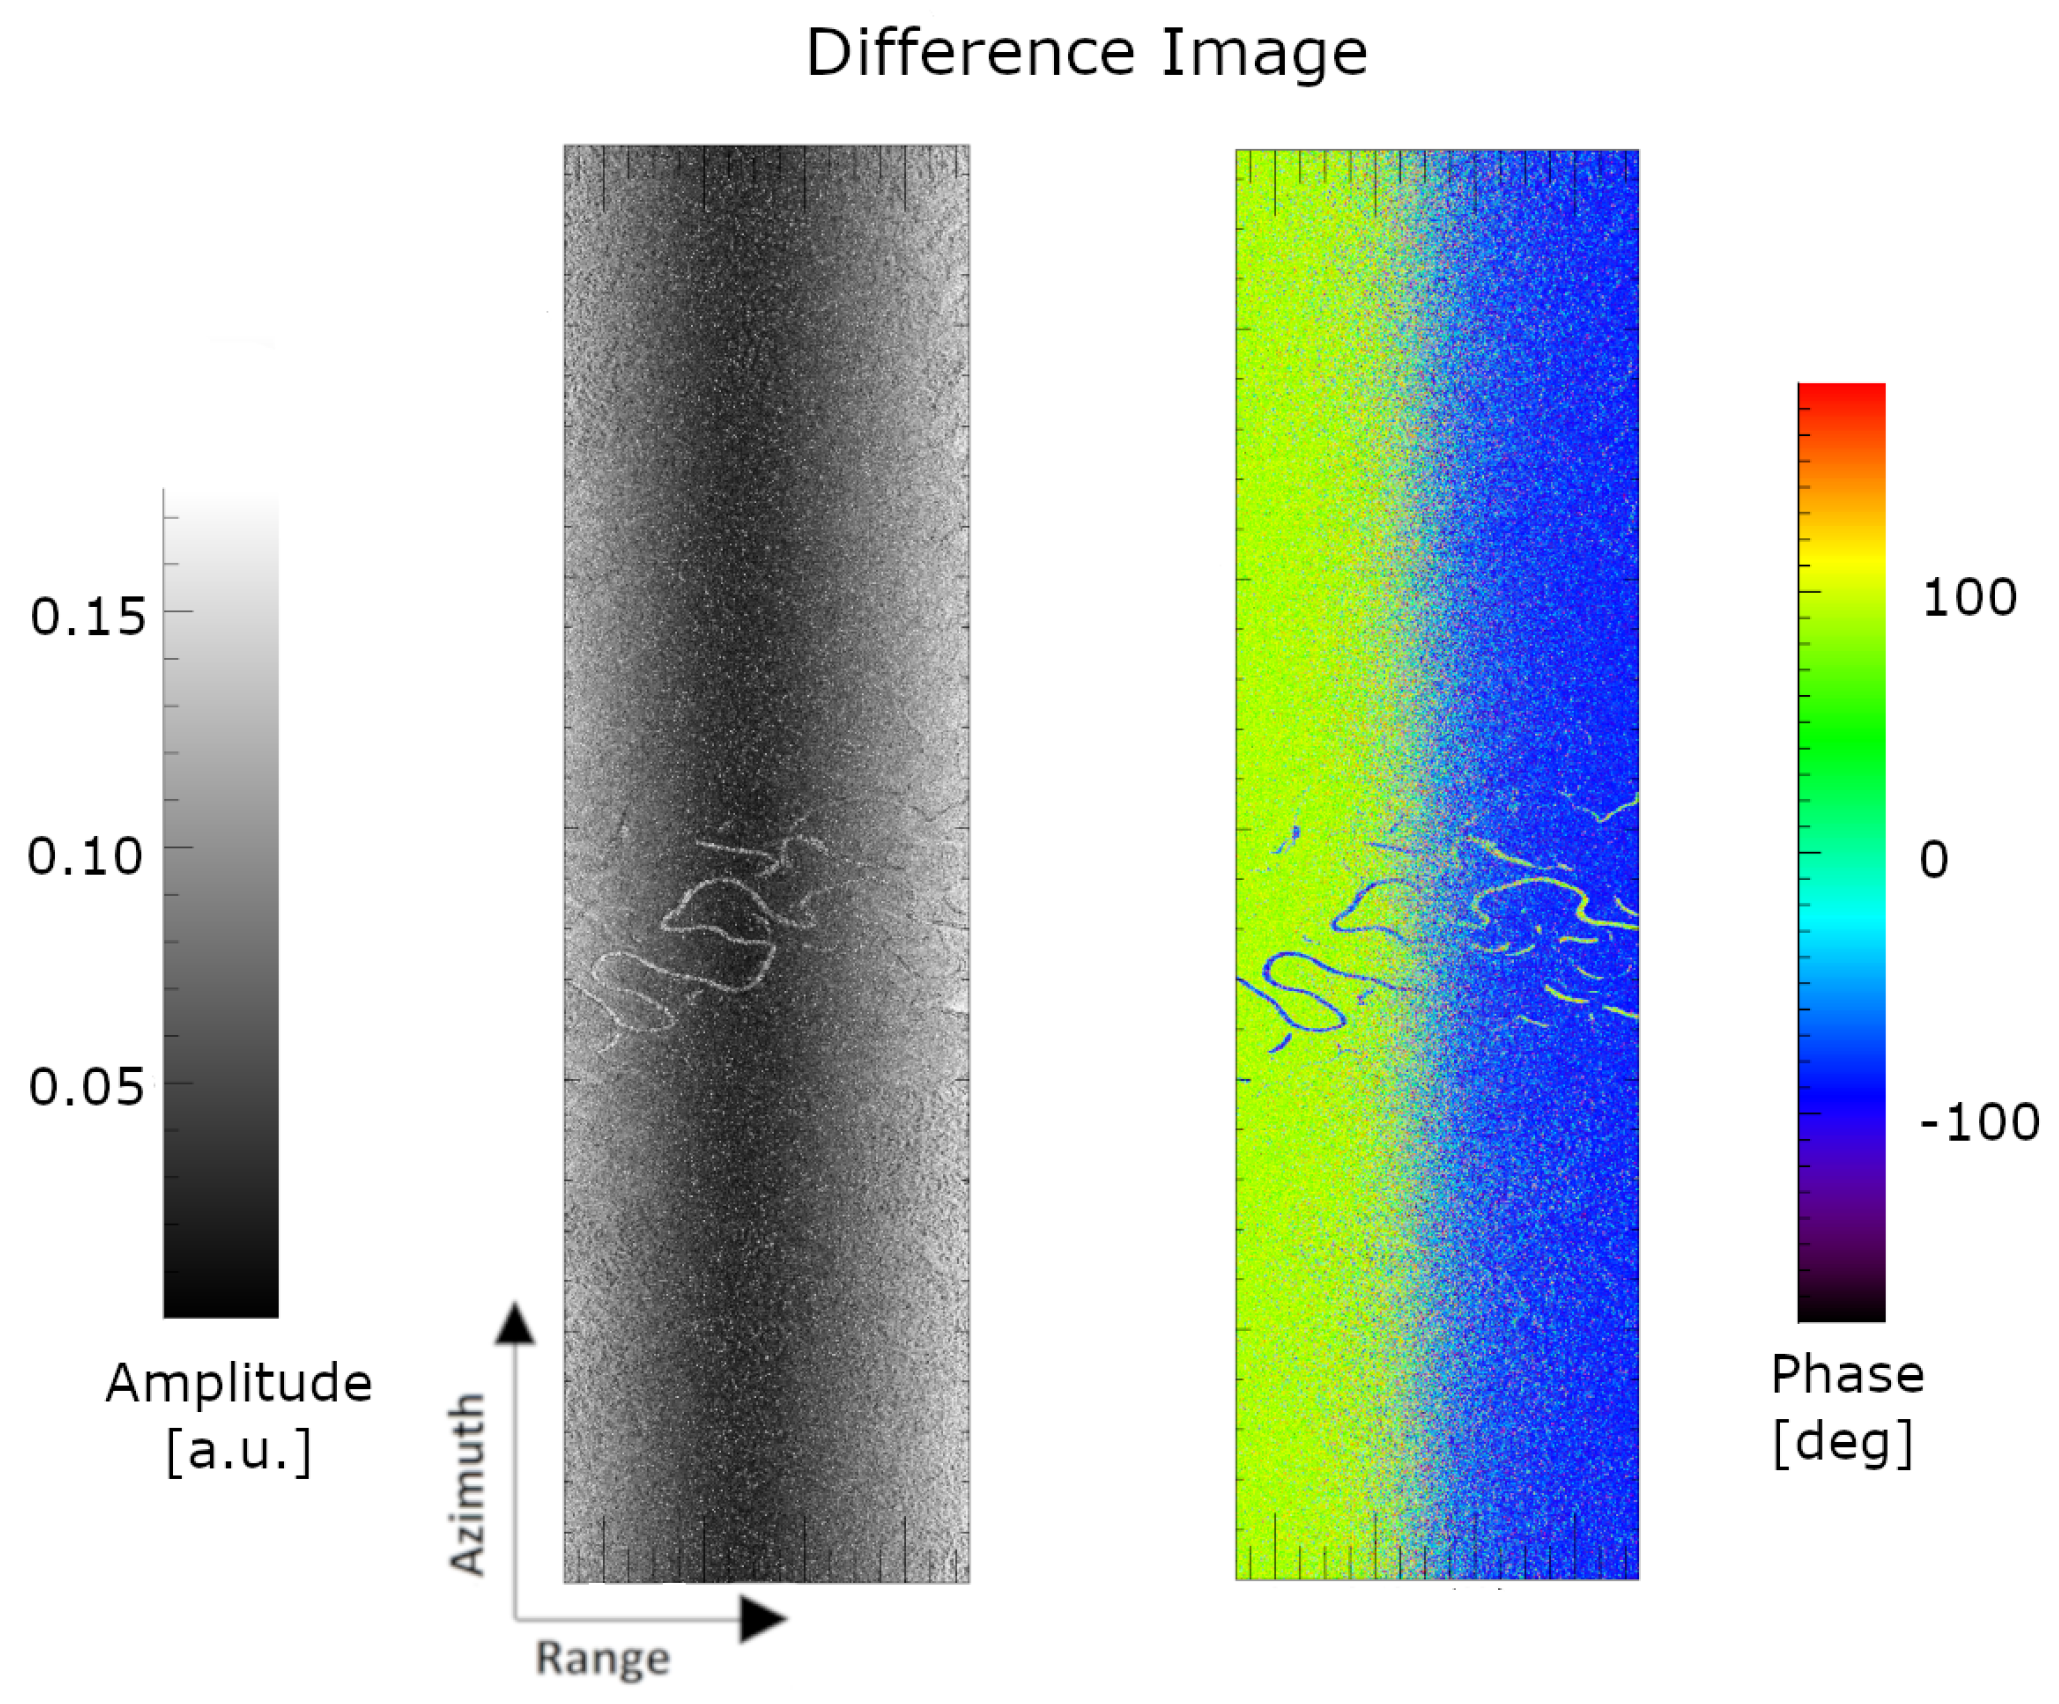
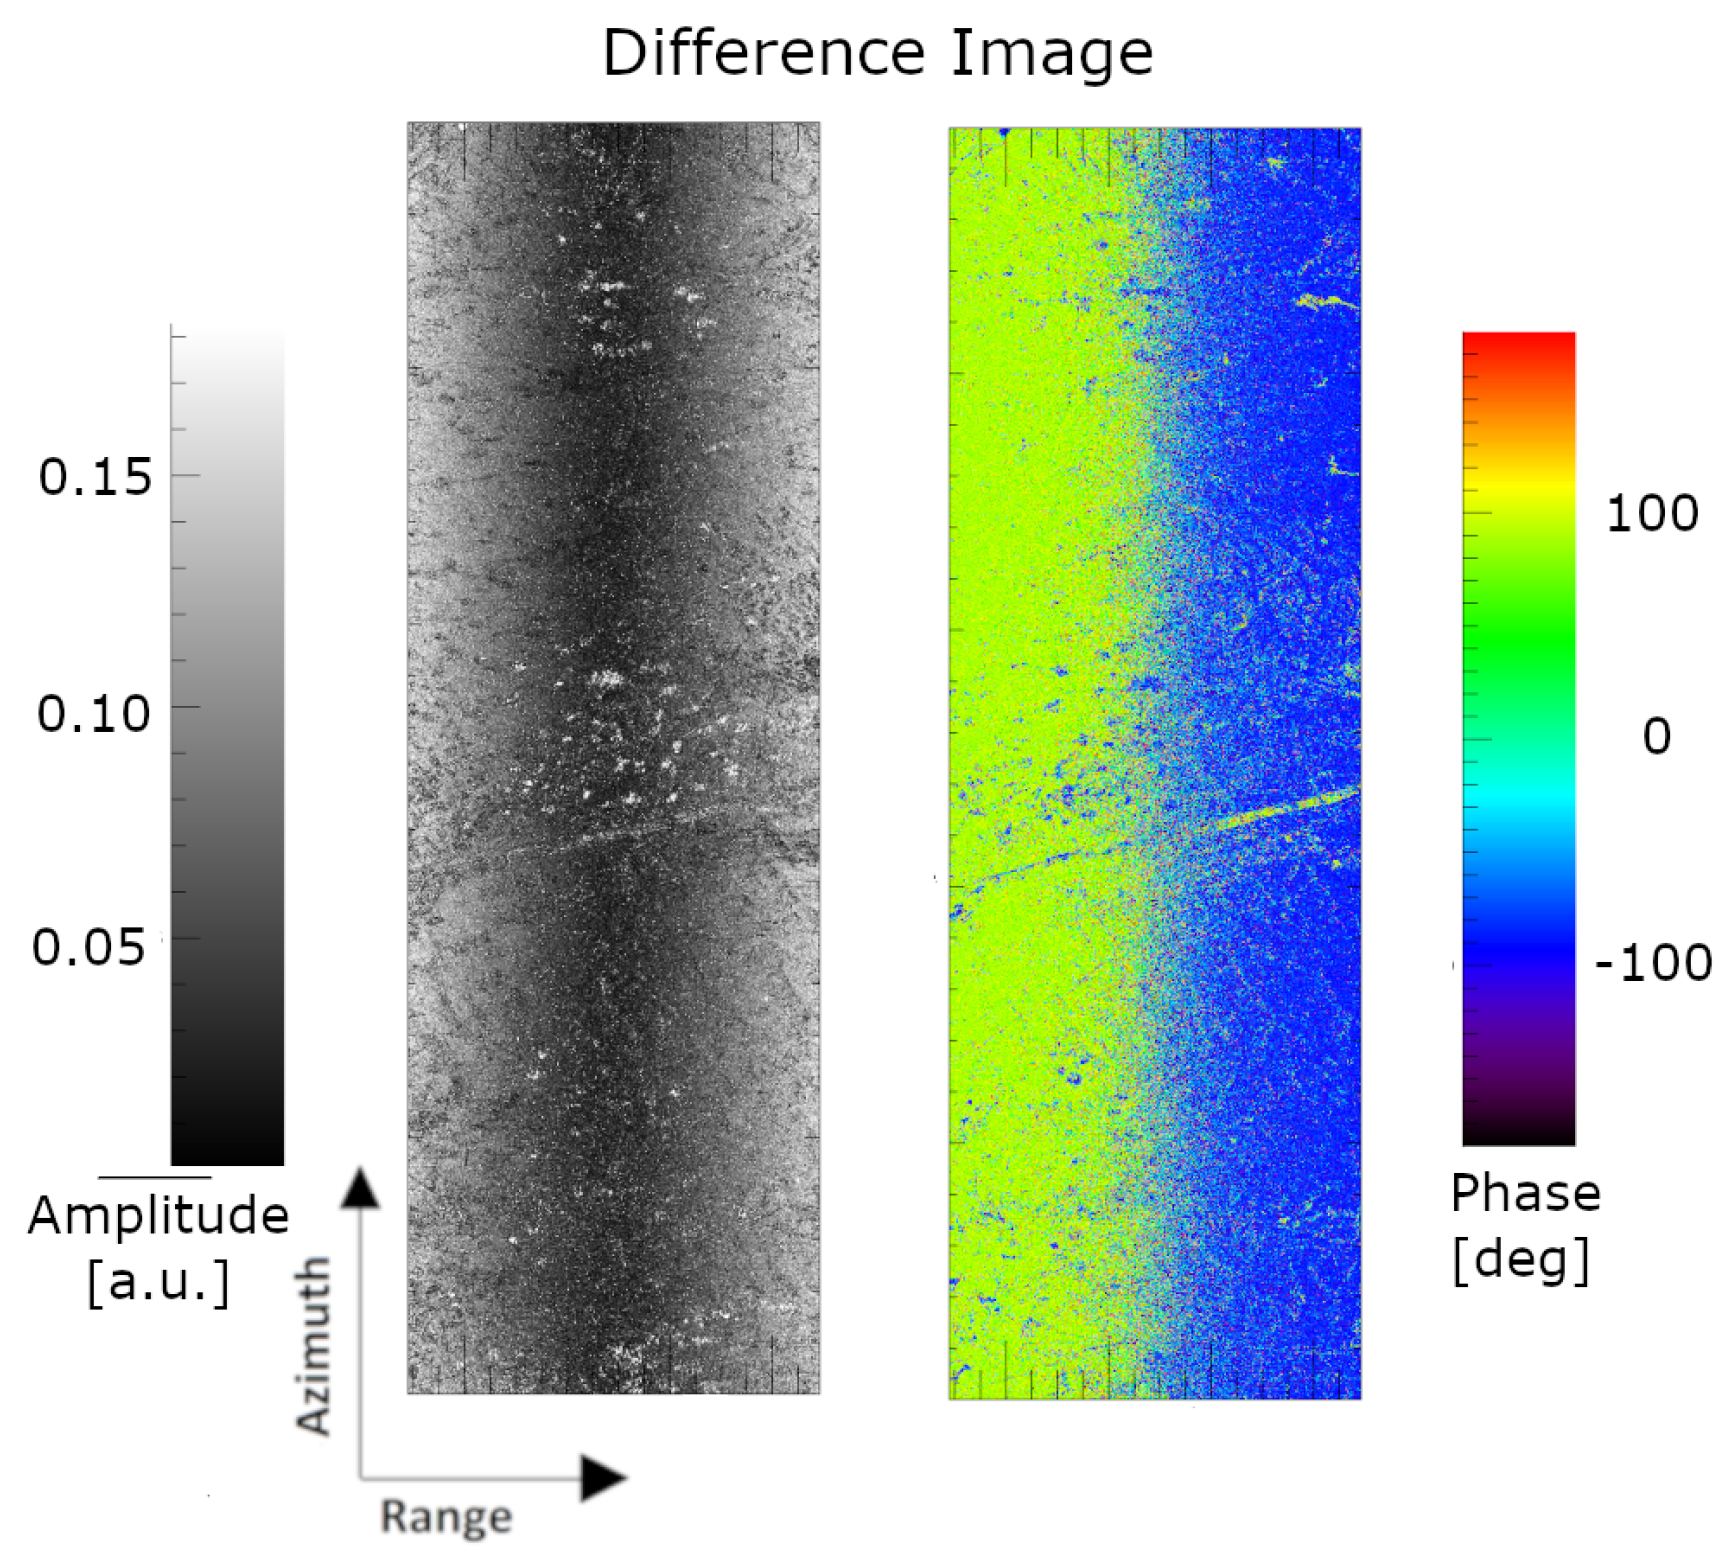
In the following, a more challenging scene is analyzed. The scene consists of a mountainous region in the upper and lower part of the image; some urban areas and a river are found in the middle. It has been acquired over central China and is considered representative for various inhomogeneous areas on Earth. The two images generated from the individual SAR data streams acquired with the boresight and the notch beam pattern are shown in
Figure 8. From this, the difference dataset is generated which is presented in
Figure 9 in amplitude (left) and phase (right). In this scene it becomes evident that the size of the antenna pattern in elevation, especially the notch pattern, was not optimal for the small swath width realizable with the high PRF required to acquire the two datasets at once. Due to the experimental nature of the data, a larger swath was illuminated than the timing allows to record non-ambiguously and additional range ambiguities appear in the image. Some distinct ambiguities can be seen as bright areas in the otherwise black region of the notch or as area of inappropriate colors in the phase image. These ambiguities can be largely avoided in a carefully designed system. However, after averaging in azimuth direction, the notch position in the derived range profile, as shown in
Figure 10, can still be easily determined and used for antenna pointing estimation (
Figure 11).
In addition, the same correlation technique as for the rainforest was also applied to this more challenging scene. The results are similar, with a retrieved mispointing of −27.8 mdeg. The sample Pearson correlation coefficient as a figure for mispointing estimation accuracy is 0.90 for a complex-valued evaluation. The gain-only correlation value of 0.98 is again higher. Thus, a good agreement between model and measurements can be confirmed.
6. Conclusions
Several new SAR missions are proposed [
14] or are currently bening implemented [
2,
15] which are based on large deployable reflector antennas. The huge size of these antenna systems make them prone to mechanical deformation, which also leads to variations of the electrical antenna pointing along the orbit. To keep the calibration performance on the same level as for current SAR system, this problem has been addressed in this paper.
The performance of a novel method for antenna pointing estimation in elevation for SAR systems has been presented. It is based on two coherent SAR datasets to extract the antenna pattern difference while mitigating the effect of the underlying scene. Based on simulations, experimental results and the derived mathematical expressions in
Section 3, it can be deduced that the proposed technique for elevation pointing estimation based on difference scene types is very promising:
Scenes of homogeneous distributed targets can be used for the novel and for the conventional method.
Scenes with high variability and many point-like targets like urban or mountainous region can exclusively analyzed and used by the proposed novel technique.
Scenes of low backscatter like deserts, calm water bodies and melting ice suffer from low SNR can only be used with long integration intervals along azimuth.
Apart from scenes listed in point 3, most land areas on Earth become available for elevation pointing estimation and, hence, also allow the tracking of the antenna pointing along the satellite’s orbit, which is an important feature of the proposed technique. Hence, the applicability of the novel technique for pointing estimation was extended from homogeneous distributed targets to nearly any area on Earth with sufficient SNR. Due to the coherent nature of this technique, the phase can additionally be used for antenna pointing estimation in contrast to the conventional amplitude only method.
The novel technique has been described along with the traditional method. Performance simulations have shown the influence of SNR and scene length on the pointing estimation uncertainty. Finally, by means of TerraSAR-X datasets, the applicability of the novel method has been proven. It has been shown that the novel technique is working under realistic conditions although additional range ambiguities due to doubling the PRF in the experimental setup became apparent. Nevertheless, for the two exemplary scenes shown, the antenna pointing has been estimated down to a few millidegrees which is in the same order of magnitude as the conventional method and is applicable to nearly all areas around the globe. For future SAR missions with digital beam forming the additional range ambiguities can be avoided by synthesizing a supplementary (notch) beam pattern using digital signal processing instead of doubling the PRF and, hence, avoiding the appearance of additional ambiguities.

 ,
, 


