Roadworks Warning—Closure of a Lane, the Impact of C-ITS Messages
by
 , , , and
Serio Angelo Maria Agriesti
1,* ,
,
Luca Studer
1,
Giovanna Marchionni
1,
Paolo Gandini
1 and
Xiaobo Qu
2 
1
Mobility and Transport Laboratory–Dipartimento di Design, Politecnico di Milano, Via Durando 38/A, 20158 Milan, Italy
2
Chalmers University of Technology-Division of Geology and Geotechnics, Research Group Urban Mobility Systems, SE-412 96 Gothenburg, Sweden
*
Author to whom correspondence should be addressed.
Infrastructures 2020, 5(3), 27; https://doi.org/10.3390/infrastructures5030027
Submission received: 30 January 2020
/
Revised: 4 March 2020
/
Accepted: 5 March 2020
/
Published: 6 March 2020
(This article belongs to the Special Issue Smart Mobility)
Abstract
:By now, it is widely acknowledged among stakeholders and academia that infrastructures will have to be composed both by a physical component and a digital one. The deployment of technologies exploiting dedicated short-range communications is viewed as the most cost-effective solution to face the foreseen growth of mobility. Still, little has been done to define the best implementation logic of DSRC. Aim of this paper is to frame the possible impacts arising by the implementation of a cooperative intelligent transport system (C-ITS)-use case: roadworks warning—closure of a lane, and, in order to achieve this result, microsimulations are exploited. The results are intended to support both road operators and car-makers in defining the best operational logics and the possible benefits achievable by presenting the cooperative message at a certain distance for certain market penetrations. Moreover, if the C-ITS message actually entails benefits or simply disrupts the upstream traffic should be assessed in advance, before implementing the system. The obtained results show that the risk of disruption and of reduction in traffic efficiency arises at lower market penetration levels. Nevertheless, a consistent trend in delay reduction is recorded upstream the roadworks, the highest reduction being equal to 8.66%. Moreover, the average speed at the roadworks entrance on the closing lane increases by a difference equal to around 10 km/h, while the average time in the queue at the highest market penetration reduces by 60 s on the open lane and 25 s on the closing one. These presented results reflect the way the traffic shifts from the slow to the fast lane thanks to the C-ITS system and effectively frames both the potentialities and the risks of the system.
1. Introduction
The growth of transport demand and congestion all over European roads is a challenge that hardly will be faced only by building new infrastructures. The cost related to this strategy is also quite high both in economic and societal terms; therefore, new mobility systems aimed at enhancing the efficiency of the current traffic flow are already being developed by car-makers and public bodies alike. In this context, the European-funded C-Roads project arises with the objective of defining and testing the C-ITS systems (cooperative intelligent transport systems) [1] that, through dedicated short-range communication and V2X (Vehicle-to-vehicle, vehicle-to-infrastructure and vehicle-to-cloud communications.) messages, can strongly enhance the information flow and consequently the infrastructure capacity. One of the main results of the project that is currently being carried out should be the impact assessment of these systems in order to foresee the actual benefits arising from their implementation and possible criticalities.
Objective of this paper is to obtain, through microsimulations, the impacts arising from the deployment of one of the use cases designed by the C-Roads platform on the impact area of traffic efficiency, such as reduced travel times or congestion recovery and reduction. The key performance indicators that were chosen, based on [2], were the delay and travel time upstream the lane closure and the speed, lane volumes and queue times at the roadwork entrance, the first ones reflecting the impact on the upcoming traffic and the latter ones being representative of the bottleneck dynamics.
These results reflect the first quantitative findings of the evaluation activities and, even though they will be tuned and expanded exploiting the field tests outputs, represent a first valid assessment to be reported. The tool of a microsimulation software was chosen to analyze also scenarios that are not going to be reproduced within the planned trials due to the current low market penetration of these systems, especially on the Italian road network. Market penetration in this paper reflects the share of light vehicles equipped for C-ITS reception among the whole fleet of light vehicles (and will be referred to as MP to ease the dissertation). As an operational hypothesis, the other components (commercial and heavy vehicles) are not considered at this stage. The presented scenarios are designed on an Italian infrastructure currently involved within the C-Roads Italy Project; said road network was chosen to consider a traffic flow both realistic and calibrated through the analysis of the available traffic data.
It is acknowledged that the benefits arising from a connected fleet of vehicles increase with the number of connected vehicles within the traffic flow and that disrupting effects may be triggered for certain levels of market penetration (as will be showed in the following). Therefore, it is not viable nor advisable to wait until part of the fleet on public roads becomes connected to perform the impact assessment and to question the best implementation logic. To start facing these subjects then and to be able to consider different levels of market penetration, microsimulations seems to be one of the most suitable tools.
The use case subject of the presented analysis is roadworks warning—closure of a lane (RWW-LC) [2], through which, vehicles equipped for the reception of cooperative messages inform the human driver about the closure of a lane due to a static roadwork. The spatial range at which this message is broadcasted can vary, moreover suggested, or present speed limits can also be sent through the cooperative message. Speed limits will be indeed broadcasted within the C-ITS message during the C-Roads Italy trials due to the current Italian laws prescribing lower speed limits upstream the lane closure [3]. The objective of this use case is to reduce risk and number of crashes and to improve traffic management and efficiency through a dynamic broadcasting of the information, possibly with different ranges.
The paper is structured as follows: In Section 1, a short overview of the state of the art is presented concerning the C-ITS systems and the roadworks warning services, as currently defined by the C-Roads platform. In Section 2, the state of the art is characterized, and research questions are defined. Then, in Section 3, the project scenarios and the simulation environment are presented to foster transferability and replicability; moreover, the data exploited as inputs for the model are reported. In Section 4, the obtained results are detailed and analyzed both in their magnitude and in how they relate both to market penetration and to the different traffic dynamics that arise. Finally, the conclusions are presented, and the future research directions are defined.
2. State of the Art and Contribute to the Current Literature
The present analysis is a microsimulation experiment about roadworks causing the closure of the slow lane, with the additional element of the C-ITS message for certain shares of the light traffic. Currently, in literature the number of microsimulations at roadworks is quite limited and focused on the assessment of the best strategies and layouts to improve traffic efficiency, as it will be seen. Still, the following literature review was carried out to guarantee that the roadwork modeled in this paper is designed based on the available best practices and research hypotheses. In [4], for example, the driving style and choices of people in the UK was assessed at roadworks, with the explicit aim of characterizing said behavior to support microsimulations. In fact, as mentioned in [4], real-life situations at roadworks involve complex processes that can be due both to social expectation and norms and to the actual layout of the roadworks. The main output was that the drivers on the analyzed infrastructure tend to change lanes too early to avoid a merging in the vicinity of the roadworks entrance. This closely resembles the behavior reproduced in the model presented in this paper: the vehicles trying to change lane as soon as they are made aware of the closure, mildly at the beginning but with increasing aggressiveness as the entrance approaches. This hypothesis is also strengthened by the features of the analyzed infrastructure; A22 in fact limits the heavy vehicles to the first lane until the lane closure is signaled. This high share of heavy vehicles on the first lane upstream the entrance pushes light vehicles to change lane as soon as they are made aware of the lane closure and hinders them from re-entering. In [5], again the issue of microsimulations at roadworks is analyzed with the aim of assessing two traffic management schemes (one being a lane closure). In [5], it is also stated how the different layouts and protective physical reductions can impact on the speed value kept by the traffic while approaching the roadworks; it is also highlighted how these values tend to be higher than the one prescribed by the signaling (output also of [6], explicitly mentioning Italian traffic). Moreover, a complete calibration of roadworks traffic was also carried out, based on a set of data quite wider than the one available to the authors of this paper, and the main parameters and the potential values were highlighted. The effects of roadworks on capacity were also studied in [7], where it is highlighted how the capacity may increase or decrease by around 36%–37% from the HCM values depending on the degree of cooperative driving performed by the road users. Findings in [7] also strengthen the view of the authors about the lack of literature about how the different variables affect the capacity of roadworks in microsimulations, with too-few empirical studies on the topic. The most relevant work on the Italian network is [8], in which data from a roadwork with a layout similar to the closure of a lane designed in the presented model were used to calibrate and validate a driving simulator. These data were exploited in this paper to hypothesize a level of compliance to the suggested speed limits; in fact, a campaign of speed measurements was carried out and reported in [8]. These data were recorded in sections comparable to the ones designed within the presented model, both for the distances from the lane closure and for the vertical signals. Therefore, through the average speed values and the standard deviations, the Gaussian distribution of the speeds within each one of the upstream segments ranging between 576 and 216 m from the entrance (where the speed limits are signaled) were obtained for this case study. The work carried out in [8] allowed to discharge the hypothesis of perfect compliance to the signaling and to use calibrated values to reproduce speed distributions in the model, as will be explained in Section 3.
To the authors’ knowledge, in literature, there is still no research paper that assesses the impacts of the C-ITS use case RWW—LC; therefore, the literature review could not be broader than the one presented above without going out of scope, and the research questions had to be designed based solely on [9,10]. Both these works are the result of a literature review about the jointed implementation of C-ITS services and L3 driving. The study in [9] is in fact a technical report that analyzes more than 130 bibliographical references, while in [10], this study is exploited to define a sound evaluation methodology aimed at assessing C-ITS implementations and the potential synergies with automated driving. The research questions that were defined are:
- Does the average throughput of the lane closure increase due to the received information?
- Does the upstream traffic reorganize itself in a way that is more efficient in terms of speed and travel time?
- Is there a trend of the above impacts tied to market penetration?
3. Simulation Environment and Calibration of the Model
3.1. Case Study
The case study is the Italian motorway A22, already involved in the C-Roads Italy Project as an implementing body. A22 is composed by two lanes on which a speed limit of 130 km/h is enforced; moreover, heavy vehicles must comply to an overtaking ban and are, therefore, limited to the slow lane. This infrastructure was chosen for the analysis, because many of the field tests activities will be launched on it in 2020, so this modeling activity and the research hypotheses will have feedback. Moreover, traffic data were made available by A22 and were exploited to calibrate the model.
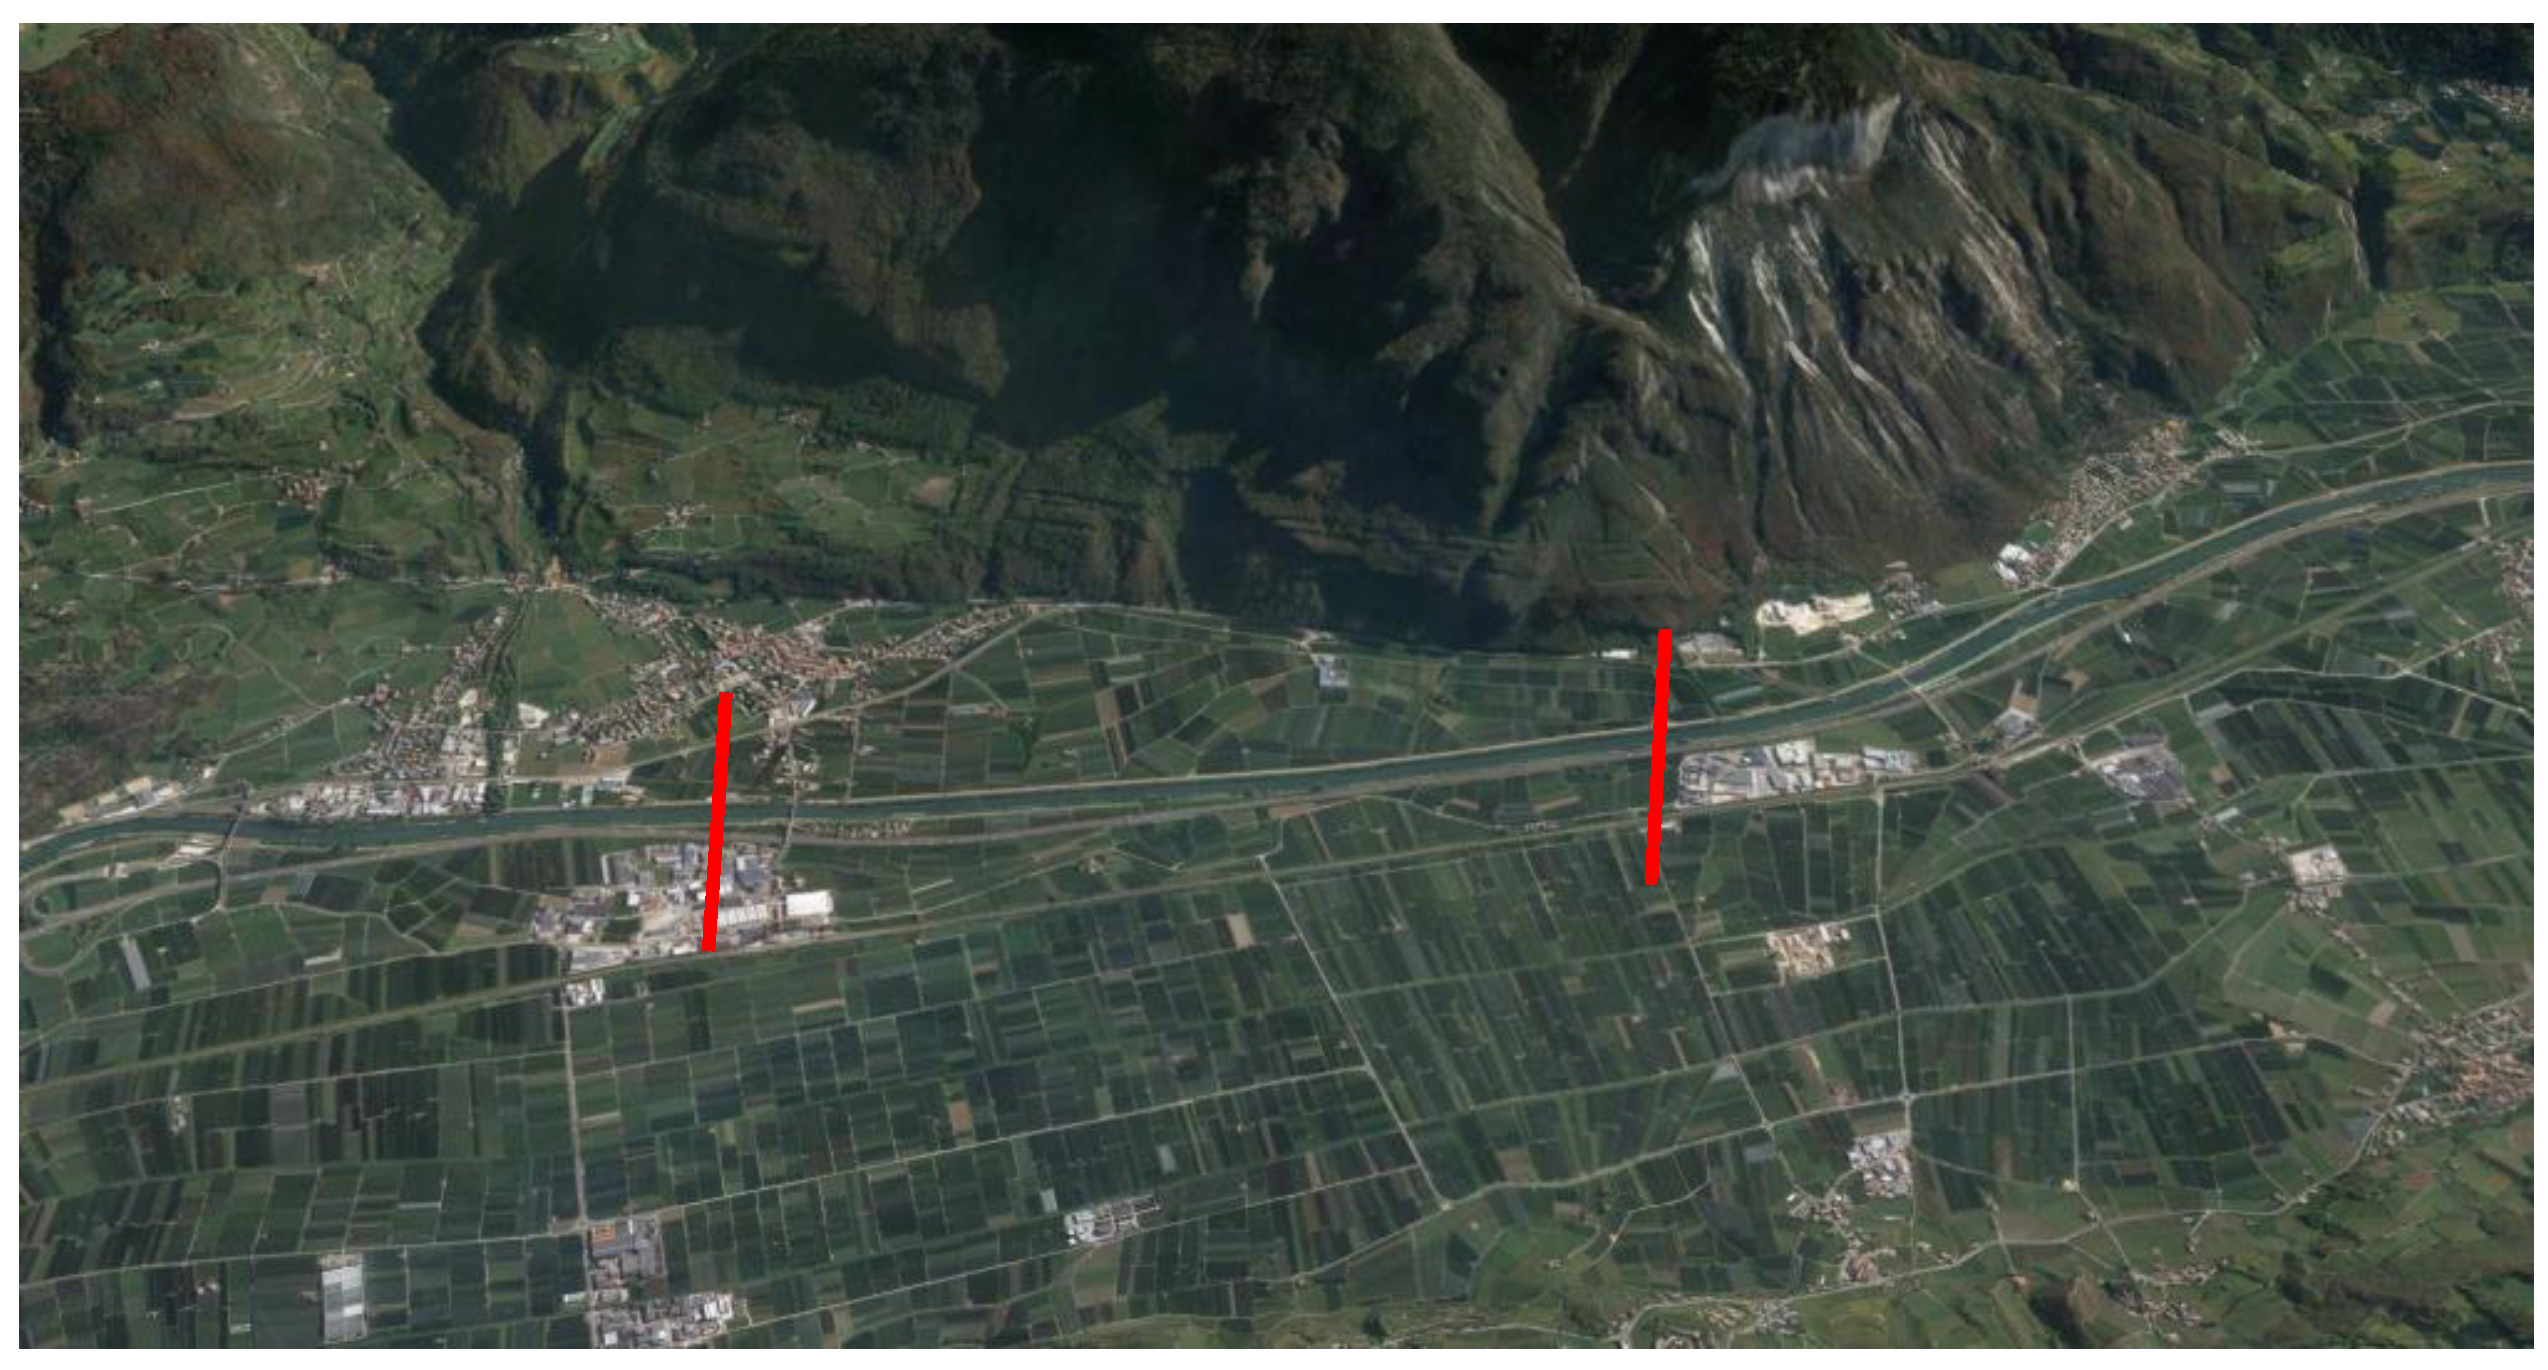
In Figure 1, the road segment chosen for the analysis is reported, one of the main reasons being that no ramp is present between the two loop sensors signed in red, and exploited to calibrate and validate the traffic model through the recorded data. This feature was highly relevant, because it allowed to frame the effects of the message upstream the roadworks with no other disturbances involved. The focus upstream the roadworks rather than through it was imposed by a lack of literature data concerning the driving behavior of the Italian traffic within the roadworks. It is in fact acknowledged that drivers keep different speeds and time gaps when traveling such segments, and these behaviors change even depending on the roadworks layout (e.g., mobile roadworks have less signage and “scare” less the driver when compared to long-term construction zones).
The network as reproduced within the model is reported as follows:
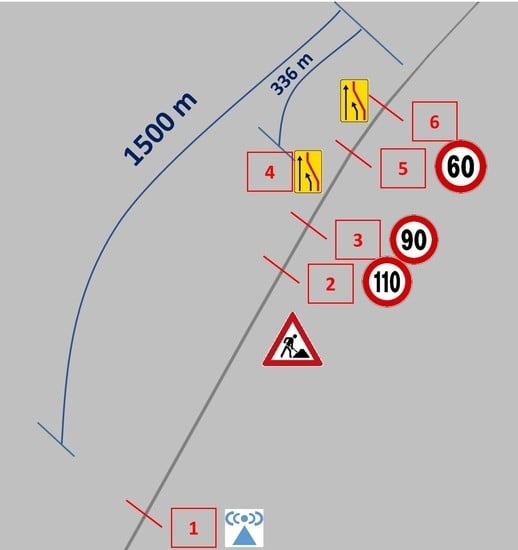
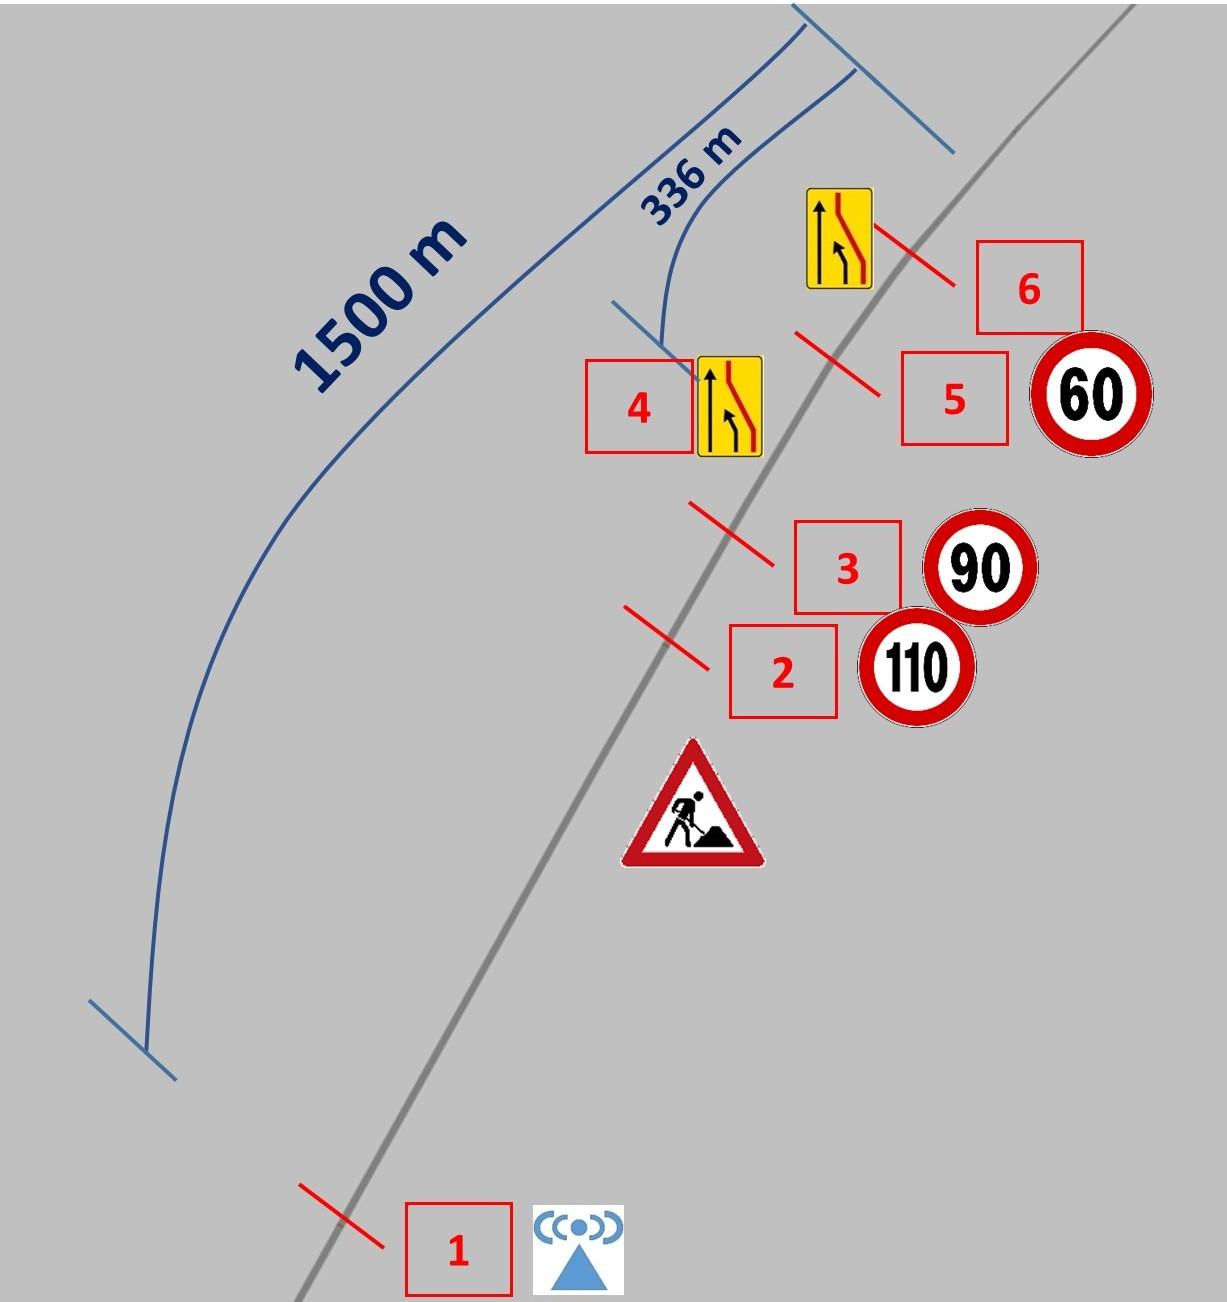
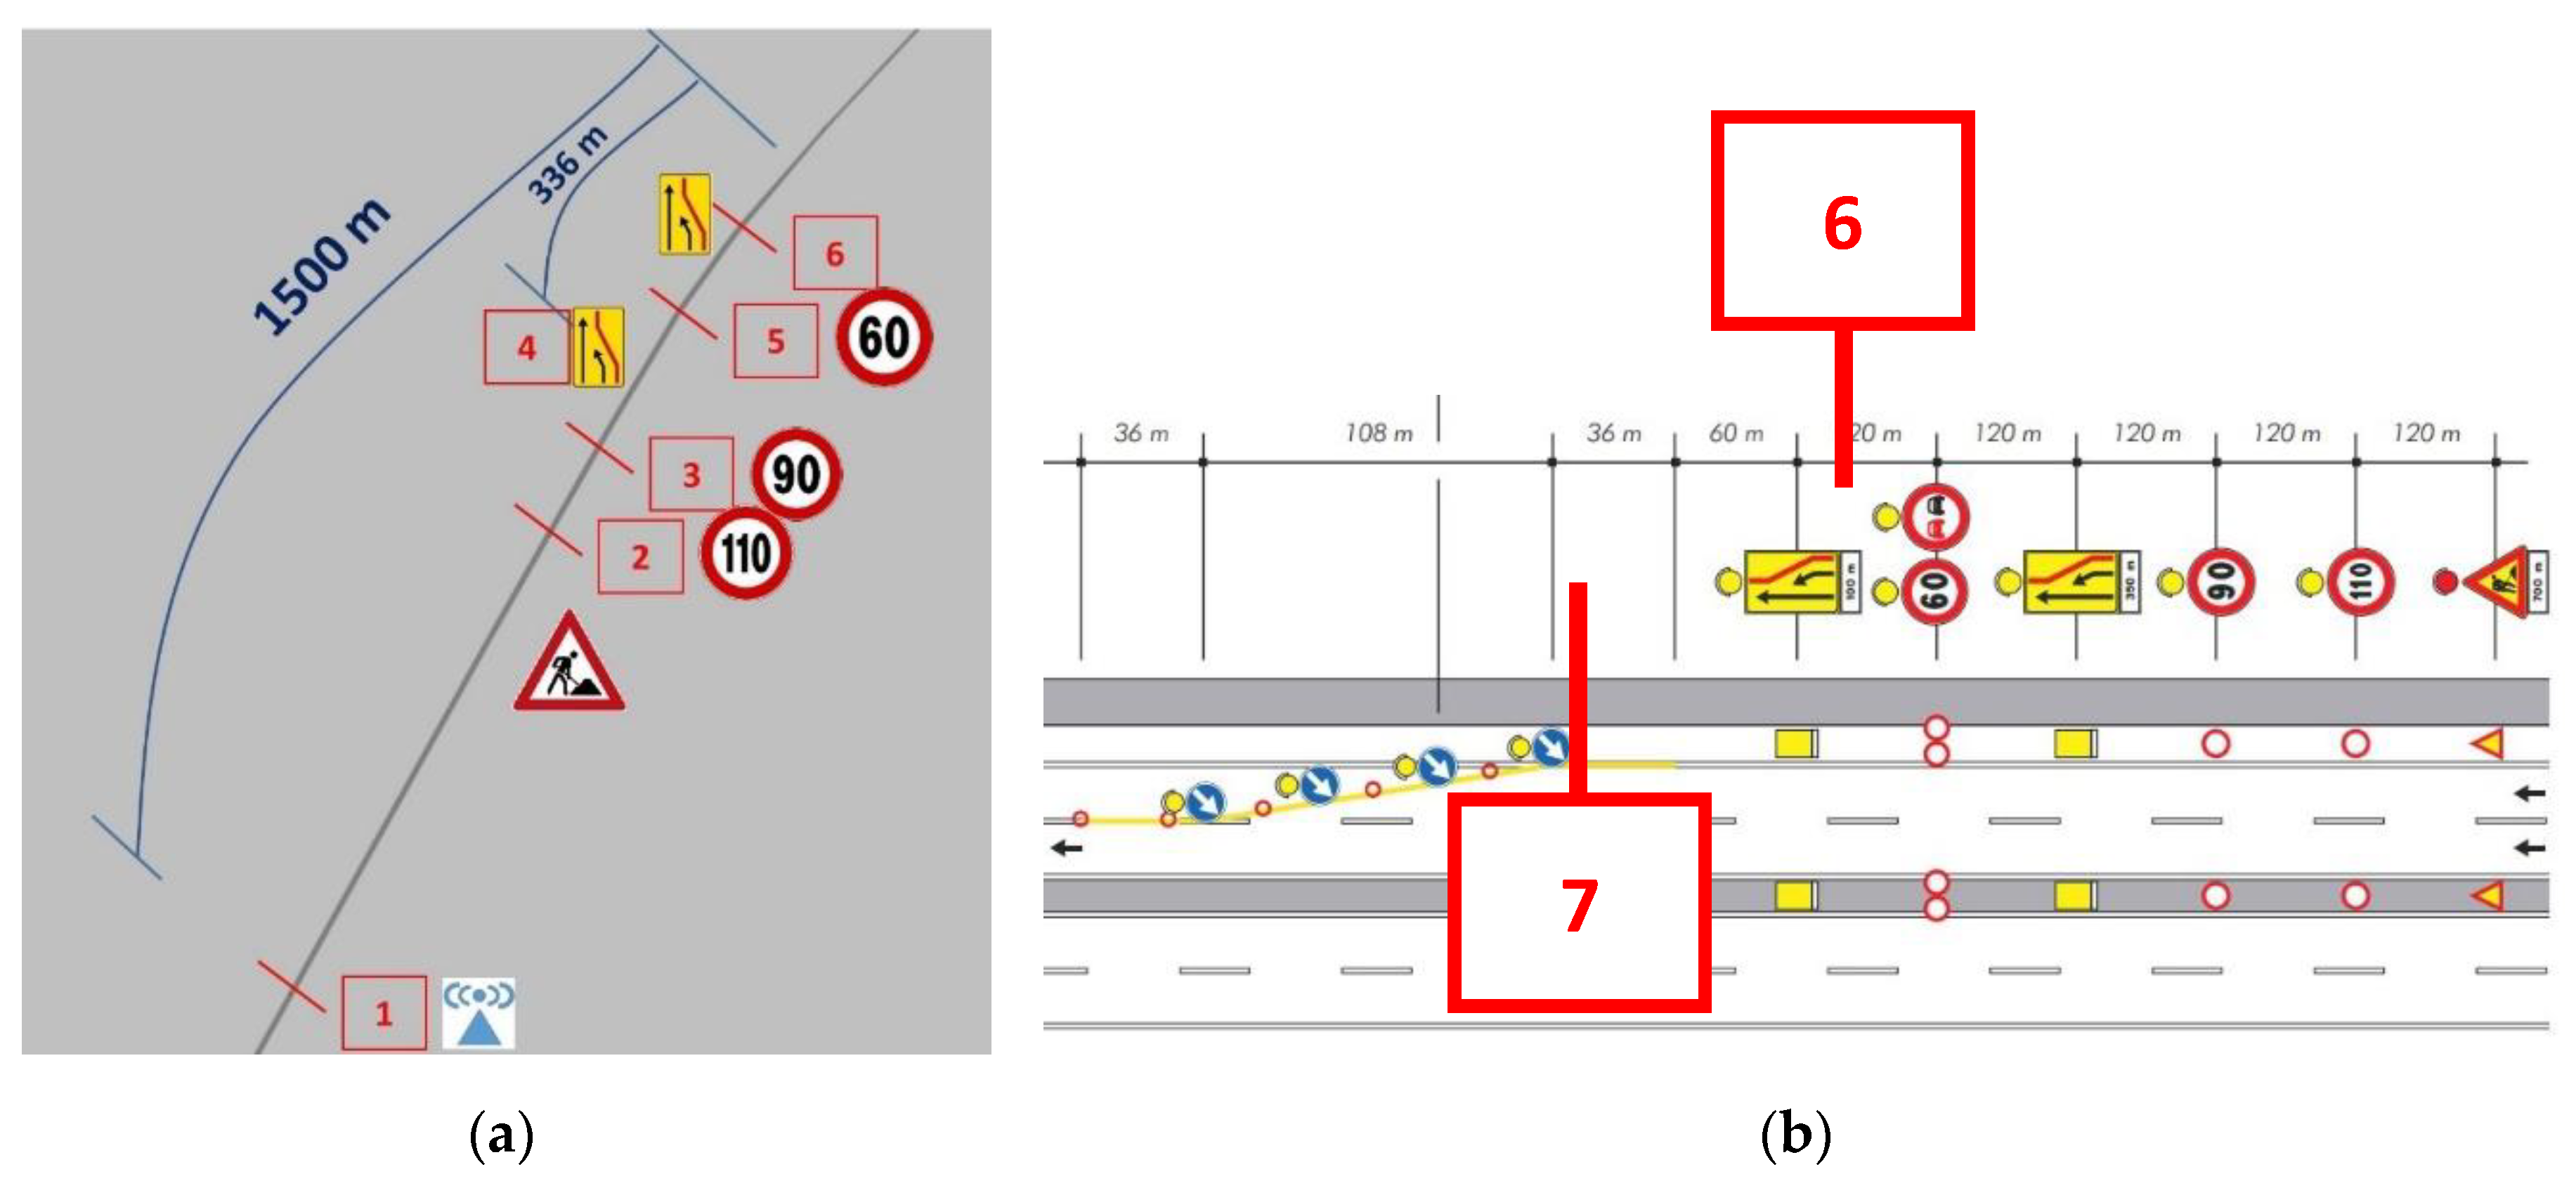
In Figure 2, seven relevant sections are reported:
- Section that reflects the range of the cooperative message; connected vehicles become aware of the lane closure at this point.
- Vertical signage mandating a 110-km/h speed limit for the upcoming traffic. Both traditional and connected vehicles become aware of this speed limit in this section.
- Vertical signage mandating a 90-km/h speed limit for the upcoming traffic. Both traditional and connected vehicles become aware of this speed limit in this section.
- First vertical signage informing about the layout of the roadworks and about the lane closure. Traditional vehicles become aware of the needed lane change when passing this section.
- Vertical signage mandating a 60-km/h speed limit for the upcoming traffic. Both traditional and connected vehicles become aware of this speed limit in this section.
- Vertical signage reiterating the presence of a lane closure due to roadworks.
- Section where the lane closure takes place; from here, no vehicle can drive on the slow lane anymore.
No section for the first generic signage about the roadworks was numbered in Figure 2, because no information about the lane closure or the speed limit is provided through this signage, and therefore, no change in behavior is triggered at this section. As it can be noted, the cooperative message about the lane closure is received by the equipped vehicles (CVs) 1500 m in advance, while traditional vehicles become aware of the roadworks around 700 m upstream and of the lane closure only 336 m upstream. As an operational hypothesis, CVs receive in advance only the message about the lane closure, while the reduced speed limits are showed on the HMI as soon as each vehicle reaches the signalized section. It should also be highlighted that, in the presented analysis, the potential effects related to communication delays and packet losses are not simulated, the V2X communication is not reproduced within the model and the message is triggered in a different way (as it will be reported in Section 3.2). Still, not including the delays within the simulations should have a negligible effect on the results. In fact, in all scenarios, the distance between the reception point and the roadworks is large enough that, even if the first message is not received, the following ones should be with an overall delay too low to define the behavior of the drivers (the periodic broadcast of cooperative messages is usually hypothesized as equal to 1 s at most).
3.2. Description of the Simulation Environment
It is worth describing how the layout presented in Figure 2 was reproduced within the modeling software to foster the replicability of the study and the transferability of its results. The chosen modeling tool was PTV VISSIM, a commercial simulation software that allows the evaluator to reproduce the longitudinal driving behavior on freeways through the Wiedemann 99 model. Said driving behavior was calibrated through the CC0, CC1 and CC2 parameters, representing the standstill distance, the time gap distribution and the longitudinal oscillation (how much more distance than the desired safety distance a driver allows before he intentionally moves closer to the car in front). The calibration process is reported in paragraph 3.2.
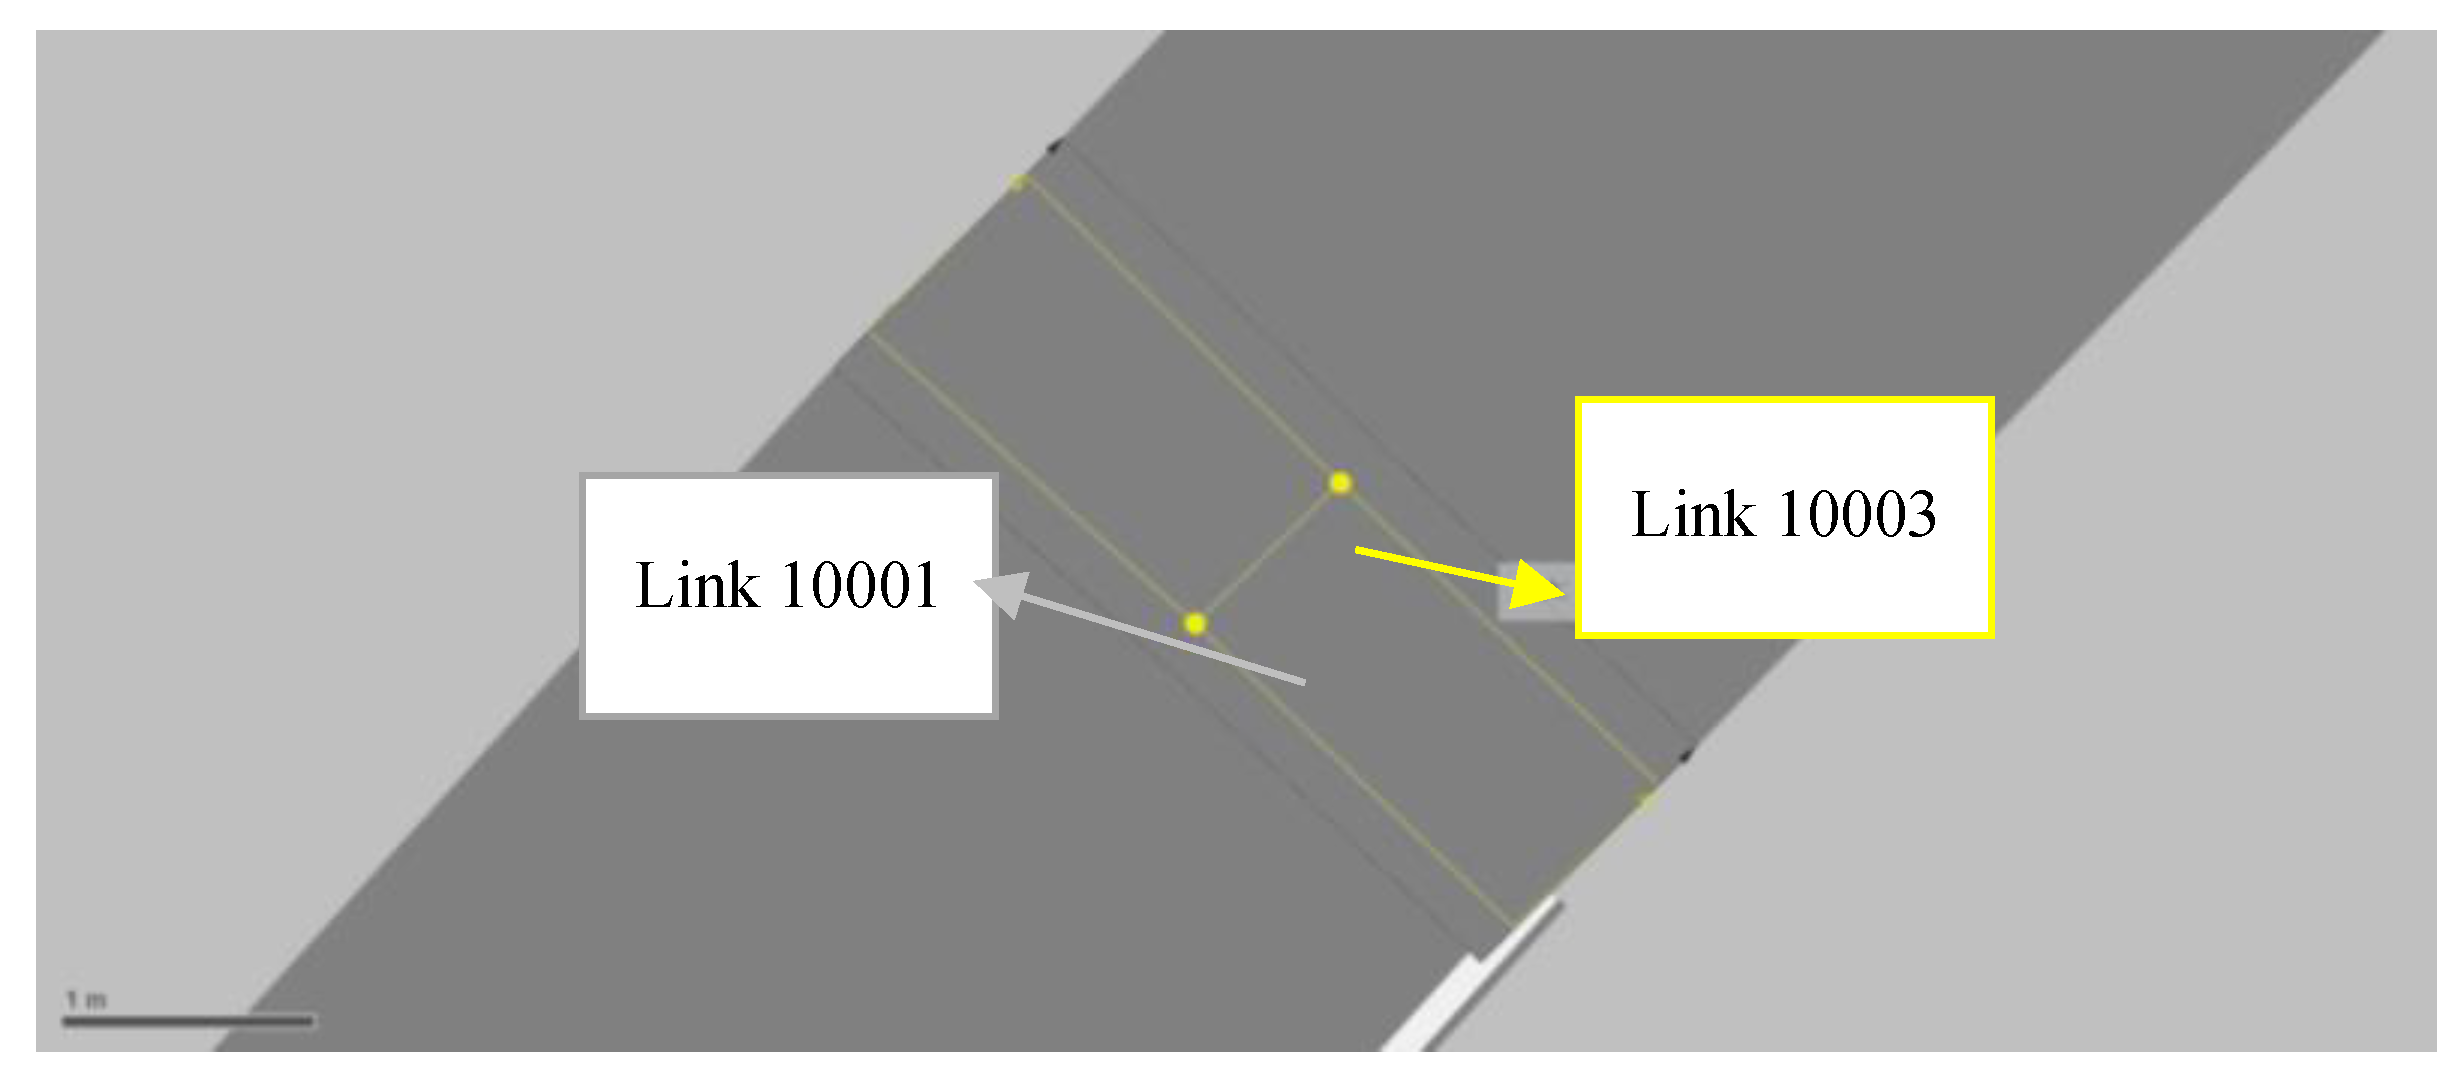
The particular feature of the model designed in this paper is the implementation of the cooperative message, reproduced by exploiting the connector (A connector is an element within the software that joins two links on the road network. It can be seen as a joint between two stretches of road. In Figure 3, it unites the segment with two open lanes with the next one with only one lane left.) in Section 7 (Figure 2). In fact, the message is hypothesized to be broadcasted from this point, a hypothesis that is implemented by imposing the connector parameter “lane change” equal to 1500 m rather than the pre-set value of 200 m. This parameter reflects the distance at which the vehicles passing through the connector are made aware of the change in their route. To differentiate the behavior of CVs from the one of traditional vehicles, two overlapping connectors less than 1 m long were designed, as reported in Figure 3. The first one (No. 10001) for CVs is seen from 1500 m, and the second one (No. 10003) for all the other vehicles is seen from 336 m, the distance at which the corresponding vertical signage is posed.
Traditional vehicles belonging to the classes 10, 20 and 130 (light, heavy gross vehicle (HGV) and commercial) follow a static route passing through the connector 10003, while CVs belongs to the class 140 follow the static route passing through the connector 10001.
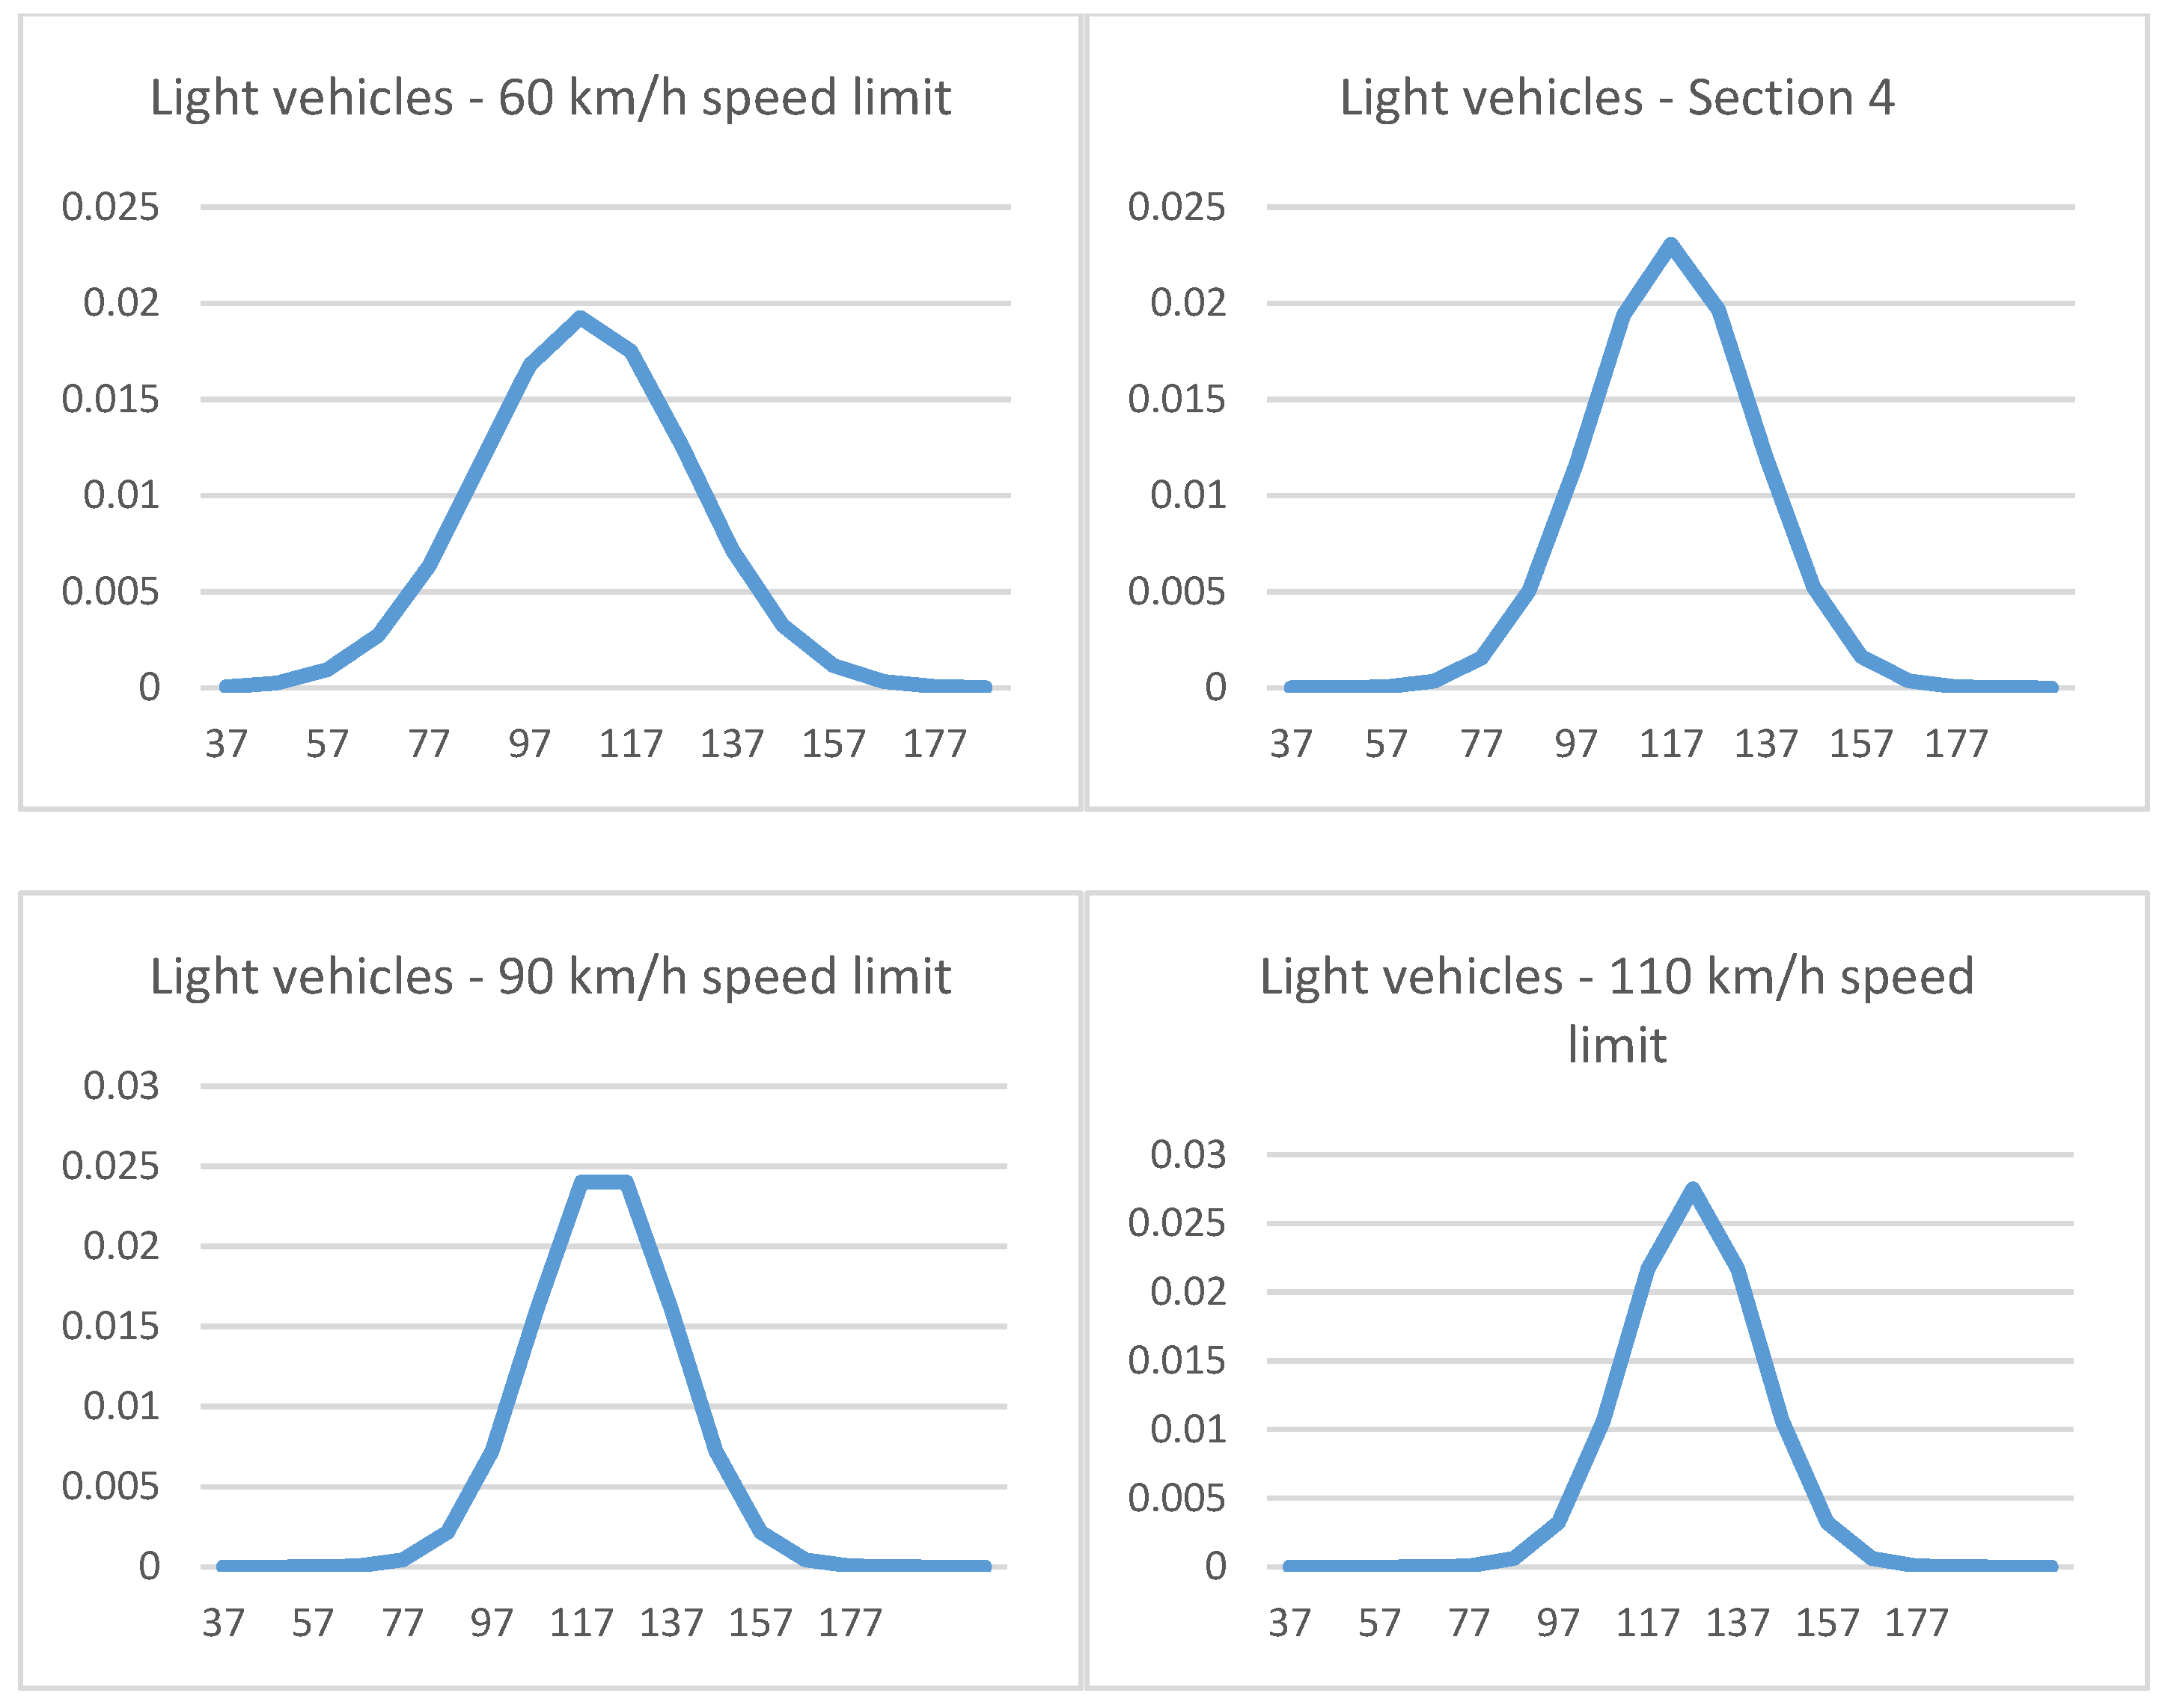
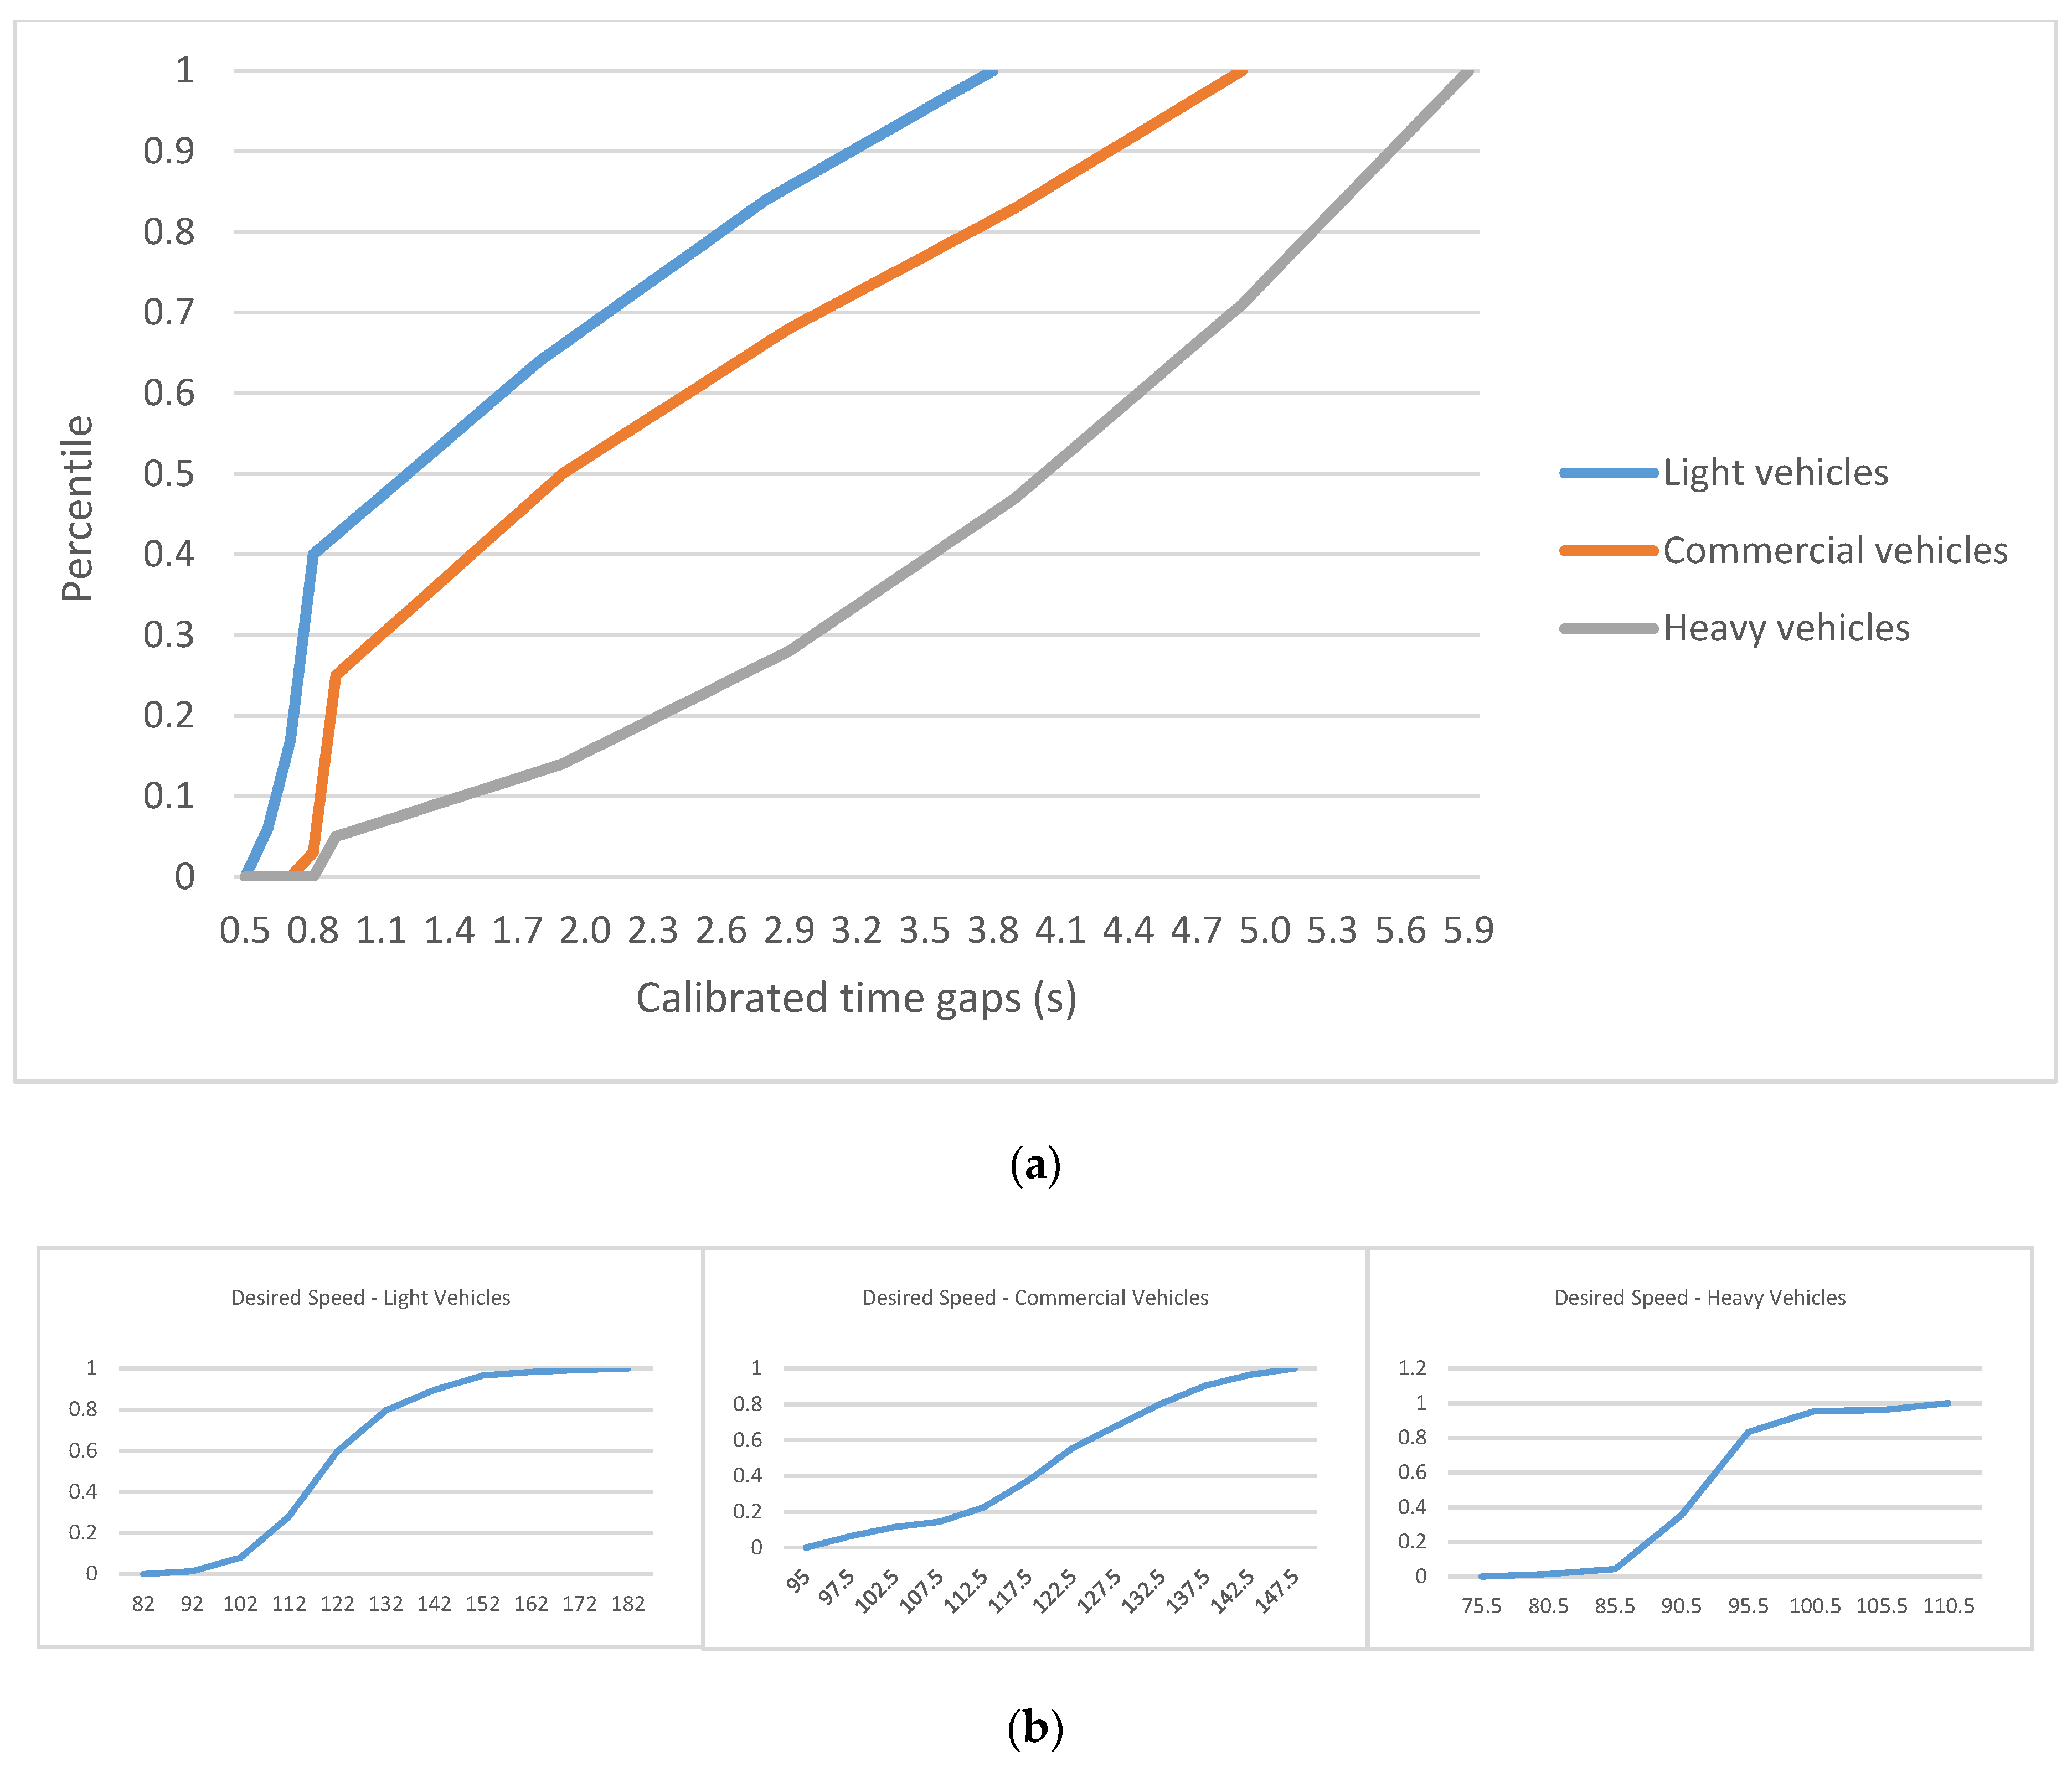
Other simulation parameters that are worth reporting are the recorded key performance indicators and the number of simulations with the corresponding random seeds. Moreover, as will be shown in the following, the behavioral parameters calibrated and/or changed from their default value were: desired speed distribution across the speed limits (based on Italian records [8] and reported in Figure 4) as reported in Figure 3, lane changing behavior upstream the entrance [4], desired time gap distributions and desired speeds (as recorded by A22 sensors).
The driving behavior implemented for each vehicular class was then the result of this calibration process, and no other relevant changes were applied within the model.
The objective of this paper is to frame the possible impacts arising from the reception of the C-ITS message way upstream the traditional vertical signage; therefore, a set of microsimulations were carried out for different levels of market penetration. The presence of CVs among the light vehicles was gradually increased to account for the following percentages: 10%, 20%, 33%, 40%, 50%, 66%, 80% and 100%; the key performance indicators (KPIs) obtained as outputs were the average speed through the lane closure segment for both lanes, the delay through the segment within sections 3 and 5 (Figure 2), the volume of vehicles passing through Section 7 (Figure 2) and the queue delay upstream the bottleneck.
Through the average speed at the lane closure and the traffic volumes on both lanes upstream the closure, the dynamic of the bottleneck is framed. In fact, one of the risks associated with the implementation of the use case roadworks warning—closure of a lane is an uneven distribution of the traffic overcharging the open lane and leaving the closing one empty, thus reducing de facto the capacity of the carriage upstream the closure. The two considered KPIs were used to assess if this effect is triggered by the message and to answer to the first research question. Travel time from Sections 1 to 7 and the delay through the segment within Sections 3 and 5 are used to assess if travel time for upstream vehicles is reduced or increased instead; this should reflect an overall effect on the efficiency of the roadworks and answer the second research question. In fact, the effect of the C-ITS messages entails effects only before the roadworks entrance, leaving the free lanes within the roadworks potentially unaffected and only influenced in their input volumes, not in the driving behaviors and in the functional logics of the traffic. Finally, the queue delay upstream the bottleneck, which frames the delay only due to standstill or queued driving, should give additional elements to answer to both the first and the second research questions. The third one is answered by simulating different market penetration and comparing the results, as reported in Section 4. These KPIs were chosen based on the evaluation methodology reported in [10].
Finally, it should be highlighted how each scenario was simulated six times (the value suggested by the VISSIM manual and already used for other scientific works ([11]) is equal to 5), with an initial random seed equal to 42 and incremented by 1 for each consecutive simulation run. Tests were carried out for some scenarios applying 10 simulation runs and comparing the recorded standard deviations between runs in traffic volumes and speed values. No relevant change was obtained, as shown in Table 1.
3.3. Calibration of the Model
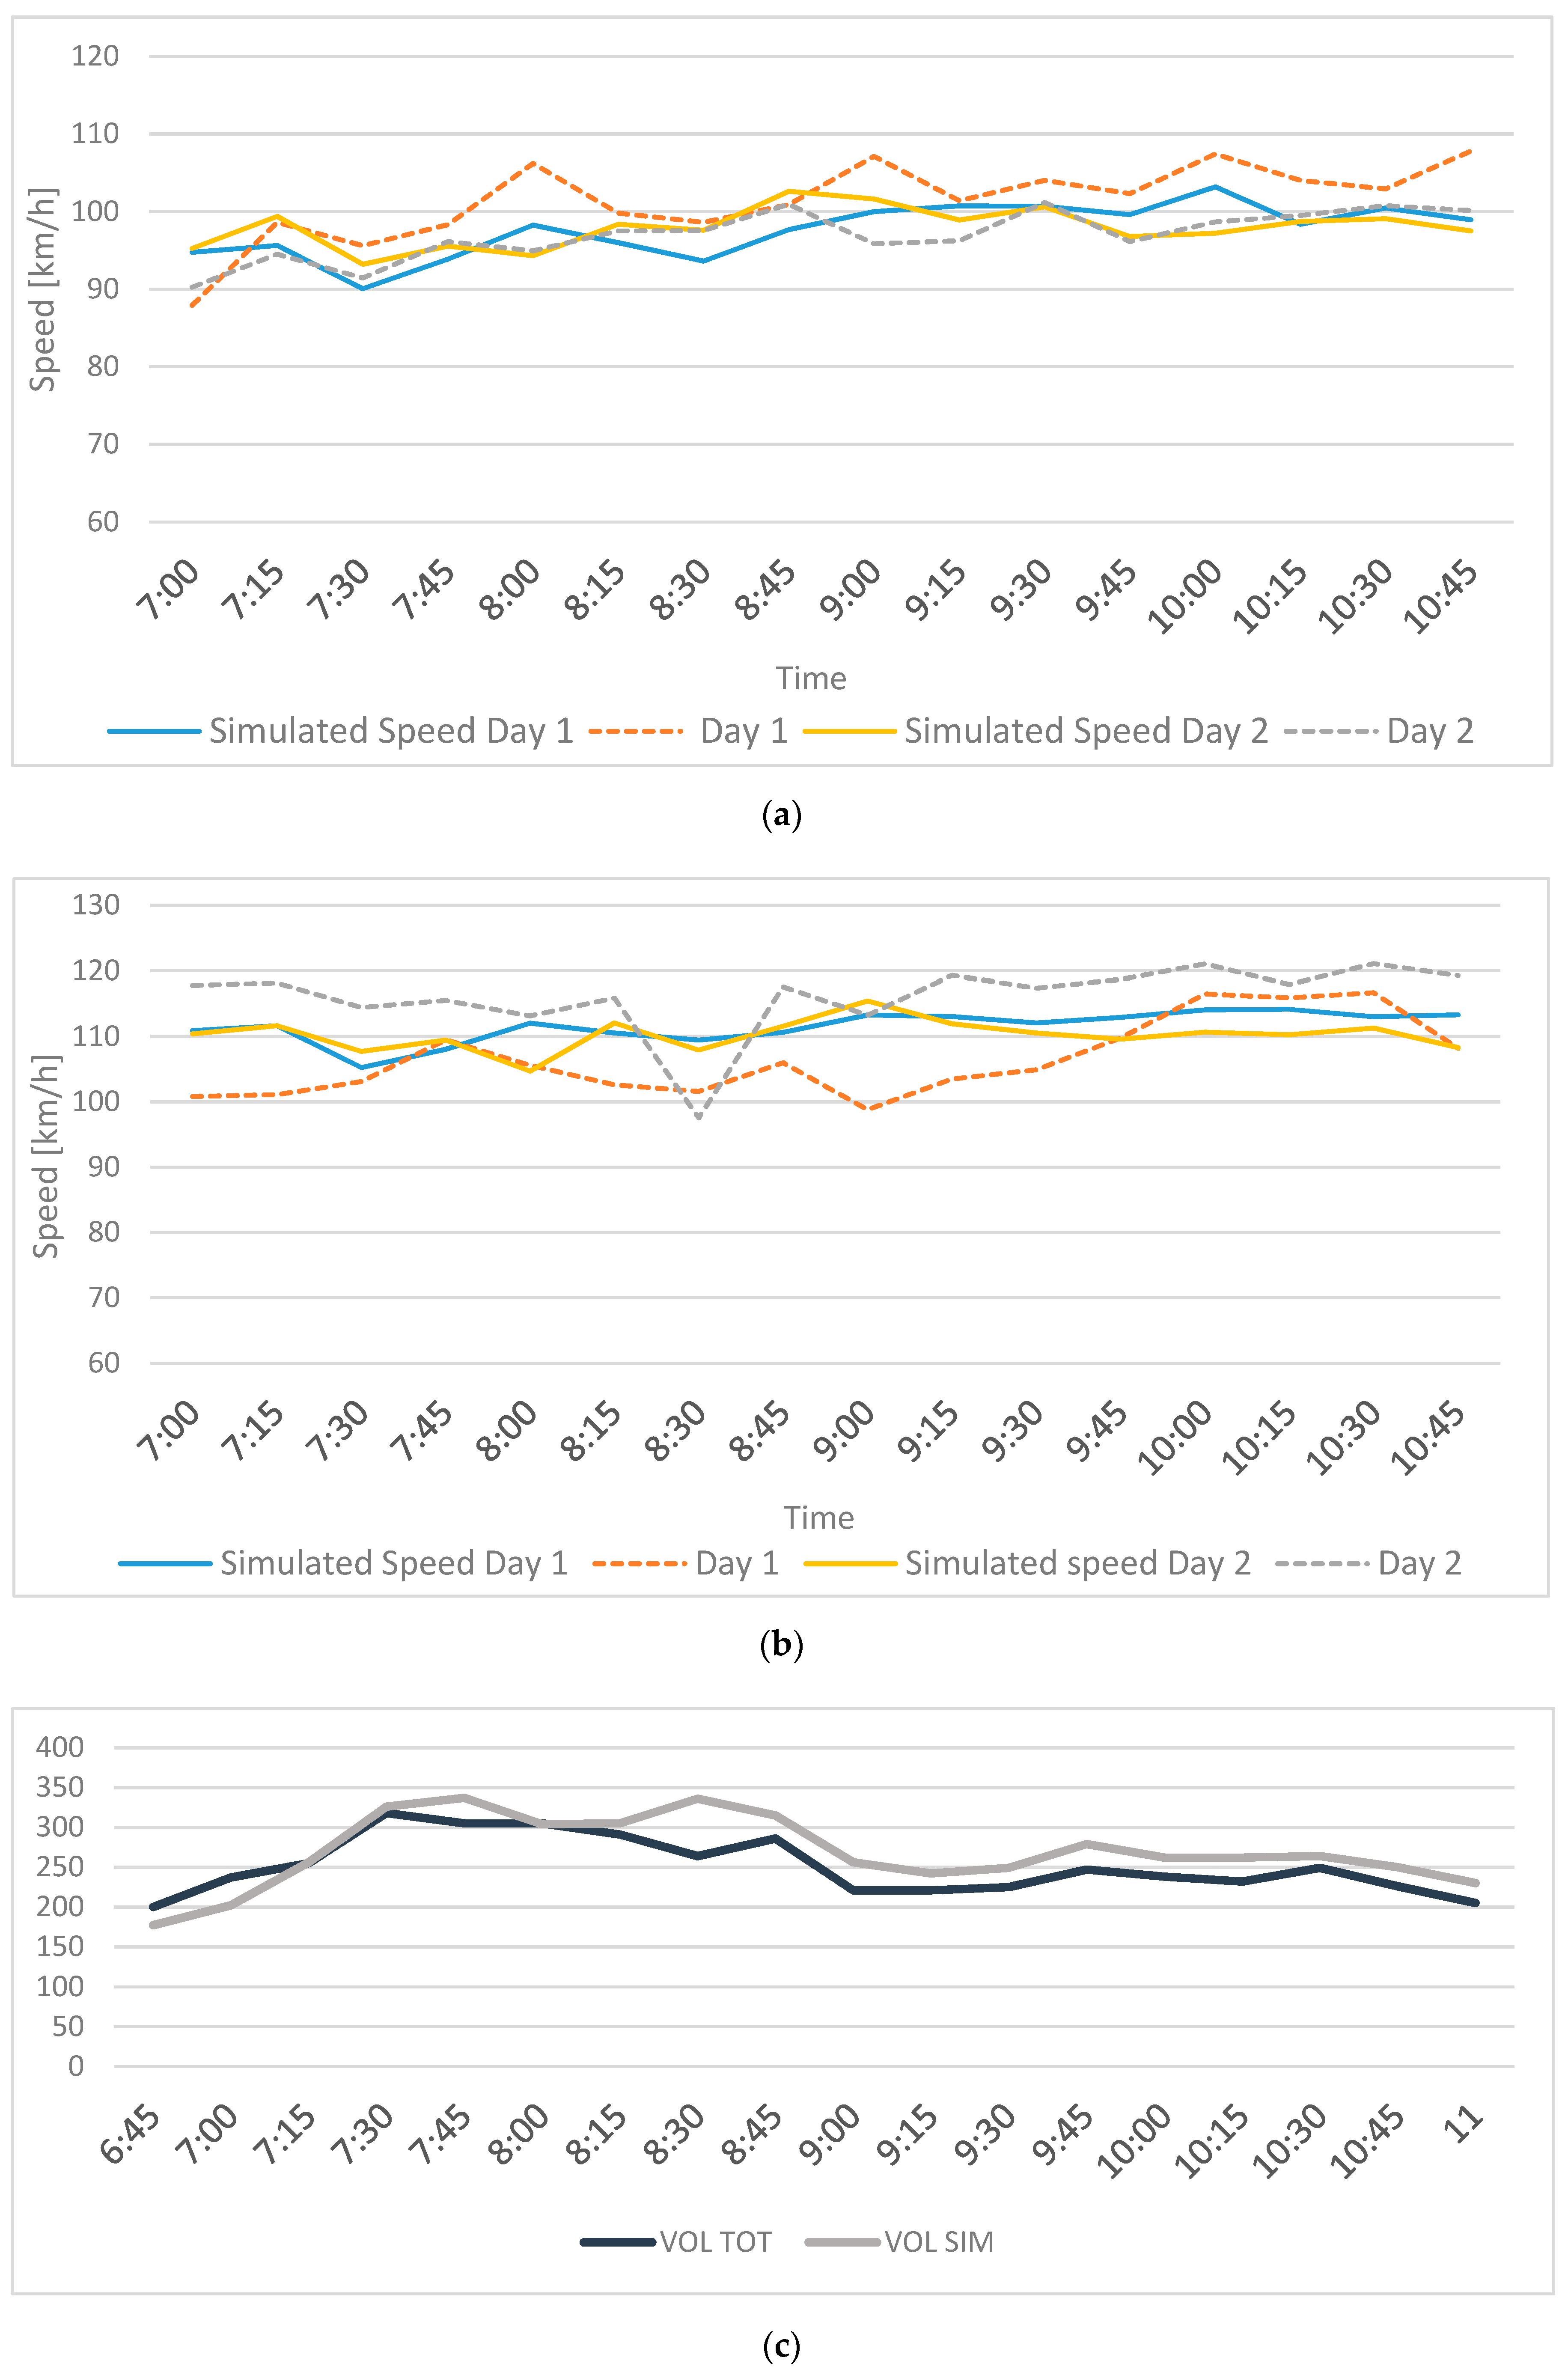
The speed distributions in the different sections upstream the roadworks and the lane change aggressiveness at the roadworks entrance were not the only input parameters that needed calibration and validation. In fact, for the model to reproduce as faithfully as possible a roadworks on the A22 infrastructure, the incoming traffic had to be calibrated and validated as well. Moreover, even the lane changing upstream the lane closure had to be characterized. Therefore, traffic data were received by A22 for two representative days with average traffic flows and not characterized by any unforeseen event (e.g., no accidents, no adverse weather conditions, etc.), these days being two working Fridays (one in March and the other one in May). The first day was used to calibrate the driving behavior of the three considered vehicle classes (light vehicles, commercial vehicles and heavy gross vehicles) and the latter one was used to validate said behavior. The chosen control parameters were the speed values of both days and the traffic volumes on the downstream segment of the Friday in March. How the simulated parameters meet the control ones is reported in Figure 5.
At the end of the calibration process over the day in March, the GEH (GEH = √2(M-C)2/√(M+C), where M is the hourly traffic volume as obtained by the traffic model and C is the traffic volume as recorded by the on-road sensors) values were quite under the threshold of 5, the highest being 2.362385575 and the average being 1.545727666. Moreover, the Theil’s inequality coefficient [5] was evaluated for both the working Fridays; the values reported in Table 2 were obtained for the speed values on lane 1 (slow lane) and lane 2 (fast lane).
The Theil’s coefficient is a dimensionless value assessing the forecasting ability of the model by comparing the actual value (as recorded by on-road sensors) and the simulated value in a similar fashion to the GEH parameter. For Theil’s coefficient ranges between 0 and 1, the closer the value is to 0, the higher the forecasting precision of the model. Still following [5], acceptable values of U are the ones lower than 0.3; therefore, the obtained ones were considered more than fitting to conclude the calibration and validation of the driving behavior (values lower than 0.1 can be considered highly fitting [12]).
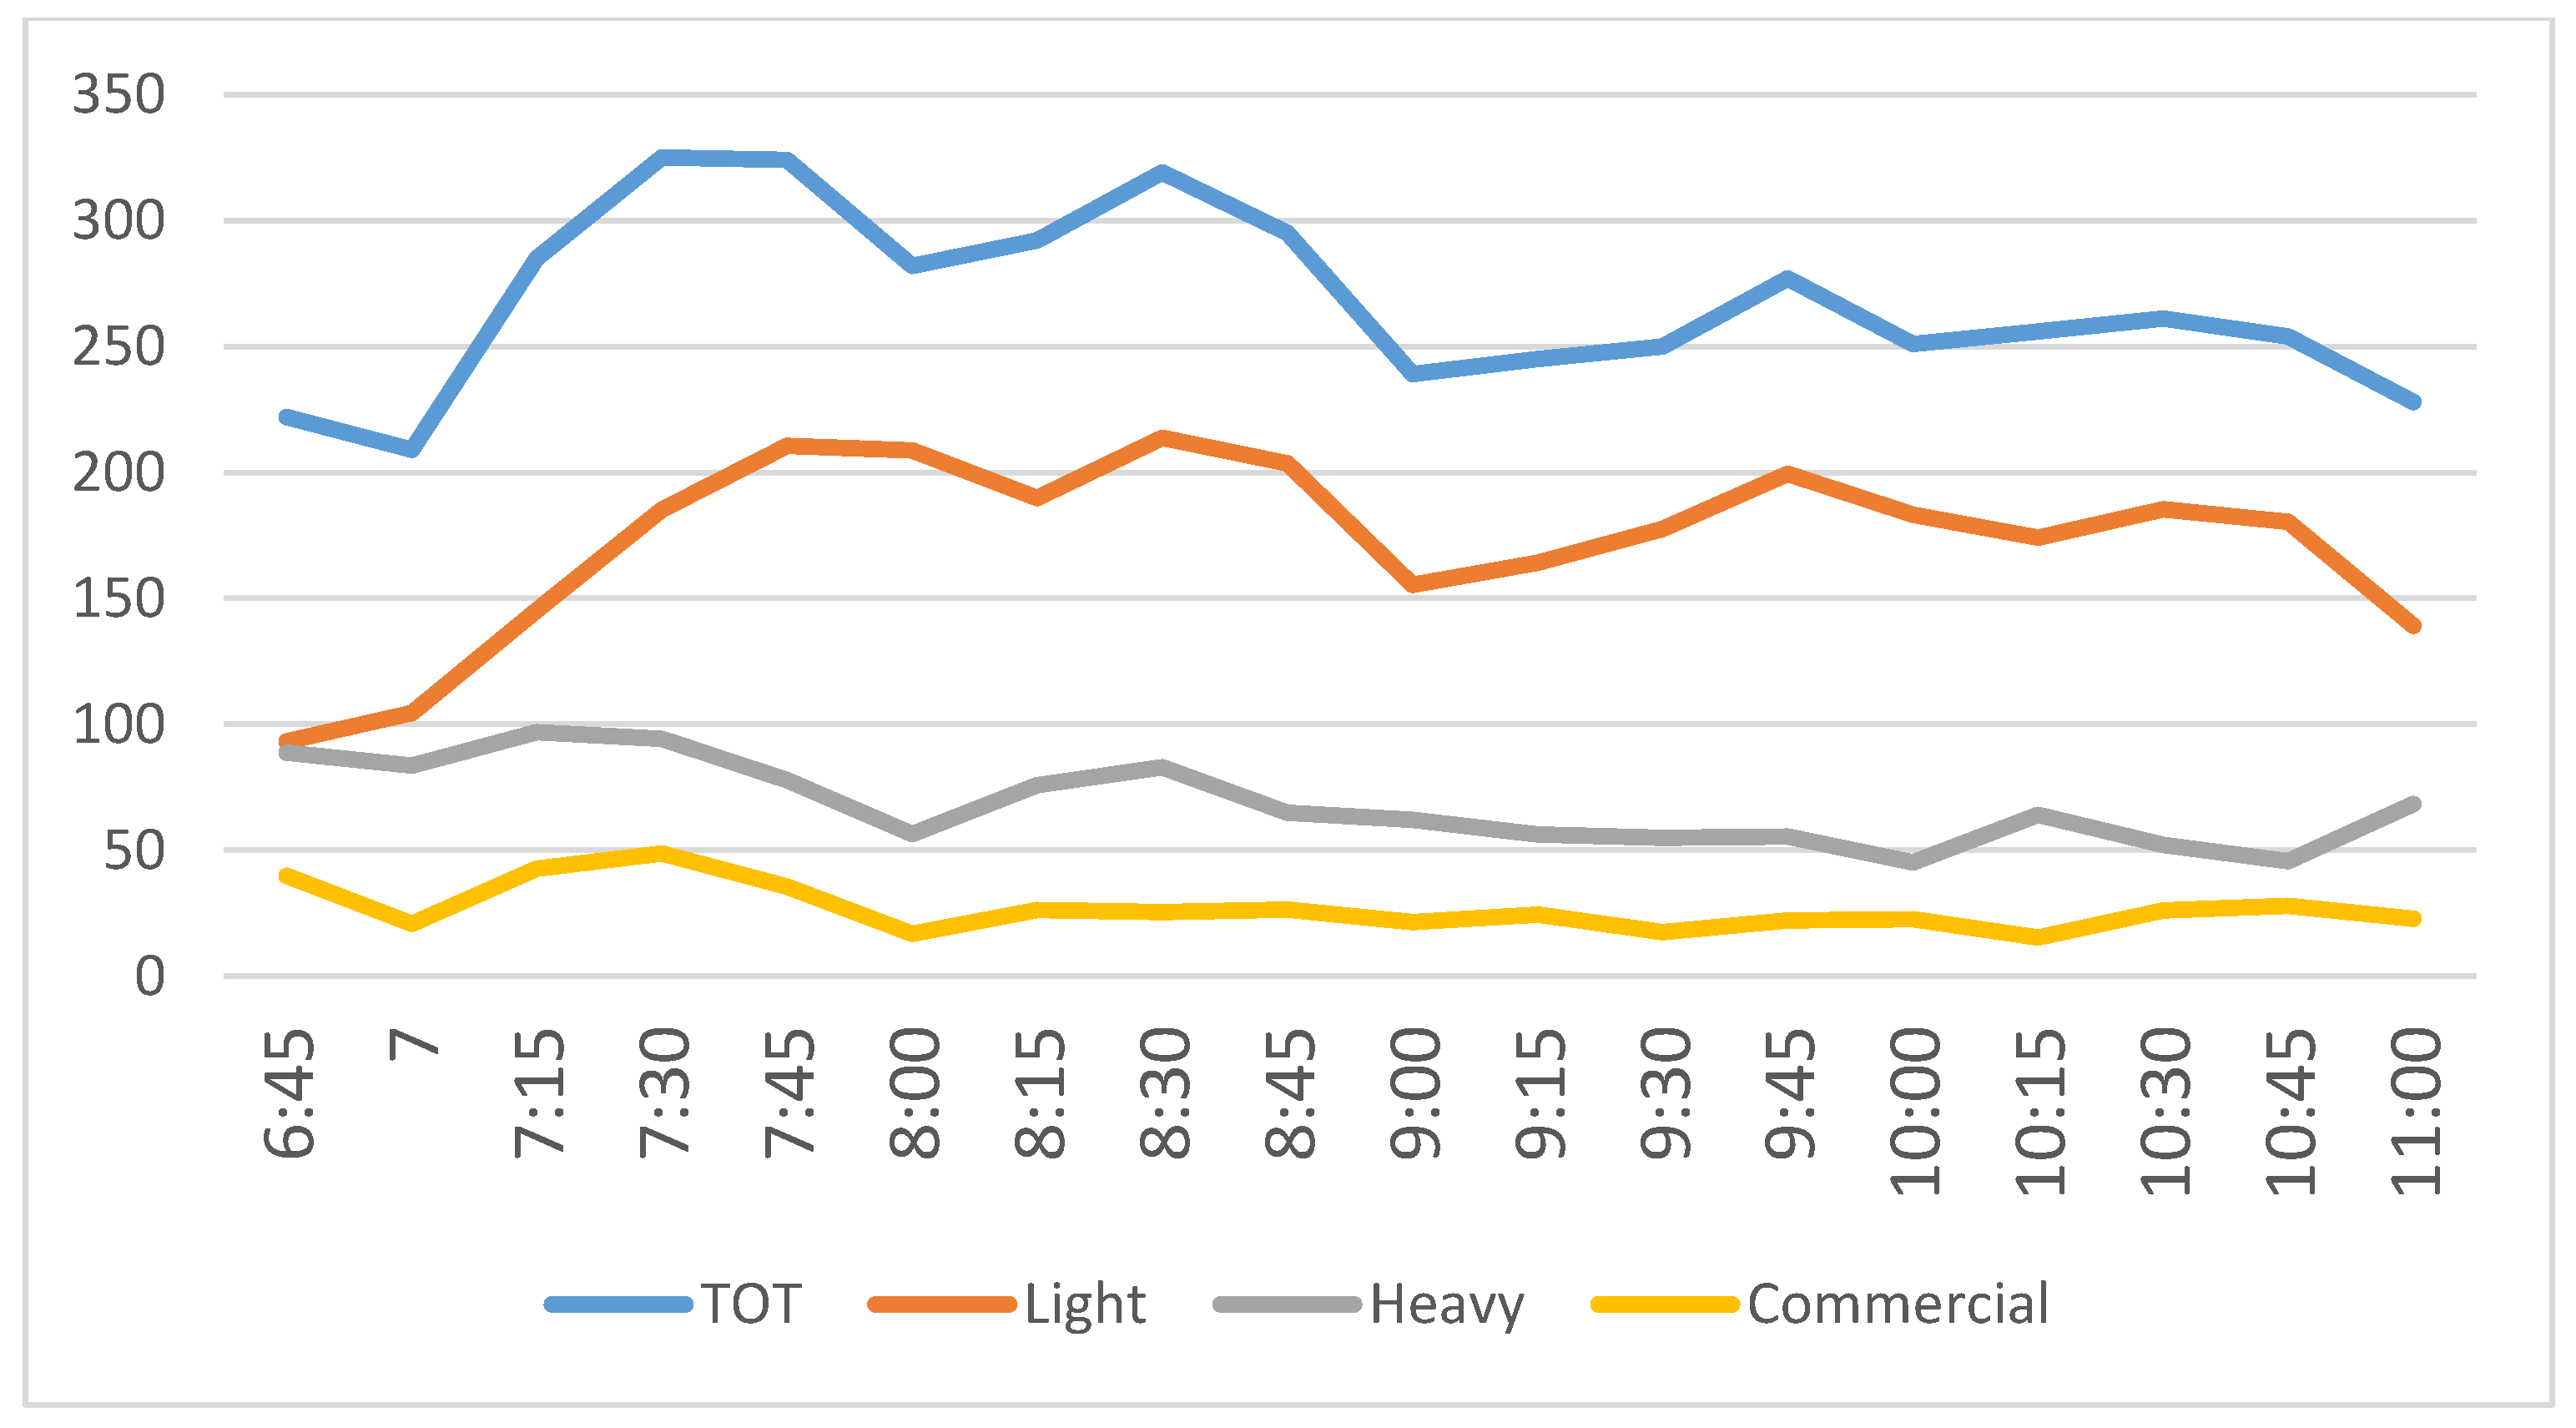
As mentioned, the model had to be somehow calibrated also in its ability to reproduce a lane closure due to roadworks, though. Therefore, the set of data reported in [8] were exploited, the layout of the roadworks being coherent with the one in Figure 2. An exact value of the speed distributions was obtained, while for lane changes, the research hypothesis reported above had to be kept, instead. Finally, as mentioned, the input traffic flows were deemed average as recorded on A22 and are the following ones reported in Figure 6 to foster replicability.
Still, to foster replicability, an overview of the calibrated parameters is provided in the following figure.
4. Results and Impact Evaluation
In the following, the results obtained by the simulations are reported and commented. Again, it should be highlighted how the chosen research questions at this stage of the evaluations reflect a focus on traffic efficiency and a focus on the segment upstream the roadworks for the reasons listed in Section 3. Once the field tests programmed within C-Roads in Italy are carried out and a more precise behavioral feedback is obtained, the evaluation should be widened also to impact sreas such as safety and environment [9,10,13,14] and could allow to reproduce the behavior within the roadworks rather than upstream.
The first set of results aims to answer the first research question: Does the average throughput of the lane closure increase due to the received information? It should be highlighted that available traffic data could not allow to calibrate highly congested traffic; therefore, the actual capacity of the bottleneck, namely the maximum amount of vehicles traveling through the only lane left, is not calculated. In fact, how it will be showed in the following, the overall amount of vehicles traveling through the roadworks does not increase for the simple reason that every vehicle can pass through since the baseline scenario. Therefore, what this research question investigates is if the flow of vehicles arriving to the roadworks is able to enter in advance and with a higher speed thanks to the shift of connected vehicles to the fast lane due to the C-ITS message.
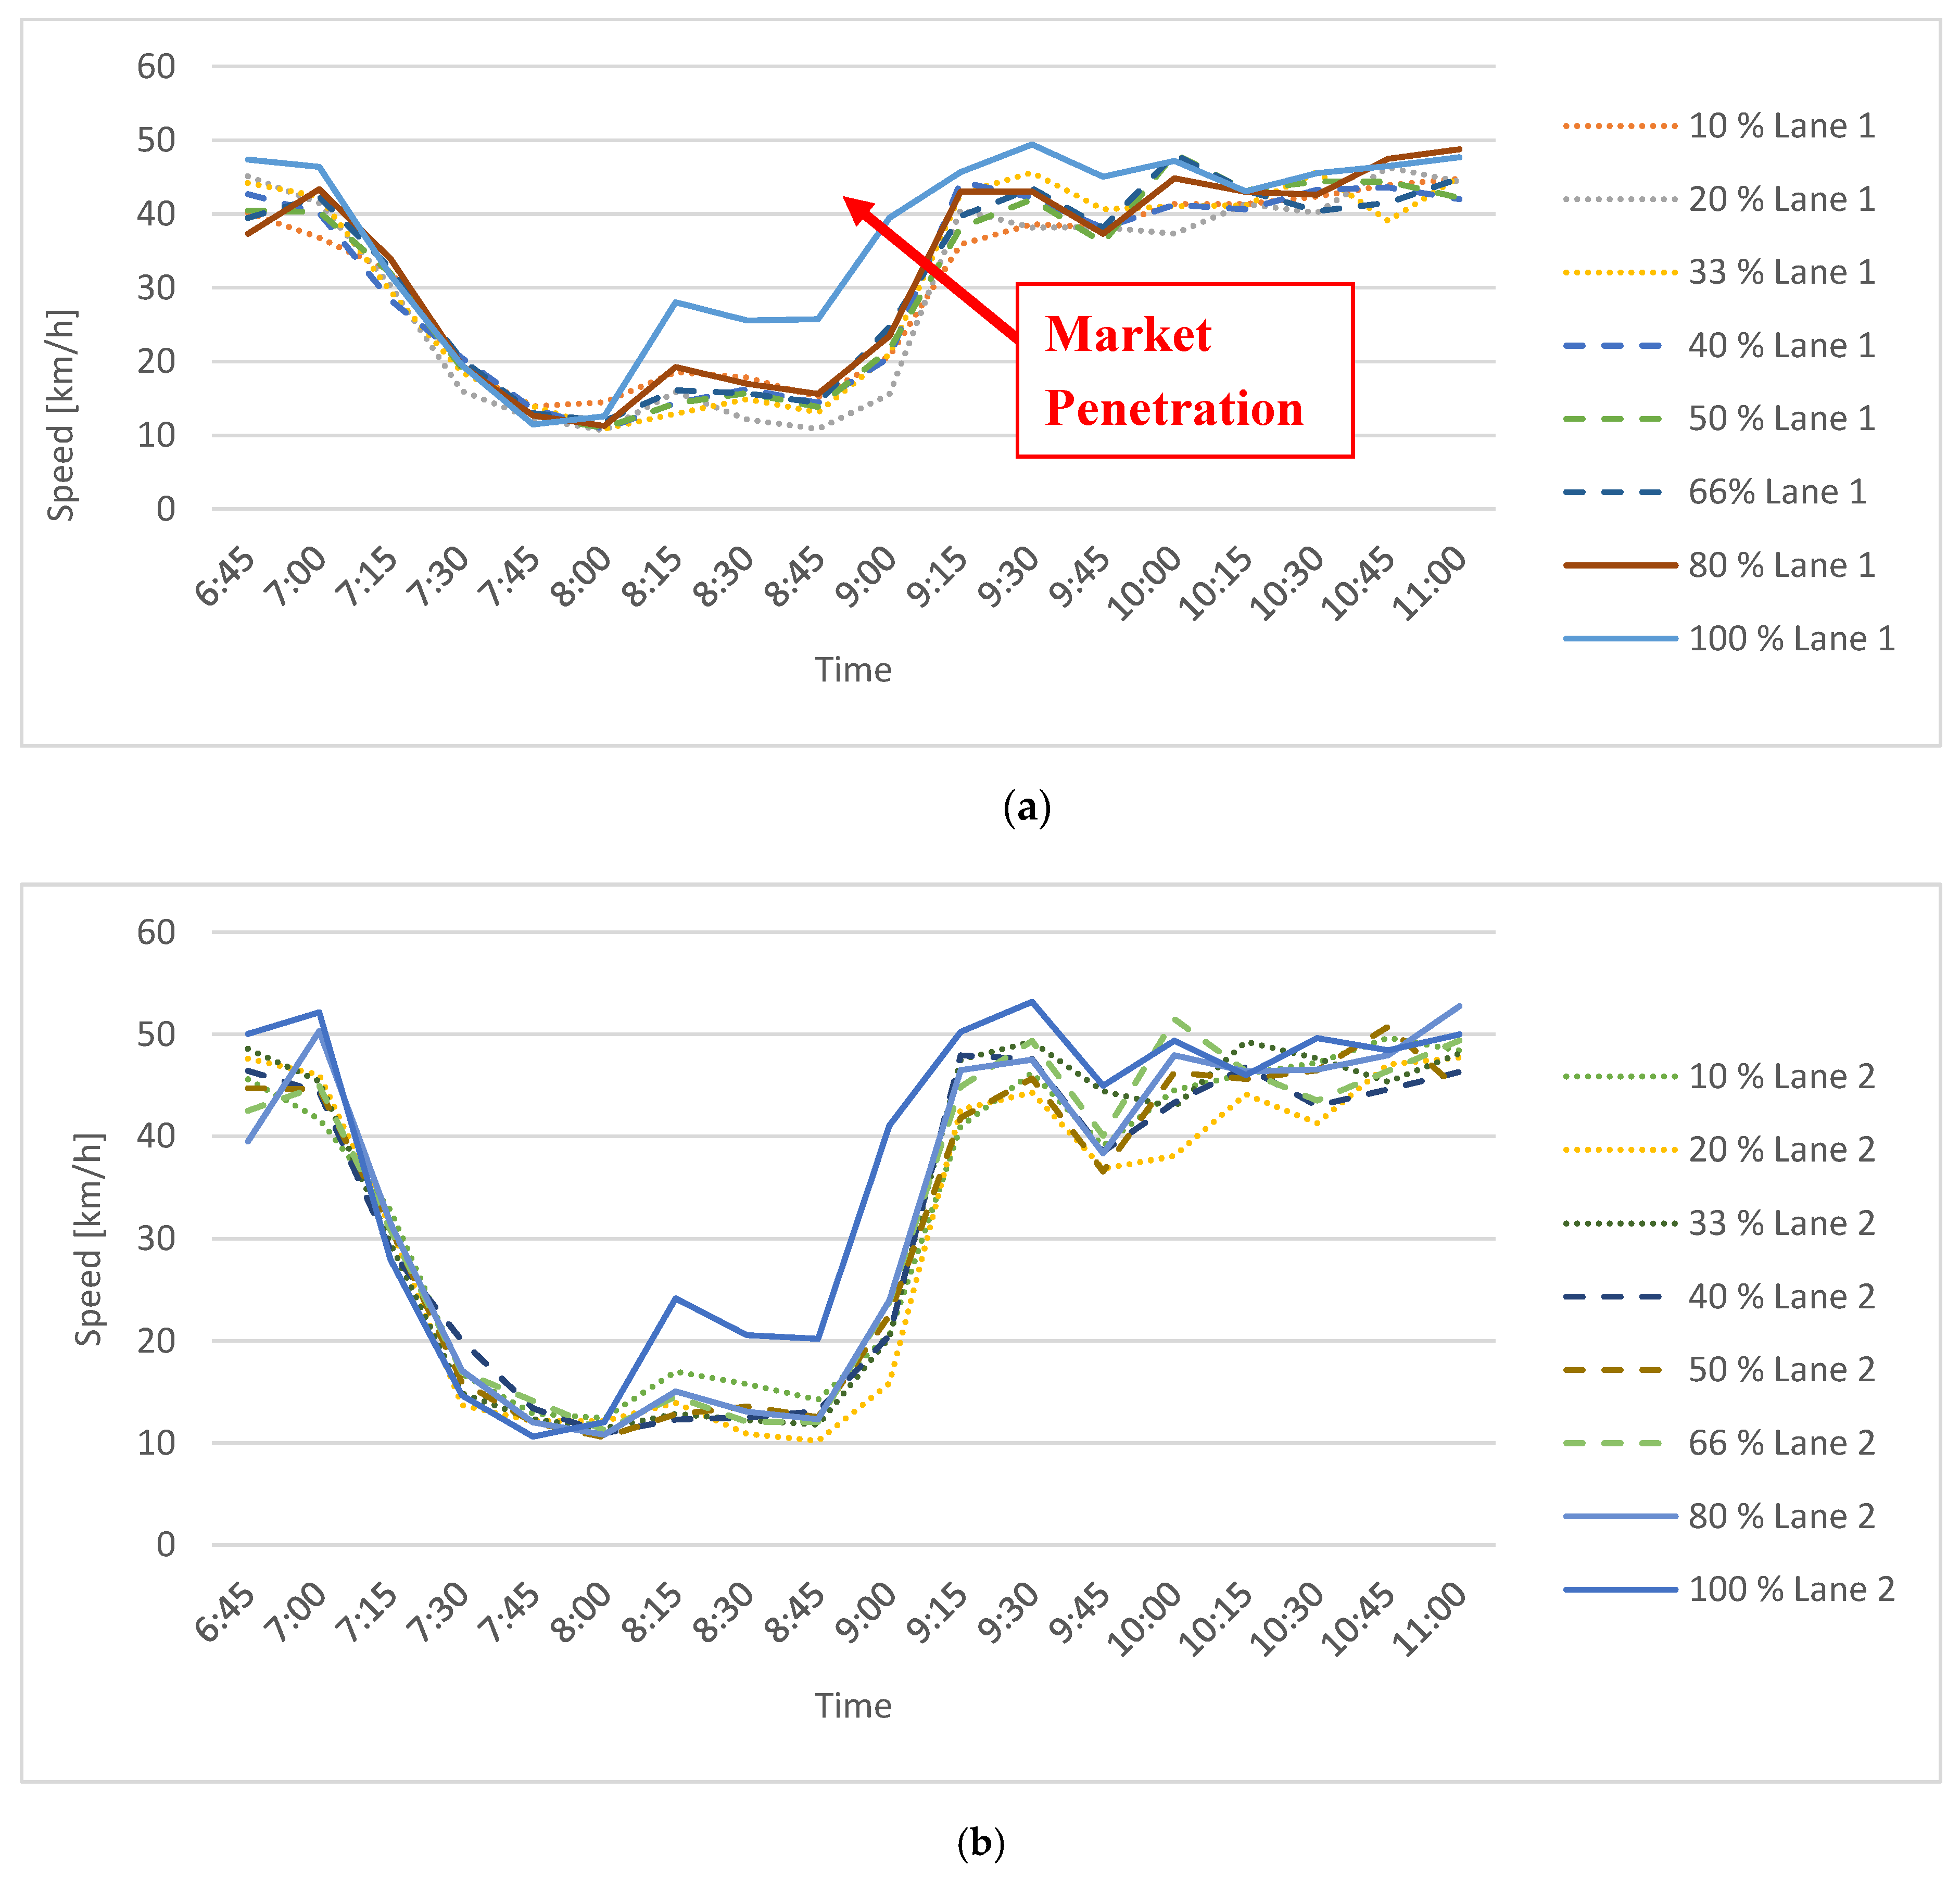
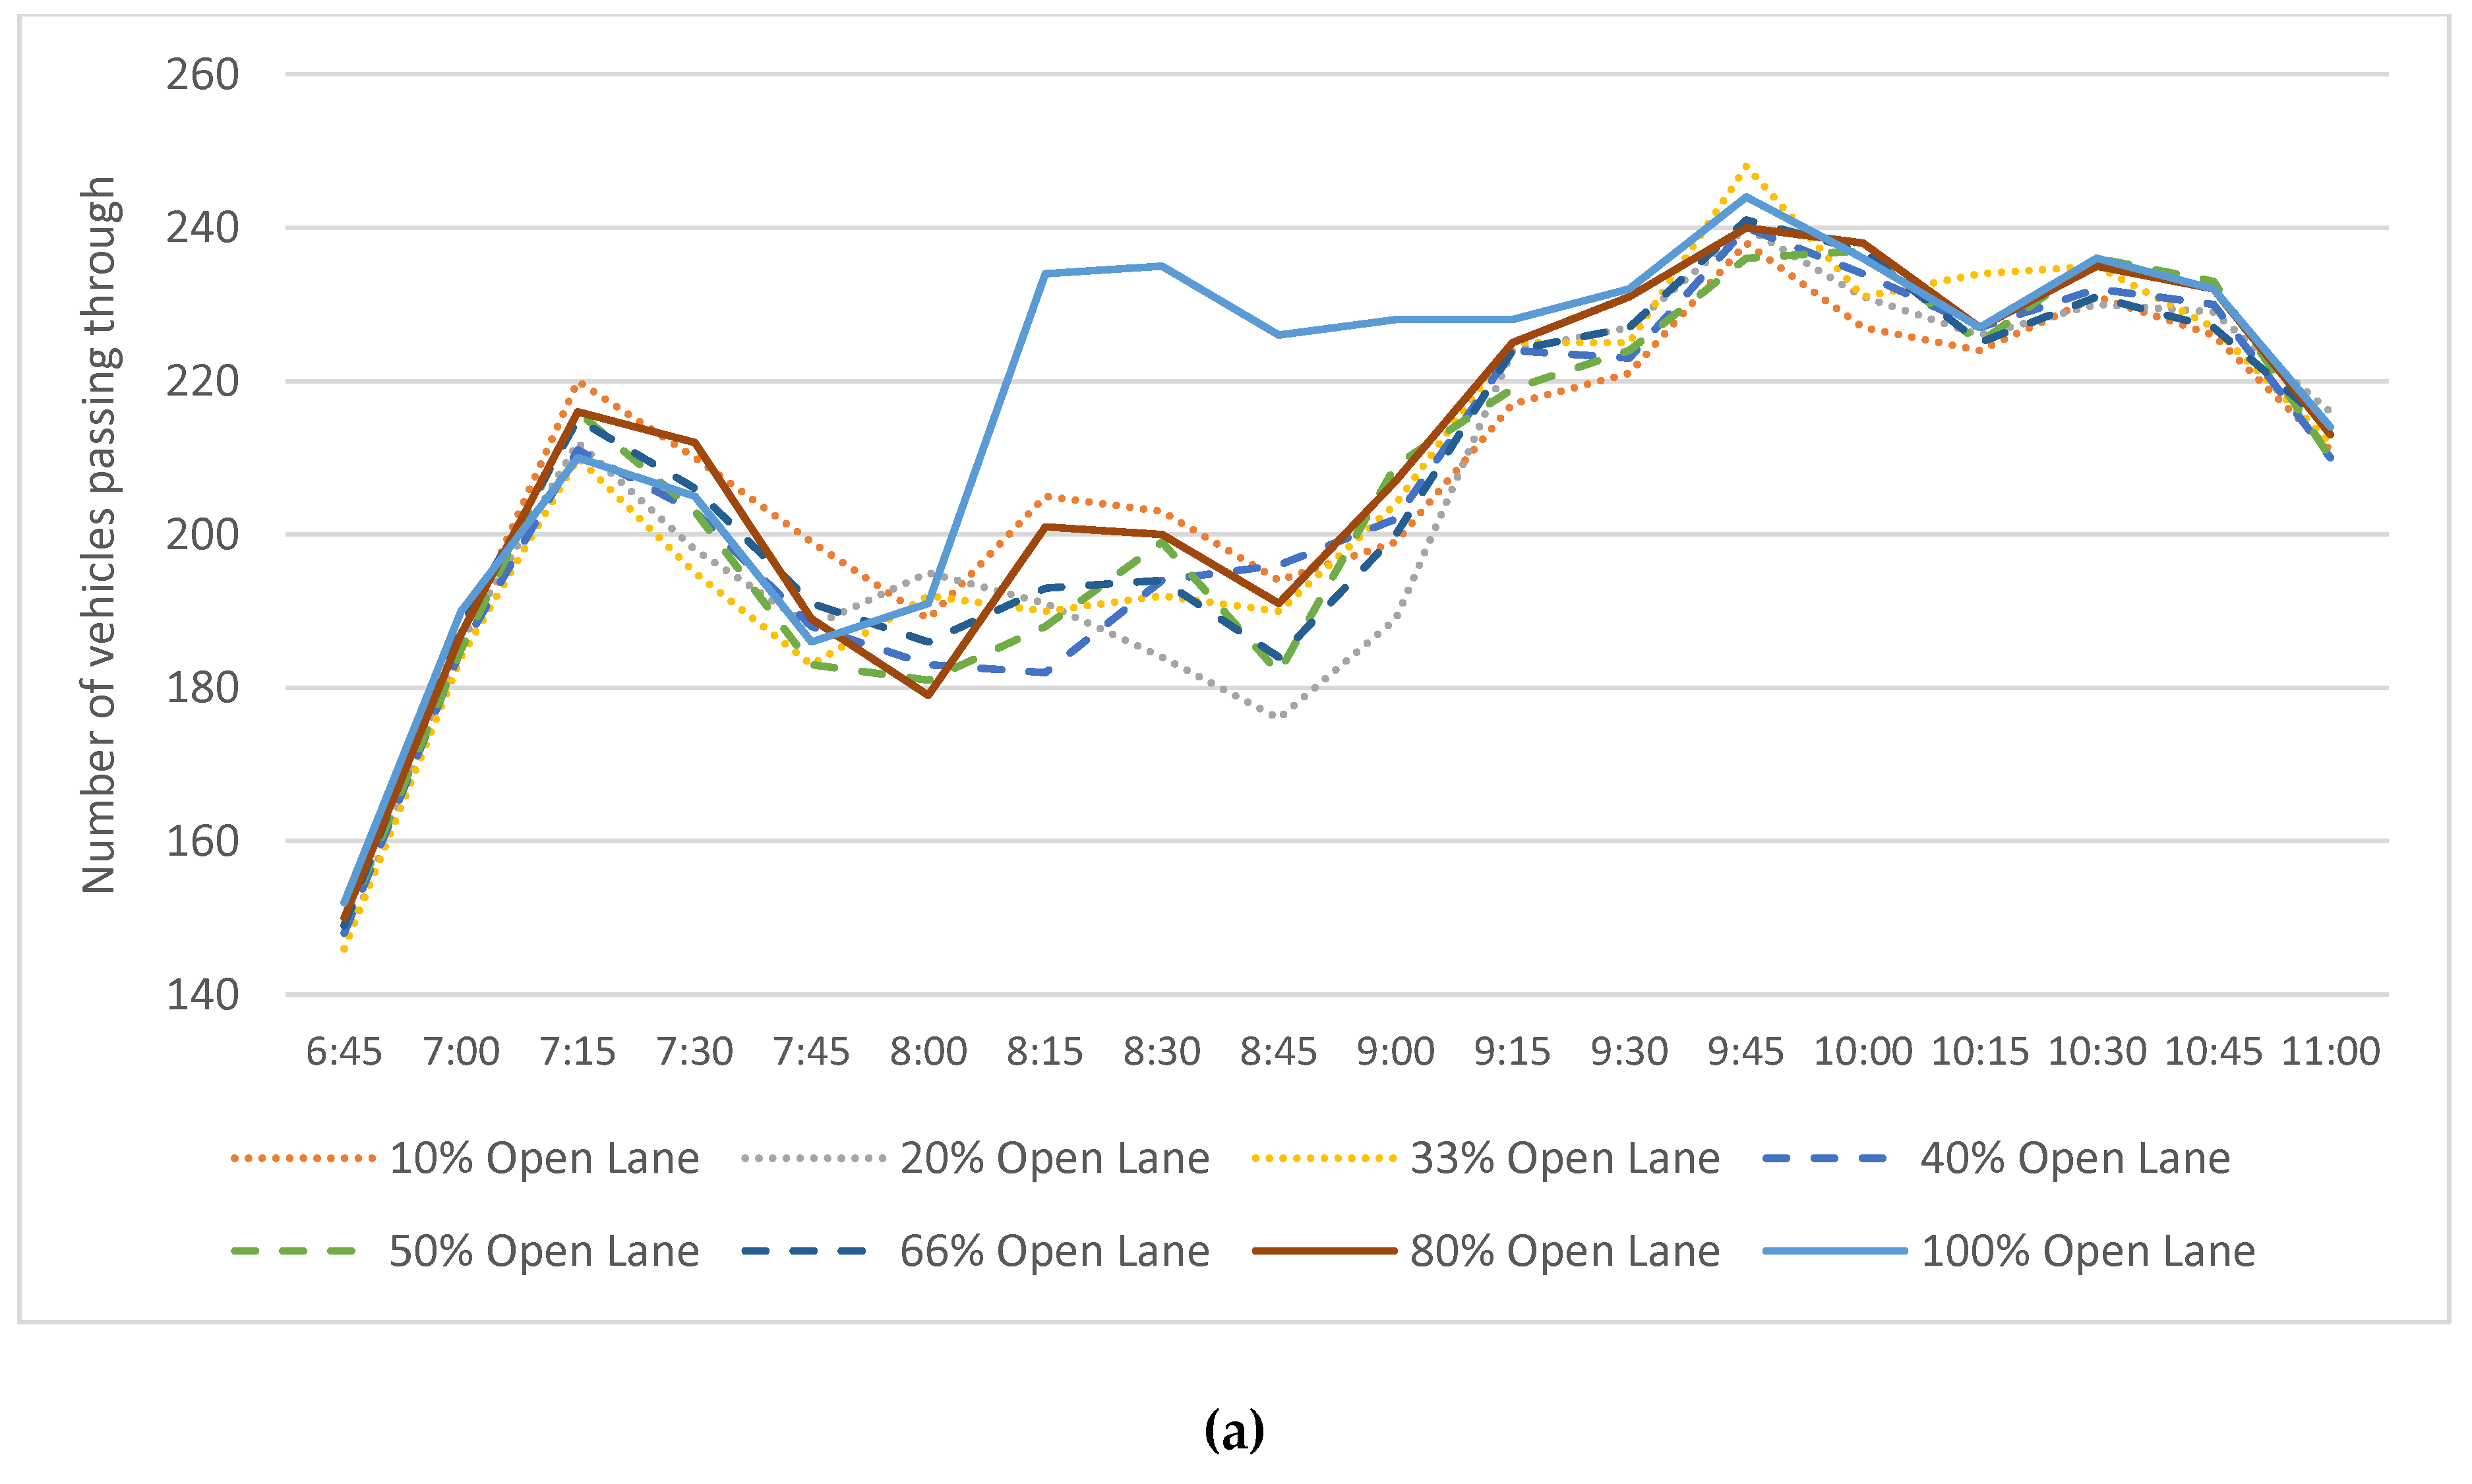
By comparing Figure 8a,b, it is interesting to note how, on lane 1 (the closing one), a positive trend arises with the increase of market penetration. In the presented dissertation, each time an increase in speed or a delay reduction is bound to the market penetration trend, a red arrow is reported, as in Figure 8a. In this case, in fact, for an increasing number of connected vehicles among the traffic flow, the speed for most of the simulation time increases as well; while, on lane 2 (the open one), no defined trend can be framed. Still, the 100% market penetration (MP) scenario seems to perform a different traffic dynamic on the open lane when compared to lower MP levels, achieving speeds higher by even 10 km/h.
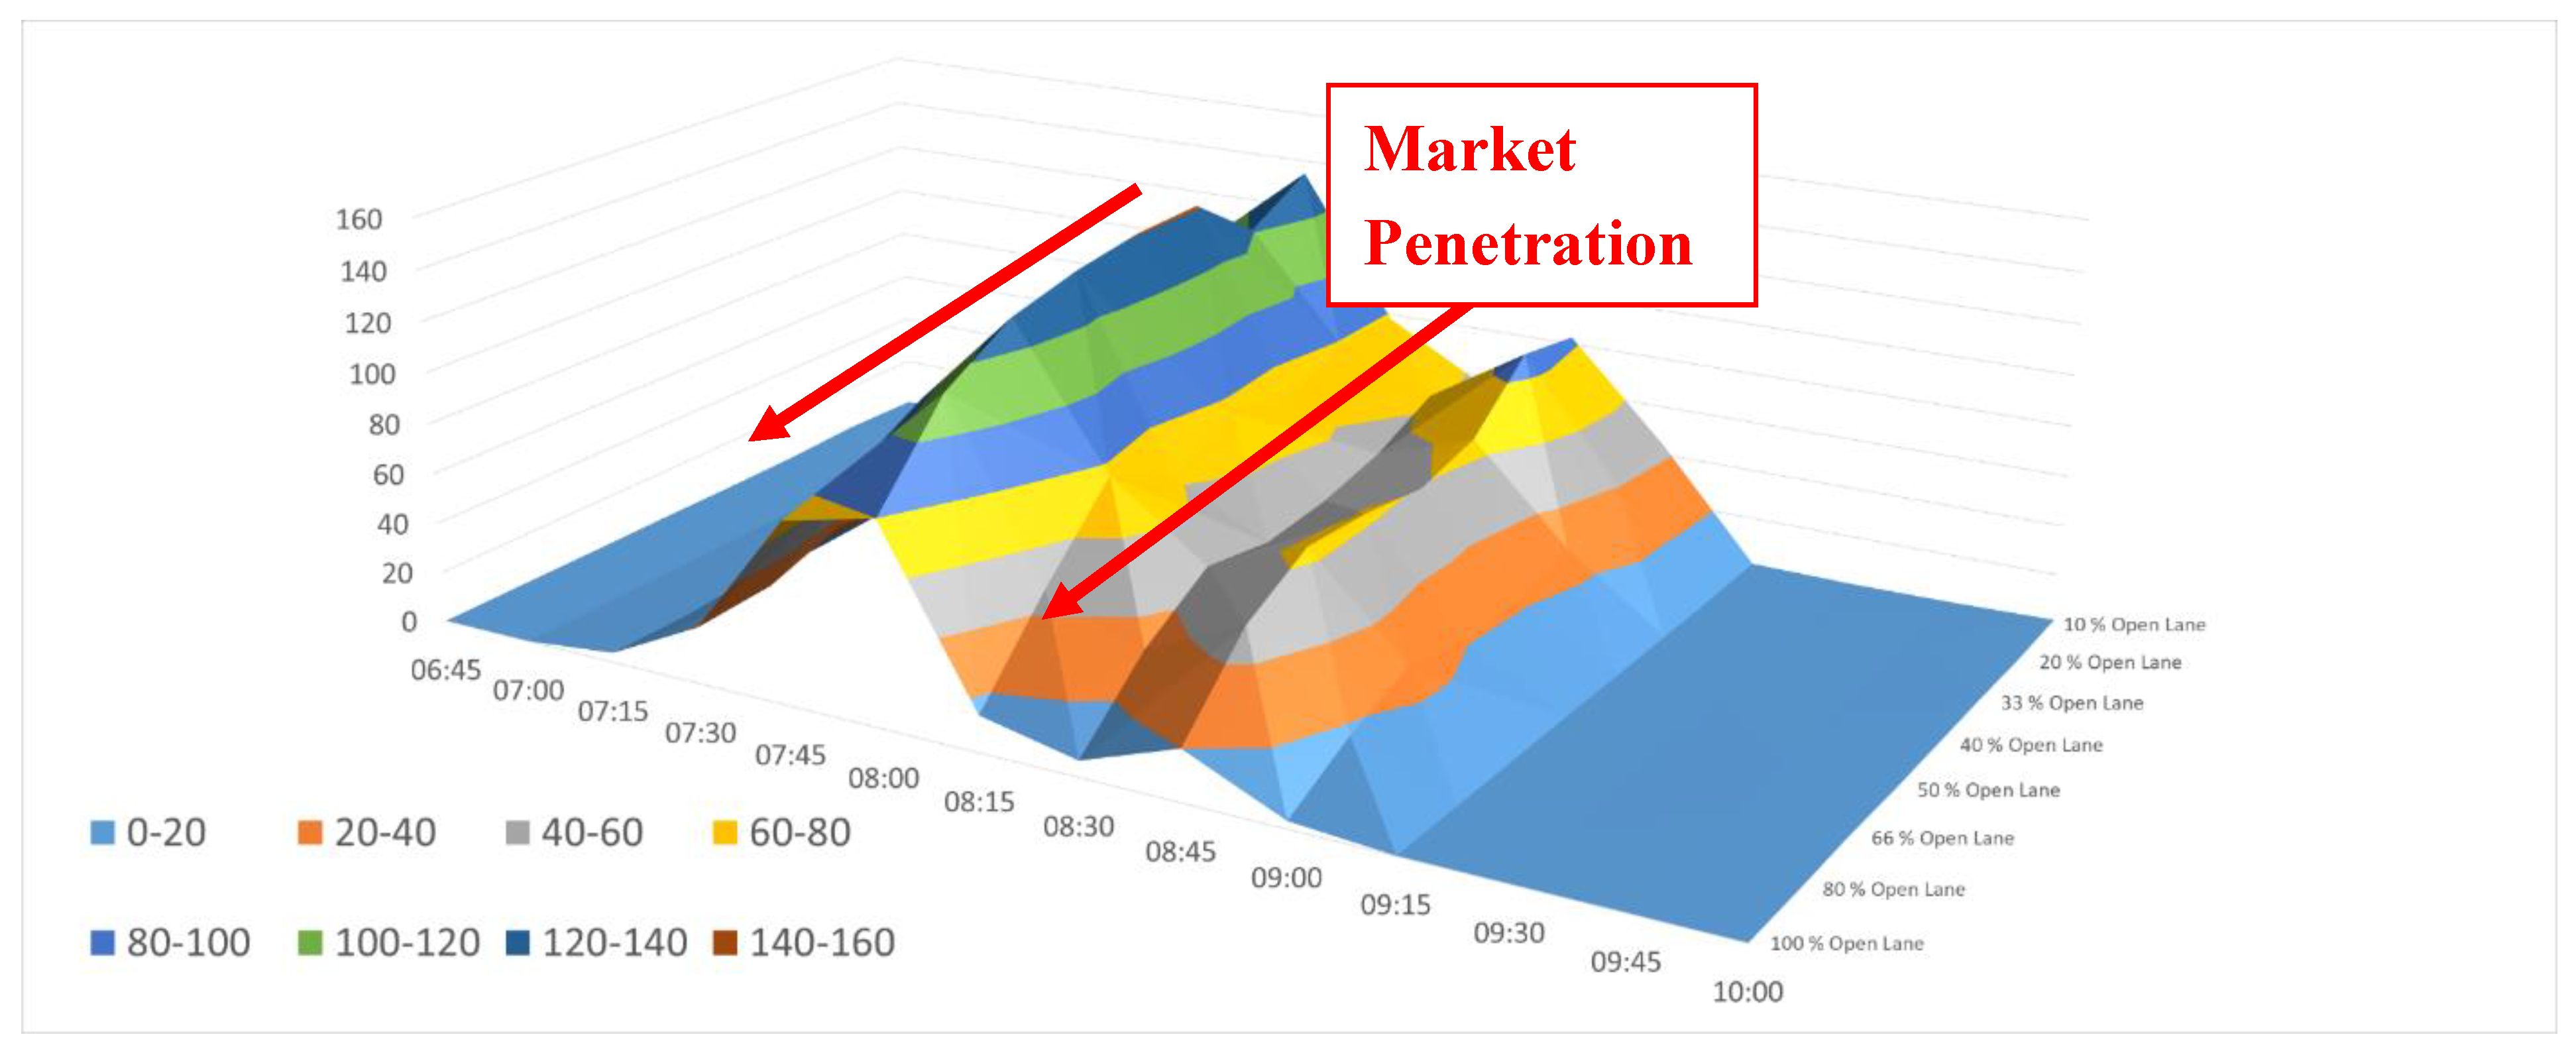
Figure 8 alone can be misleading, because it only reflects the speed at which the lane closure is reached (recorded 150 m upstream the very last point of the slow lane), not the behavior of vehicles at the closure (at Section 7 in Figure 2). Figure 9, on the other hand, represents the time spent by the upcoming vehicles with a speed value lower than 10 km/h and a headway value lower than 20 m on the open lane, queueing from Section 7 upstream.
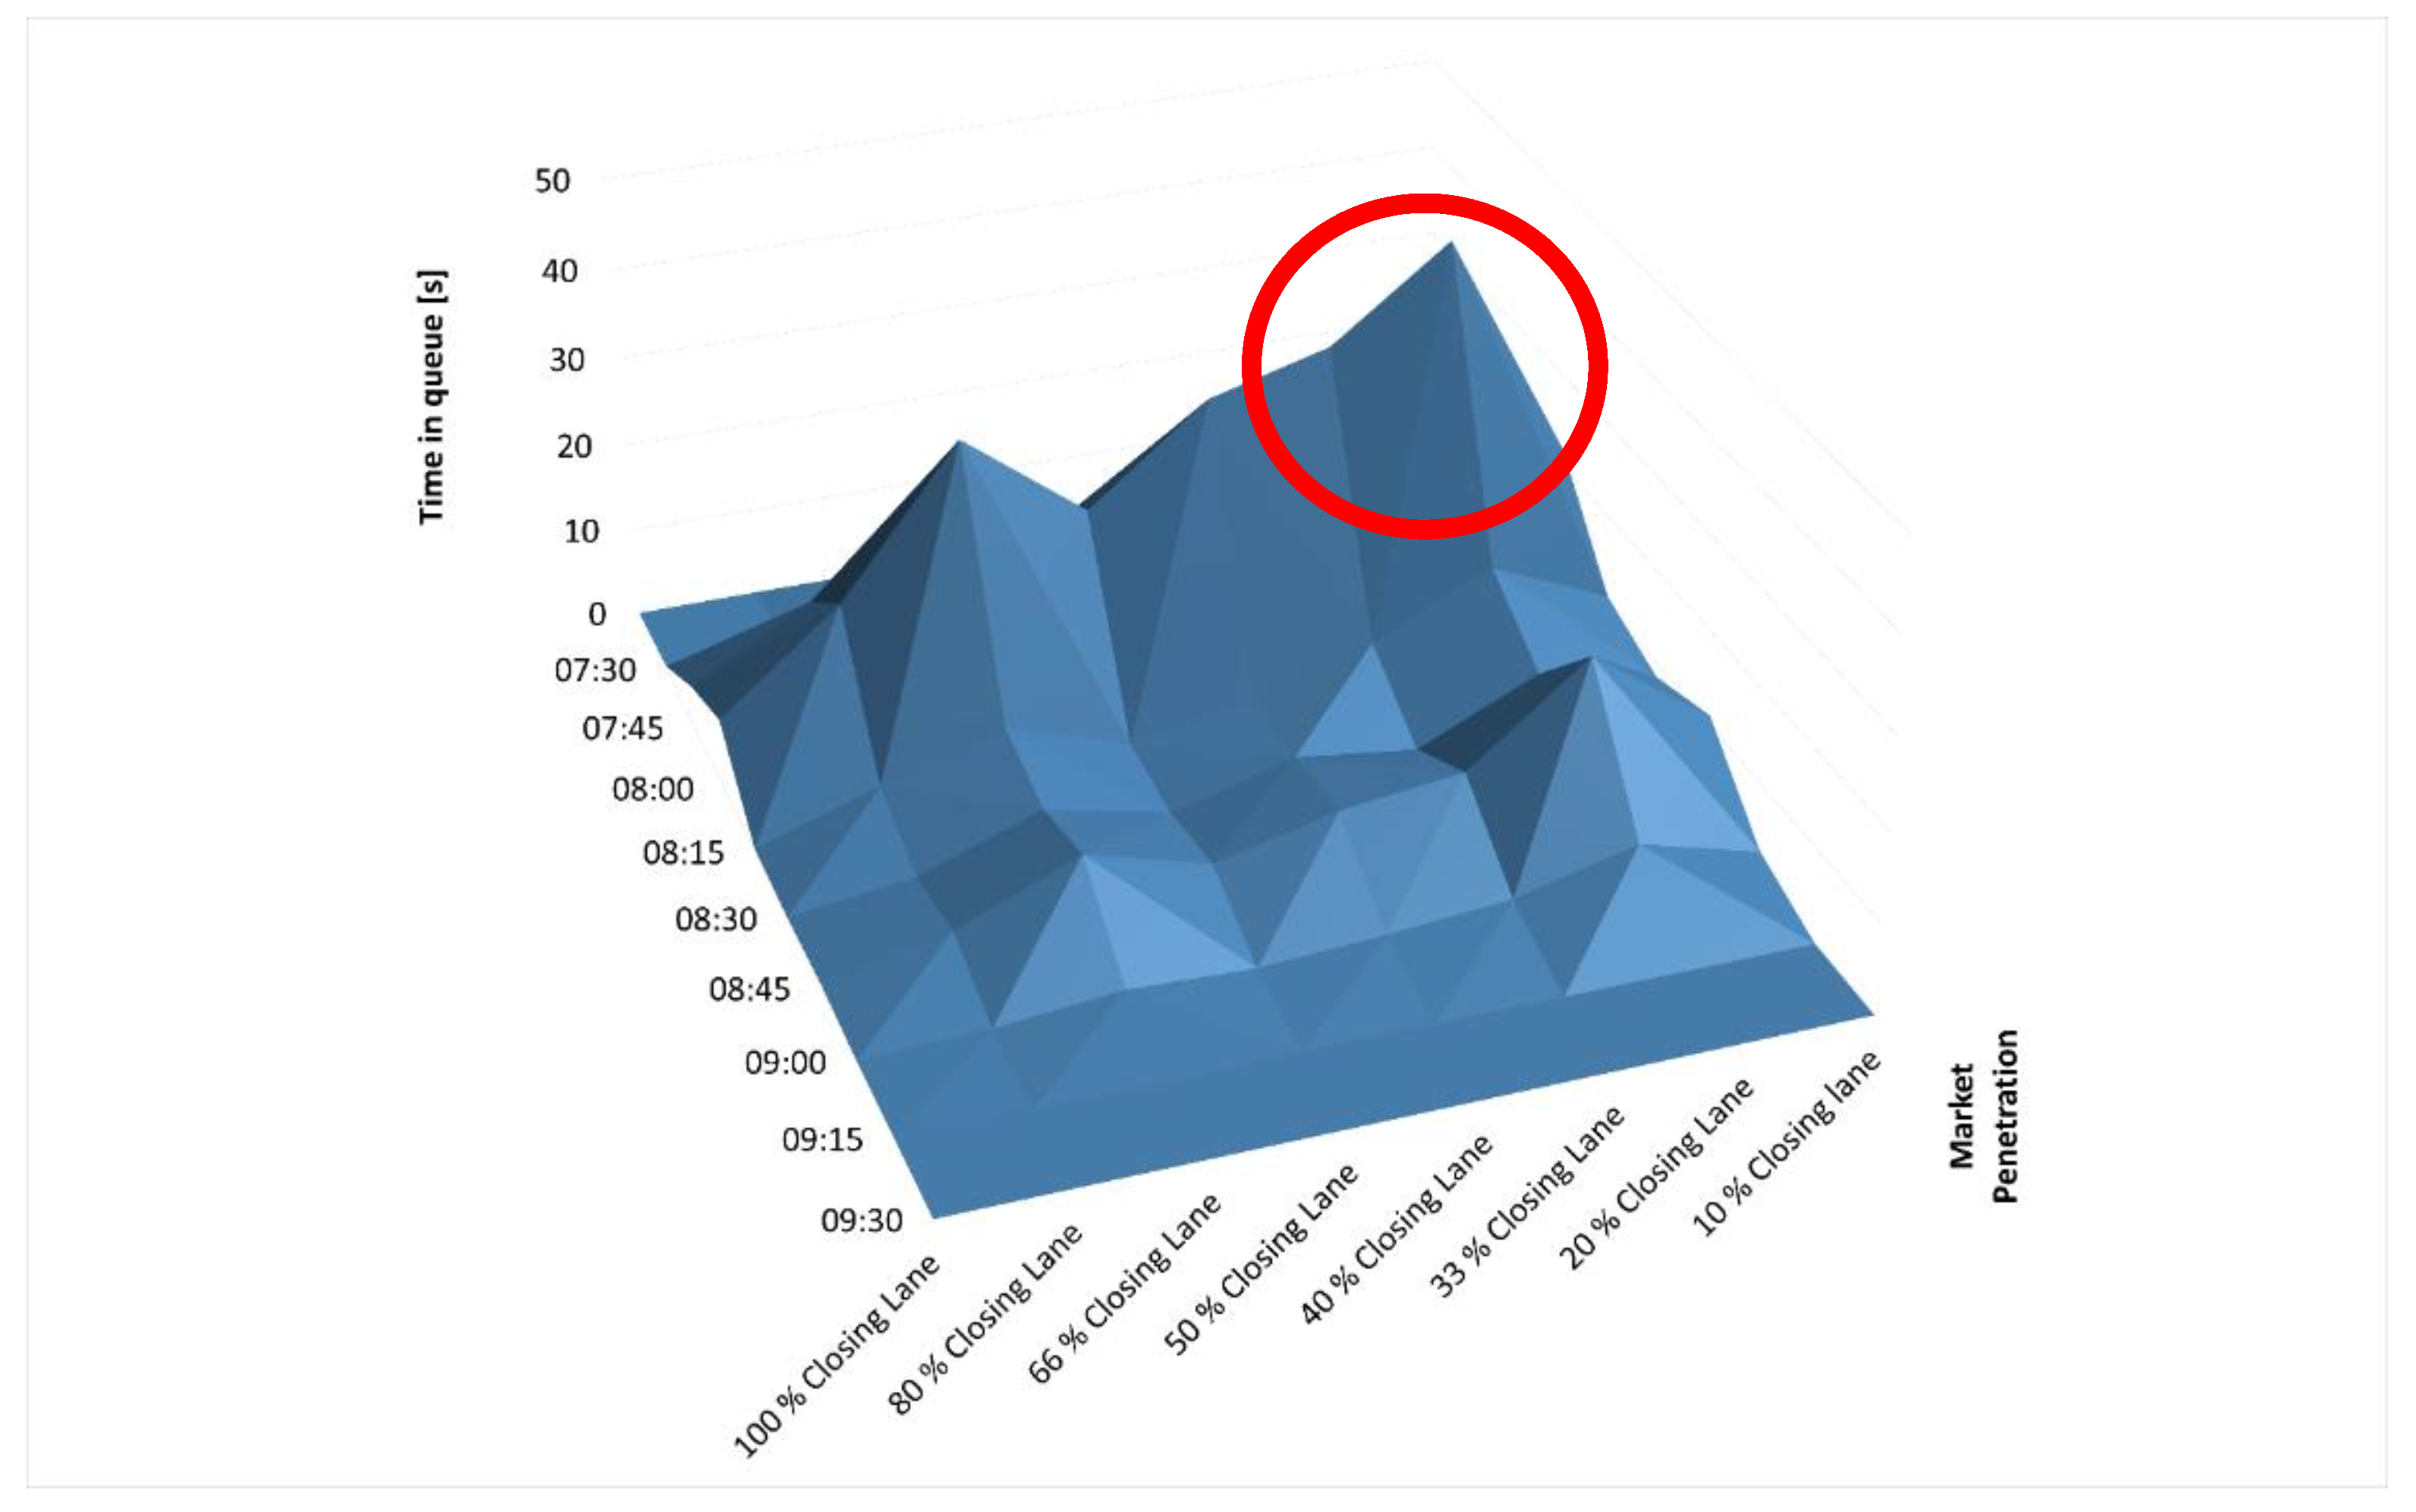
It can be seen that, with the only exception of 20% MP, the queuing time at the entrance steadily decreases; for 100% MP, the difference in queue time reaches values of 60 s when compared to 10% MP during the first peak. Moreover, the second peak is kept under the minute (compared to the 80 s at 10%). The singular nature of 20% market penetration arises also on the closing lane, as reported in Figure 10.
In fact, as it can be noticed from Figure 10, the lower queue time at 20% MP on the open lane is reflected by an increase of queue time in the closing one (marked through a red circle). Therefore, the result is not simply a singularity but reflects a traffic dynamic that is triggered when 20% of the light vehicles on the closing lane shift to the open lane before reaching the closure. It can be hypothesized that this, in turn, makes it more difficult to merge for the remaining light vehicles, because they are traveling on a lane which is strongly affected by heavy and commercial vehicles. Their inability to merge negatively affects the rest of the traffic on the closing lane by impacting on its overall speed (20% MP shows the lowest speed on the closing lane (Figure 7a). For 30% MP onwards, the number of light vehicles on the closing lane continues to diminish, and traffic on the closing lane is no longer disrupted by the promiscuity of its composition but starts capitalizing instead on a high flow of heavy and commercial vehicles that tend to merge more aggressively on the open lane, with higher speeds thanks both to a steadier driving and to fewer overall vehicles on their lane. This in turn translates into higher queue times on the open lane and lower queue times on the closing one; from 30% MP onwards, the effect of traffic composition becomes less relevant and benefits start arising directly from the lower number of performed lane changes (as pointed out by the red arrows in Figure 9).
This result is quite valuable both in framing the possible impacts of connected vehicles on the bottleneck dynamics and to warn about the intermediate phase, at which a low share of connected light vehicles behaving differently from the rest of the traffic can have disruptive effects difficult to foresee before actually implementing the system. The disrupting effect of 20% MP can be considered as negative, because it causes a speed drop on both lanes (Figure 7), the lowest value being around 10 km/h, and entails a queue time reduction of 20 s on the open lane that does not necessarily compensate for the 40-s increment of queue time on the closing lane.
Before answering the first research question, one last result can be drafted by the analysis of traffic volumes on both lanes.
An analysis of Figure 11 allows to state that the capacity of the bottleneck does not worsen, because the volumes that shift between the two lanes are perfectly symmetrical, and in no scenario do vehicles end up entering the roadworks in the successive 15-min slot. These results, together with the higher speed of the closing lane reported in Figure 8, can be explained when considering that, on the A22, commercial vehicles and HGV are receiving the information only through traditional signaling. So even at 100% market penetration of the C-ITS message, a certain percentage of vehicles still occupies the closing lane and drives faster. Besides, the overtaking ban for heavy vehicles feature of the A22 infrastructure should be kept in mind when transferring the presented results to other infrastructures. Still, in answering the first research question, it can be stated that the C-ITS message does not reduce the capacity of infrastructures ascribable to the A22 one for average traffic volumes; moreover, the average throughput is not directly affected, but two different dynamics can be triggered. For lower market penetrations, disruptions can arise, affecting negatively the closing lane more than they affect positively the open one. For MP levels higher than 30%, the reduced number of lane changes and an increased separation among traffic compositions entail benefits that are higher for both lanes, reducing queue times. This benefit can amount up to 60 s per vehicle on the open lane and to 40 s on the closing one during the peak hour.
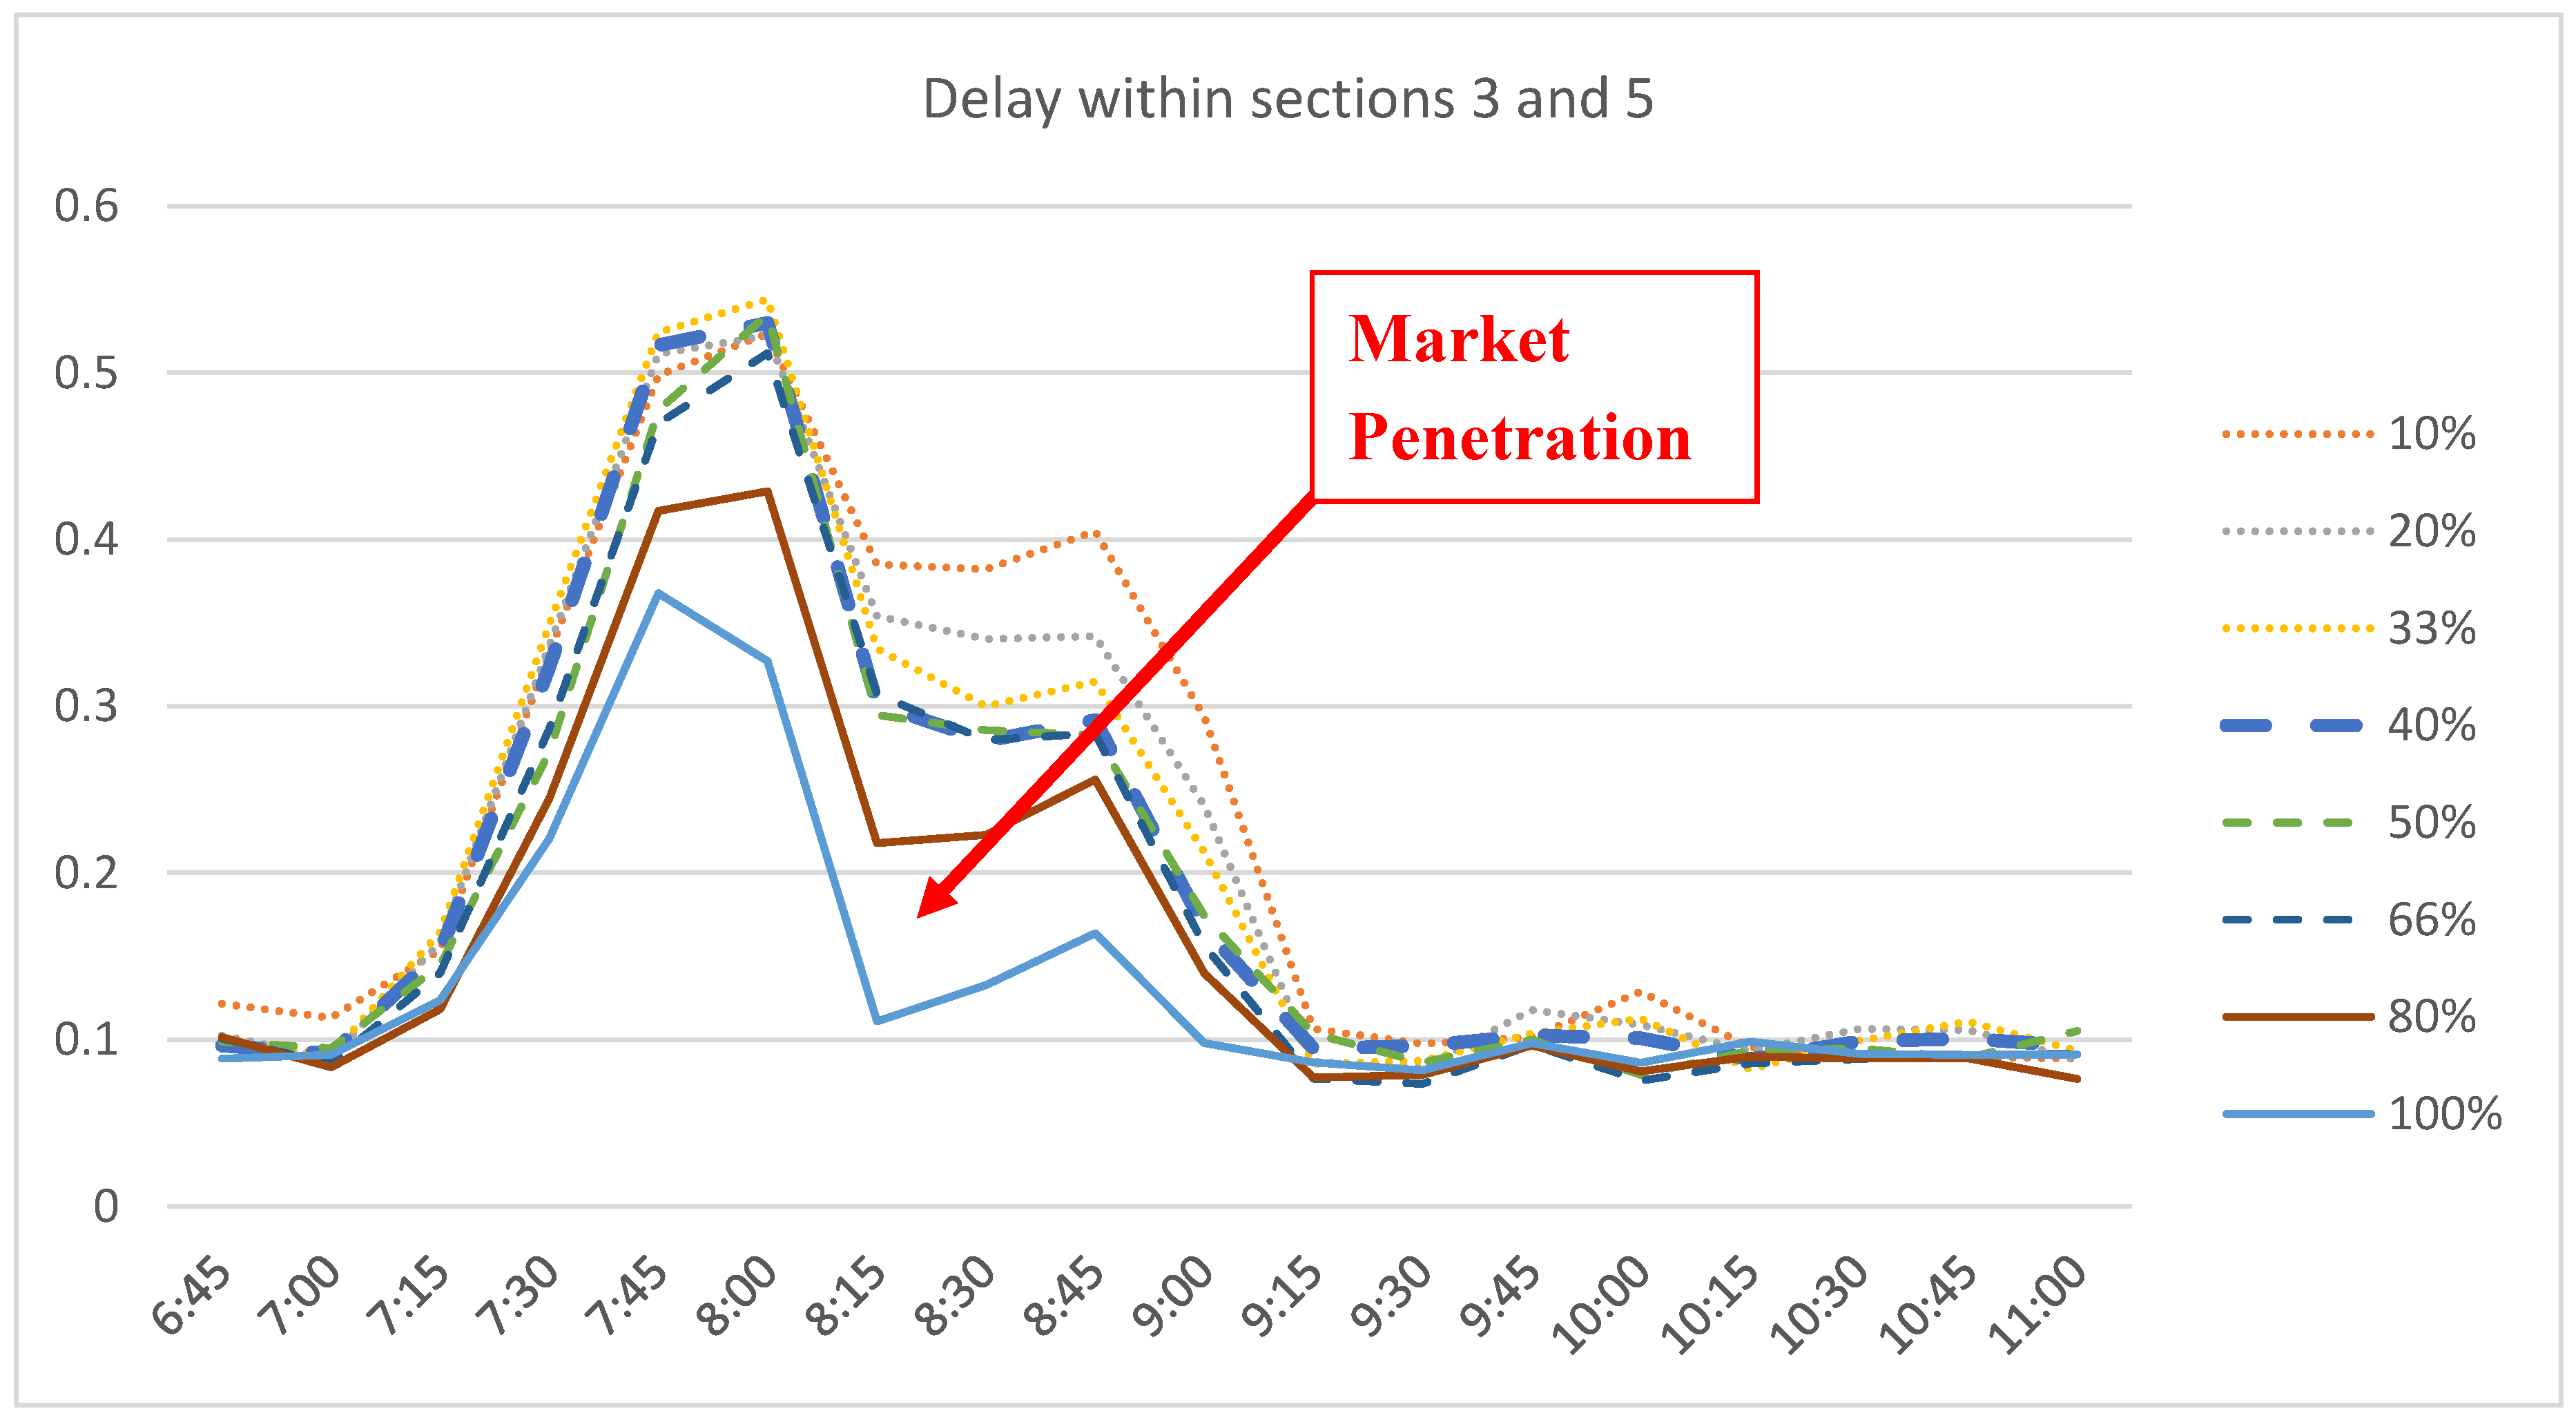
The second research question concerned the traffic upstream the roadworks rather than the one at the entrance. Said question was: Does the upstream traffic reorganize itself in a way that is more efficient in terms of speed and travel time? In order to answer, the delay between sections 3 and 5 in Figure 12 was calculated. This segment was chosen being not too close or too distant from the lane closure and having a homogeneous speed limit of 90 km/h. In fact, the delay is calculated by comparing the theoretical travel time of the vehicles and their actual travel time during the simulations, the first depending on the desired speed distribution and the latter on the actual driving speed.
This last result shows how, even if at the entrance of the roadworks benefits on queue time may arise from 30% MP but possible disruptions arise between 10% and 30% MP, the trend upstream is much more linear. During peak hour (07:00–08:00 a.m.), no strong benefit is achieved for market penetrations lower than 80%, but, at the second peak (08:15–09:15 a.m.), a strong reduction in delay arises for each level of market penetration. This result indicates that, below certain levels of upcoming traffic volumes, the congestion due to roadworks can be reduced or actually avoided. Beyond a certain level of upcoming traffic volumes and for intermediate market penetration levels, this effect is not triggered at all, though, and no relevant difference is recorded. Road operators and evaluators alike should mind this all-or-nothing dynamic that could jeopardize the actual benefits of the C-ITS message for certain congestion scenarios while deciding when and where prompt the C-ITS service and foreseeing the possible benefits. Still, it seems that the cooperative messages foster an earlier return to more efficient driving regimes, as it can be seen at 08:15 a.m. when the difference between 10% MP and 40%-66% MP is equal to an almost 10% delay reduction. It is also interesting to note how, for these intermediate market penetration values, the delay is almost the same, which suggests a plateau in congestion recovery capacities that rise almost linearly between 10% and 40%, then do not improve until 66%. Beyond 66% MP, the positive effects start rising again, and the reduction in delay between 10% and 100% MP reaches almost 30%. These results may be considered a useful input for evaluators and road operators alike trying to frame the economic benefits and their trends for different time horizons and market penetration levels.
It was important to frame the impact on delay at peak hour, when the achievable benefits are higher. Nevertheless, it is useful to consider also the average delay recorded through the whole simulation period; this result is reported in the following Table 4.
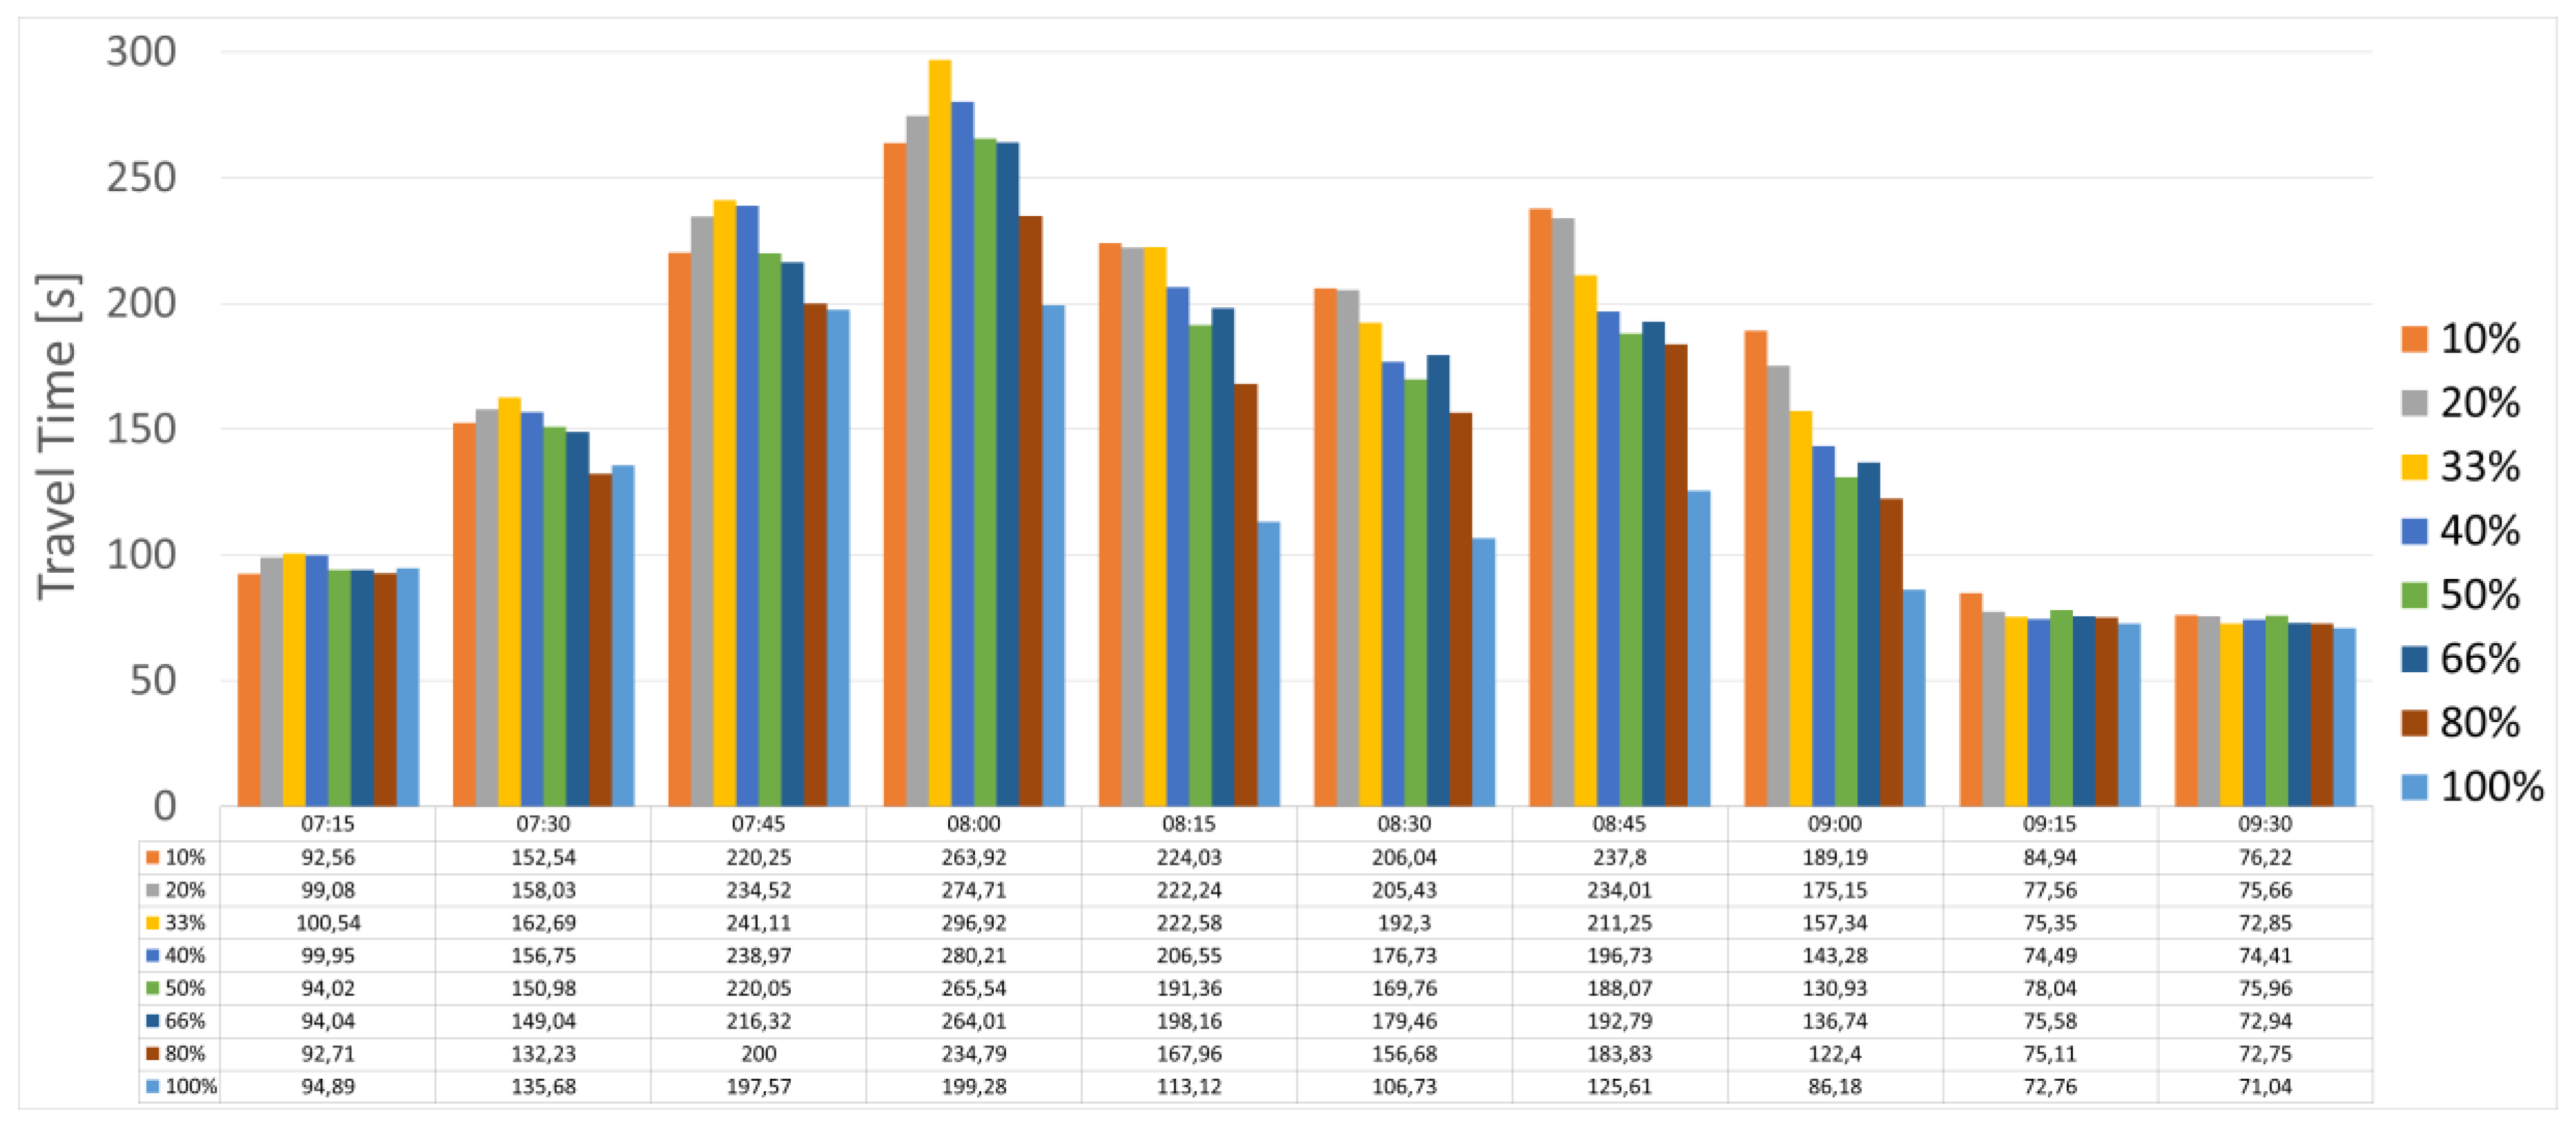
As it can be seen from Table 4, the delay decreases steadily with the increasing of the market penetration, actually reaching a difference equal to 8.66% between 10% and 100% MP levels. This result is quite valuable, because it shows that the benefits of the C-ITS use case RWW—closure of a lane arise upstream the lane closure, and higher market penetrations entail higher benefits than 10% and 20% market penetrations. Still, it is worth reporting the absolute average values of travel time and how they change with market penetration, since simple percentages do not allow to frame the actual magnitude of the results. In Figure 13, the travel time from Sections 1–7 (Figure 2) are reported; it should be highlighted how they cannot be directly related with Table 4, since the table refers only to the segment within Section 3 and 5.
As it can be seen, higher market penetration levels constantly perform better within the congested hours, with the 100% MP scenario performing travel times 65 s lower than the 10% one in the most congested 15 min. This result in tandem with the delay between sections 3 and 5 should allow to answer the second research question about the traffic upstream. Regardless of the scenario or the traffic dynamic arising at the roadworks entrance, by limiting the number of lane changes and de facto erasing unnecessary ones for connected vehicles, a decrease of travel time is achieved. Moreover, an interesting trend can be found in Figure 13, between 10% and 33% MP levels; the trend is inverted when traffic volumes are higher but reverts to the linear one (to a higher MP corresponding a shorter travel time) when the peak fades. The reasons behind this effect should be analyzed more in-depth and also verified in real life through field tests; still, a hypothesis can be made. It is likely that, by leading vehicles to perform lane changes in advance, these tend to be more aggressive and to disrupt more the traffic on the open lane even more upstream than they would do without the C-ITS message. This, in turn, slightly worsens the performance of the network before the roadworks during peak hours, when available time gaps on the open gap are fewer and the maneuvers more aggressive. Moreover, these vehicles shifting to the open lane could cause the lane change of other vehicles (unequipped for the reception of cooperative messages) towards the closed one, actually nullifying the effects of the C-ITS. These effects are prevalent until higher shares of market penetration entail sufficient benefits on the overall traffic that they are compensated. A valuable result of the paper and of the simulation activities is, then, the framing of conflicting effects for lower market penetrations and a suggestion towards cautious estimations in assessing the short-term benefits of C-ITS services (the utility of which seems rather certain for higher market penetration levels according to the results, though). This result actually answers the third research question: Is there a trend of the above impacts tied to market penetration? The answer is more nuanced than a simple yes or no, and different effects can be triggered for different market penetration levels.
5. Conclusions
The aim of this paper was to evaluate the possible impacts arising from the implementation of the use case roadworks warning—closure of a lane on the Italian highways through microsimulations. This result contributes to the current literature by expanding the limited amount of case studies concerning roadworks and exploring the effects of an innovative system such as the C-ITS one. Moreover, these results should support the C-Roads Italy trials planned for 2020 by providing a first impact estimation on speeds, volumes and travel times to be compared and validated with the driving behaviors emerging from the field tests. The results about the speed, queue times and traffic volumes at the roadworks entrance allowed to define the effects that the C-ITS message may have on the bottleneck dynamics. For no MP level is the throughput of the bottleneck reduced, which is a valuable result due to the risk of promoting the underutilization of the closing lane through C-ITS messages. Moreover, from the analysis of queue time, it was possible to frame the possible criticalities arising in the short term; in fact, having 20% of vehicles equipped for the C-ITS reception disrupted the traffic to the point that, to a queue time reduction of 20 s on the open lane, an increase of queue time by 40 s per vehicle arose on the closing one. Still, higher market penetrations entailed relevant benefits for queue time, reaching a reduction of 60 s on the open lane and of around 40 s on the closing one (both are comparisons between 10% and 100% MP levels).
To completely assess the C-ITS and its impacts upstream the roadworks, the analysis of travel time and delay in the upstream sections had to be carried out. The results showed that the impacts on the upcoming traffic are related more to the market penetration of cooperative vehicles; the delay reduction grows steadily as MP levels go from 10% to 40% during the congestion recovery, while the peak hour is hardly affected by MP levels lower than 80%. The delay reduction equals to 10% when comparing 10% and 40% MP; it then increases by another 15% from 40% to 100% MP. The enhancement of congestion recovery for a relatively small share of connected vehicles should not be overlooked; it could dramatically improve the feasibility of the C-ITS service in the short term indeed (granting a boost in traffic efficiency with a short payback time). Moreover, the average delay steadily decreases as market penetration rises, ensuring benefits even outside the daily peak hours. The last valuable result achieved by the presented study concerns travel times, the reduction of which to drive through around 1500 m can amount up to 65 s during peak hour indeed (still comparing 10% and 100% MP). Again, the trend related to MP levels is as relevant as the other results; in fact, for the lower market penetrations (10% ÷ 33%), another trend arises, validating the hypothesis that, for few connected vehicles among the traffic flow, the disrupting negative effects are higher than the benefits related to a lower number of lane changes achieved through the C-ITS message.
Both the numerical results and the trends are conceived to support other evaluators and road operators aiming to assess or to design similar C-ITS implementations, allowing cost-benefit analyses on different time horizons (bound to the market penetrations) and promoting a higher number of studies related to the topic. In fact, future research directions should include both other simulation experiments testing different implementation logics (broadcasting range, road layouts and traffic compositions) and field tests that could provide validation and behavioral parameters needed to increase the accuracy of this kind of study.
Author Contributions
Conceptualization, S.A.M.A., L.S., G.M. and P.G.; methodology, S.A.M.A., L.S., P.G. and X.Q.; software, S.A.M.A.; validation, G.M., L.S., P.G. and X.Q.; investigation, S.A.M.A., P.G. and G.M.; resources, L.S. and S.A.M.A.; data curation, S.A.M.A.; supervision, L.S. and G.M.; project administration, L.S.; funding acquisition, L.S. and writing, S.A.M.A. All authors have read and agreed to the published version of the manuscript.
Funding
This research received no external funding.
Acknowledgments
The authors want to thank all the members of the C-Roads Platform and all the partners of the C-Roads Italy Pilot. Among them, a special thanks goes to the A22 that, in the figures of Ilaria De Biasi and David Catoni, supported the work through traffic data sharing.
Conflicts of Interest
The authors declare no conflicts of interest. The funders had no role in the design of the study; in the collection, analyses, or interpretation of data; in the writing of the manuscript or in the decision to publish the results.
List of Acronyms
| C-ITS | Cooperative Intelligent Transport System |
| CV | Connected Vehicle |
| DSRC | Dedicated Short-Range Communication |
| HCM | Highway Capacity Manual |
| HGV | Heavy Gross Vehicle |
| HMI | Human Machine Interface |
| KPI | Key Performance Indicator |
| MP | Market Penetration |
| RWW-L | Roadworks Warning Closure of a Lane |
| V2X | Vehicle-To-Everything |
References
- C-Roads Platform. Available online: https://www.c-roads.eu/platform.html (accessed on 6 March 2020).
- C-Roads Platform. Working Group 3 Evaluation and Assessment. Evaluation and Assessment Plan—Final Version. Available online: https://www.c-roads.eu/fileadmin/user_upload/media/Dokumente/C-Roads_WG3_Evaluation_and_Assessment_Plan_Final.pdf (accessed on 6 March 2020).
- Autostrade per l’Italia, Disciplinare Per L’installazione, Conduzione E Rimozione Dei Cantieri Di Lavoro Sulla Rete Di Autostrade Per L’italia, 2017. Available online: https://www.tirrenica.it/images/Disciplinare_cantieri_completo_edizione_giugno_2017_1_parte.pdf (accessed on 17 February 2020).
- Walker, G.; Calvert, M. Driver behaviour at roadworks. Appl. Ergon. 2015, 51, 18–29. [Google Scholar] [CrossRef] [PubMed]
- Nassrullah, Z.F. Development of a Micro-Simulation Model for Motorway Roadworks with The Use of Narrow Lanes and Lane Closure Schemes. Doctoral Thesis, School of Computing Science and Engineering, University of Salford, Manchester, UK, 2016. [Google Scholar]
- Perco, P.; Dean, S. Driving Speed Behaviour Approaching Road Work Zones On Two-Lane Rural Roads. Soc. Behav. Sci. 2012, 53, 672–681. [Google Scholar]
- Strömgren, P.; Olstam, J. A Model for Capacity Reduction at Roadwork Zone. Trans. Res. Procedia 2016, 15, 245–256. [Google Scholar] [CrossRef] [Green Version]
- Bella, F. Validation of a Driving Simulator for Work Zone Design. Trans. Res. Rec. J. Transp. Res. Board 2005, 1937, 136–144. [Google Scholar] [CrossRef]
- Studer, L.; Agriesti, S.; Gandini, P.; Marchionni, G.; Paglino, V.; Ponti, M.; Bruglieri, M.; Maja, R.; Borghetti, F. Evaluation Approach for a Combined Implementation of Day 1 C-ITS and Highway Chauffeur—v.1.0. Available online: https://www.researchgate.net/publication/332801272_Evaluation_approach_for_a_combined_implementation_of_Day_1_C-ITS_and_Highway_Chauffeur_-v10 (accessed on 6 March 2020).
- Studer, L.; Agriesti, S.; Gandini, P.; Marchionni, G.; Ponti, M. Impact assessment of cooperative and automated vehicles. In Cooperative Intelligent Transport Systems: Towards High-Level Automated Driving; Lu, M., Ed.; IET (Institution of Engineering and Technology): London, UK, 2019; ISBN 978-183953-012-8 (Print)/978-183953-013-5 (eBook). [Google Scholar]
- Karakikes, I.; Spangler, M.; Margreiter, M. Designing a Vissim-Model for a motorway network with systematic calibration on the basis of travel time measurements. Transp. Res. Procedia 2017, 24, 171–179. [Google Scholar] [CrossRef]
- Kolidakis, S.; Botzoris, G.; Profillidis, V.; Kokkalis, A. Real-time Intraday Traffic Volume Forecasting—A Hybrid Application Using Singular Spectrum Analysis and Artificial Neural Networks. Period. Polytech. Transp. Eng. 2019. [Google Scholar] [CrossRef]
- Studer, L.; Agriesti, S.; Gandini, P.; Marchionni, G.; Ponti, M. Highway Chauffeur: State of the art and future evaluations: Implementation scenarios and impact assessment. In Proceedings of the International Conference of Electrical and Electronic Technologies for Automotive, Milan, Italy, 9–11 July 2018. [Google Scholar]
- Agriesti, S.; Gandini, P.; Marchionni, G.; Paglino, V.; Ponti, M.; Studer, L. Evaluation approach for a combined implementation of day 1 C-ITS and truck platooning. In Proceedings of the 2018 IEEE 87th Vehicular Technology Conference (VTC Spring), Porto, Portugal, 3–6 June 2018. [Google Scholar]
Figure 1.
A22 (103 + 500 Km − 107 Km) northern direction (adapted from Google Earth).

Figure 2.
(a) Network as reproduced within the model, and (b) roadworks layout as prescribed by the Italian law [3]. Adapted from [3].

Figure 3.
Couple of connectors in Section 7.

Figure 4.
Desired speed distributions at various sections upstream the roadworks.

Figure 5.
Calibration and validation outputs: (a) speed on lane 1 as simulated (dotted) and recorded (continuous), (b) speed on lane 2 as simulated (dotted) and recorded (continuous) and (c) traffic volumes.
Figure 5.
Calibration and validation outputs: (a) speed on lane 1 as simulated (dotted) and recorded (continuous), (b) speed on lane 2 as simulated (dotted) and recorded (continuous) and (c) traffic volumes.

Figure 6.
Vehicle input and traffic composition (No. of vehicles).

Figure 7.
Calibrated time gap distributions (a) and calibrated desired speeds (x-axis: km/h; y-axis: percentile) (b).
Figure 7.
Calibrated time gap distributions (a) and calibrated desired speeds (x-axis: km/h; y-axis: percentile) (b).

Figure 8.
Driving speed 200 m upstream the lane closure: (a) slow lane and (b) fast lane.

Figure 9.
Time in queue (s) on the open lane.

Figure 10.
Time in queue on the closing lane.

Figure 11.
Traffic volumes on the open (a) and the closing (b) lanes.


Figure 12.
Percentage of delay—comparison between desired speed and actual speed.

Figure 13.
Travel time from Section 1 to Section 7.


Table 1.
Main key performance indicator (KPI) standard deviations—6 runs vs. 10 runs for 100% market penetration of equipped vehicles (CVs).
Table 1.
Main key performance indicator (KPI) standard deviations—6 runs vs. 10 runs for 100% market penetration of equipped vehicles (CVs).
| 6 Runs | Average Speed | Traffic Flow | Delay |
| Average St. Deviation | 5.98 | 23.244 | 0.062 |
| % St. Deviation | 7.08% | 4.17% | 32.84% |
| 10 Runs | Average Speed | Traffic Flow | Delay |
| Average St. Deviation | 5.98 | 23.244 | 0.062 |
| % St. Deviation | 7.07% | 4.25% | 32.7% |
Table 2.
Theil’s inequality coefficient.
| Lane 1 | Lane 2 | |
|---|---|---|
| U 03/02 | 0.022 | 0.030 |
| U 22/05 | 0.012 | 0.030 |
Table 3.
Lateral behavioral parameters.
| Light Vehicles | Commercial Vehicles | Heavy Vehicles | |
|---|---|---|---|
| Min. Headway | 1 | 1 | 2 |
| To slower lane if collision time above: | 5 | 5 | 5 |
| Safety distance reduction factor | 0.3 | 0.3 | 0.6 |
Table 4.
Average delay within the segments (3-5). MP: market penetration.
| MP | 10% | 20% | 33% | 40% | 50% | 66% | 80% | 100% |
|---|---|---|---|---|---|---|---|---|
| Average Delay | 22.26% | 21.03% | 20.60% | 19.60% | 18.95% | 18.33% | 16.15% | 13.60% |
© 2020 by the authors. Licensee MDPI, Basel, Switzerland. This article is an open access article distributed under the terms and conditions of the Creative Commons Attribution (CC BY) license (http://creativecommons.org/licenses/by/4.0/).
Share and Cite
MDPI and ACS Style
Agriesti, S.A.M.; Studer, L.; Marchionni, G.; Gandini, P.; Qu, X. Roadworks Warning—Closure of a Lane, the Impact of C-ITS Messages. Infrastructures 2020, 5, 27. https://doi.org/10.3390/infrastructures5030027
AMA Style
Agriesti SAM, Studer L, Marchionni G, Gandini P, Qu X. Roadworks Warning—Closure of a Lane, the Impact of C-ITS Messages. Infrastructures. 2020; 5(3):27. https://doi.org/10.3390/infrastructures5030027
Chicago/Turabian StyleAgriesti, Serio Angelo Maria, Luca Studer, Giovanna Marchionni, Paolo Gandini, and Xiaobo Qu. 2020. "Roadworks Warning—Closure of a Lane, the Impact of C-ITS Messages" Infrastructures 5, no. 3: 27. https://doi.org/10.3390/infrastructures5030027