Experimental Study on Zn-Doped Al-Rich Alloys for Fast on-Board Hydrogen Production

1
Key Laboratory of Automobile Materials, Ministry of Education, College of Materials Science and Engineering, Jilin University, Changchun 130025, China
2
The College of Liberal Arts and Science, Arizona State University, AZ 85287, USA
*
Authors to whom correspondence should be addressed.
Crystals 2020, 10(3), 167; https://doi.org/10.3390/cryst10030167
Submission received: 31 January 2020
/
Revised: 28 February 2020
/
Accepted: 28 February 2020
/
Published: 3 March 2020
(This article belongs to the Special Issue Intermetallic Compound)
Abstract
:For the purpose of investigating the effect of Zn replacement of In3Sn on the hydrogen production performance of Al-rich alloy ingots, Al-Ga-In3Sn alloys with various Zn dosages (0–5 wt.%) were prepared by a traditional melting and casting technique. The phase compositions and microstructures were characterized using X-ray diffractometer (XRD) and scanning electron microscope (SEM) with an Energy Dispersed X-ray system (EDS). The SEM results indicate that, with a small amount of Zn instead of In3Sn, the number and total area of grain boundary (GB) phases will decrease gradually, and the average single GB area will eventually stabilize. The distribution of Zn in the alloy is similar to that of Ga, and an area with high Zn content appeared in the high-Zn-doped sample. The melting behaviors of Al with other metals were measured by DSC. The reaction of these alloys and water were investigated at different temperatures. Compared with Al-Ga-In3Sn alloy, low addition of Zn changed the composition of GB phase and increased the maximum hydrogen production rate. The reason for the changes in the hydrolysis reaction of Al with the addition of Zn was discussed.
1. Introduction
Due to the limited world proven reserves and environmental degradation caused by fossil fuel consumption, it is clear that social development based on traditional energy sources is not sustainable. Consequently, it has been an irresistible trend to find alternate green energy which appeals for a clean, co-development and efficient energy future [1,2,3]. Hydrogen as an energy carrier has a high energy density about three times higher than gasoline. Furthermore, the water produced after hydrogen energy combustion is absolutely clean and will not cause environmental pollution. In the past few decades, the main approaches to produce hydrogen could be grouped into the following categories [4,5,6,7]: water electrolysis, fossil fuel gasification, chemical processing techniques and biological methods. So far, a wide range of applications of hydrogen has not been realized through these methods. Many problems need to be solved, such as expensive cost, poor conversion efficiency, insecurity in hydrogen storage and transportation. In this case, it is extremely essential to produce hydrogen in situ, particularly in the aspects of emergency power provided in disaster-stricken areas, portable electronic equipment and on board vehicles. Hence, researchers are constantly looking for new ways of producing hydrogen gas.
In recent years, an emerging in situ method through the hydrolysis of Al alloys has been increasingly attracting the interest of researchers [8,9,10]. The hydrogen generated by such a method has many advantages. Firstly, the hydrogen can be produced almost anywhere, which eliminates the strict requirements for storage and transport. Secondly, the generated hydrogen has high purity and hence, can be directly supplied to internal combustion engines or fuel cells. Most of all, aluminum as a metal is rich in the earth's crust; it also has a high hydrogen generation capacity. Through theoretical calculations, the amount of hydrogen produced per 1 g of Al can reach 1.244 L. Nevertheless, a fine and close oxide film easily forms on the pure Al surface which impedes the subsequent reaction of Al hydrolysis. Several treatment measures have been taken to activate Al as follows [11,12,13,14]: alkali aqueous activation, nano/micro-crystallization of Al, and mixing particular metallic oxide or mineral salts. Nevertheless, these processing ways have certain disadvantages, e.g., acid or alkaline solution is extremely corrosive and the pre-preparation work of milling is time consuming. Adding some low melting alloys to Al and alloying was a fascinating method of activation [15,16,17,18]. This approach can produce Al alloys in large quantities in a short time when required, and Al can be hydrolyzed at a mild temperature to generate hydrogen.
Previous studies have shown that the size and composition of GB phase play the dominant role in the process of hydrolysis reaction between Al and water [19,20]. The GB phase containing low melting point metals can prevent the oxidation of Al. Meanwhile, these activated areas also provide a transmission channel to make it easier for Al to enter the reaction site. Up to now, the Al-Ga-In-Sn alloy has been investigated in a systematic study [21,22]. The melting point of liquid Ga-In-Sn phase is 10.4 °C, which has a great correlation with the reaction temperature. In addition, In and Sn mainly exist in two kinds of interstitial phases: In3Sn (β) and InSn4 (γ). When the content of In3Sn is high, the alloy exhibits high energy transduction efficiency and fast hydrogen generation rate. Yet, compared with Al-Ga-InSn4, Al-Ga-In3Sn alloy also suffers from some disadvantages. Indium is expensive and hard to recycle. Furthermore, the surface of this alloy easily reacts with the moisture in the air, which requires higher storage conditions. For this reason, in consideration of cost, a fifth metal needs to be introduced to further improve the comprehensive performance of the Al-Ga-In3Sn alloy.
Combined with results of previous studies, various dopants have different effects on the Al-Ga-In-Sn alloy. When Bi [23] or Mg [24] are added to these Al-based alloys, new GB phases (InBi or Mg2Sn) are formed, and the alloy exhibits different energy conversion efficiency. With the addition of the grain refiners (Ti, Al2O3, AlTi5B etc.) [25,26,27,28], the grain size and morphology of the alloys have changed significantly, which also affects hydrogen production performance. In a word, the effect of doped metals on the alloy is usually to change the GB composition or grain size.
It is acknowledged that Zn is an important metal used in industry. Studying the doping of Zn in Al-Ga-based hydrogen-producing alloys will help a wider choice of raw materials and the use of waste Al in the future. In order to achieve practical application, the process of hydrogen production needs to be controlled in an on-board hydrogen supply unit. Thus, it is worth undertaking a comprehensive investigation into the specific influence of Zn in water splitting reactions. By adjusting the mass ratio of In3Sn and Zn, alloys with different hydrogen production properties can be obtained. Differentiated reaction temperature and start-up time help to realize the control of an on-board hydrogen supply.
For the sake of high economic benefits and excellent hydrogen production performance, Zn was introduced into Al-Ga-In3Sn alloys to reduce the contents of In and Sn. The micrographs and crystalline structure of alloys were examined by XRD, SEM with EDS. Then, the alloy melting behavior was measured by DSC and corresponding hydrogen production performance was discussed. In addition, we used an isothermal kinetic model to calculate the activation energy of alloy hydrolysis and discussed the relevant reaction mechanisms.
2. Materials and Methods
In order to explore the relationship between physicochemical properties and material properties of Al-Ga-In3Sn-Zn, a series of alloys with different Zn contents were prepared and some experimental tests were performed. Zn was hypothesized to change the composition of the GB phase and thus affect the hydrogen production performance. In previous studies, the eutectic reaction in the GB phase was identified to be a key factor in the hydrolysis of Al. The continuous replacement of In and Sn, the main component of the GB phase, by Al can help verify this theory and determine other possible reaction mechanisms.
2.1. Preparation of Materials
Six kinds of Alloy ingots (Table 1) were prepared using a simple melting and casting technique. The weights of the cast ingots were kept at 20 g approximately. In these samples, the contents of Al and Ga remain fixed, the mole ratio of In and Sn remained a constant of 3:1, while Zn content changed from 0 wt.% to 5 wt.%.
The starting mixture containing Al (purity, 99%) and dopants (Ga, In, Sn, and Zn of at least reagent grade) was heated at a rate of 10 °C/min up to 800 °C and held at this temperature for 1 h. The smelting was protected by nitrogen in the furnace. After that, the molten metals were stirred at a constant speed for 10 min by a stirring paddle and then cast into the mold with a cylindrical recess and cooled in air. Finally, the cooled ingot was wrapped with a sealing film and stored in a vacuum sealed bag for the follow-up experiments.
2.2. Characterization
For the purpose of determining the phase compositions, the sections of casted ingots were polished and then studied by an X-ray diffractometer (XRD) employing a DX-2700 X-ray diffractometer (Dandong Fangyuan, China) with monochromatic CuKα radiation (λKα1 = 0.154056 nm). The detection angle (2θ) were collected from 30° to 80° at a scanning speed of 0.03°/step. The morphology and element analysis were characterized by a cold field scanning electron microscope (SEM, HITACHI SU8020) equipped with an Energy Dispersed X-ray (EDS, Bruker QUANTAX 200) system. In order to minimize the oxidation of fracture surface, the specimens were put into the chamber at once after they were made. The melting behaviors of samples were detected by differential scanning calorimeter (DSC, PERKIN-ELMER DSC 7). Indium was used as a reference substance to calibrate the apparatus by testing its melting point. Each sample of 40 mg or so was put into Al pan under a flowing nitrogen atmosphere. In order to observe low-temperature phase transitions in the sample, the related data were collected from −20 to 225 °C at an invariable rate of 10 °C/min.
2.3. Measurement of Hydrogen Production
The apparatus was used for hydrogen yield measurement has been illustrated in detail in our previous research [29]. Each sample was cut into a cylindrical sheet with a diameter of about 15 mm and a weight of 0.5 g. A 250mL glass container was placed in a thermostatic water bath. When 100mL deionized water reached the predetermined temperature, the plug was closed immediately as soon as a pre-prepared sample was placed into water. Considering that water vapor may cause errors in experimental results, as an improvement, a condensation tube was installed on the outlet side of the Pyrex glass reactor, and the time taken by the reaction for every 10mL of hydrogen produced was recorded. In the meantime, the height of the calibration bottle was continuously adjusted to ensure that its water level was consistent with the glass burette. The data of hydrogen release rate and reaction time were recorded automatically by the mass flow meter (Alicat Scientific) and stored in a computer. According to the instrument operating procedures, a dryer was directly connected between the mass flow meter and the reactor. In the experiments, theoretical hydrogen production volume was calculated according to an ideal gas formula (PV = nRT). Under standard conditions (273 K, 105 Pa), 1 g Al can generate 1.244 L of hydrogen.
3. Results
3.1. Hydrogen Generation Performance
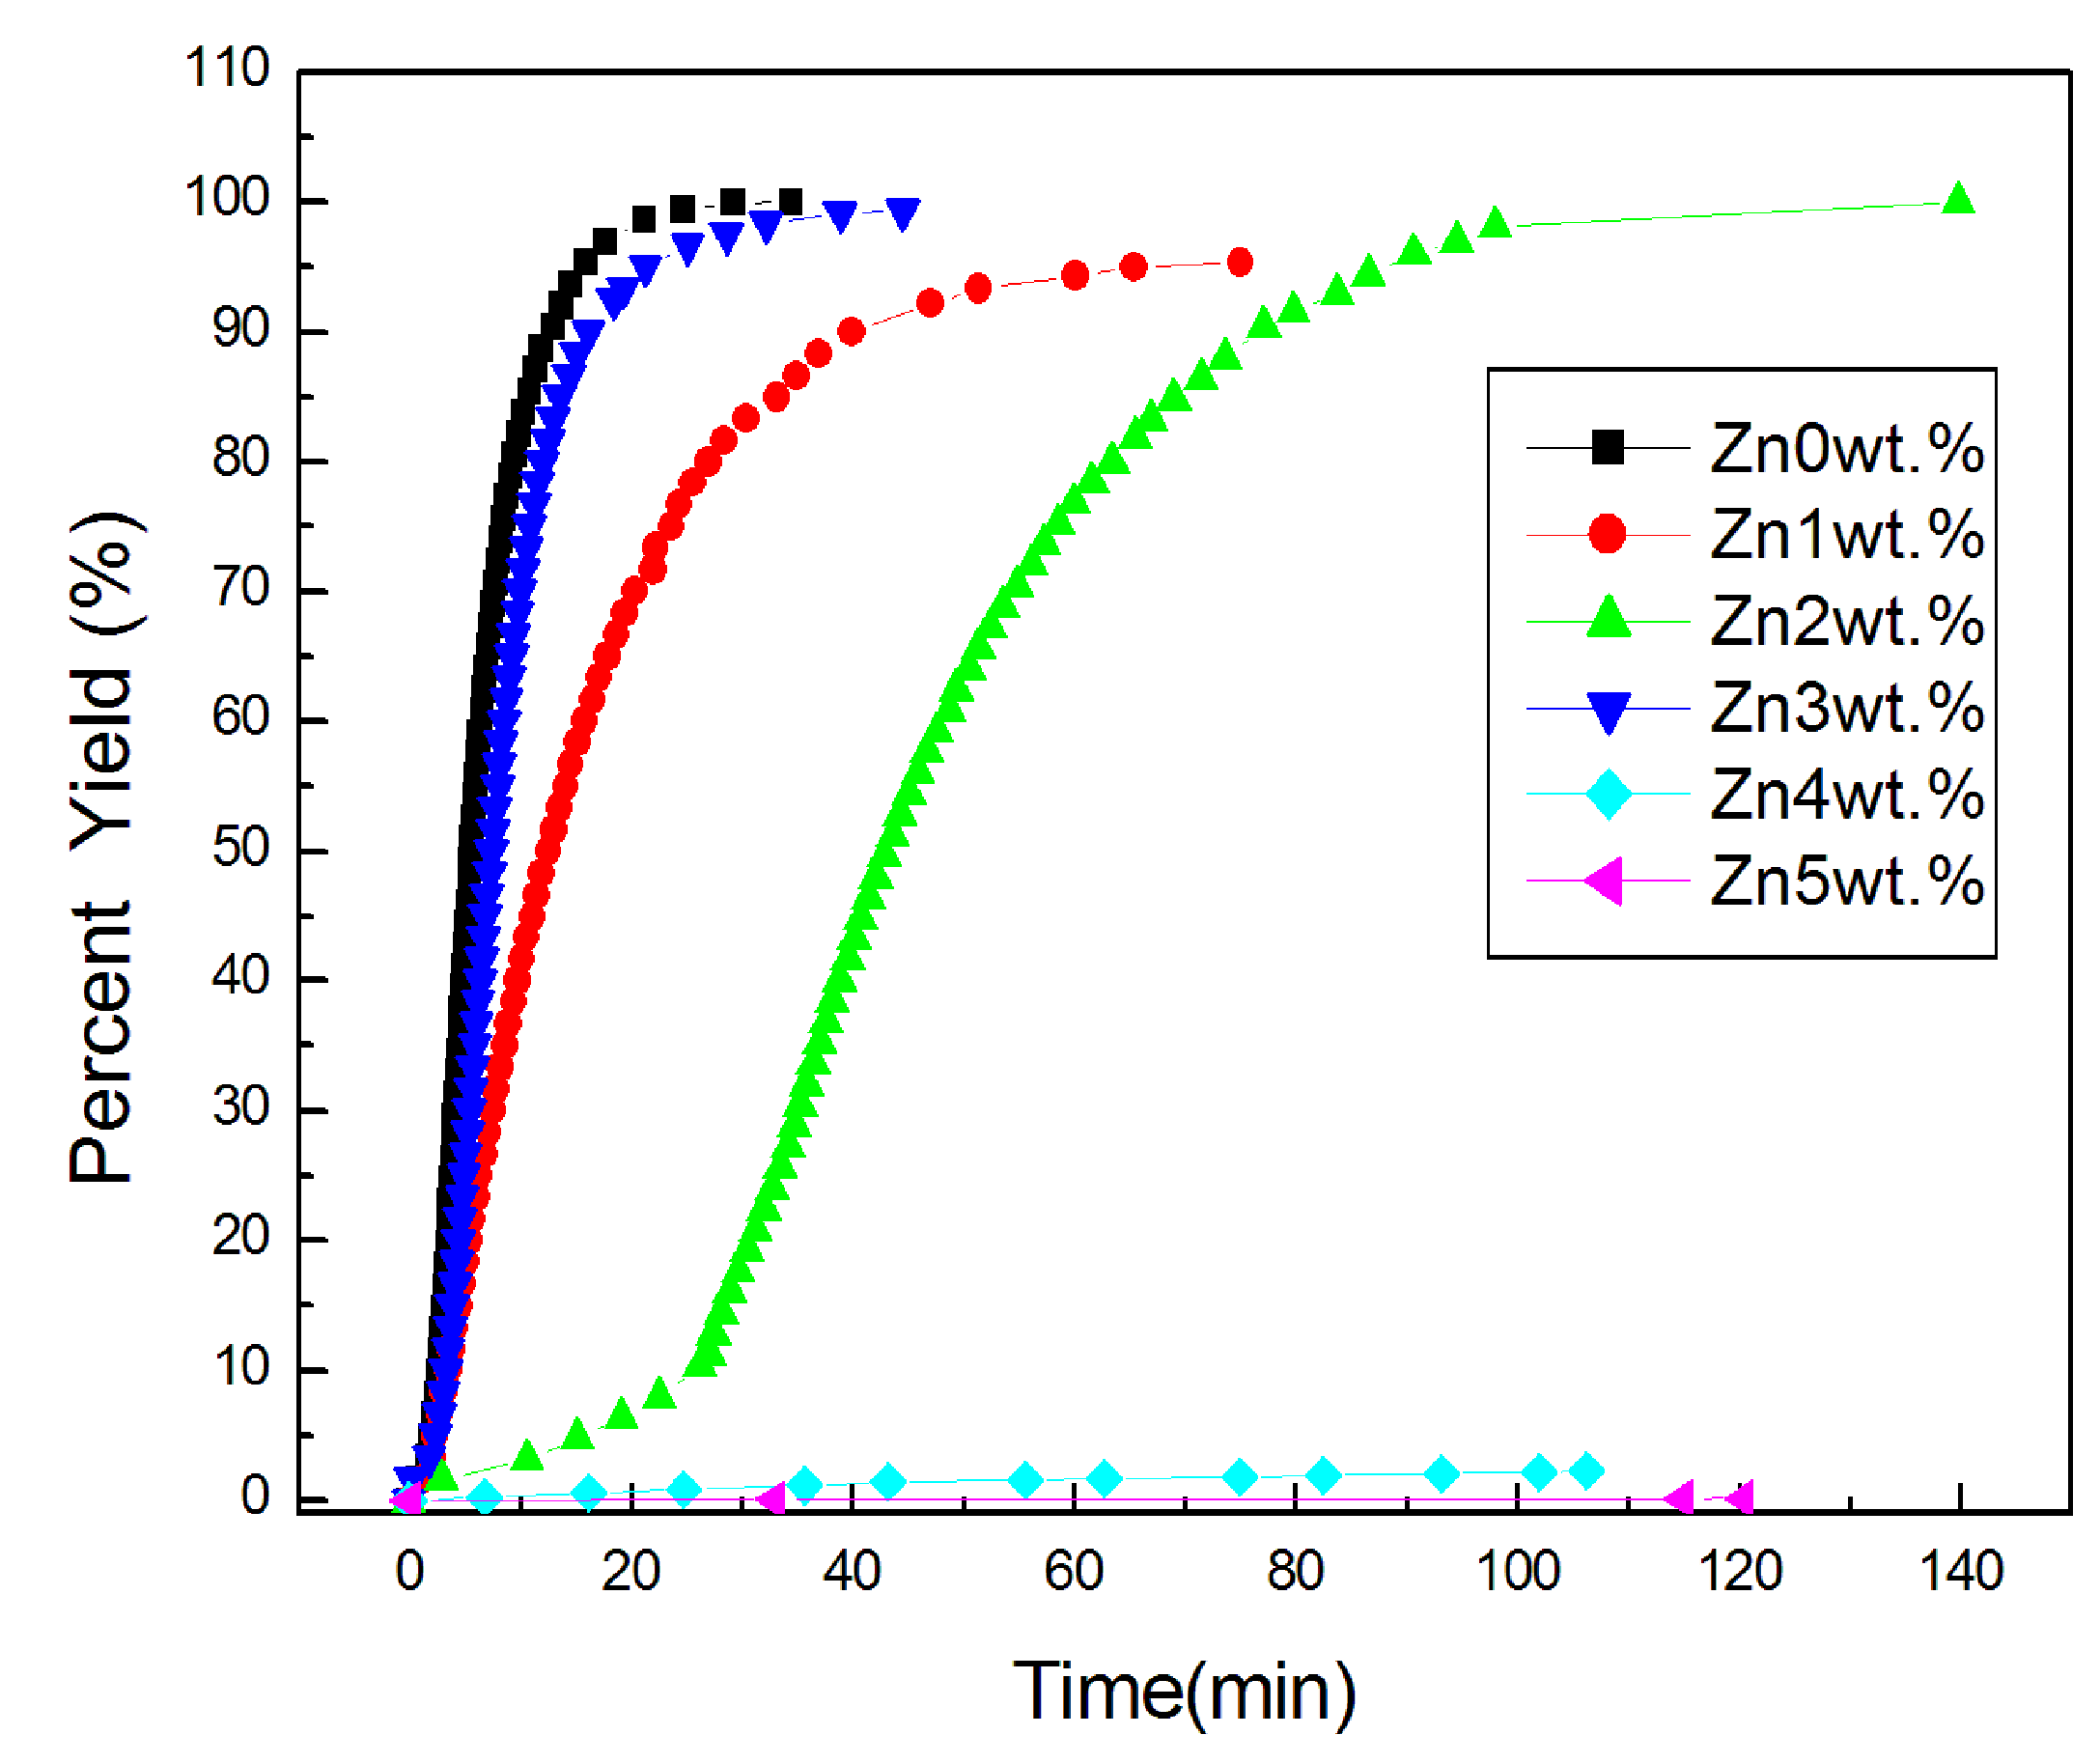
The alloys’ hydrogen production yields at 40 °C are shown in Figure 1. The volumes of hydrogen generated from the first four samples (0–3 wt.% Zn) approach the theoretical value, implying that the alloys could hydrolyze thoroughly. As the sample was put into water, they split into small pieces at once and hydrogen bubbles started to pop up. However, the time used for completing the hydrolysis reaction is quite different. The samples containing 0 and 3 wt.% Zn have the shortest reaction time, while the sample of 2 wt.% Zn lasted tens of minutes.
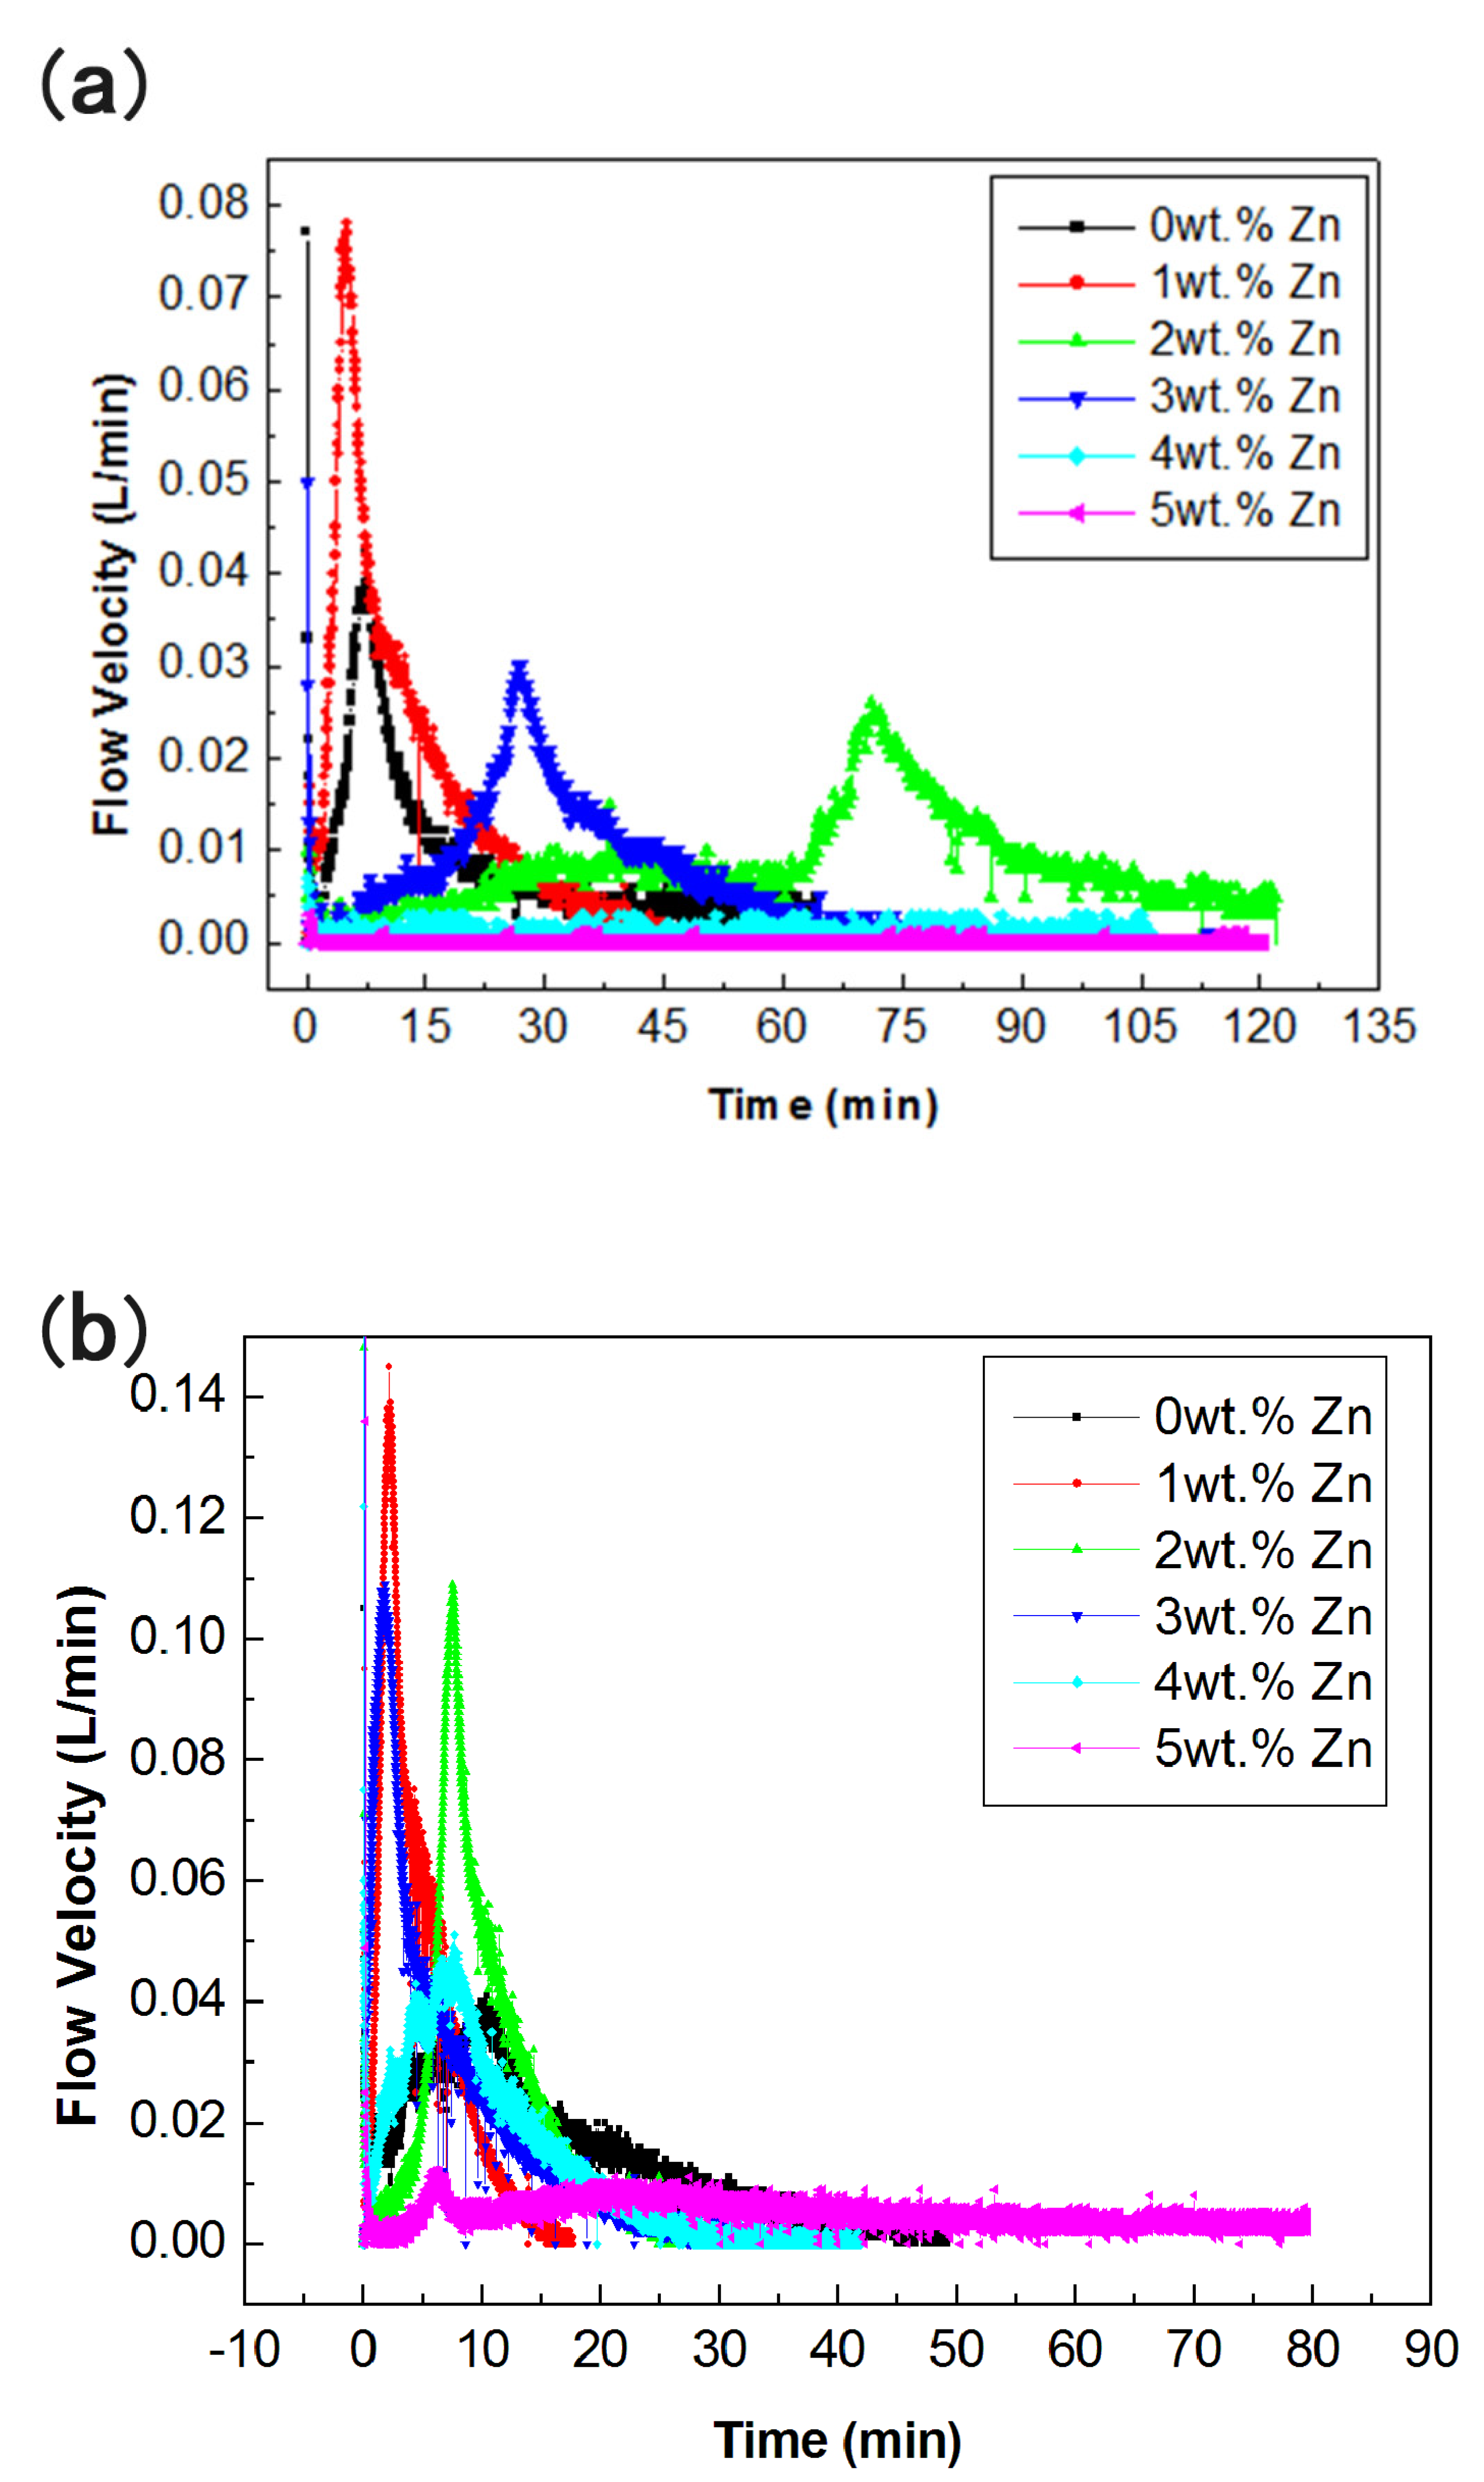
Figure 2 shows the hydrogen production rate curves of the Al-Ga-In3Sn-Zn alloys at different water temperature. It can be clearly seen that the hydrogen production performance is closely related to the reaction temperature. As the reaction temperature rises, the reaction time is shortened and the reaction rate increased markedly.
3.2. Characterization of Al Alloys
3.2.1. XRD Analysis
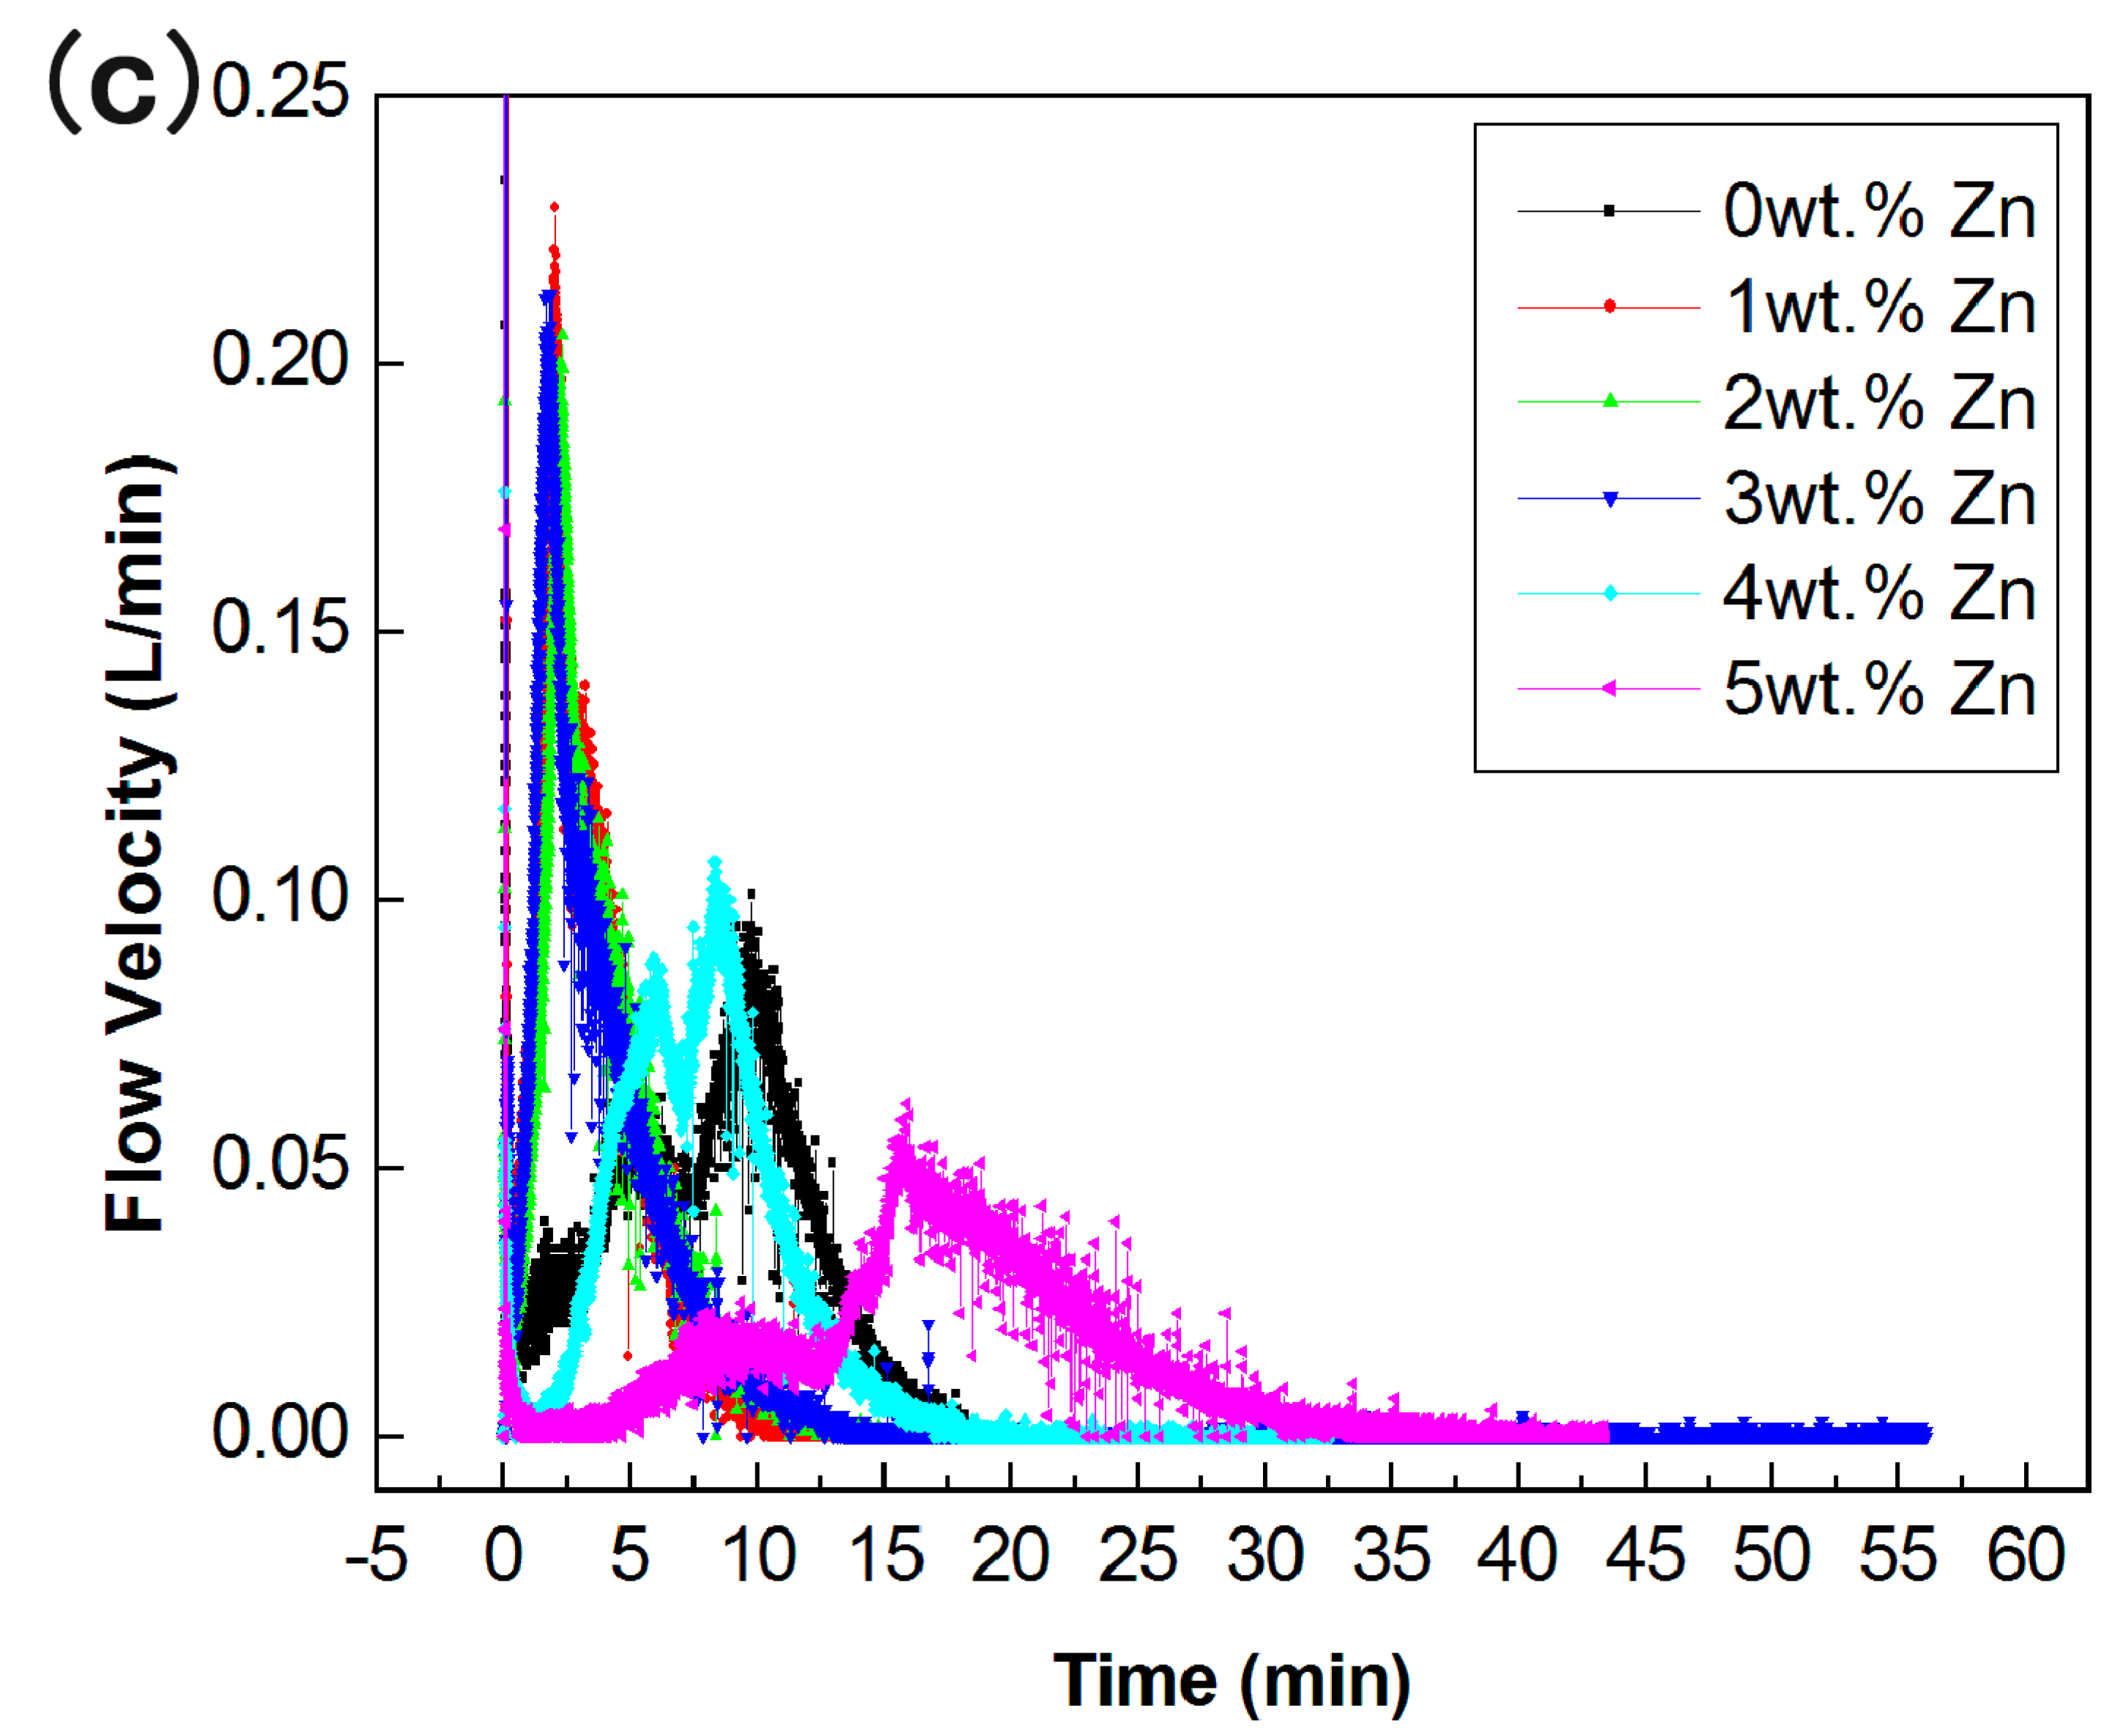
Figure 3 shows the XRD patterns of the synthesized alloys containing various Zn content. It can be seen that all samples mainly consist of two phases: crystalline Al phase (JCPDS file #04-0787) and In3Sn intermetallic compound (JCPDS file #07-0345). Besides, Ga-related diffraction peaks have not be observed. Similar phenomenon is common in previous studies of Al-Ga-based alloys, and it has been confirmed that Ga exists as a form of Al (Ga) solid solution [30,31,32]. Yet, due to a low doping amount of Ga in the raw materials and the close atomic radius of the two atoms, the positions of Al diffraction peaks have not changed significantly. Additionally, no significant characteristic peaks of crystalline Zn phase were found, which maybe owing to the low doping amount or similar properties of Zn and Ga in Al (i.e., high solid solubility, similar atomic radius). Thus, the existence of Zn needs to be further confirmed by EDX and other analysis.
3.2.2. SEM Observation
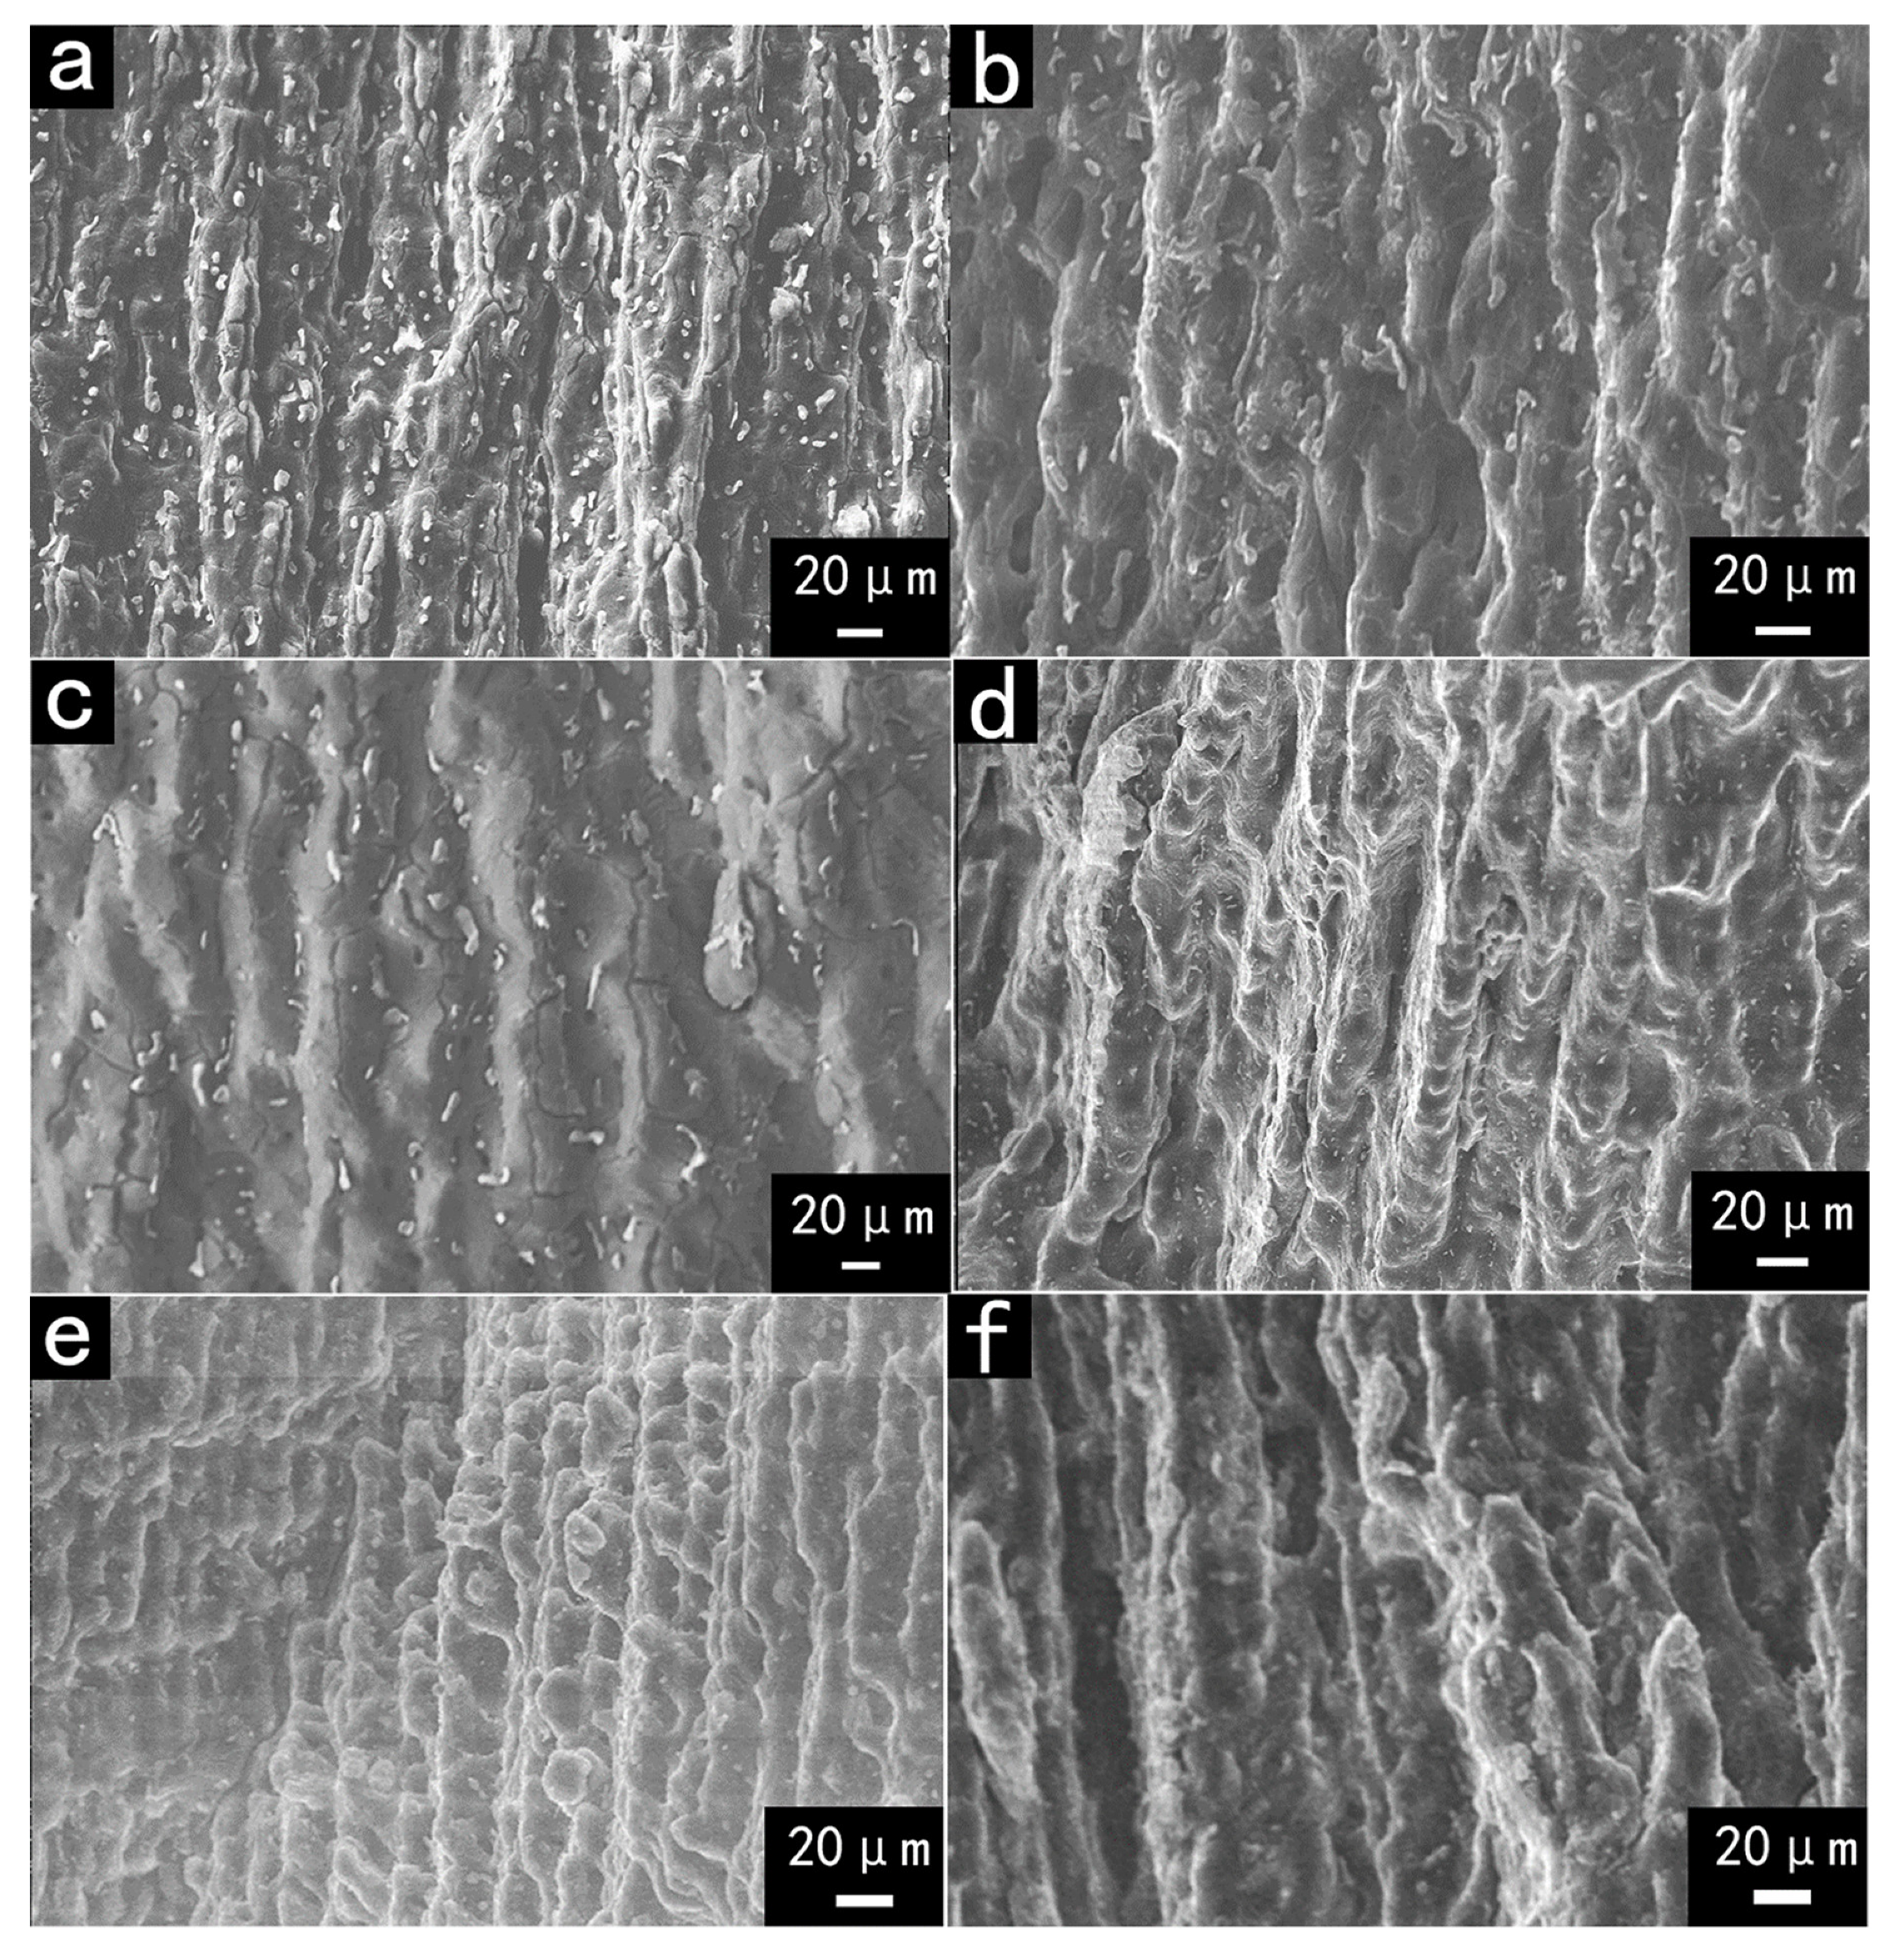
The SEM images showed in Figure 4 are the fracture surfaces of Al-Ga-In3Sn-Zn alloys with various content of Zn. All the Al grains in the prepared ingots present columnar shapes and directional growth during solidification. The Al grain sizes (column widths) range from 20 to 50 μm. According to statistics, the average size is approximately 35 μm, and the standard deviation is 6μm, which is similar to the Zn-free alloy (33 ± 5μm). Zn as an additive, which is similar to Bi [23,29], affects the grain size slightly, but it is completely different from Ti [4], and the segregation has a greater effect on grain size [33,34,35]. Furthermore, the columnar surfaces are covered by a lot of small granular and irregular particles. Considering the solidification process, the GB phase begins to nucleate and grow at the grain boundaries, which is different from the nucleation time of Al grains. From the SEM images (Figure 4a–c), several cracks exit on the grain surfaces; these alloys easily oxidize in the air and lose their metallic luster. On the other hand, the grains with high Zn content (Figure 4d–f) are much more complete. This will delay the arrival of the fast hydrogen generation stage, because the alloy needs to split into small pieces to enable rapid hydrolysis.
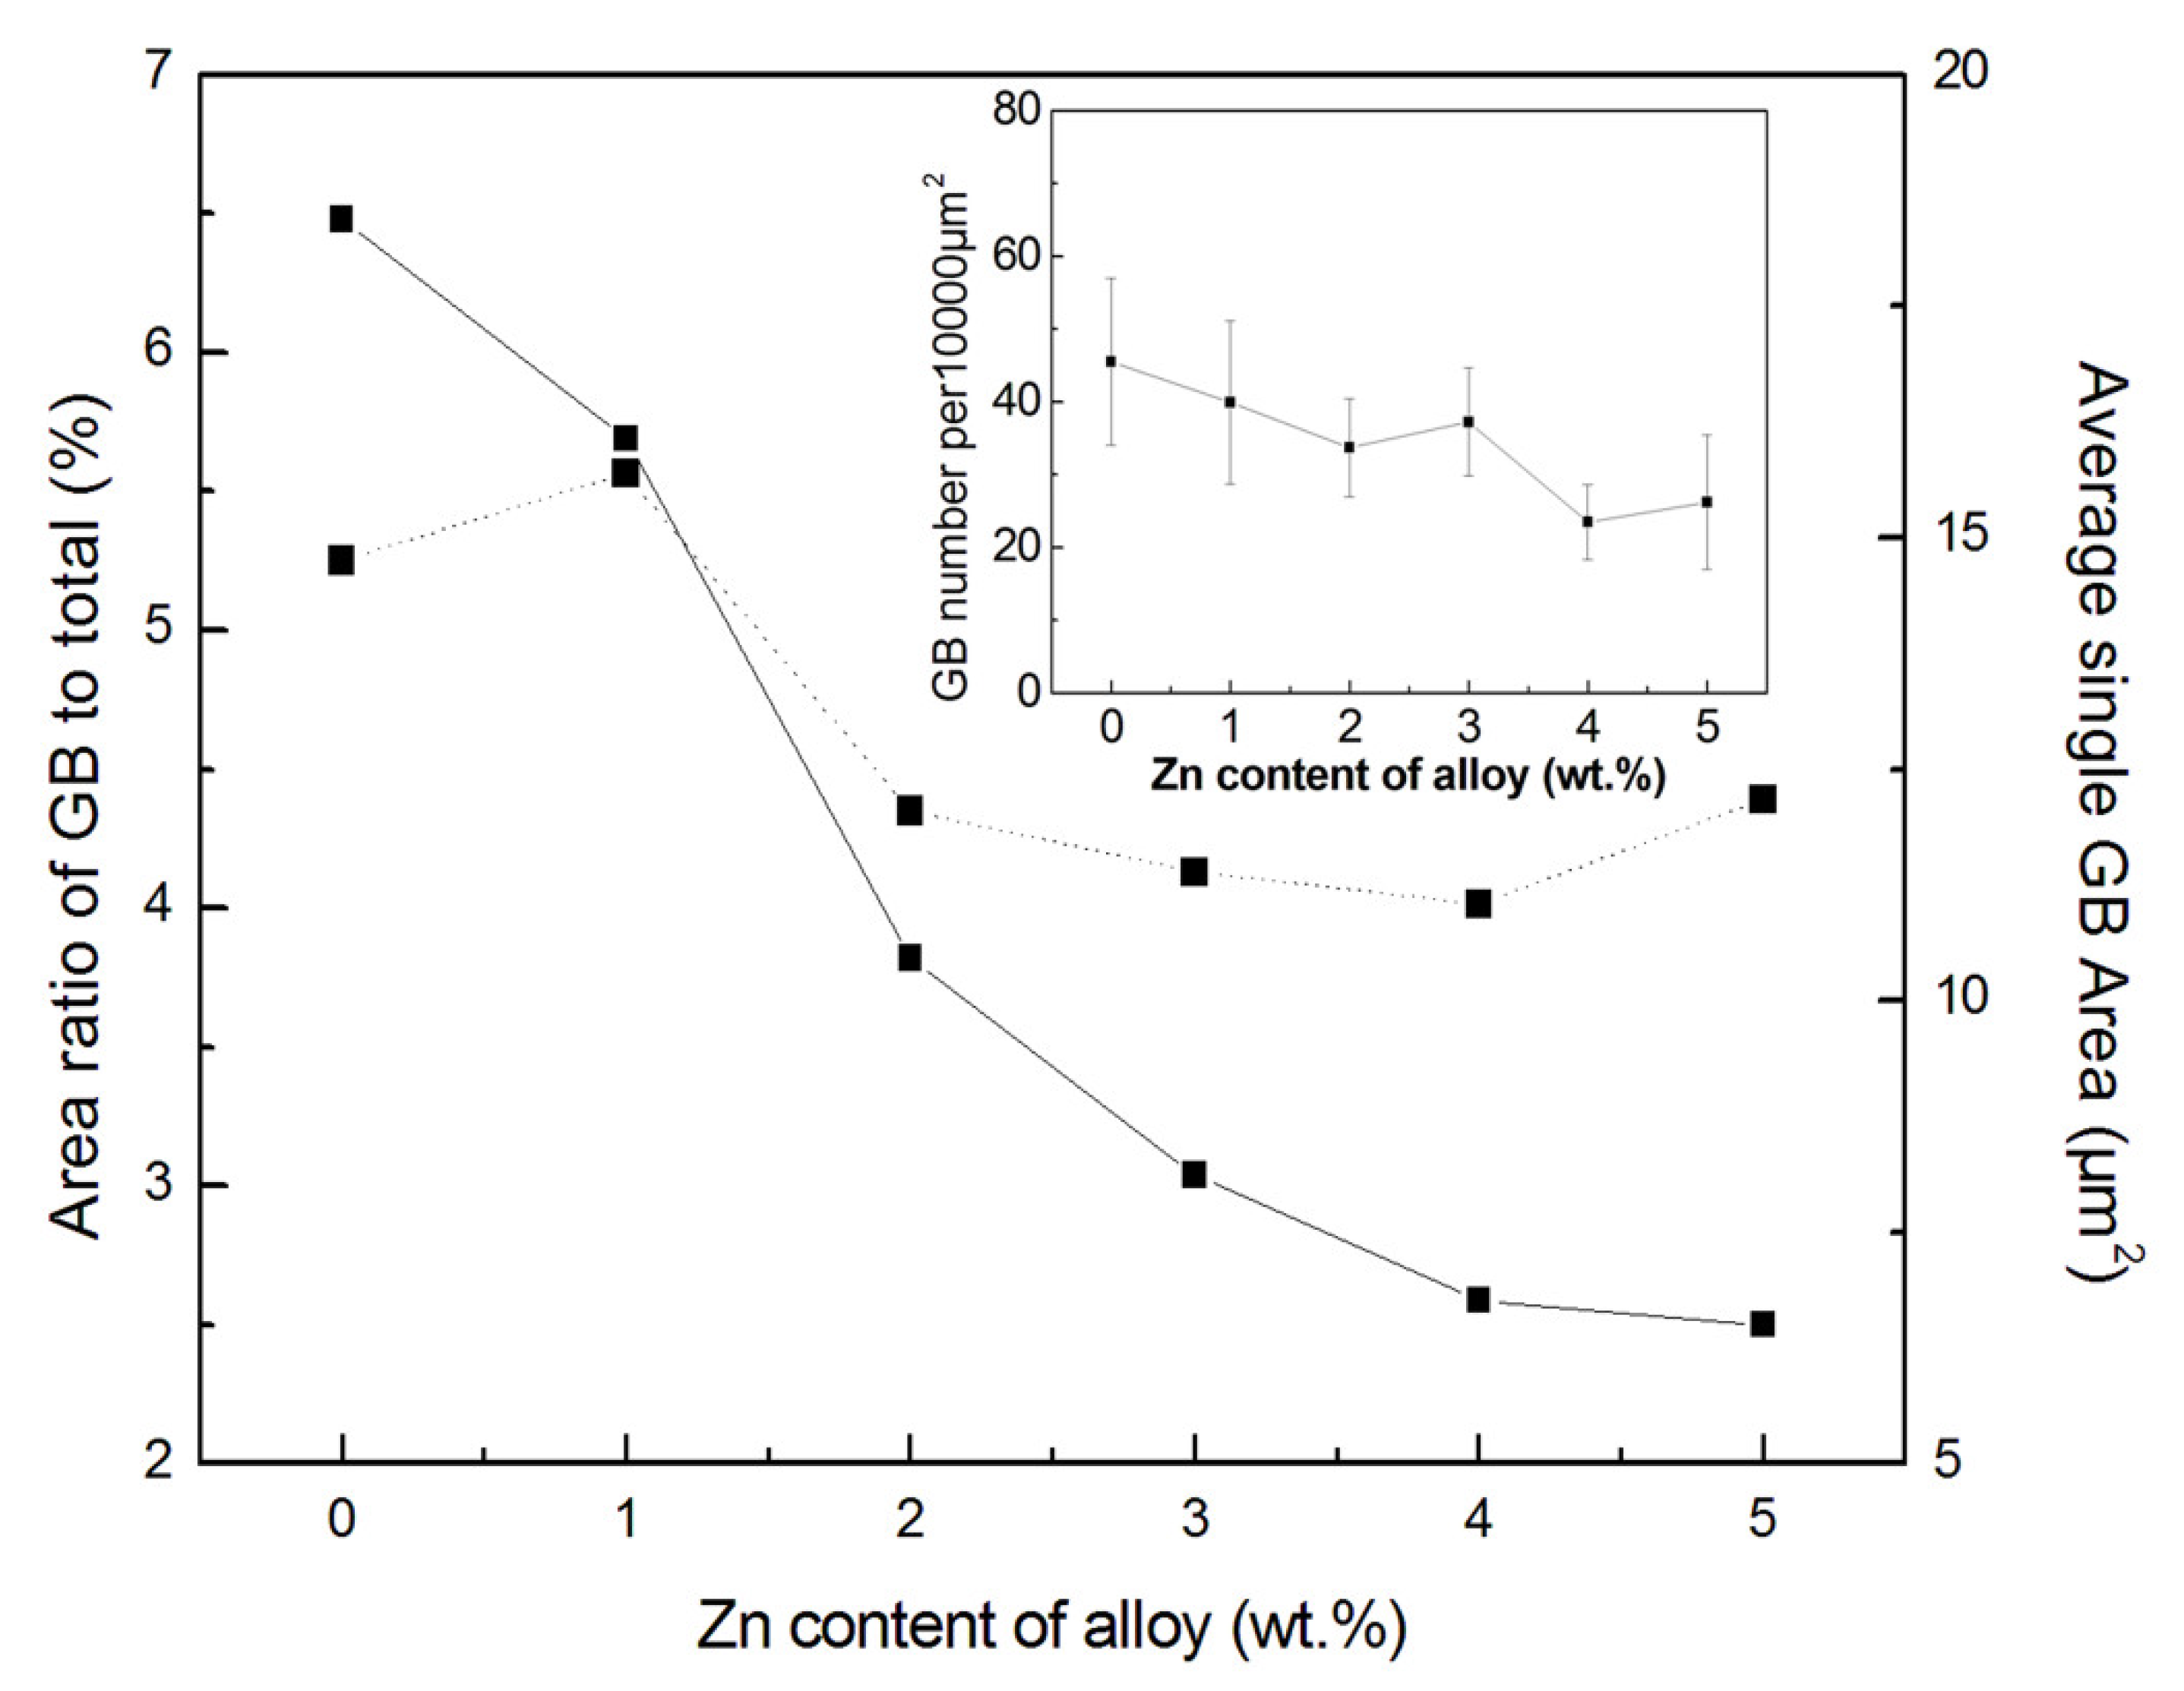
W. Wang et al. [19] had indicated that the changes in size and number of GB particles will lead to different hydrogen production performance of alloys. In their study, the larger number and size of particles contributed to increasing the rate of hydrogen production. A statistical analysis of grain-boundary phase particle areas, obtained from 40 images, is shown in Figure 5. As the doping amount of Zn is within the range of 0–5 wt.%, total area of GB particles in the observed area decreases rapidly (from 6.5% to 2.5%). The average area of individual GB particles has also changed and was reduced from 15 to 12 μm. When the Zn content exceeded 2 wt.%, the particle size was stable (between 11 and 12 μm). The results indicate that the relative content of Zn and In3Sn has a certain effect on the formation of GB phase, and these phenomena need to be further explained in conjunction with EDX data.
3.2.3. EDX Analysis
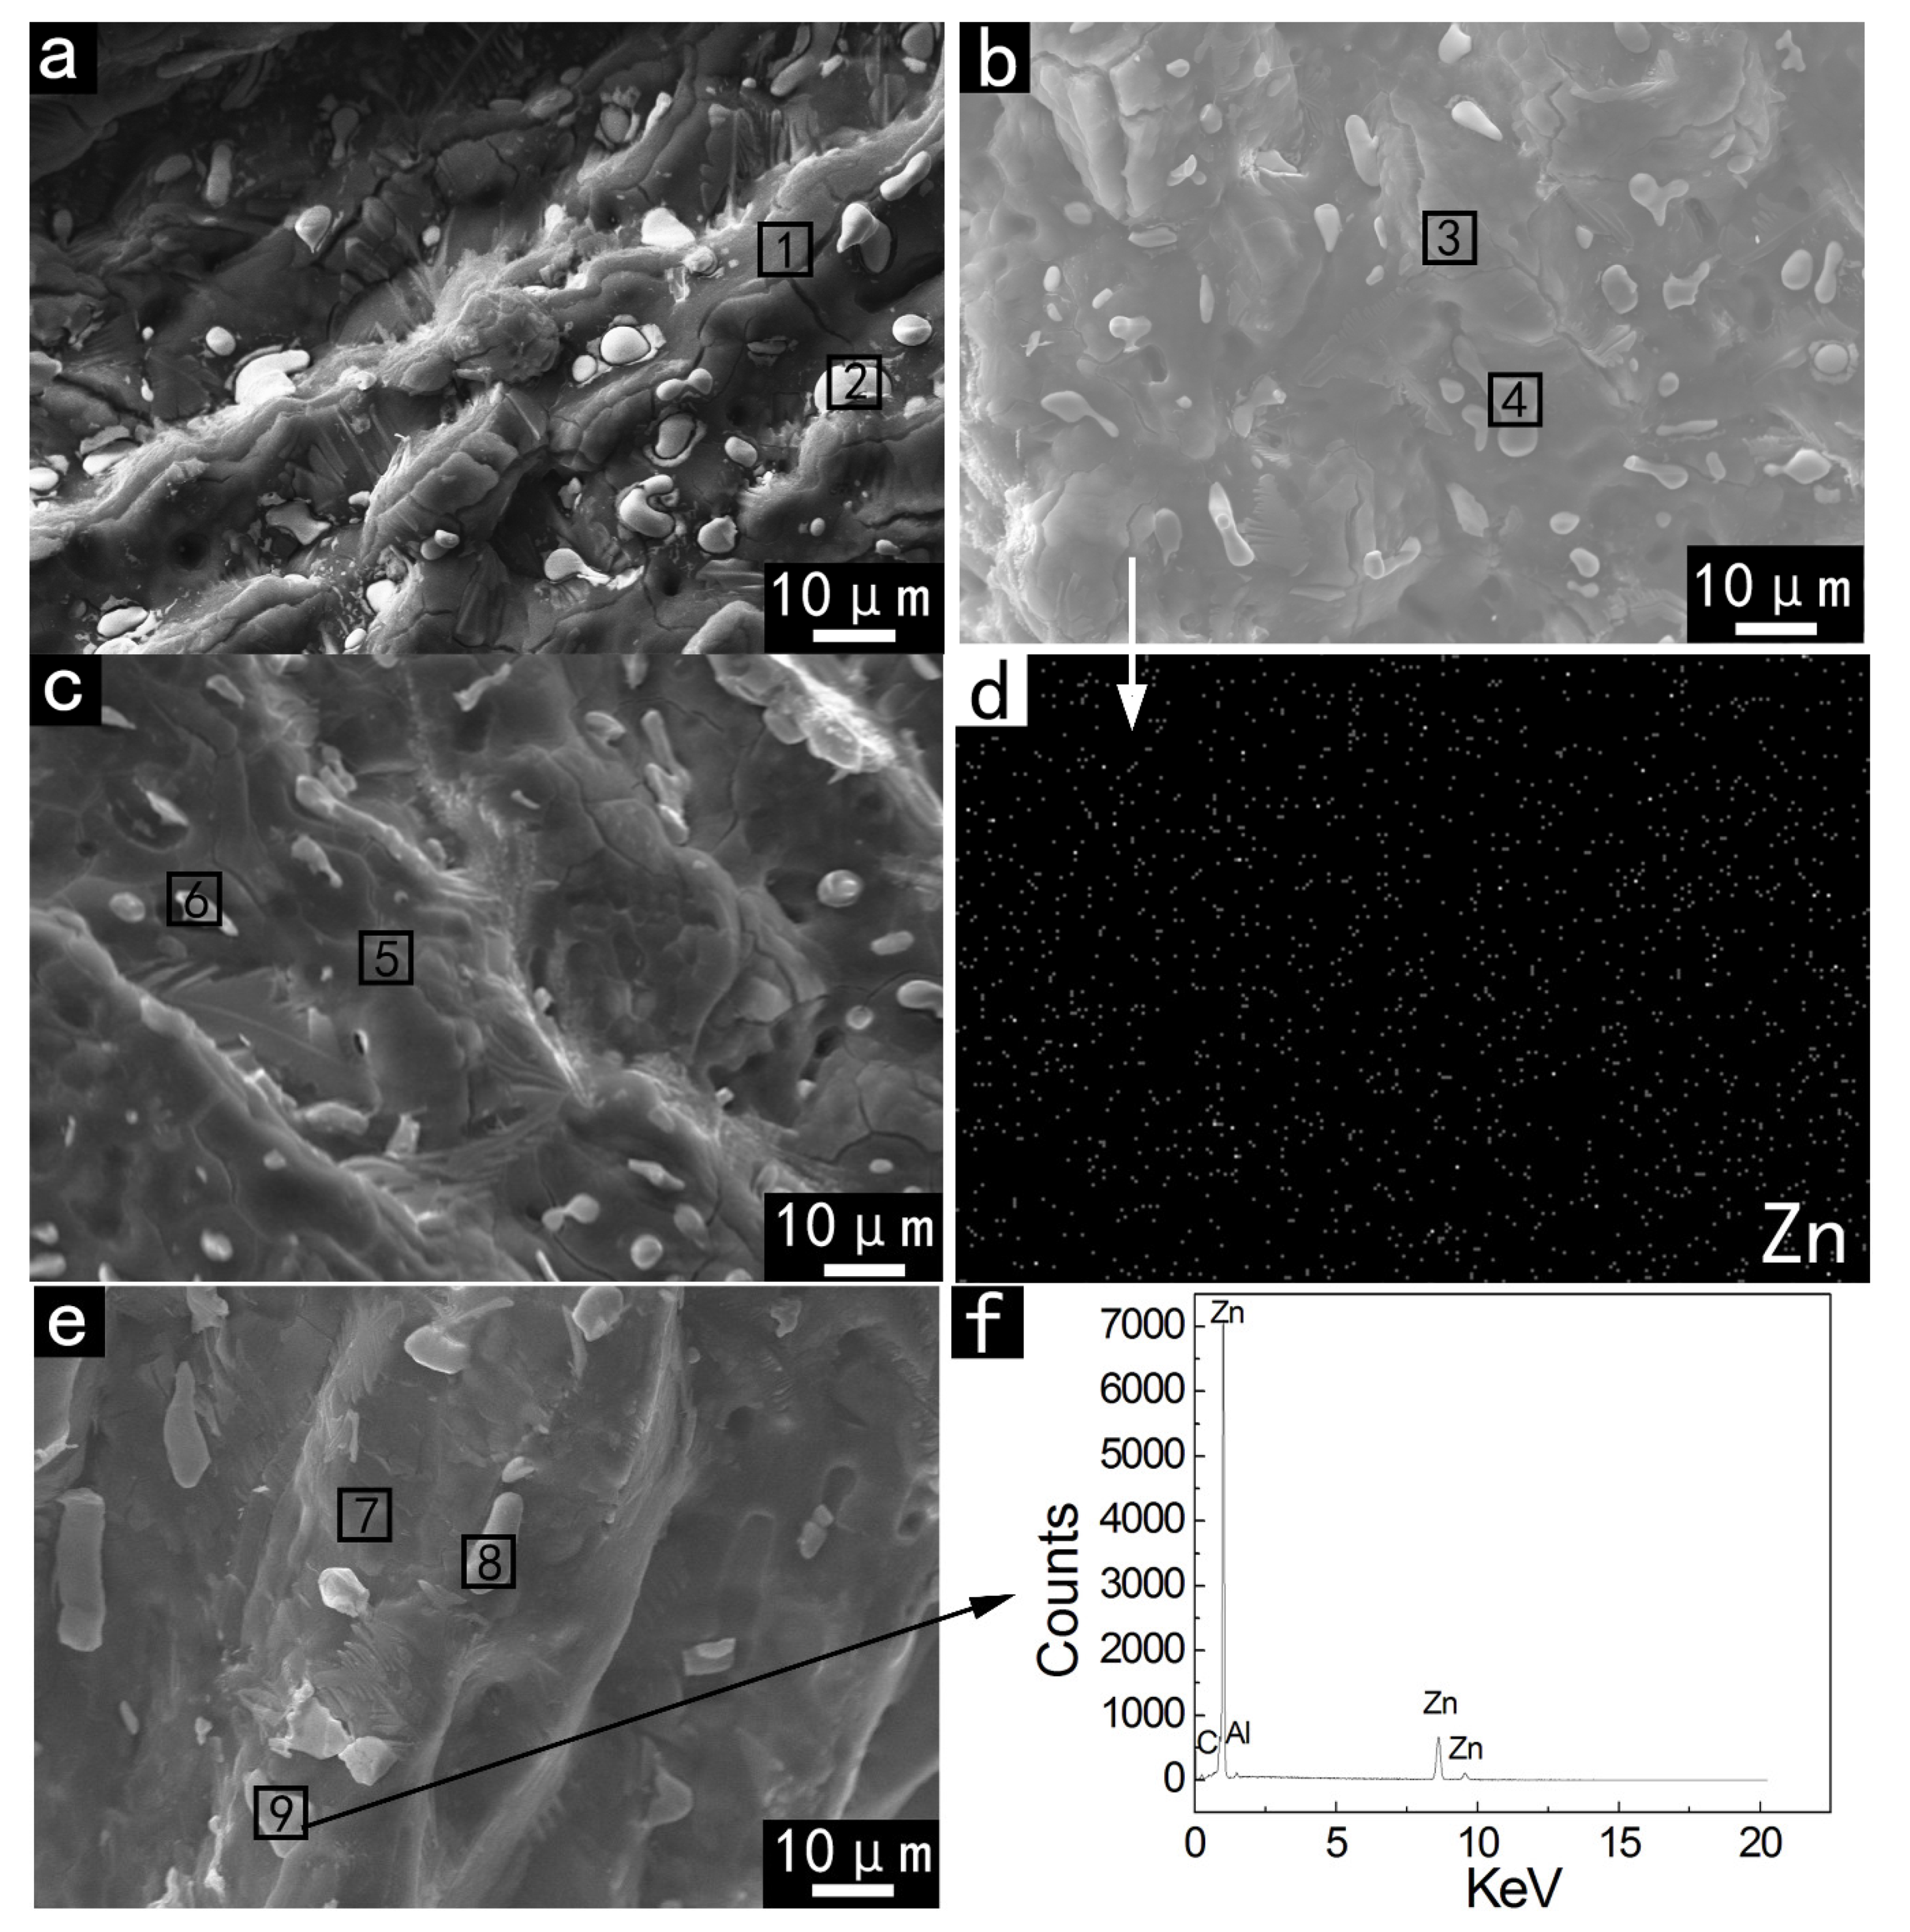
Since the EDX data are collected from the fracture surface of the sample, the relevant data are only used as references for the distribution law of each element. EDX analysis from Al-Ga-In3Sn-Zn ingots was performed to identify the element distribution in Al grains (G) and GB phases. SEM images of GB phase particles are illustrated in Figure 6, and the EDX data are listed in Table 2. It can be seen that the samples include a lot of O, this is owing to the rapid fracture surface oxidation when the sample is exposed to air during preparation. The elements of Al grains mainly include Al, Ga and Zn (if doped) besides O. Since Ga and Zn have high solid solubility in Al and an approximate atomic radius, it is easy for them to get into the Al crystal lattice. A small amount of In and Sn, found in the matrix, were quenched into Al grain due to a quick cooling rate during solidification. In Zones 2, 4, 6 and 8, the atomic ratio of In:Sn in these GB particles approaches 3:1, which is very close to the mole ratio of the two in the raw material during the preparation process. Meanwhile, the solid solubility of In and Sn in Al grains is particularly low. When the content of Zn increases, as shown in Figure 6e, a small amount of Zn is found almost in its particulate form (91.7 at.% Zn), which is dispersed in the alloy ingots.
Zn exists in both the G and GB phases. The typical characteristic of the GB phase is the high content of In and Sn elements. This explains why the reduction of In3Sn content in Figure 5 led to a relative decrease in the total area and number of GB phases. However, with an equivalent reduction in the amount of In3Sn, the variation law of the total area and single area of the GB phase (the slope of the solid line and the dotted line in Figure 5) are different. This shows that when a small amount of Zn is doped, Zn mainly forms a solid solution with Al, causing the GB phase area to decrease rapidly. When more Zn is added, Zn starts to enter the GB phase, so the decline rate of the solid line which shows the total area of the GB phase slows down, and the area of a single GB phase is basically unchanged, staying around 11–12 μm.
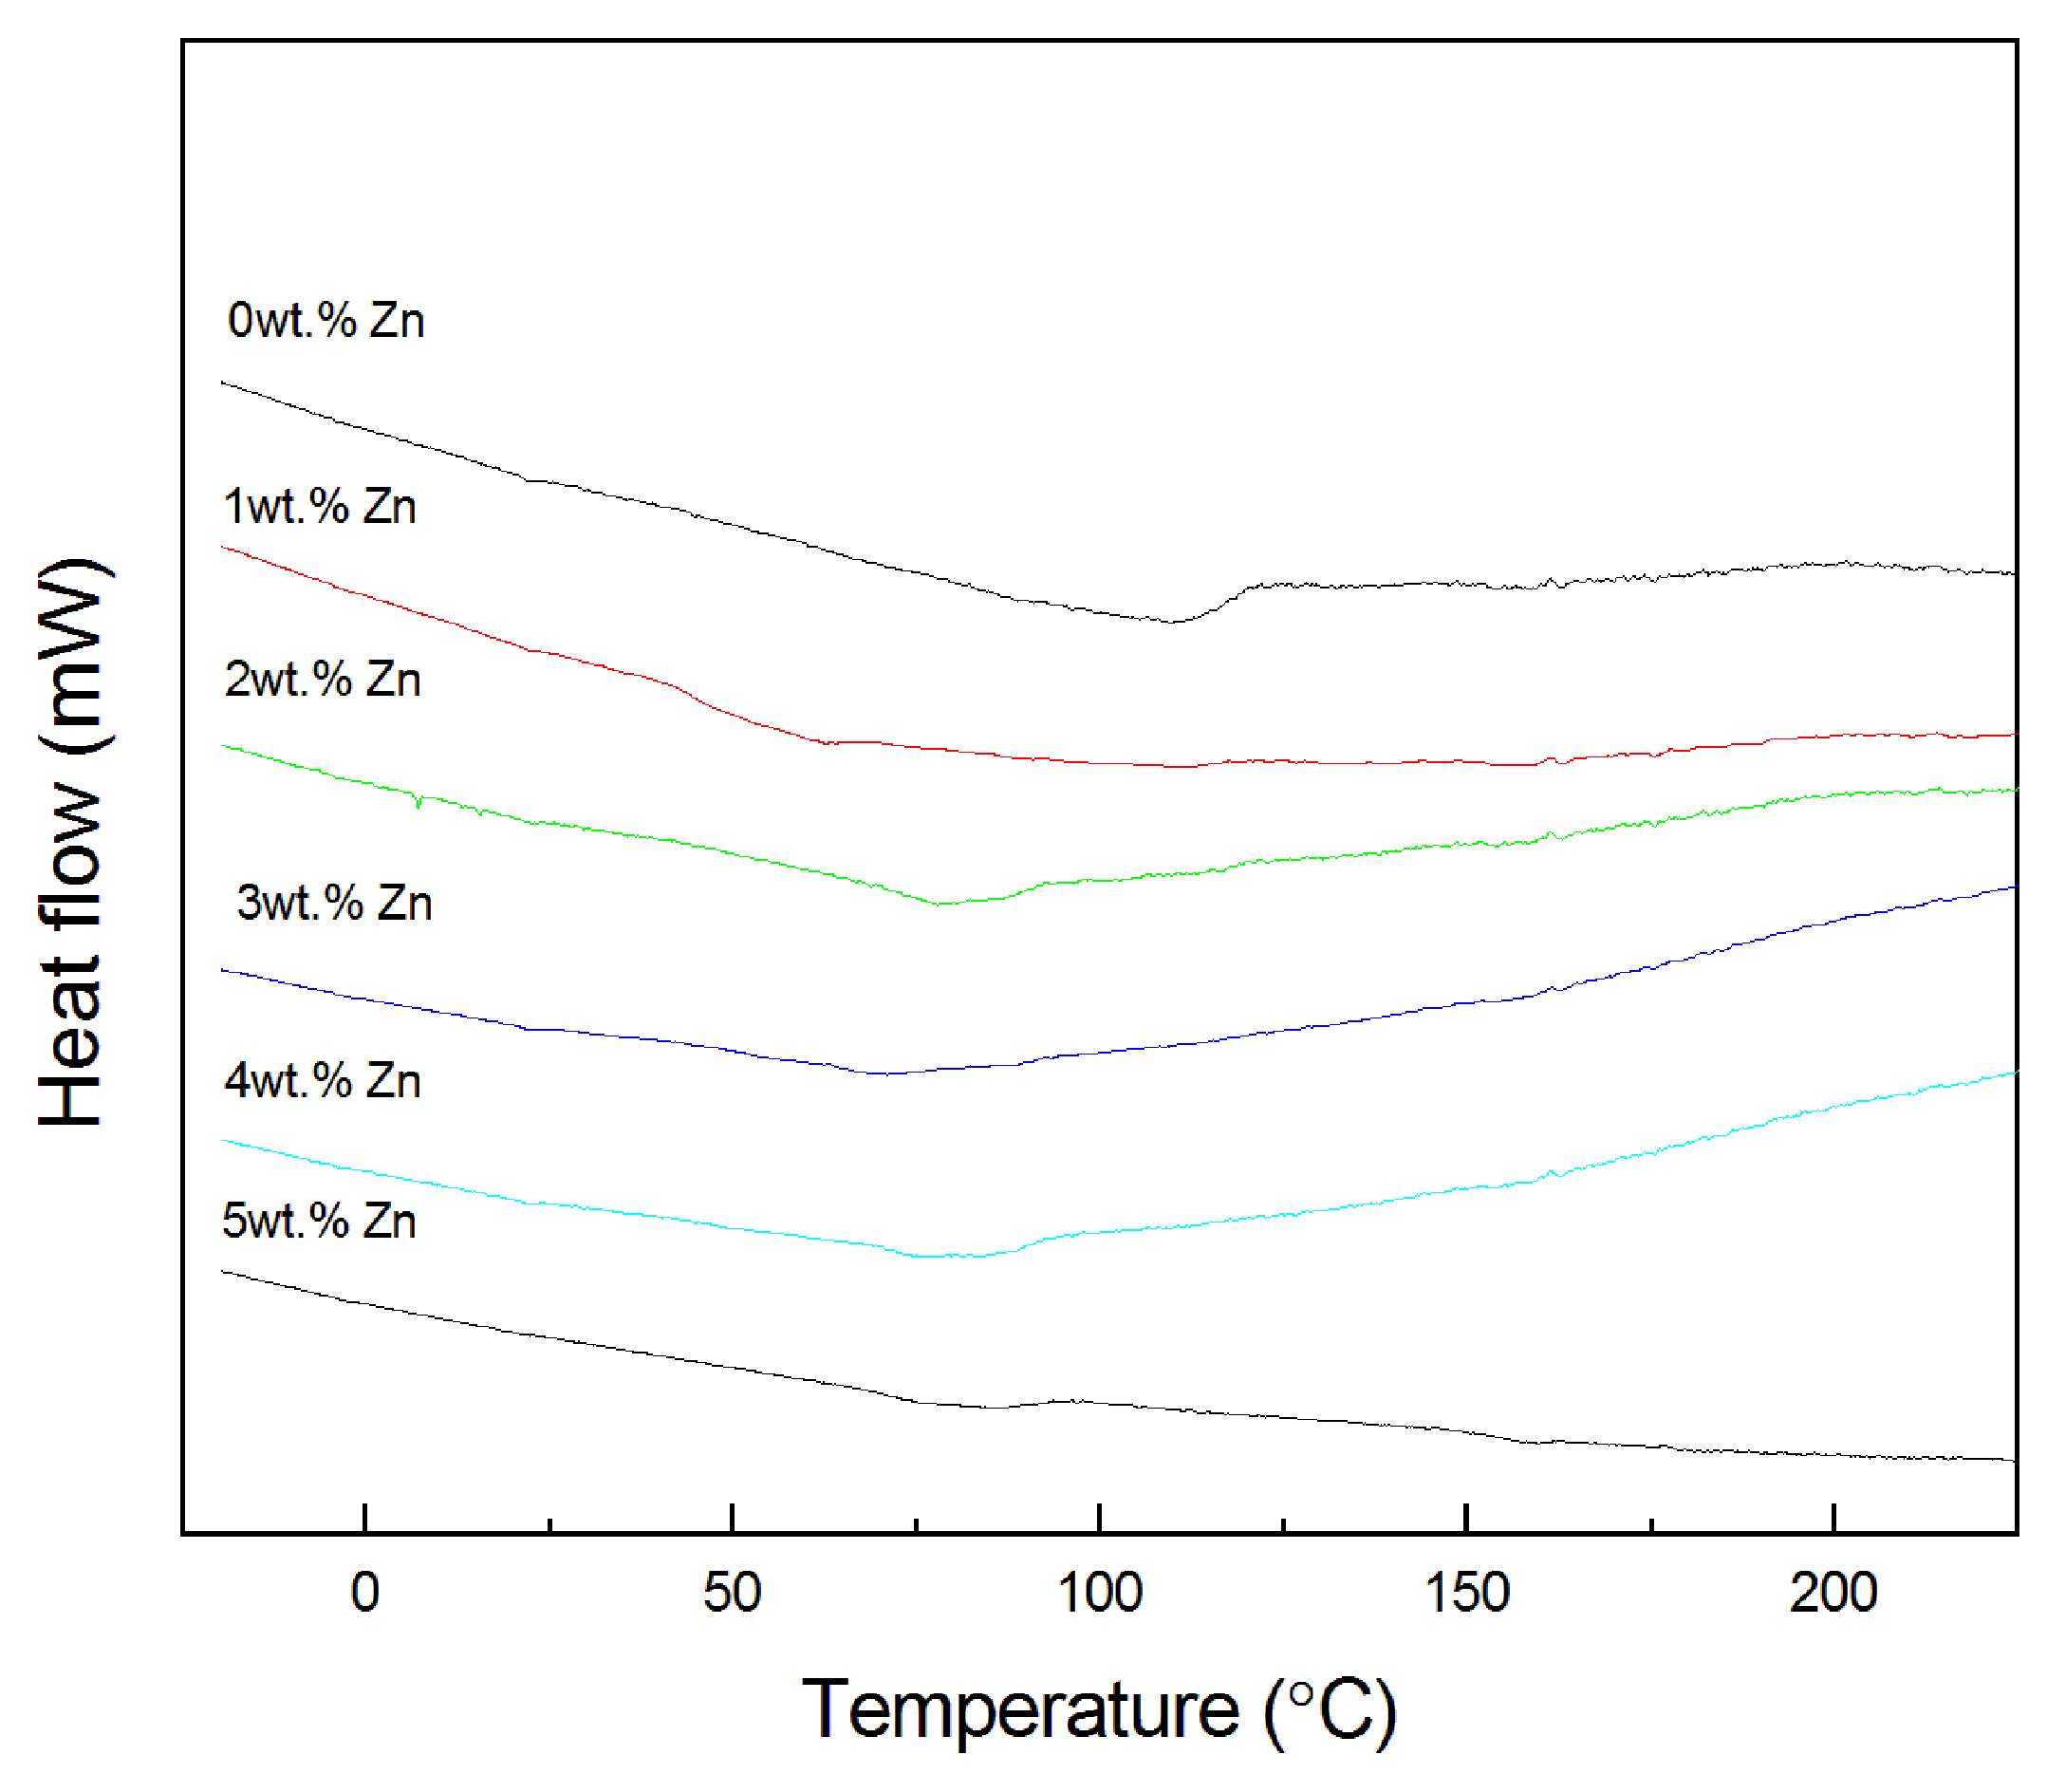
3.2.4. DSC Curves
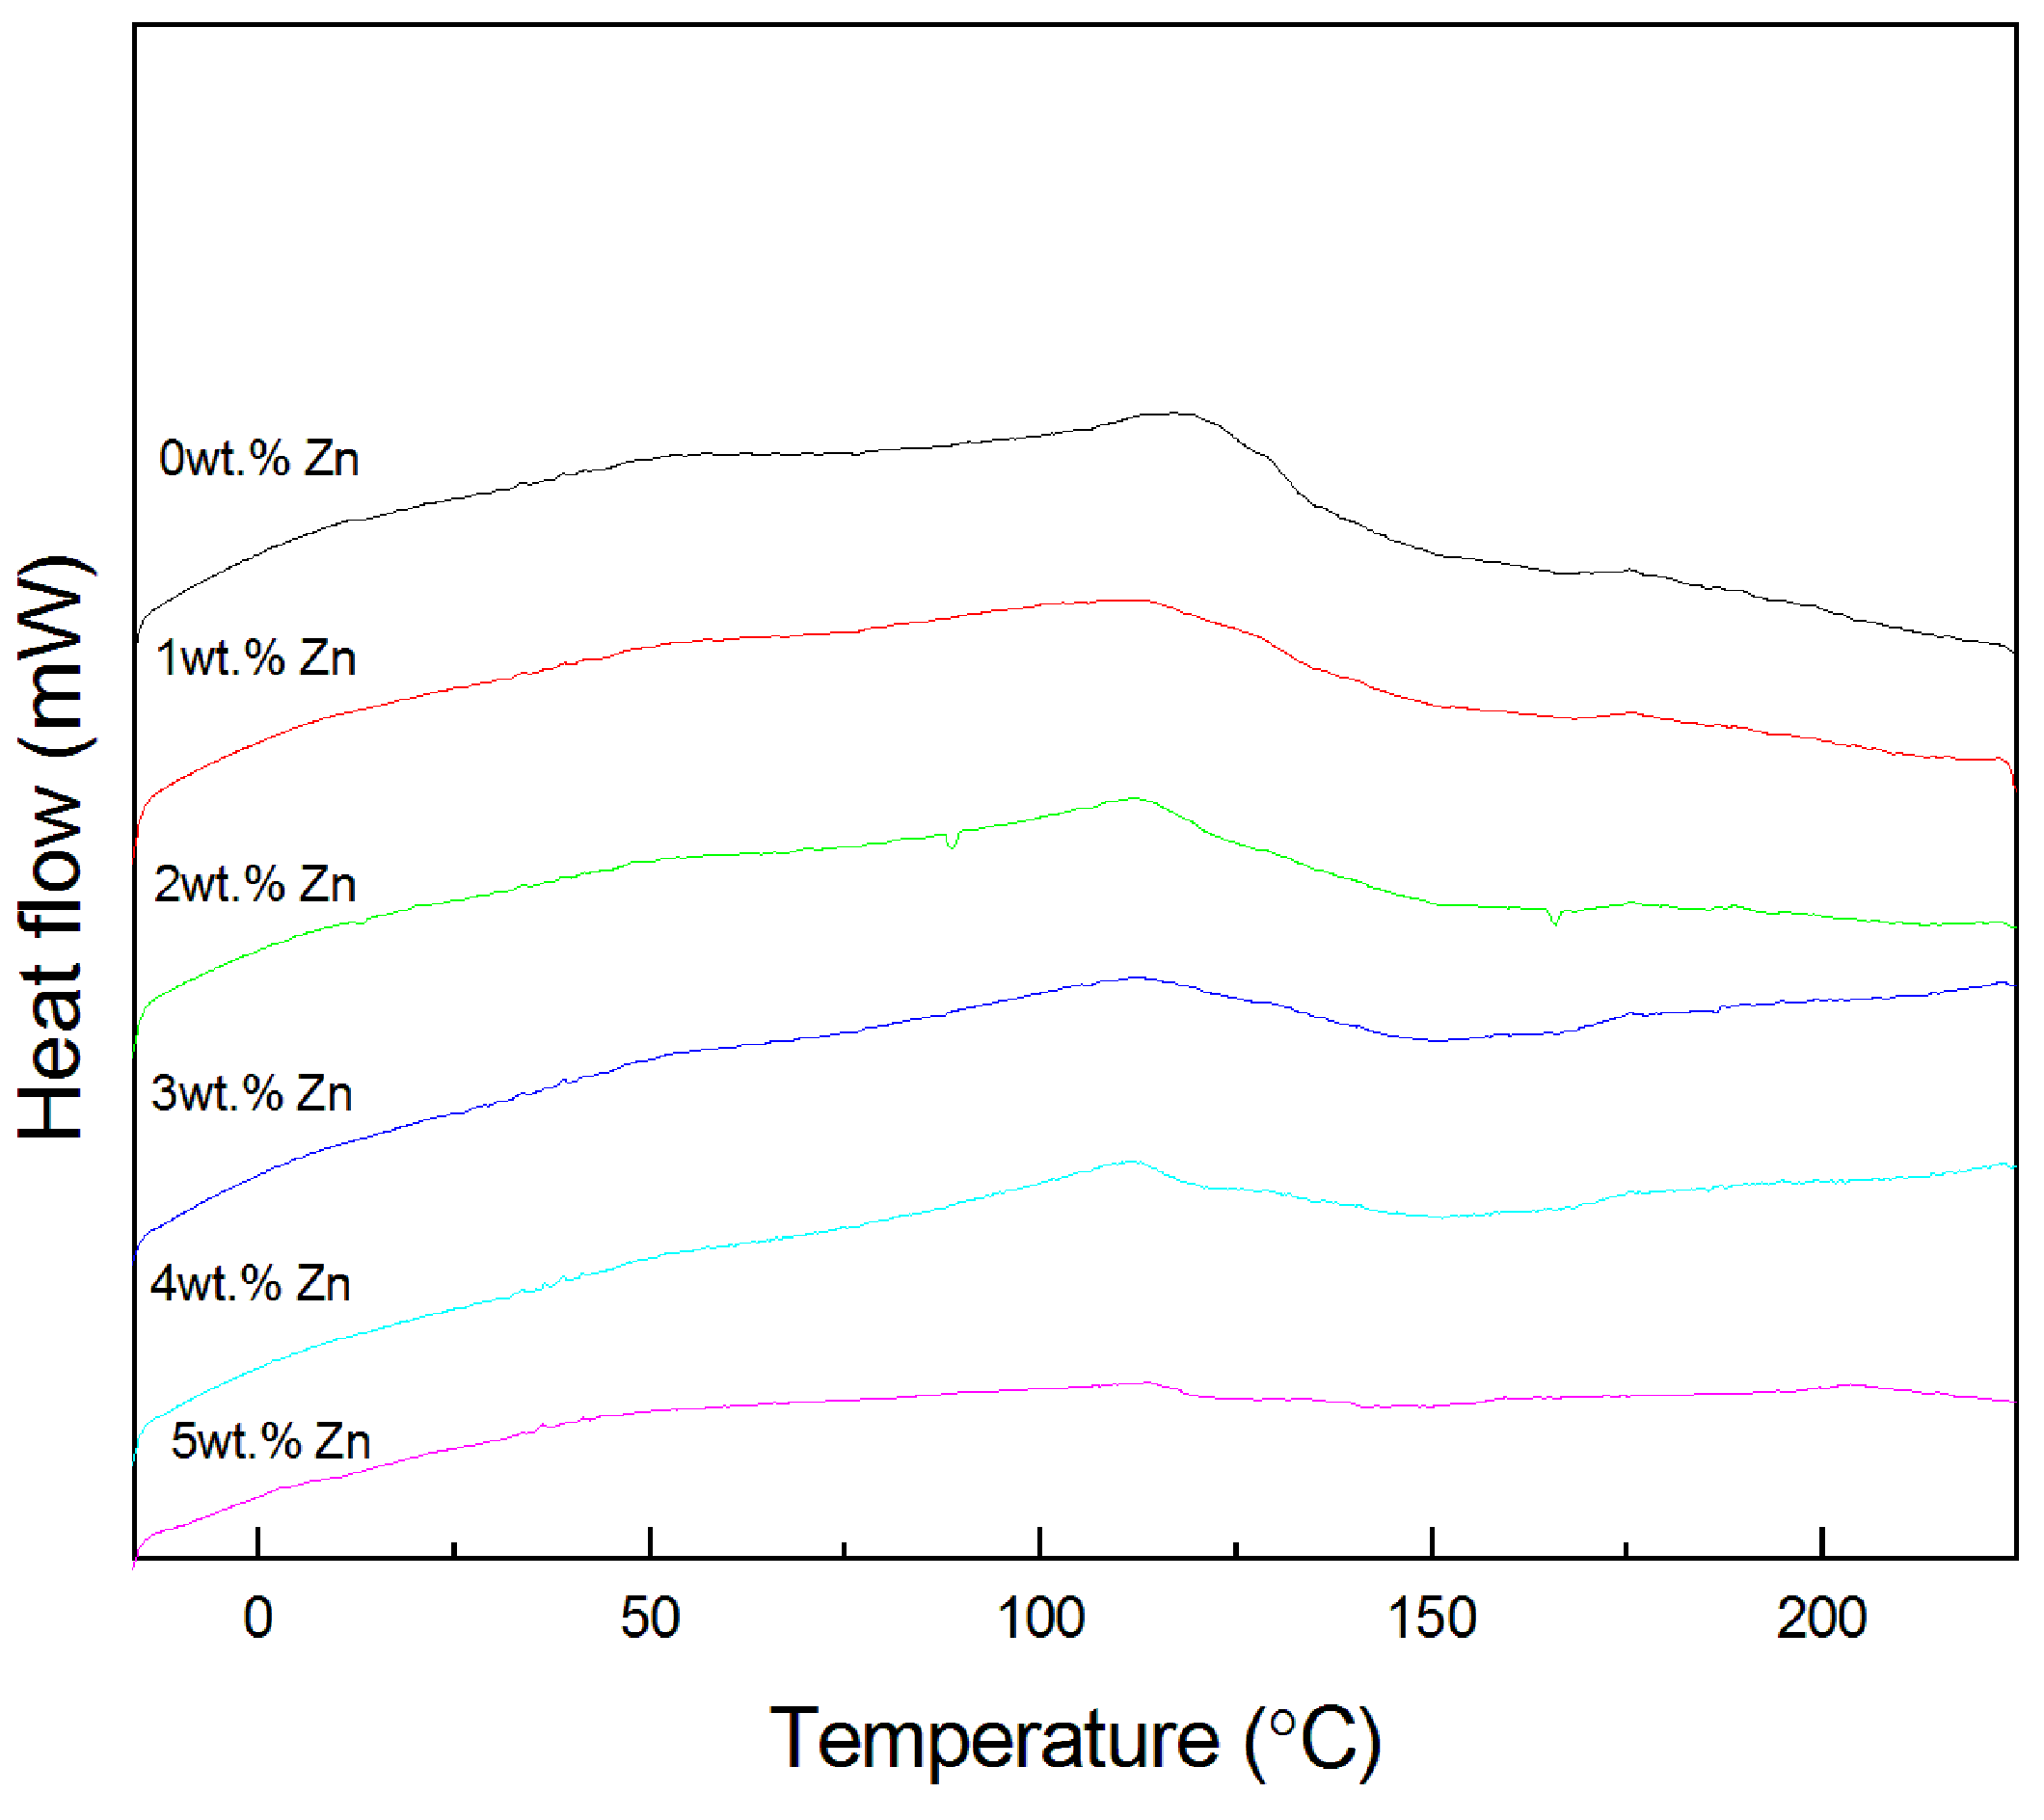
Figure 7 and Figure 8 show the typical DSC curves of Al-rich alloys. One wide endothermal peak or exdothermal peak emerges in the DSC trace. The peak temperature is about 120 °C, which is supposed to be due to the eutectic reaction of Al and In3Sn according to the In-Sn phase diagram (75 at.% In-25 at.% Sn). Compared with Al-Ga-In3Sn alloy, the diffusive peak moves to the cold side when a small amount of Zn is doped, and then moves to the opposite side slightly accompanied by the increase of Zn doping.
3.3. Kinetic Parameters
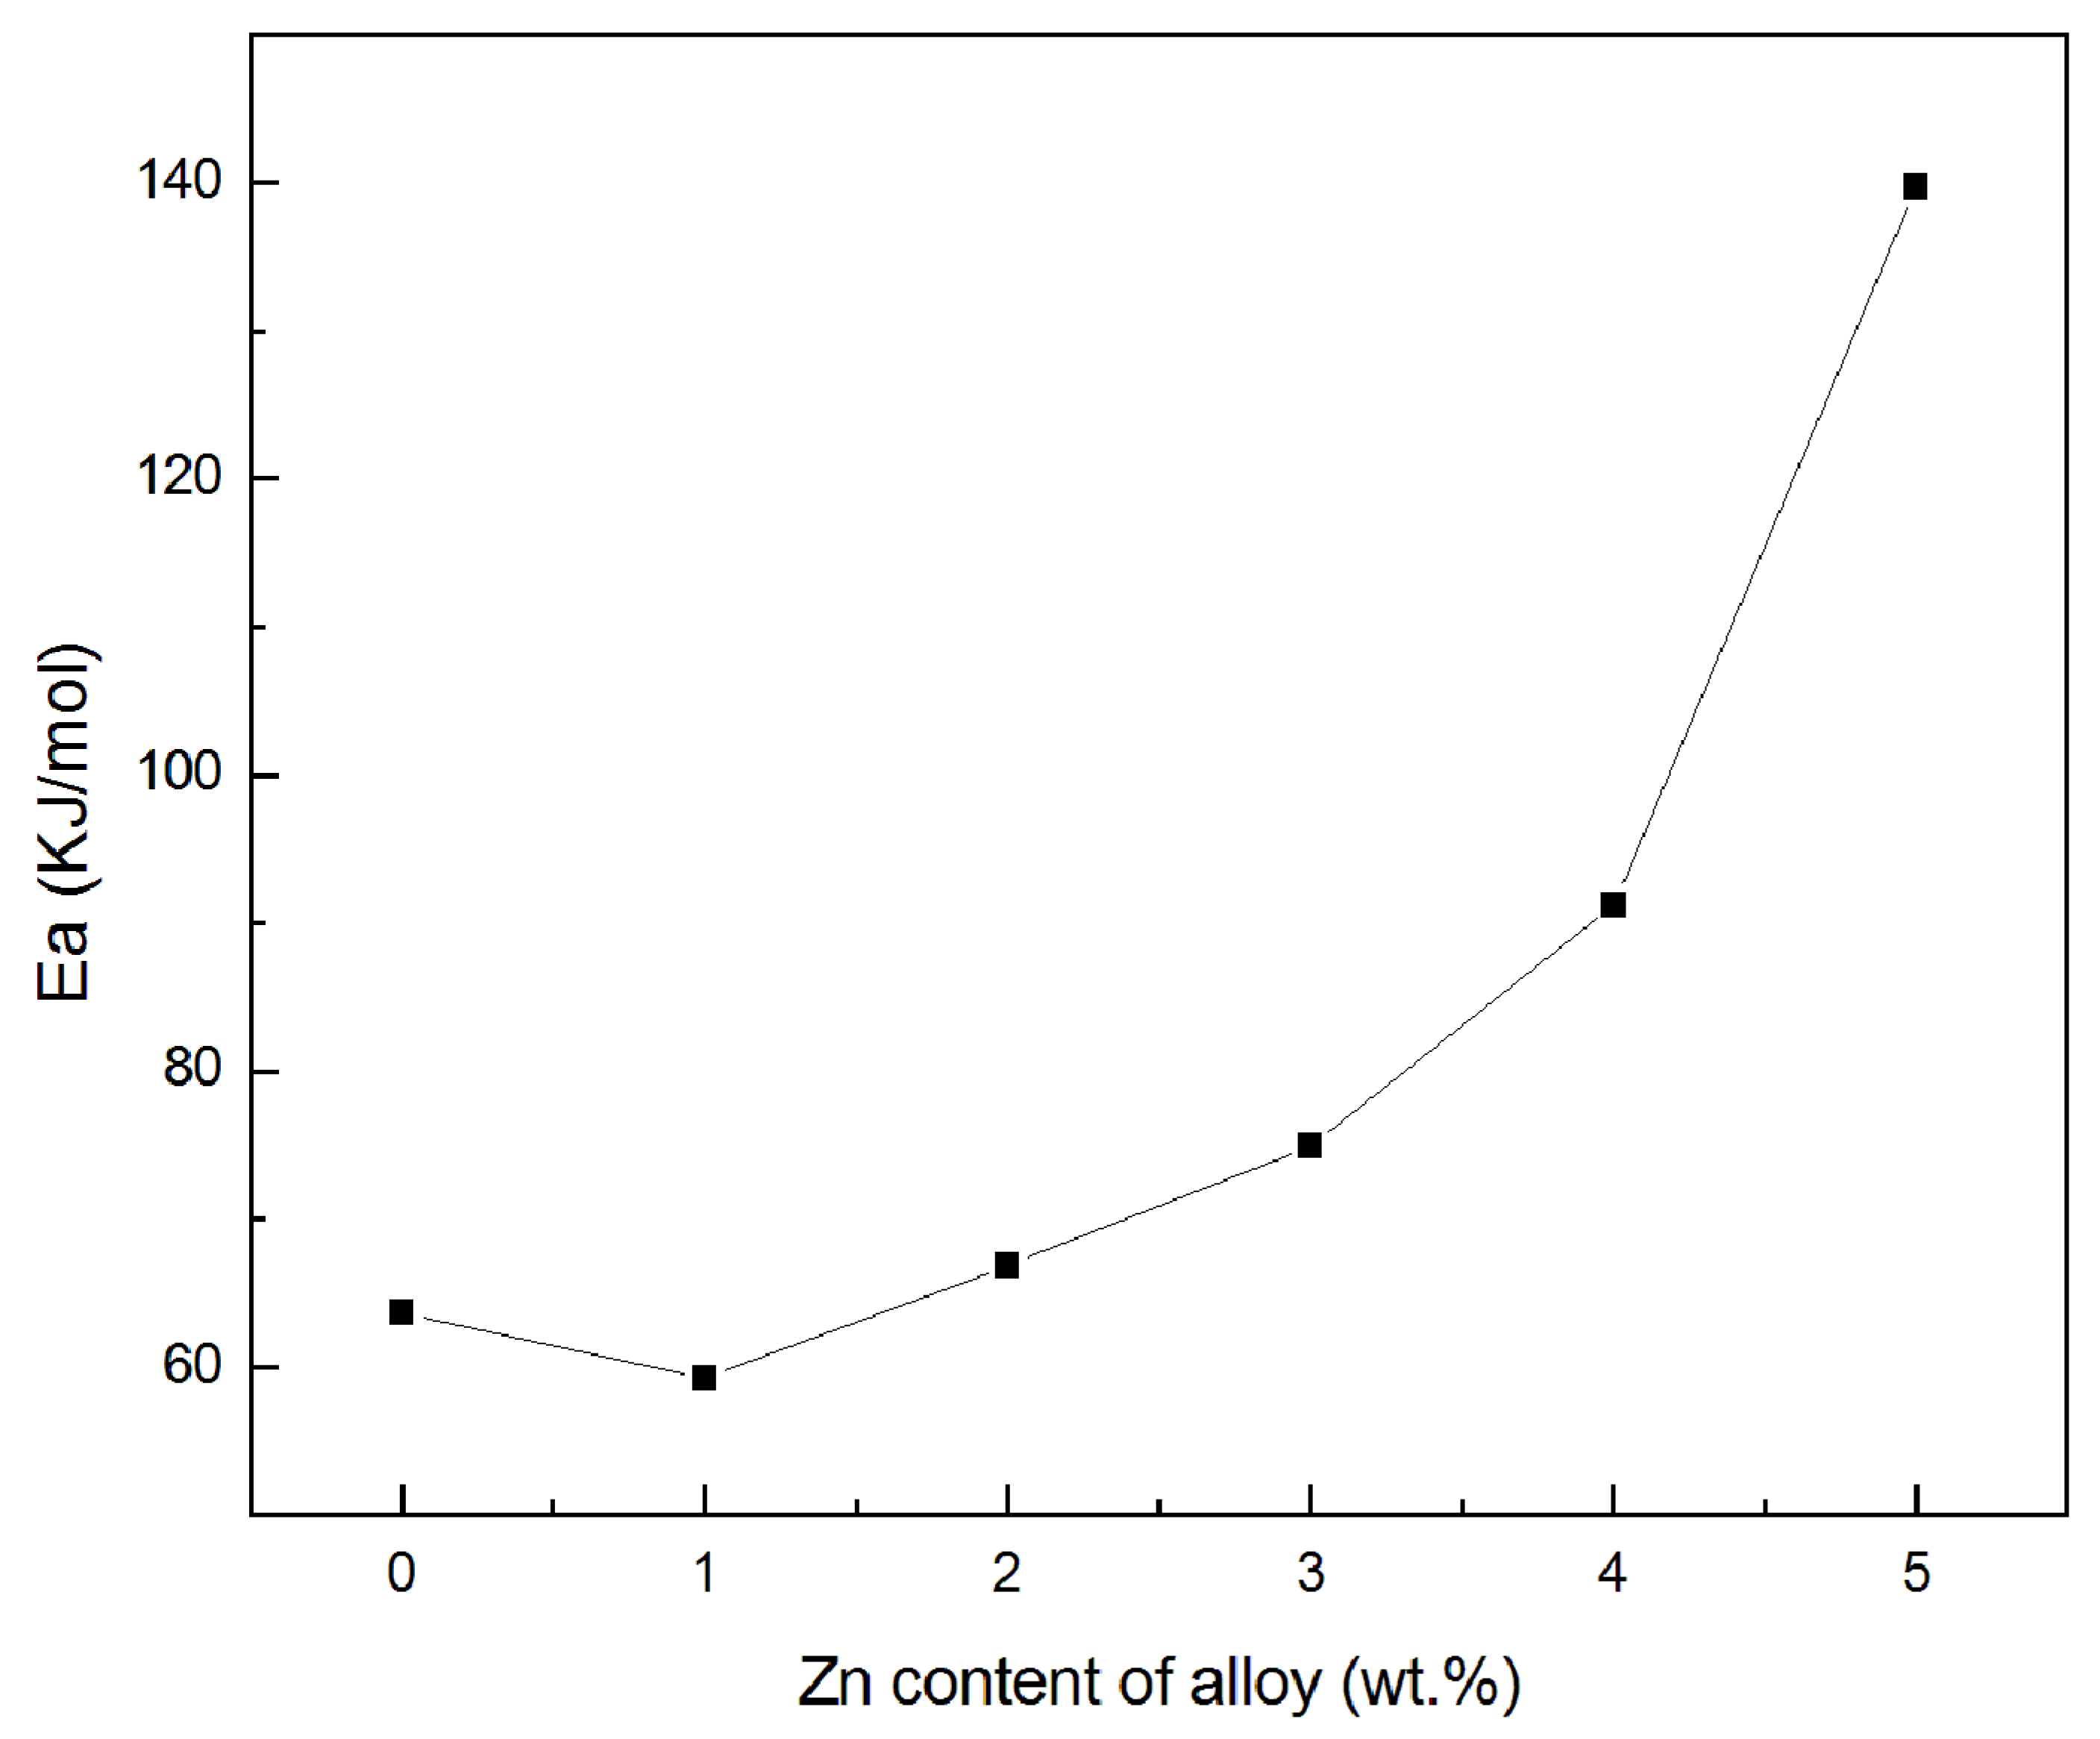
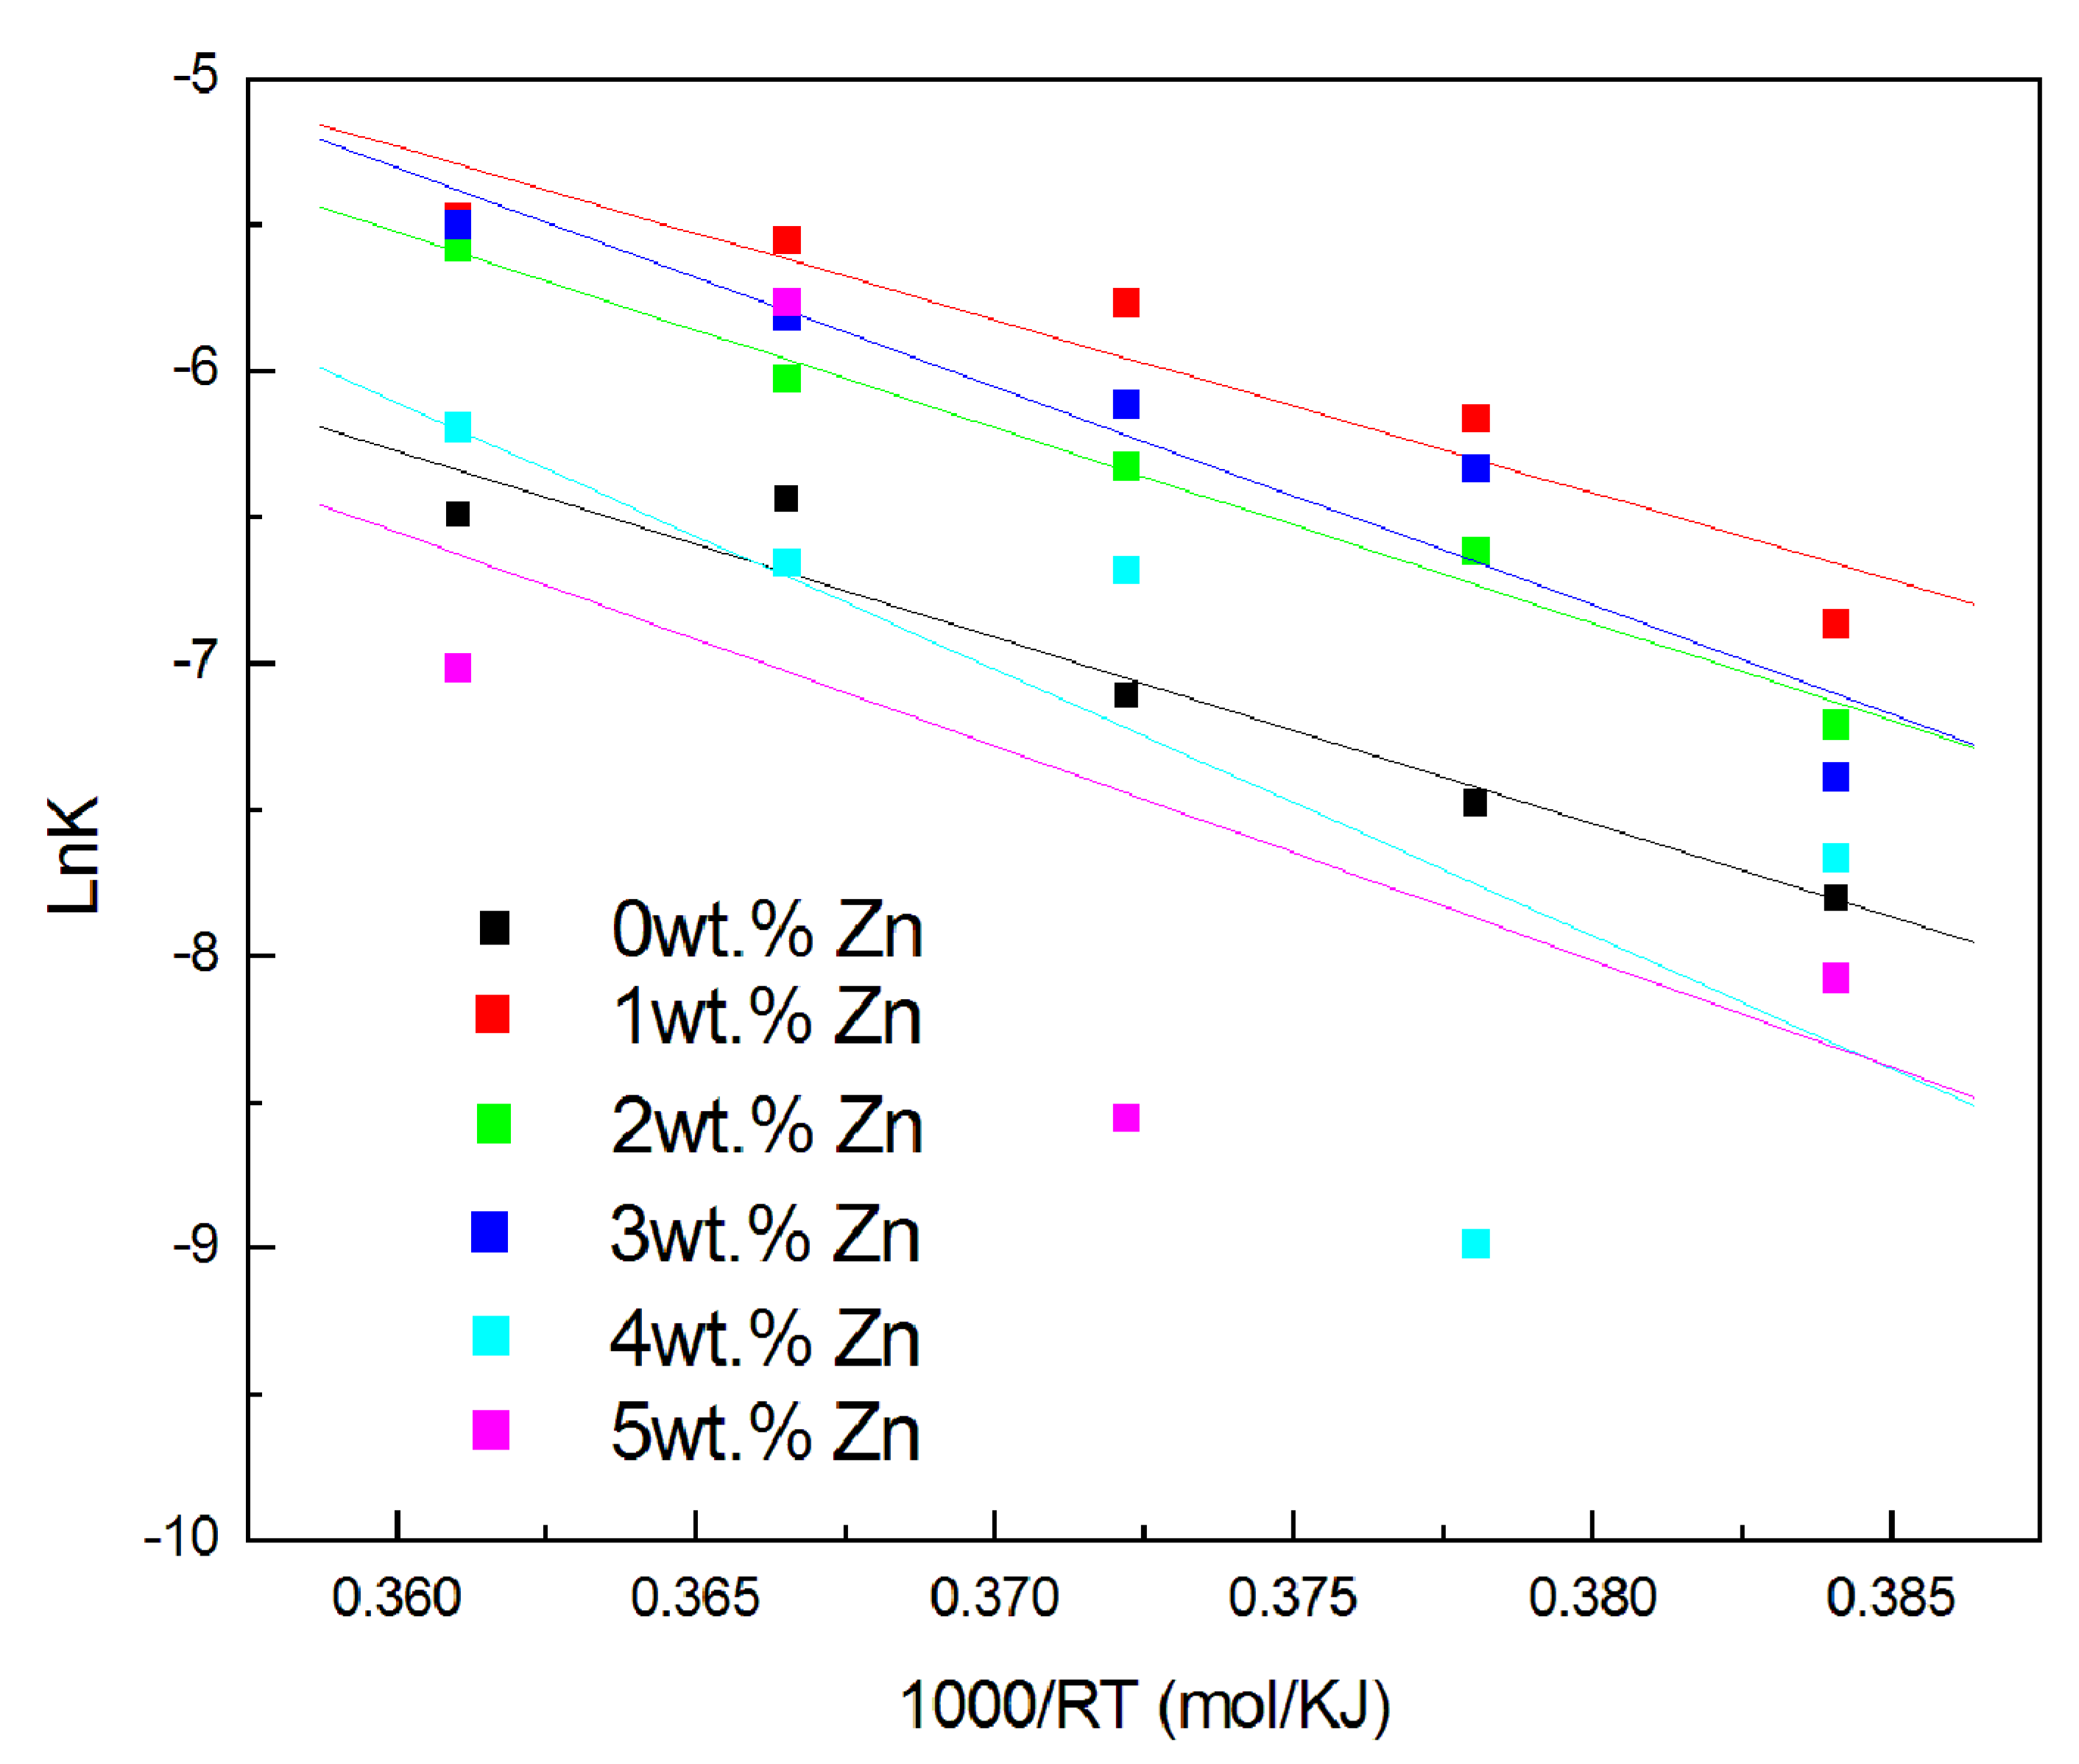
The formulas used to calculate the kinetic parameters of the Al hydrolysis reaction have been introduced in previous studies [36,37]. The activation energy (Ea) has been calculated (Figure 9) by the Arrhenius diagram of the hydrogen generation yields derived from various temperatures (Figure 10). When the Zn doping amount is increased from 1 to 5 wt.%, the activation energy of these alloys increases accordingly from 59 to 139 kJ/mol.
From previous studies, the factors affecting the activation energy are as follows:
(1) W. Wang and coworkers [30] found that the Ea of Al-Ga-In-Sn alloys ranged from 53 to 77 kJ/mol. The researchers believe that this change is the result of different grain size (increases from 23 to 258 μm). Our results of the Zn-free alloy (Al grain size: 33 ± 5 μm; Ea: 63 KJ/mol) are very close to their values (37 ± 16 μm, 56 ± 5 KJ/mol).
(2) Jeffrey T. Ziebarth and coworkers [36] speculated that the compositions might affect the activation energy. The eutectic reaction between GB phase and Al is identified to be a key factor in alloy hydrolysis. The addition of Zn changes the GB phase from a ternary alloy (Ga-In-Sn) to a quaternary alloy (Ga-In-Sn-Zn). Adding a small amount of Zn means that the relative contents of In and Sn are reduced, and the Ga-In-Sn mass ratio is closer to the eutectic point (Ga-In-Sn Ternary phase diagram), but as more low-melting metals (In3Sn) are replaced by Zn (more than 1 wt.%), the energy required for the reaction increases dramatically. Hence, it makes sense that the activation energy varies with chemical composition.
(3) The segregation in alloys may also cause an increase in the activation energy [35]. A Zn-rich particle was found in the high Zn alloy, which is most likely due to segregation. Although the number of these particles is very small, the degree of influence of these segregations on the hydrolytic activation energy needs further study.
4. Discussion
According to the previous experimental results, it is found that the hydrogen production performance of alloys with different Zn doping amounts is significantly different. The composition of the material directly affects its physical and chemical characteristics. Therefore, the determination of the main phases of the alloy and the qualitative analysis of the distribution characteristics of Zn should be discussed first.
In addition to the Al and In3Sn phases determined by XRD testing, the existence of Ga as a solid solution of Al (Ga) has also been verified in many studies [30,31,32]. The EDX analysis shows that Zn exists in both the G and GB phases. As shown in Figure 6d and EDX mapping of the whole image in Figure 6b, Zn atoms are randomly dispersed throughout the entire region, which is similar to the distribution of Ga in Al alloys [12]. It is further proven that Zn is more likely to exist as a solid solution combined with the XRD analysis and Al-Zn phase diagram. In addition, a small part of Zn will appear on the grain surface in the form of Zn-rich particles.
The entry of Zn into the GB phase means that the eutectic reaction of Al and GB phases will change accordingly, which is identified to be a key factor affecting the hydrolysis reaction of Al. The analysis results of DSC and activation energy confirmed this point, and their change rules are highly consistent, which can be explained by the same reason: As Zn begins to entered into the GB phase, the main composition of GB phase was changed from Ga-In-Sn to Ga-In-Sn-Zn, and the eutectic temperature and Ea of the grain boundary phase decreased. On the other hand, in the process of Zn taking the place of In3Sn, the melting point of Zn is significantly above other GB elements, leading to the eutectic temperature and Ea increases gradually. In addition, high activation energy will effectively increase the difficulty of the alloy to react with moisture in the air, which is conducive to long-term storage and long-distance transportation. Therefore, this can also be considered as a criterion for judging the practical value of alloys.
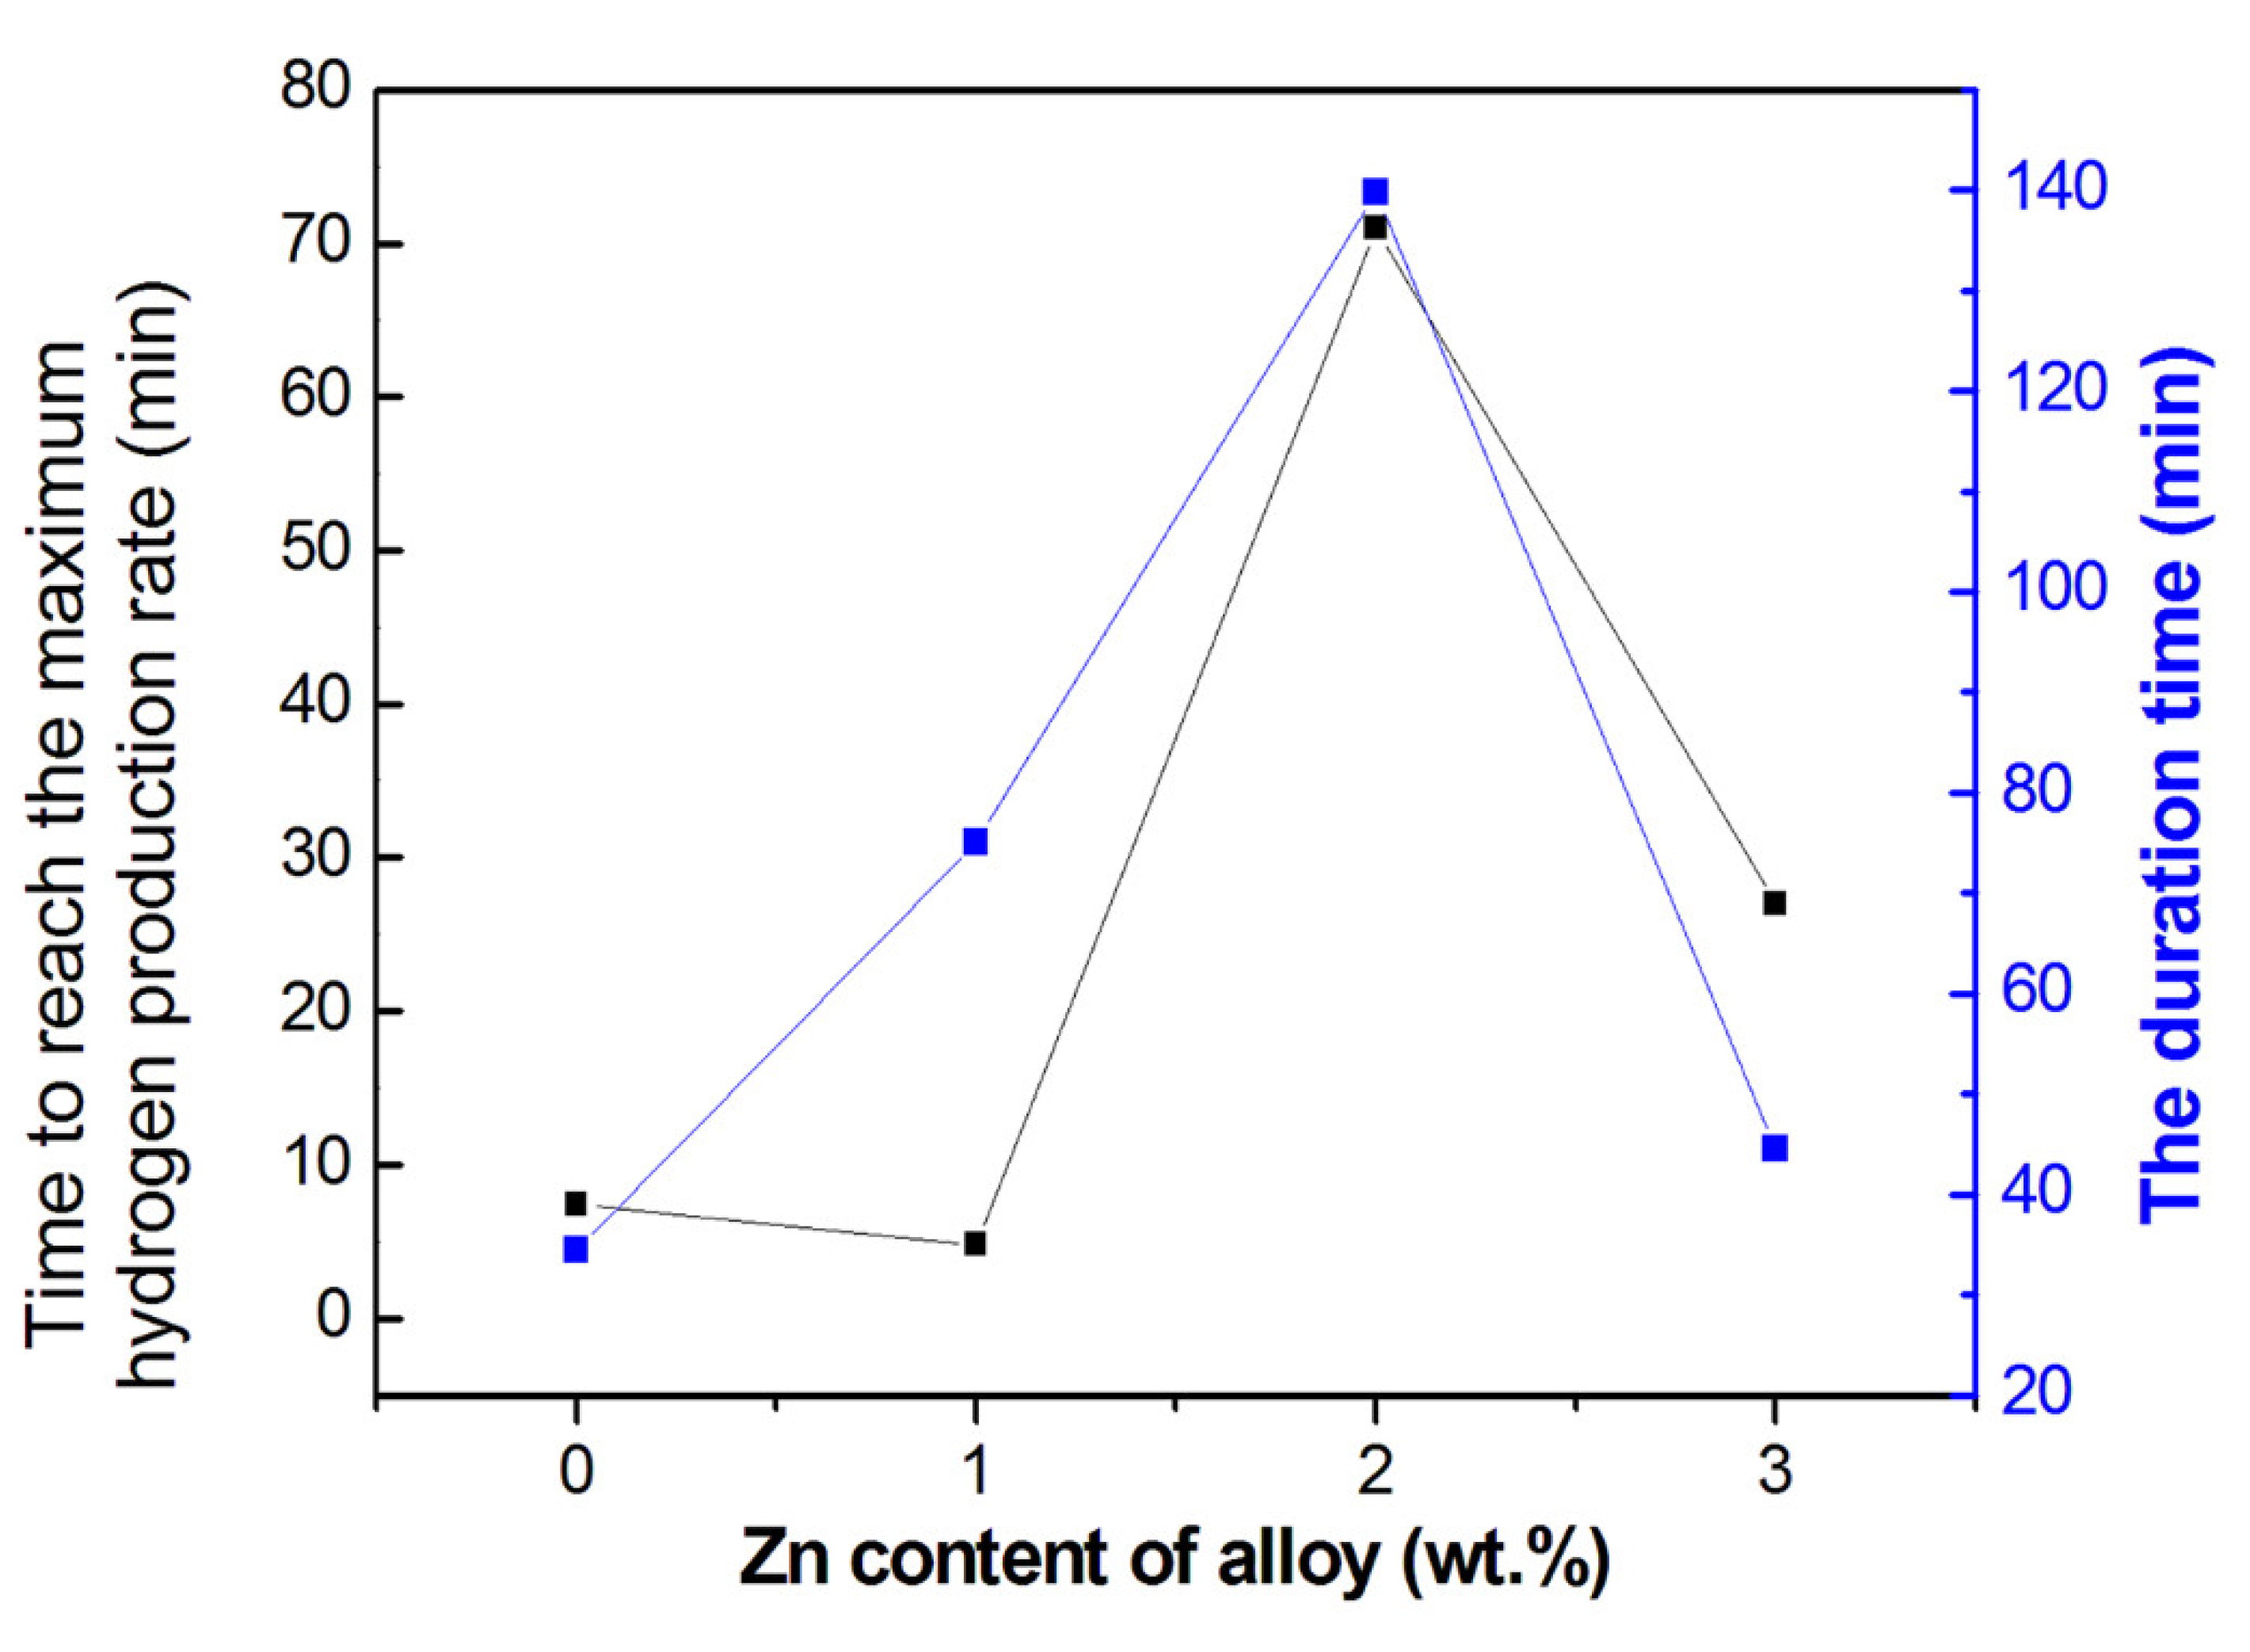
However, this mechanism does not perfectly explain that the sample (3 wt.% Zn) still has excellent hydrogen production performance. According to the conclusion of the previous study [37,38], two main mechanisms can be used to discuss the occurrence of these phenomena. On the one hand, the eutectic reaction of Al and GB phase is the origin of the Al hydrolysis reaction. When Zn was added, the sample became less susceptible to split when exposed to water. At the same time, the area of a single GB phase was reduced to a minimum value at 2 wt.% Zn (Figure 5), which delayed the startup time of the reaction, and further delayed the arrival of the maximum hydrogen production rate (Figure 11). On the other hand, the Zn will form different micro batteries with other metals and Al corrodes rapidly as the electrode potential of Al–Zn is formed. It is clear from Figure 2a,b and Figure 11 that the time consumed by the hydrolysis reaction of 2 wt.% Zn alloy is greater than the 3 wt.% one. Although the single GB area of the two is similar (Figure 5), the high Zn content means that more Al-Zn micro-galvanic cells will promote the reaction. Nevertheless, the content of Ga, In and Sn in the GB phase directly determines the starting temperature of the hydrolysis reaction. That is why the high-Zn content alloys (4 wt.%, 5 wt.% Zn) cannot hydrolyzed at a lower reaction temperature of 40 °C and low content of In3Sn makes the alloy stay intact in water.
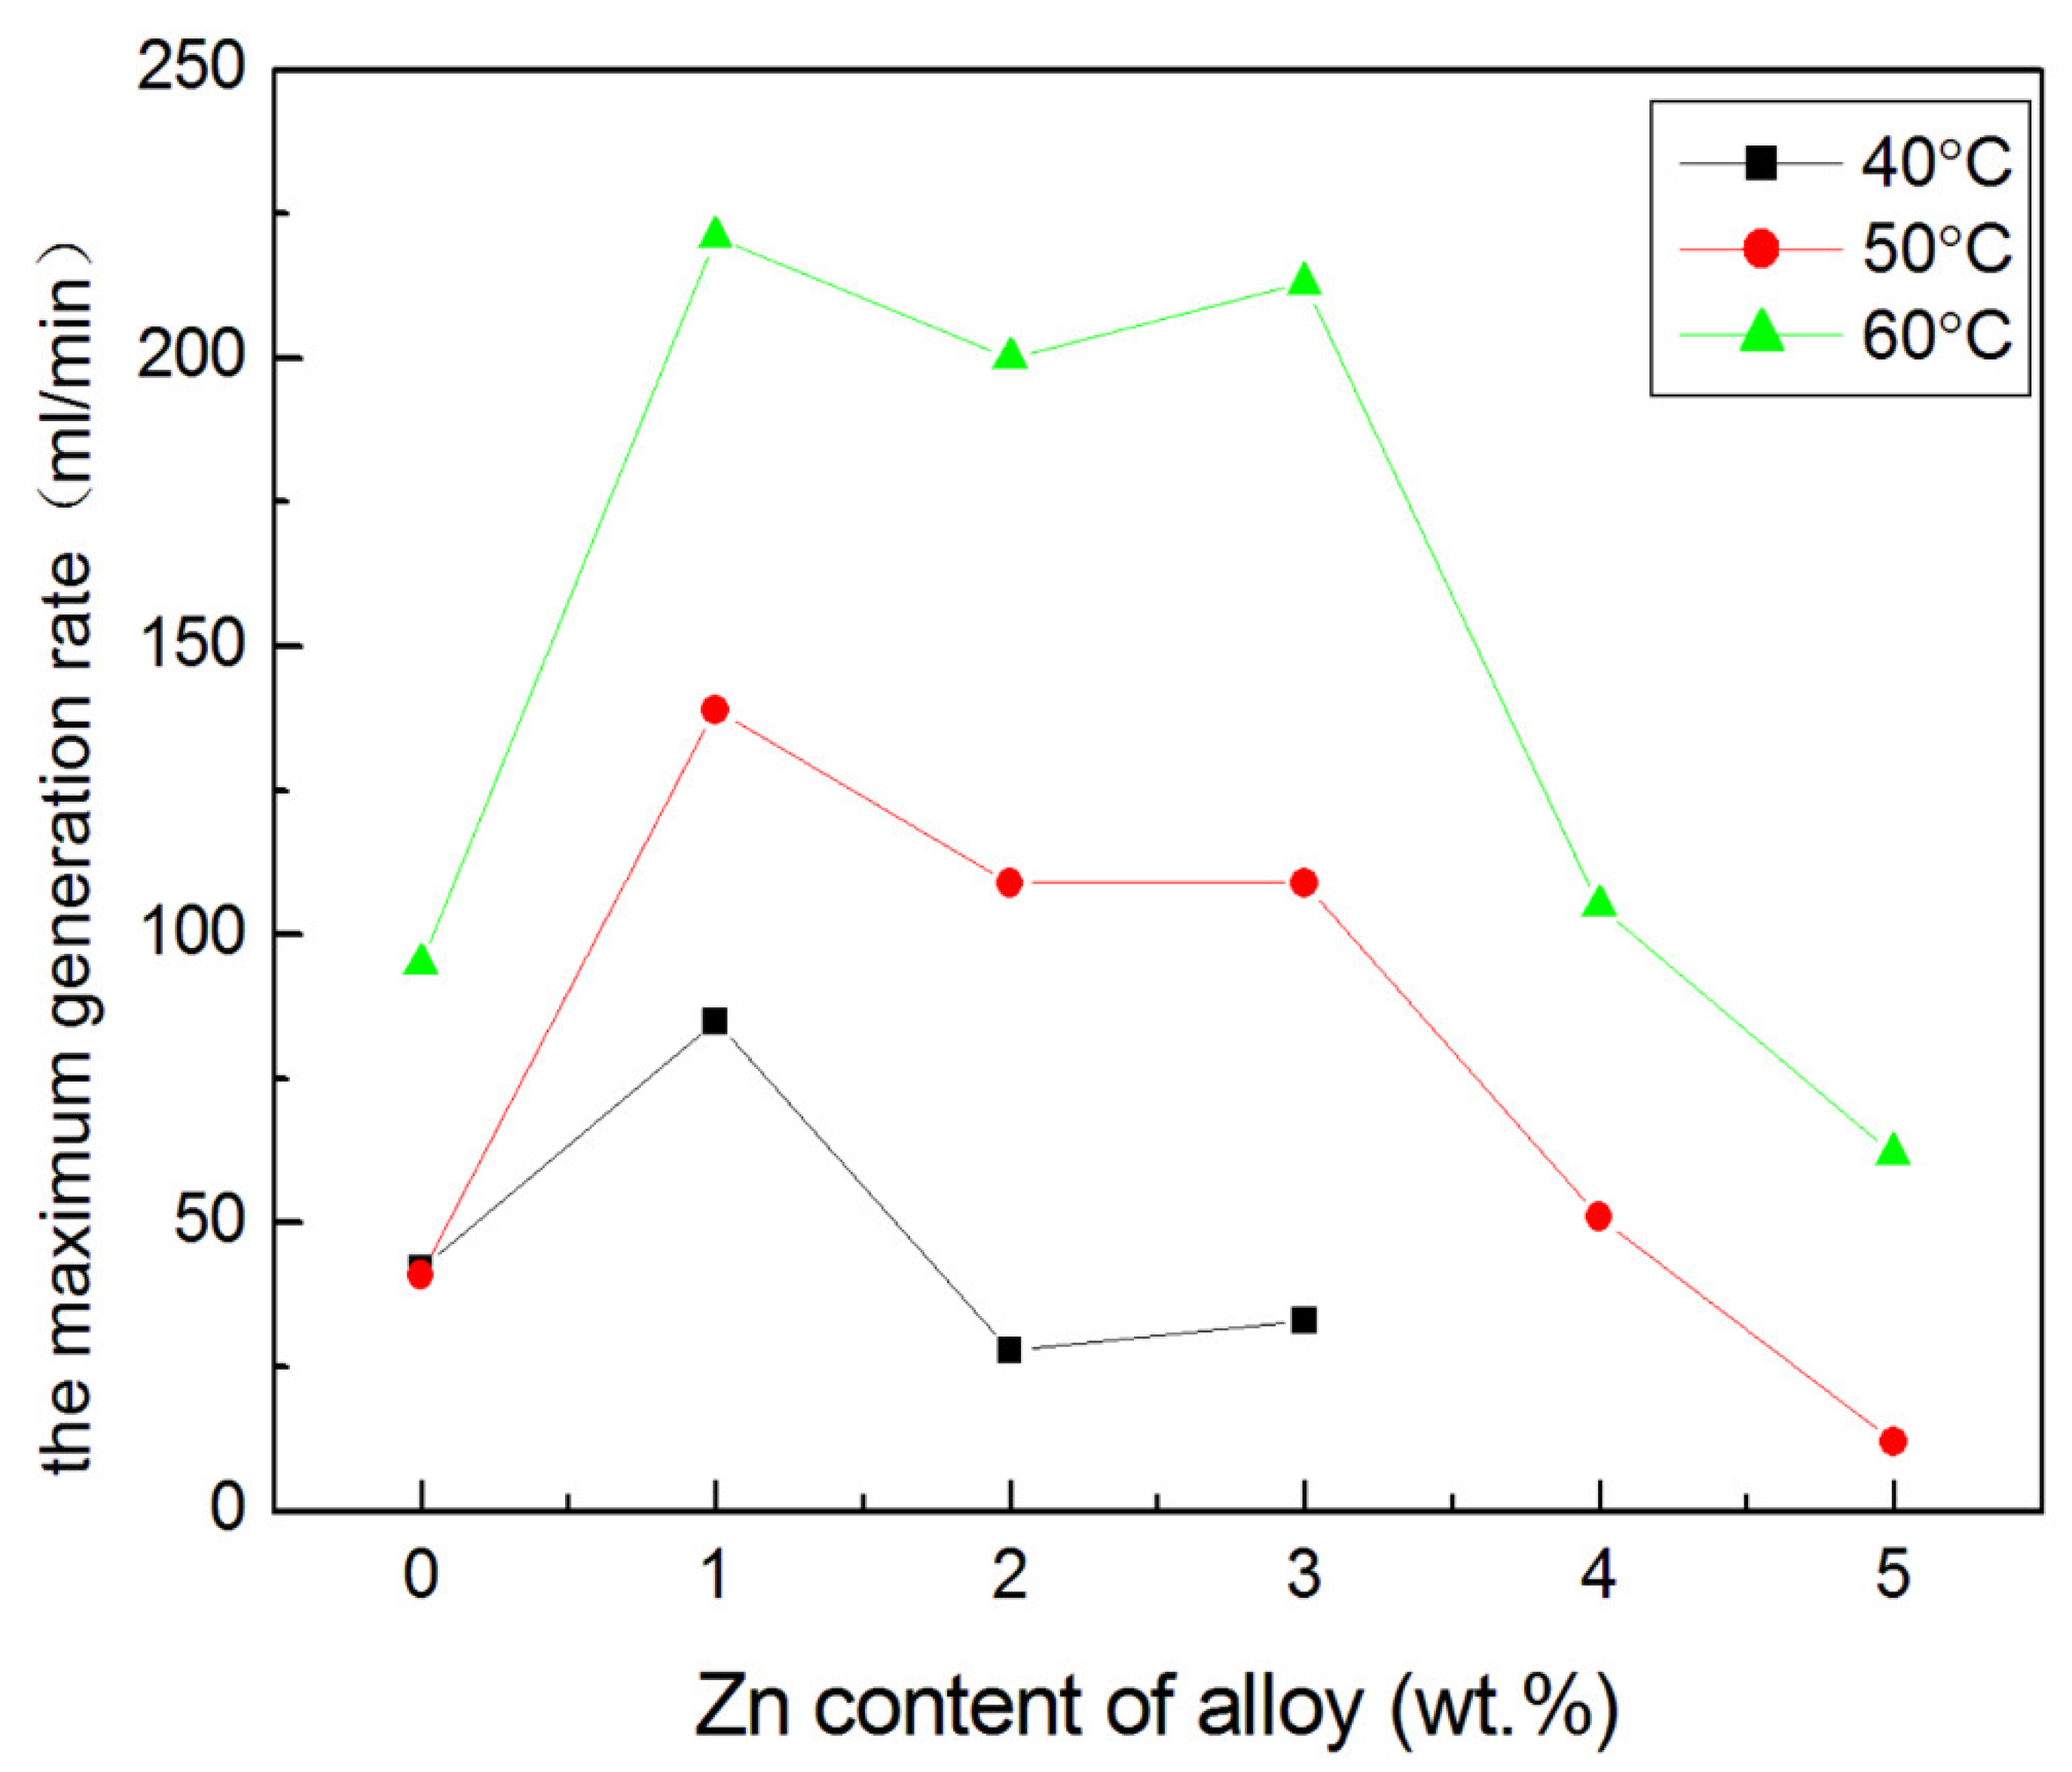
As shown in Figure 12, when the temperature increased from 40 to 60 °C, the max hydrogen production rate of Al-Ga-In3Sn alloy doubled. However, maximum release rate of hydrogen from Zn-containing alloys (1 wt.%, 2 wt.%, 3 wt.%) increased by 2.5, 8 and 6.7 times, respectively. The emergence of Al-Zn micro-galvanic cells in Zn-containing alloys has also contributed to an increase in the hydrogen production rate. Furthermore, at the same temperature, as the amount of Zn doping increases, the maximum hydrogen generation rate is constantly changing and has a maximum at 1 wt.% Zn. If the maximum hydrogen generation rate (almost with high Zn content alloy) is lower than that of the Zn-free alloys, their reaction duration is often extremely long. This is because the eutectic temperature of the GB phase in the high-Zn alloy (more than 1 wt.%) is higher, and more energy is required to promote the hydrolysis reaction.
The factors affecting the hydrogen production performance of different alloys are summarized as follows:
(1) The occurrence of alloy hydrolysis is related to the GB phase and the external surrounding (water bath) temperature.
(2) The GB phase composition of 1 wt.% Zn sample results in its minimum activation energy, and the formation of a small portion of Al-Zn micro-galvanic cells results in the fastest hydrogen production rate.
(3) When the doping amount of Zn reaches 2 wt.%, the area of a single GB phase decreases rapidly. At the same time, when the water temperature is 40 °C, the Al-Zn micro-galvanic cells react slowly, and the local heat generated is small, which delays the arrival of the peak of hydrogen production rate and prolongs the reaction time.
(4) Compared with the 2 wt,% Zn sample, the single GB phase area and the number of GB in 3 wt.% alloy have not changed much, but the appearance of more Al-Zn micro-galvanic cells has increased the local temperature and accelerated the reaction.
(5) When the Zn doping amount reaches 4 wt.% or 5 wt.%, the area and number of GB phases continue to decrease rapidly. The need for higher activation energy means a higher reaction temperature.
In the present work, the mechanisms used to explain the effect of Zn on hydrogen production can be summarized as follows:
(1) The GB phase includes all the eutectic compounds among the grain boundary elements. This is identified to be a key factor that determines whether the Al hydrolysis reaction can proceed. While protecting Al from oxidation, the GB phase can provide a transmission channel to make it easier for Al to enter the reaction site. According to EDX data (Table 2), the GB phase contains a large amount of Al, when the sample is contacted by water, this part of Al first reacts with water. The decrease of the Al concentration will drive other Al molecules from the grains into the GB phase, and make the reaction continue. The addition of Zn will change the composition of the GB phase from Ga-In-Sn to Ga-In-Sn-Zn, which will affect the eutectic temperature and hydrolysis reaction. A small part of In3Sn was replaced by Zn, which will help increase the relative content of Ga in Ga-In-Sn.and make the mass ratio of the three elements in the raw material close to the eutectic point, but as more low-melting metals (In and Sn) are replaced by Zn (more than 1 wt.%), this will lead to a gradual increase in eutectic temperature.
(2) During the hydrolysis reaction, Al will form micro-galvanic cells with Zn. The release of hydrogen through this electrolytic form is relatively slow, but the heat released helps the hydrolysis reaction. In the alloys, the appearance of the Al-Zn solution and simple substance of Zn will aggravate the formation of micro-galvanic cells. Therefore, with increasing temperature, this variable of hydrogen generation rate is greater for Zn-containing alloys than Zn-free ones.
5. Conclusions
A set of Al-Ga-In3Sn-Zn alloys was prepared. Through experiments and discussions, the hypothesis that Zn will change the hydrogen production performance of the alloy by entering the GB phase was verified, and it was found that the reaction mechanism cannot only be explained by the eutectic reaction of the GB phase and Al. We can draw the following conclusions:
(1) Zn-doped alloys mainly contain Al (Ga) solid solution, the intermetallic compound In3Sn, with a high probability of Al (Zn) solid solution. In addition, particles with high Zn content will appear in high-Zn alloys.
(2) In addition to grain size and segregation, the composition of the hydrogen-producing alloy also affects the change in activation energy.
(3) As Zn doping amount increases, the maximum hydrogen production rate always increases first and then decreases. At the same temperature, the reaction time of alloys with high Zn content is longer. At a moderate temperature, Al-Ga-In3Sn-(3 wt.%)-Zn not only has good hydrogen production performance, but also has high activation energy, which is conducive to its long-term storage and transportation.
(4) The present work indicates that the alloy hydrolysis reaction is promoted by the GB phase and the Al–Zn micro-galvanic cells.
Author Contributions
Writing—original draft, D.L.; writing—review and editing, Q.G.; formal analysis, D.L.; conceptualization, Q.G.; data curation, Q.A., H.W. and D.L.; investigation, D.L.; resources, J.W.; project administration, C.W. and Q.G. All authors have read and agreed to the published version of the manuscript.
Funding
Financial support for this work was provided by the Industrial Innovation Special Fund Project of Jilin Province (2017C052-1, 2017C045-1).
Acknowledgments
Authors are grateful to editor and referees.
Conflicts of Interest
The authors declare no conflict of interest.
References
- Ajanovic, A.; Haas, R. Economic prospects and policy framework for hydrogen as fuel in the transport sector. Energy Policy 2018, 123, 280–288. [Google Scholar] [CrossRef]
- Lincoln, S.F. Fossil fuels in the 21st century. Ambio 2005, 34, 621–627. [Google Scholar] [CrossRef] [PubMed]
- Veziroglu, T.N. 21st century's energy: Hydrogen energy system. In Assessment of Hydrogen Energy for Sustainable Development; Sheffield, J.W., Sheffield, C., Eds.; Springer: Dordrecht, The Netherlands, 2007; pp. 9–31. [Google Scholar] [CrossRef]
- Chi, J.; Yu, H.M. Water electrolysis based on renewable energy for hydrogen production. Chin. J. Catal. 2018, 39, 390–394. [Google Scholar] [CrossRef]
- Secer, A.; Kucet, N.; Faki, E.; Hasanoglu, A. Comparison of co-gasification efficiencies of coal, lignocellulosic biomass and biomass hydrolysate for high yield hydrogen production. Int. J. Hydrogen Energy 2018, 43, 21269–21278. [Google Scholar] [CrossRef]
- Demirbas, A. Comparison of thermochemical conversion processes of biomass to hydrogen-rich gas mixtures. Energy Sources A Recovery Util. Environ. Eff. 2016, 38, 2971–2976. [Google Scholar] [CrossRef]
- Yuan, B.; Tan, S.; Liu, J. Dynamic hydrogen generation phenomenon of aluminum fed liquid phase Ga–In alloy inside NaOH electrolyte. Int. J. Hydrogen Energy 2016, 41, 1453–1459. [Google Scholar] [CrossRef]
- Xu, S.; Liu, J. Metal-based direct hydrogen generation as unconventional high density energy. Front. Energy 2018, 13, 27–53. [Google Scholar] [CrossRef]
- Yang, B.; Zhu, J.; Jiang, T.; Gou, Y.; Hou, X.; Pan, B. Effect of heat treatment on Al Mg Ga In Sn alloy for hydrogen generation through hydrolysis reaction. Int. J. Hydrogen Energy 2017, 42, 24393–24403. [Google Scholar] [CrossRef]
- Wang, Y.-Q.; Gai, W.-Z.; Zhang, X.-Y.; Pan, H.-Y.; Cheng, Z.; Xu, P.; Deng, Z.-Y. Effect of storage environment on hydrogen generation by the reaction of Al with water. RSC Adv. 2017, 7, 2103–2109. [Google Scholar] [CrossRef] [Green Version]
- Tekade, S.P.; Pednekar, A.S.; Jadhav, G.R.; Kalekar, S.E.; Shende, D.Z.; Wasewar, K.L. Hydrogen generation through water splitting reaction using waste aluminum in presence of gallium. Int. J. Hydrogen Energy 2019. [Google Scholar] [CrossRef]
- Guan, X.; Zhou, Z.; Luo, P.; Wu, F.; Dong, S. Effects of preparation method on the hydrolytic hydrogen production performance of Al-rich alloys. J. Alloys Compd. 2019, 796, 210–220. [Google Scholar] [CrossRef]
- Guan, X.; Zhou, Z.; Luo, P.; Wu, F.; Dong, S. Hydrogen generation from the reaction of Al-based composites activated by low-melting-point metals/oxides/salts with water. Energy 2019, 188. [Google Scholar] [CrossRef]
- Yu, M.; Kim, M.; Yoon, B.; Oh, S.; Nam, D.-H.; Kwon, H. Carbon nanotubes/aluminum composite as a hydrogen source for PEMFC. Int. J. Hydrogen Energy 2014, 39, 19416–19423. [Google Scholar] [CrossRef]
- Liu, Y.; An, J.C.; Jin, W.Z.; Cui, J.; Zhang, W. Insight into the effect of In addition on hydrogen generation behavior and hydrolysis mechanism of Al-based ternary alloys in distilled water—A new active Al-Ga-In hydrolysis hydrogen generation alloy. Int. J. Energy Res. 2019, 43, 8973–8984. [Google Scholar] [CrossRef]
- Godart, P.; Fischman, J.; Seto, K.; Hart, D. Hydrogen production from aluminum-water reactions subject to varied pressures and temperatures. Int. J. Hydrogen Energy 2019, 44, 11448–11458. [Google Scholar] [CrossRef]
- Xu, S.; Zhao, X.; Liu, J. Liquid metal activated aluminum-water reaction for direct hydrogen generation at room temperature. Renew. Sustain. Energy Rev. 2018, 92, 17–37. [Google Scholar] [CrossRef]
- Yang, W.; Zhang, T.; Zhou, J.; Shi, W.; Liu, J.; Cen, K. Experimental study on the effect of low melting point metal additives on hydrogen production in the aluminum–water reaction. Energy 2015, 88, 537–543. [Google Scholar] [CrossRef]
- Wang, W.; Zhao, X.M.; Chen, D.M.; Yang, K. Insight into the reactivity of Al–Ga–In–Sn alloy with water. Int. J. Hydrogen Energy 2012, 37, 2187–2194. [Google Scholar] [CrossRef]
- He, T.; Xiong, Y.; Du, S.; Yuan, Z.; Liang, X.; Huttula, M.; Cao, W. Impact of Li Addition in Al-Rich Alloys on Hydrogen Production in Water. J. Mater. Eng. Perform. 2019, 28, 2459–2464. [Google Scholar] [CrossRef]
- Qiao, D.; Lu, Y.; Tang, Z.; Fan, X.; Wang, T.; Li, T.; Liaw, P.K. The superior hydrogen-generation performance of multi-component Al alloys by the hydrolysis reaction. Int. J. Hydrogen Energy 2019, 44, 3527–3537. [Google Scholar] [CrossRef]
- Wang, F.-Q.; Wang, H.-H.; Wang, J.; Lu, J.; Luo, P.; Chang, Y.; Ma, X.-G.; Dong, S.-J. Effects of low melting point metals (Ga, In, Sn) on hydrolysis properties of aluminum alloys. Trans. Nonferrous Met. Soc. China 2016, 26, 152–159. [Google Scholar] [CrossRef]
- An, Q.; Hu, H.; Li, N.; Liu, D.; Xu, S.; Liu, Z.; Wei, C.; Luo, F.; Xia, M.; Gao, Q. Effects of Bi composition on microstructure and Al-water reactivity of Al-rich alloys with low-In. Int. J. Hydrogen Energy 2018, 43, 10887–10895. [Google Scholar] [CrossRef]
- An, Q.; Hu, H.; Li, N.; Wei, J.; Wei, C.; Wang, H.; Woodall, J.M.; Gao, Q. Strategies for improving flow rate control of hydrogen generated by Al-rich alloys for on-board applications. Int. J. Hydrogen Energy 2019, 44, 27695–27703. [Google Scholar] [CrossRef]
- Wang, H.; Xie, Z.; Chen, C.; Xu, Z.; Dong, S. Ti promotes the reaction of Al alloy with water to rapidly generate hydrogen. Mater. Res. Express 2019, 6. [Google Scholar] [CrossRef]
- Wei, C.; Liu, Z.; Wei, J.; Liu, D.; Xu, S.; An, Q.; Xu, S.; Wang, H.; Gao, Q. Effect of alumina on the microstructure and hydrogen production of Al-riched bulk alloys. Chem. Phys. Lett. 2020, 738. [Google Scholar] [CrossRef]
- Xie, Z.; Dong, S.; Luo, P.; Wang, H. Enhanced Hydrogen Generation Properties of Al-Ga-In-Sn Alloy in Reaction with Water by Trace Amount of AlTi5B Additives. Mater. Trans. 2017, 58, 724–727. [Google Scholar] [CrossRef] [Green Version]
- He, T.; Chen, W.; Wang, W.; Ren, F.; Stock, H.-R. Effect of different Cu contents on the microstructure and hydrogen production of Al–Cu-Ga-In-Sn alloys for dissolvable materials. J. Alloys Compd. 2020, 821. [Google Scholar] [CrossRef]
- Huang, T.; Gao, Q.; Liu, D.; Xu, S.; Guo, C.; Zou, J.; Wei, C. Preparation of Al-Ga-In-Sn-Bi quinary alloy and its hydrogen production via water splitting. Int. J. Hydrogen Energy 2015, 40, 2354–2362. [Google Scholar] [CrossRef]
- Wang, W.; Chen, D.M.; Yang, K. Investigation on microstructure and hydrogen generation performance of Al-rich alloys. Int. J. Hydrogen Energy 2010, 35, 12011–12019. [Google Scholar] [CrossRef]
- He, T.T.; Wang, W.; Chen, W.; Chen, D.M.; Yang, K. Influence of In and Sn compositions on the reactivity of Al–Ga–In–Sn alloys with water. Int. J. Hydrogen Energy 2017, 42, 5627–5637. [Google Scholar] [CrossRef]
- Du, B.D.; Wang, W.; Chen, W.; Chen, D.M.; Yang, K. Grain refinement and Al-water reactivity of Al Ga In Sn alloys. Int. J. Hydrogen Energy 2017, 42, 21586–21596. [Google Scholar] [CrossRef]
- Kirchheim, R. Grain coarsening inhibited by solute segregation. Acta Mater. 2002, 50, 413–419. [Google Scholar] [CrossRef]
- Dillon, S.J.; Tang, M.; Carter, W.C.; Harmer, M.P. Complexion: A new concept for kinetic engineering in materials science. Acta Mater. 2007, 55, 6208–6218. [Google Scholar] [CrossRef]
- Ahadi, A.; Kalidindi, A.R.; Sakurai, J.; Matsushita, Y.; Tsuchiya, K.; Schuh, C.A. The role of W on the thermal stability of nanocrystalline NiTiWx thin films. Acta Mater. 2018, 142, 181–192. [Google Scholar] [CrossRef]
- Ziebarth, J.T.; Woodall, J.M.; Kramer, R.A.; Choi, G. Liquid phase-enabled reaction of Al–Ga and Al–Ga–In–Sn alloys with water. Int. J. Hydrogen Energy 2011, 36, 5271–5279. [Google Scholar] [CrossRef]
- Wei, C.; Liu, D.; Xu, S.; Cui, T.; An, Q.; Liu, Z.; Gao, Q. Effects of Cu additives on the hydrogen generation performance of Al-rich alloys. J. Alloys Compd. 2018, 738, 105–110. [Google Scholar] [CrossRef]
- Li, L.; Liu, H.; Yan, Y.; Zhu, H.; Fang, H.; Luo, X.; Dai, Y.; Yu, K. Effects of alloying elements on the electrochemical behaviors of Al-Mg-Ga-In based anode alloys. Int. J. Hydrogen Energy 2019, 44, 12073–12084. [Google Scholar] [CrossRef]
Figure 1.
Hydrogen yields of the Al-Ga-In3Sn-Zn alloys at temperatures of 40 °C.

Figure 2.
Hydrogen generation rates of the Al-Ga-In3Sn-Zn alloys at temperatures of (a) 40 °C, (b) 50 °C, (c) 60 °C.
Figure 2.
Hydrogen generation rates of the Al-Ga-In3Sn-Zn alloys at temperatures of (a) 40 °C, (b) 50 °C, (c) 60 °C.


Figure 3.
XRD patterns of the remnant alloys.

Figure 4.
SEM images of Al-rich alloys containing (a) 0 wt.% Zn, (b) 1 wt.% Zn, (c) 2 wt.% Zn, (d) 3 wt.% Zn, (e) 4 wt.% Zn, and (f) 5 wt.% Zn.
Figure 4.
SEM images of Al-rich alloys containing (a) 0 wt.% Zn, (b) 1 wt.% Zn, (c) 2 wt.% Zn, (d) 3 wt.% Zn, (e) 4 wt.% Zn, and (f) 5 wt.% Zn.

Figure 5.
Area ratio of GB particles to the total area and GB area versus Zn contents. Inset shows the GB particle numbers versus Zn content.
Figure 5.
Area ratio of GB particles to the total area and GB area versus Zn contents. Inset shows the GB particle numbers versus Zn content.

Figure 6.
SEM images from fracture surface of Al-rich alloys, (a) 0 wt.% Zn, (b) 1 wt.% Zn, (c) 3 wt.% Zn and (e) 5 wt.% Zn; (d) EDX mapping scan spectrum of (b); (f) typical EDX mapping of Zone 9.
Figure 6.
SEM images from fracture surface of Al-rich alloys, (a) 0 wt.% Zn, (b) 1 wt.% Zn, (c) 3 wt.% Zn and (e) 5 wt.% Zn; (d) EDX mapping scan spectrum of (b); (f) typical EDX mapping of Zone 9.

Figure 7.
DSC curves of the Al-Ga-In3Sn-Zn alloys tested by heating cycles.

Figure 8.
DSC curves of the Al-Ga-In3Sn-Zn alloys tested by cooling cycles.

Figure 9.
The activation energy versus Zn content.

Figure 10.
Arrhenius plots for the isothermal reaction of alloy hydrolysis.

Figure 11.
Statistics on hydrogen production time of Al alloys at 40 ° C.

Figure 12.
Maximum generation rate versus Zn content.


Table 1.
Compositions of prepared alloys ( wt.%).
| No. | Al | Ga | In | Sn | Zn |
|---|---|---|---|---|---|
| 1 | 90 | 2.5 | 5.58 | 1.92 | 0 |
| 2 | 90 | 2.5 | 4.83 | 1.67 | 1 |
| 3 | 90 | 2.5 | 4.09 | 1.41 | 2 |
| 4 | 90 | 2.5 | 3.35 | 1.15 | 3 |
| 5 | 90 | 2.5 | 2.60 | 0.90 | 4 |
| 6 | 90 | 2.5 | 1.86 | 0.64 | 5 |
Table 2.
Composition of the Al-Ga-In3Sn-Zn alloys (In brackets are the data after oxygen removal).
| Zone | Phase | Element (at.%) | |||||
|---|---|---|---|---|---|---|---|
| Al | Ga | In | Sn | Zn | O | ||
| 1 | G | 47.44(98.18) | 0.72(1.49) | 0.08(0.17) | 0.08(0.17) | - | 51.68 |
| 2 | GB | 12.81(32.65) | 0.82(2.09) | 19.22(48.98) | 6.39(16.28) | - | 60.76 |
| 3 | G | 38.90(97.71) | 0.55(1.38) | 0.08(0.20) | 0.11(0.28) | 0.16(0.40) | 60.19 |
| 4 | GB | 11.82(22.38) | 1.27(2.40) | 30.02(56.83) | 9.50(17.99) | 0.22(0.42) | 47.18 |
| 5 | G | 47.40(97.15) | 0.57(1.17) | 0.28(0.57) | 0.06(0.12) | 0.47(0.96) | 51.21 |
| 6 | GB | 13.96(20.03) | 1.67(2.40) | 43.72(62.74) | 9.42(13.52) | 0.91(1.31) | 30.32 |
| 7 | G | 68.46(95.99) | 1.13(1.58) | 0.17(0.24) | 0.02(0.03) | 1.54(2.16) | 28.68 |
| 8 | GB | 3.09(3.58) | 3.14(3.64) | 61.03(70.78) | 18.24(21.15) | 0.73(0.85) | 13.77 |
| 9 | High-Zn region | 4.71(4.85) | 0.58(0.60) | - | 0.20(0.21) | 91.70(94.37) | 2.83 |
© 2020 by the authors. Licensee MDPI, Basel, Switzerland. This article is an open access article distributed under the terms and conditions of the Creative Commons Attribution (CC BY) license (http://creativecommons.org/licenses/by/4.0/).
Share and Cite
MDPI and ACS Style
Liu, D.; Gao, Q.; An, Q.; Wang, H.; Wei, J.; Wei, C. Experimental Study on Zn-Doped Al-Rich Alloys for Fast on-Board Hydrogen Production. Crystals 2020, 10, 167. https://doi.org/10.3390/cryst10030167
AMA Style
Liu D, Gao Q, An Q, Wang H, Wei J, Wei C. Experimental Study on Zn-Doped Al-Rich Alloys for Fast on-Board Hydrogen Production. Crystals. 2020; 10(3):167. https://doi.org/10.3390/cryst10030167
Chicago/Turabian StyleLiu, Dan, Qian Gao, Qi An, Hongchao Wang, Jilun Wei, and Cundi Wei. 2020. "Experimental Study on Zn-Doped Al-Rich Alloys for Fast on-Board Hydrogen Production" Crystals 10, no. 3: 167. https://doi.org/10.3390/cryst10030167
Note that from the first issue of 2016, this journal uses article numbers instead of page numbers. See further details here.