the Creative Commons Attribution 4.0 License.
the Creative Commons Attribution 4.0 License.
 | 26 Mar 2019
Autonomous seawater pCO2 and pH time series from 40 surface buoys and the emergence of anthropogenic trends
Adrienne J. Sutton
Richard A. Feely
Stacy Maenner-Jones
Sylvia Musielwicz
John Osborne
Colin Dietrich
Natalie Monacci
Jessica Cross
Randy Bott
Alex Kozyr
Andreas J. Andersson
Nicholas R. Bates
Wei-Jun Cai
Meghan F. Cronin
Eric H. De Carlo
Burke Hales
Stephan D. Howden
Charity M. Lee
Derek P. Manzello
Michael J. McPhaden
Melissa Meléndez
John B. Mickett
Jan A. Newton
Scott E. Noakes
Jae Hoon Noh
Solveig R. Olafsdottir
Joseph E. Salisbury
Uwe Send
Thomas W. Trull
Douglas C. Vandemark
Robert A. Weller
Ship-based time series, some now approaching over 3 decades long, are critical climate records that have dramatically improved our ability to characterize natural and anthropogenic drivers of ocean carbon dioxide (CO2) uptake and biogeochemical processes. Advancements in autonomous marine carbon sensors and technologies over the last 2 decades have led to the expansion of observations at fixed time series sites, thereby improving the capability of characterizing sub-seasonal variability in the ocean. Here, we present a data product of 40 individual autonomous moored surface ocean pCO2 (partial pressure of CO2) time series established between 2004 and 2013, 17 also include autonomous pH measurements. These time series characterize a wide range of surface ocean carbonate conditions in different oceanic (17 sites), coastal (13 sites), and coral reef (10 sites) regimes. A time of trend emergence (ToE) methodology applied to the time series that exhibit well-constrained daily to interannual variability and an estimate of decadal variability indicates that the length of sustained observations necessary to detect statistically significant anthropogenic trends varies by marine environment. The ToE estimates for seawater pCO2 and pH range from 8 to 15 years at the open ocean sites, 16 to 41 years at the coastal sites, and 9 to 22 years at the coral reef sites. Only two open ocean pCO2 time series, Woods Hole Oceanographic Institution Hawaii Ocean Time-series Station (WHOTS) in the subtropical North Pacific and Stratus in the South Pacific gyre, have been deployed longer than the estimated trend detection time and, for these, deseasoned monthly means show estimated anthropogenic trends of 1.9±0.3 and 1.6±0.3 µatm yr−1, respectively. In the future, it is possible that updates to this product will allow for the estimation of anthropogenic trends at more sites; however, the product currently provides a valuable tool in an accessible format for evaluating climatology and natural variability of surface ocean carbonate chemistry in a variety of regions. Data are available at https://doi.org/10.7289/V5DB8043 and https://www.nodc.noaa.gov/ocads/oceans/Moorings/ndp097.html (Sutton et al., 2018).
- Article
(909 KB) - Full-text XML
- BibTeX
- EndNote


Biogeochemical cycling leads to remarkable temporal and spatial variability of carbon in the mixed layer of the global ocean and particularly in coastal seas. The ocean carbon cycle, specifically surface ocean CO2–carbonate chemistry, is primarily influenced by local physical conditions and biological processes, basin-wide circulation patterns, and fluxes between the ocean and land/atmosphere. Since the industrial period, increasing atmospheric CO2 has been an additional forcing on ocean biogeochemistry, with the ocean absorbing roughly 30 % of anthropogenic CO2 (Khatiwala et al., 2013; Le Quéré et al., 2018). The resulting decrease of the seawater pH and carbonate ion concentration, referred to as ocean acidification, has the potential to impact marine life such as calcifying organisms (Bednaršek et al., 2017b; Chan and Connolly, 2013; Davis et al., 2017; Fabricius et al., 2011; Gattuso et al., 2015). Shellfish, shallow-water tropical corals, and calcareous plankton are a few examples of economically and ecologically important marine calcifiers potentially affected by ocean acidification.
Open ocean observations have shown that the inorganic carbon chemistry of the surface ocean is changing globally at a mean rate consistent with atmospheric CO2 increases of approximately 2.0 µatm yr−1 (Bates et al., 2014; Takahashi et al., 2009; Wanninkhof et al., 2013). However, natural and anthropogenic processes can magnify temporal and spatial variability in some regions, especially coastal systems through eutrophication, freshwater input, exchange with tidal wetlands and the sea floor, seasonal biological productivity, and coastal upwelling (Bauer et al., 2013). This enhanced variability can complicate and at times obscure detection and attribution of longer-scale ocean carbon changes. There are also processes that can act in the opposite direction; for example, riverine and estuarine sources of alkalinity increase the buffering capacity of coastal waters and reduce the variability of other carbon parameters.
Efforts to observe and predict the impact of ocean acidification on marine ecosystems must be integrated with an understanding of both the natural and anthropogenic processes that control the ocean carbonate system. Marine organisms experience highly heterogeneous seawater carbonate chemistry conditions, and it is unclear what exact conditions in the natural environment will lead to physiological responses (Hofmann et al., 2010). However, responses associated with exposure to corrosive carbonate conditions such as low values of the aragonite saturation state (Ωaragonite) have been observed (e.g., Barton et al., 2012, 2015; Bednaršek et al., 2014, 2016, 2017a; Reum et al., 2015). Observations show that present-day surface seawater pH and Ωaragonite conditions throughout most of the open ocean exceed the natural range of preindustrial variability, and in some coastal ecosystems known biological thresholds for shellfish larvae are exceeded during certain times of the seasonal cycle (Sutton et al., 2016). Are these present-day conditions significantly impacting marine life in the natural environment? How will the intensity, frequency, and duration of corrosive carbonate conditions change as surface seawater pH and Ωaragonite continue to decline and influence other processes of the biogeochemical cycle in the coastal zone? Paired chemical and biological observations at timescales relevant to biological processes, such as food availability, seasonal spawning, larval growth, and recruitment, are one tool for identifying and tracking the response of marine life to ocean acidification.
Long-term, sustained time-series observations resolving diurnal to seasonal conditions encompass many timescales relevant to biological processes and can help to characterize both natural variability and anthropogenic change in ocean carbon. Fixed time-series observations fill a unique niche in ocean observing as they can serve as sites of multidisciplinary observations and process studies, high-quality reference stations for validating and assessing satellite measurements and Earth system models, and test beds for developing and evaluating new ocean sensing technology. If of sufficient length and measurement quality to detect the anthropogenic signal above the noise (i.e., in this case the natural variability of the ocean carbon system), these observations can also serve as critical climate records.
Here, we introduce time-series data from 40 moored stations in open ocean, coastal, and coral reef environments. These time series include 3-hourly autonomous measurements of surface seawater temperature (SST), salinity (SSS), mole fraction of atmospheric CO2 (xCO2), partial pressure of atmospheric and seawater CO2 (pCO2), and seawater pH. This data product was developed to provide easy access to uninterrupted time series of high-quality pCO2 and pH data for those who do not require the detailed deployment-level information archived at the National Centers for Environmental Information (NCEI; https://www.nodc.noaa.gov/ocads/oceans/time_series_moorings.html, last access: 11 March 2019).
We also present an overview of the seasonal variability to long-term trends revealed in the pCO2 and pH observations, as well as an estimate of the length of time series required to detect an anthropogenic signal at each location. We use a statistical method described by Tiao et al. (1990) and further applied to environmental data by Weatherhead et al. (1998) to estimate the number of years of observations needed to detect a statistically significant trend over variability, which we refer to here as time of emergence (ToE). An input required in this statistical model is an estimate of the trend. We adopt a trend in seawater pCO2 of 2 µatm yr−1, which assumes surface seawater changes track the current rate of globally averaged atmospheric CO2 increase. This assumption allows for the comparison of the trend-to-variance pattern across the network of 40 time series locations. The ToE methodology does not allow for the identification of actual long-term trends that may be different from 2 µatm yr−1 due to other long-term changes in, for example, biological production/respiration or coastal carbon sources/sinks. Nor does it address the point in time at which a system may cross the envelope of preindustrial variability or biological thresholds (e.g., Pacella et al., 2018; Sutton et al., 2016). It indicates the time at which the imposed signal of 2 µatm yr−1 emerges from the variance, and not necessarily when the actual anthropogenic signal may emerge or when organisms may be impacted.
Another caveat of this methodology is that the results apply to present-day conditions, and these estimates will change as the time series lengthen due to continued anthropogenic forcing. For example, even if using seasonally detrended monthly anomalies (i.e., when the mean seasonality of ocean carbonate chemistry is accounted for), magnification of the seasonal amplitude of pCO2 due to warming, reduction in buffering capacity, and/or other carbon cycle feedbacks could add variance to the monthly anomalies, resulting in increased detection time (Kwiatkowski and Orr, 2018; Landschützer et al., 2018). Changes in circulation, stratification, and meltwater inputs in the Arctic cryosphere due to anthropogenic warming could also influence these estimates over time. For regions where the drivers of anthropogenic forcing and natural variability are well constrained, the methodology could be modified to provide more accurate estimates of trend detection time. However, ToE estimates presented here use monthly anomalies of present-day observations and a fixed anthropogenic pCO2 trend of 2 µatm yr−1 to compare the trend-to-variance patterns across the network of 40 moored time series. These estimates provide a starting point for trend calculations using this data product.
2.1 Site and sensor description
The 40 fixed time series stations are located in the Pacific (29), Atlantic (9), Indian (1), and Southern (1) ocean basins in open ocean (17), coastal (13), and coral reef (10) ecosystems (Table 1; Fig. 1). All surface ocean pCO2 and pH time series were established between 2004 and 2013. Thirty-three of these stations are active, whereas three have been moved to nearby locations better representing regional biogeochemical processes and four have been discontinued due to the lack of sustained funding. The range of support and partnerships for maintaining these moored time series is extensive (see Acknowledgements for details). Many of these 40 moored time series stations also make physical oceanographic and marine boundary layer meteorological measurements, and subsequently enable multi-disciplinary studies involving carbon cycle dynamics.
Table 1Region, coordinates, surface ocean carbon parameters measured, year carbon time series established, and current status of the 40 fixed moored time series stations. All time series also include atmospheric CO2, SST, and SSS.
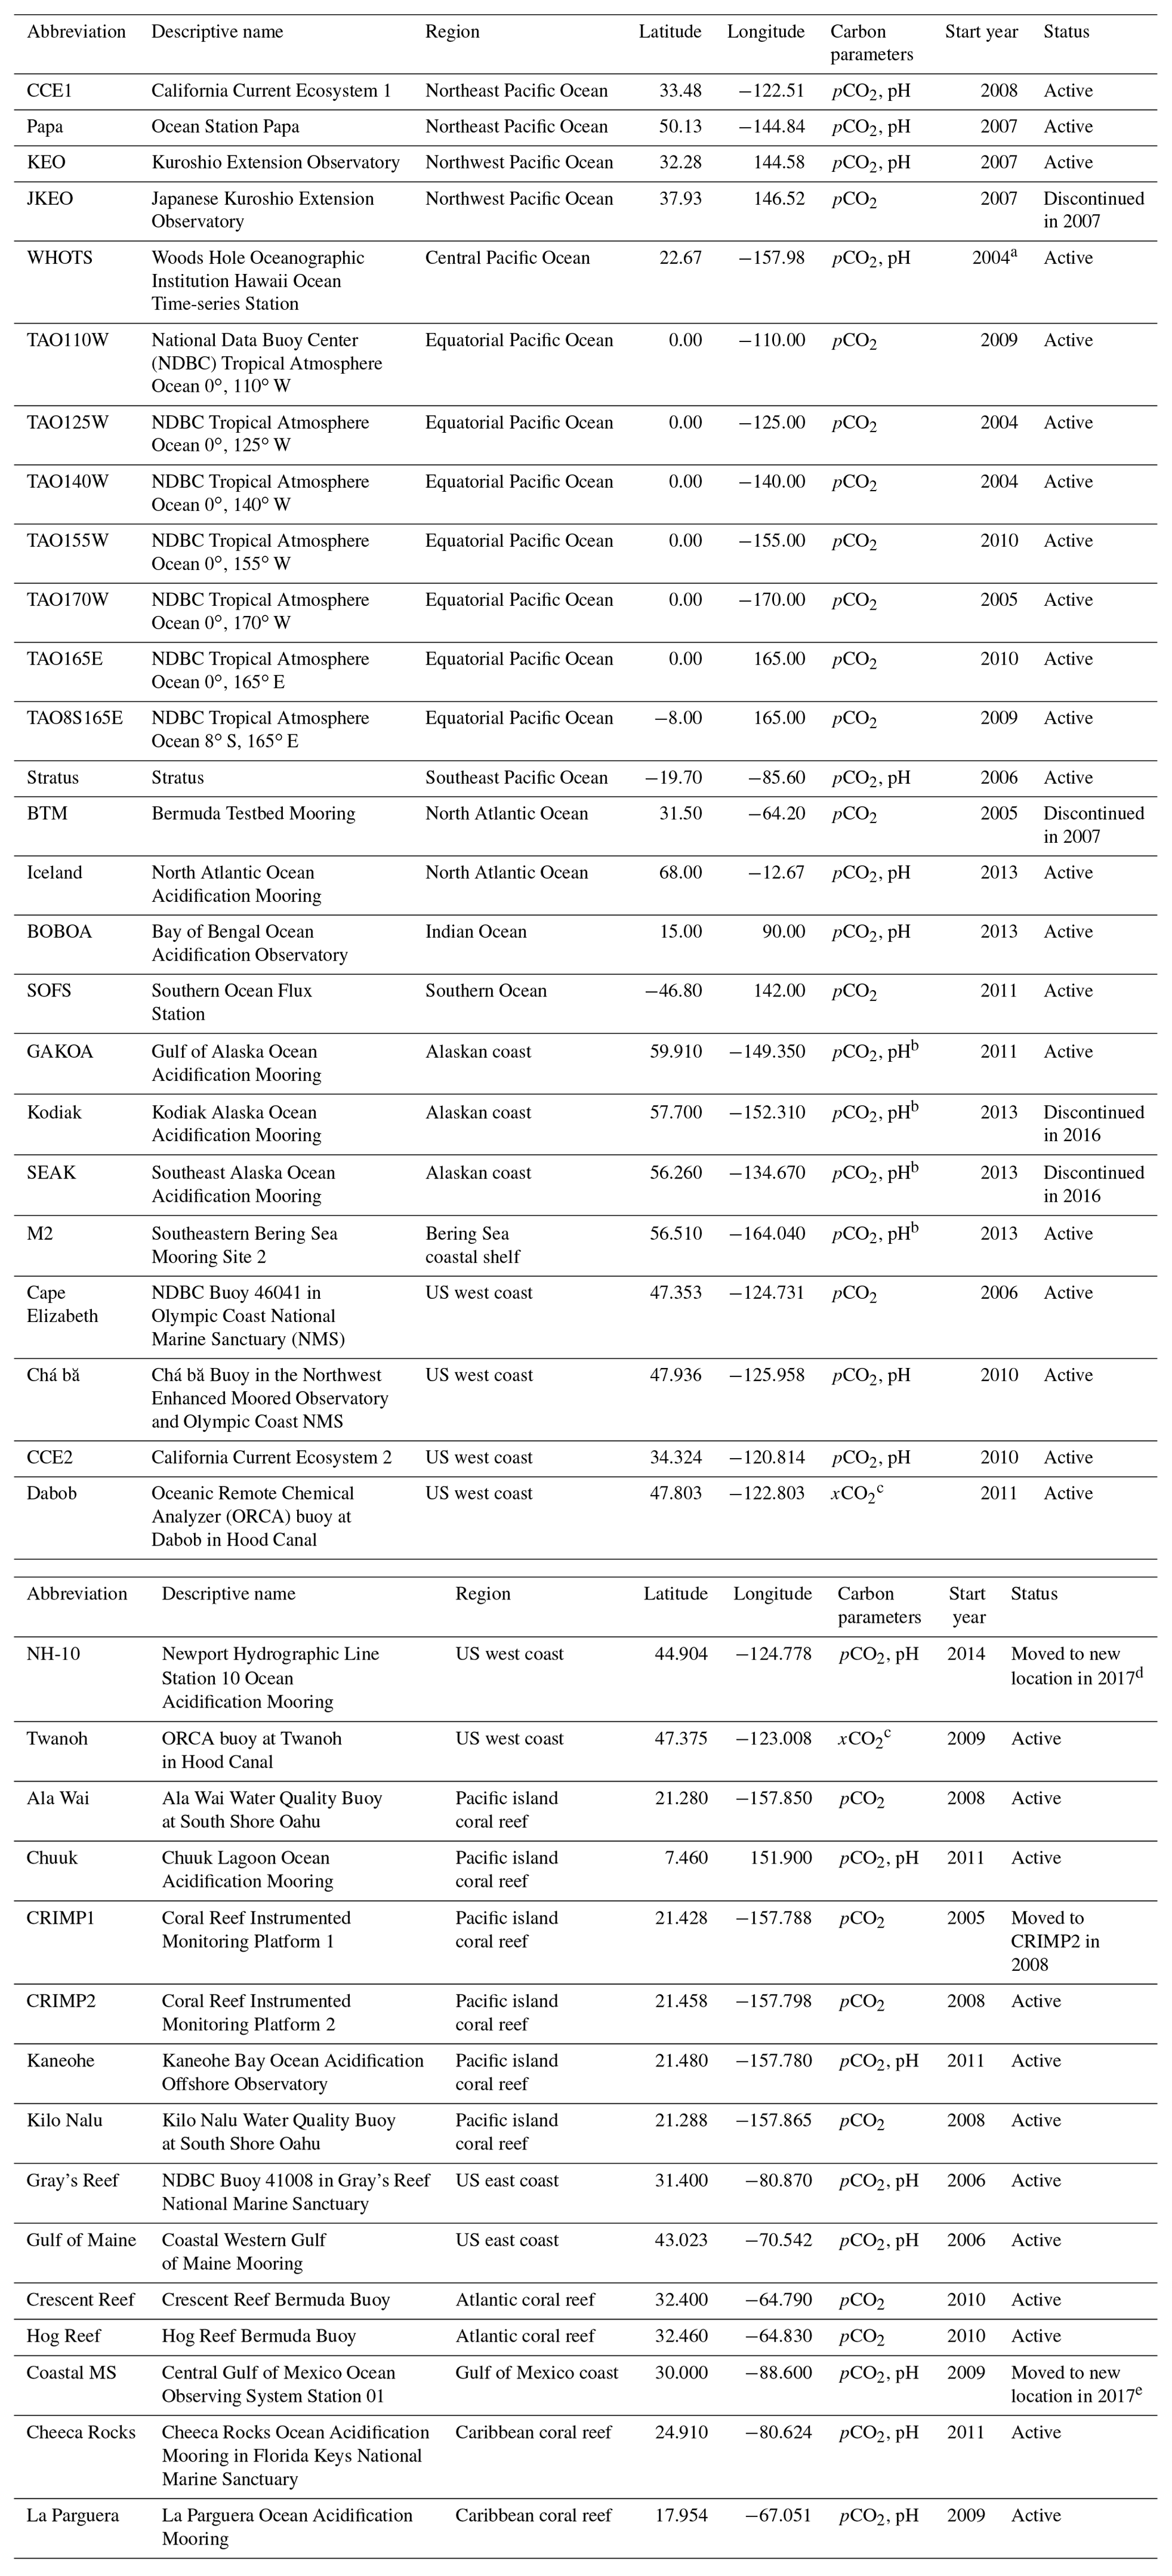
Notes: a data from December 2004 to July 2007 in the WHOTS time series are from the Multi-disciplinary Ocean Sensors for Environmental Analyses and Networks (MOSEAN) station at 22.80∘ N, 158.10∘ W (20 km from the WHOTS location). Previous studies have shown that the MOSEAN and WHOTS locations have similar surface seawater pCO2 conditions (Sutton et al., 2014b, 2017); therefore, they are combined in this data product as one time series location. b Measurements of pH to be included in future updates of the time series data product. c SST and SSS data are collected on the Dabob and Twanoh buoys at 2-hourly intervals. Because combining these data with the 3-hourly MAPCO2 data requires making assumptions about temporal variability that reflect the research interests of the data user, only the direct measurements of CO2 (i.e., the mole fraction of CO2 in equilibrium with surface seawater – xCO2) are available in the NCEI archived data sets. d The NH-10 buoy and carbon sensors were moved approximately 75 nmi south to Cape Arago, Oregon, following establishment of an Ocean Observatories Initiative buoy at NH-10 with redundant pCO2 and pH sensors: https://www.pmel.noaa.gov/co2/story/CB-06 (last access: 11 March 2019). e The Coastal MS buoy and carbon sensors were moved approximately 115 nmi southwest to coastal Louisiana waters: https://www.pmel.noaa.gov/co2/story/Coastal+LA (last access: 11 March 2019).
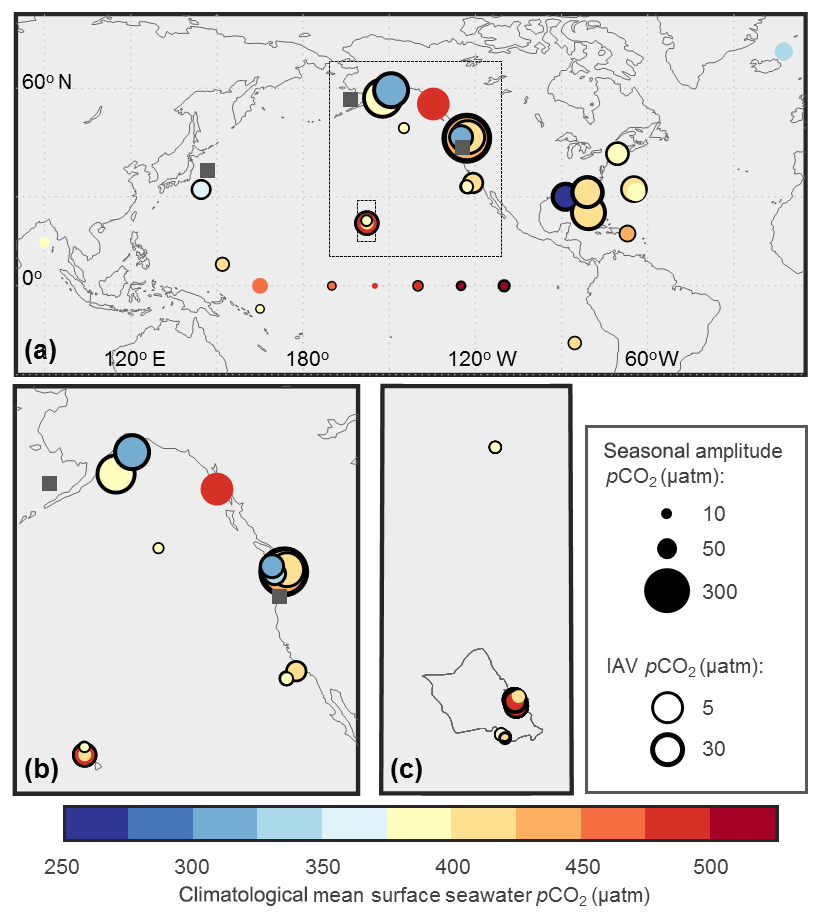
Figure 1Location of (a) 40 moored pCO2 time series with insets enlarged for the (b) US west coast and (c) Hawaiian island of Oahu. Circle color represents climatological mean seawater pCO2 (µatm), size of circle represents seasonal amplitude, and thickness of circle outline represents interannual variability (IAV). Gray squares show the locations of JKEO, M2, and NH-10 where insufficient winter observations prevent the calculation of climatological mean or seasonal amplitude. The IAV is not shown for sites with less than 3 years of observations (Kaneohe, Iceland, BOBOA, SEAK, M2, SOFS, BTM, TAO165E, TAO155W, NH-10, and JKEO). Dabob and Twanoh data shown here are xCO2 (µmol mol−1). Moored time series locations and names are detailed in Table 1.
A Moored Autonomous pCO2 (MAPCO2) system measuring marine boundary layer air at a height of 0.5–1 m and seawater at a depth of <0.5 m is deployed at each fixed time series site (Sutton et al., 2014b). The MAPCO2 systems measure xCO2 in equilibrium with surface seawater using a nondispersive infrared gas analyzer (LI-COR, model LI-820) calibrated prior to each measurement with a reference gas traceable to World Meteorological Organization standards. Seawater xCO2 equilibration occurs by cycling a closed loop of air through a floating bubble equilibrator at the sea surface for 10 min, which is described in detail by Sutton et al. (2014b). Each time series site has either a Sea-Bird Electronics (SBE) 16plus V2 SeaCAT or a SBE 37 MicroCAT deployed at approximately 0.5 m measuring sea surface temperature (SST) and salinity (SSS). These measurements are used to calculate pCO2 and the fugacity of CO2 (fCO2) consistent with standard operating procedures (Dickson et al., 2007; Weiss, 1974). Total estimated uncertainties of the resulting pCO2 measurements are <2 µatm for seawater pCO2 and <1 µatm for air pCO2. For a detailed description of the MAPCO2 methodology, calculations, data reduction, and data quality control, see Sutton et al. (2014b).
In addition to pCO2, SST, and SSS, 17 of the time series also include seawater pH measurements at a depth of 0.5 m (Table 1). These measurements are made by either the spectrophotometric-based Sunburst SAMI-pH sensors (Seidel et al., 2008) or ion sensitive field effect transistor-based SeaFET pH sensors (Bresnahan et al., 2014; Martz et al., 2010). Field-based sensor validation suggests that these sensors (once calibrated and adjusted in the case of the SeaFET) have a total uncertainty of <0.02 in this surface buoy application (Sutton et al., 2016). Data quality control of these pH time series, including calibration, comparison with discrete samples, and assessment of drift due to sensor performance and biofouling, are described in detail by Sutton et al. (2016). All seawater pH data are expressed in the total scale and reported at the in situ SST. At 3-hourly sampling intervals, this configuration of MAPCO2 and the associated sensors is typically deployed for 1 year before recovery, maintenance, and redeployment of the buoy and sensors.
2.2 Data product description
All post-calibrated and quality-controlled data are archived at NCEI: https://www.nodc.noaa.gov/ocads/oceans/time_ series_moorings.html (last access: 11 March 2019). For each site, an annual deployment has data and quality control descriptors at the data archive, including the following: (1) 3-hourly MAPCO2 and associated data, including measured parameters such as xCO2, humidity, and atmospheric pressure so data users can recalculate pCO2 if desired; (2) a data quality flag (QF) log that identifies and describes likely bad (QF = 3) or bad (QF = 4) CO2 and pH data included in the data set; and (3) a metadata file with deployment-level information such as reference gas value and MAPCO2 air value comparisons to the GLOBALVIEW-CO2 marine boundary layer (MBL) product (GLOBALVIEW-CO2, 2013). The reader is referred to Sutton et al. (2014b) for a detailed description of this deployment-level archived information. In addition to data archived at NCEI, these deployment-level mooring data sets are also included in the annual Surface Ocean CO2 Atlas data product (Bakker et al., 2016). Future data management plans include integrating the pCO2 and pH data into OceanSITES, which would provide a single access point to open ocean biogeochemical, physical oceanographic, and marine boundary layer meteorological measurements in a common, self-documented format.
The data product presented here is a compiled and simplified time series developed from these deployment-level archived files. Each fixed moored location has one file with a header including the following basic metadata: (1) data source and contact information; (2) data use request; (3) data product citation; (4) time series name, time range, and coordinates; (5) description of variables; (6) methodology references; and (7) links to deployment-level archived data and metadata at NCEI. Following the header, each fixed moored time series file includes the entire time series of SST, SSS, seawater pCO2, air pCO2, air xCO2, and pH with an associated time stamp.
The time series data product only includes data from the original deployment-level data files assigned QF = 2 (good data). Any missing values or values assigned QF of 3 or 4 in the original deployment-level data are replaced with “NaN” in the time series product. Of the data assigned QF of 2, 3, or 4, the good data (QF = 2) retained in this data product comprise 96% of all seawater xCO2 measurements and 88 % of all seawater pH measurements. Missing or bad SST or SSS data further reduce the quantity of seawater pCO2 values to 85 % compared with the archived deployment-level data. Data users interested in all available xCO2 and pH data should continue to retrieve deployment-level data from the NCEI archive.
Two time-series locations are exceptions to the abovementioned details. Because 3-hourly SST and SSS are not available for the Twanoh and Dabob sites, the data archived at NCEI for these two sites includes xCO2 (dry) air and seawater values but not calculated pCO2. In order to calculate pCO2 for those sites, the data user can incorporate atmospheric pressure, SST, and SSS from other sources. Atmospheric pressure at 3-hourly intervals can be found in the deployment-level archived data files at NCEI. Other data sources, including 2-hourly SST and SSS data at both Twanoh and Dabob, can also be located through the data portal of the Northwest Association of Networked Ocean Observing Systems: http://nvs.nanoos.org/. As interpolating 2-hourly data with the 3-hourly MAPCO2 data requires making assumptions about temporal variability that may differ according to the research interests of the data user, data from these two locations are only available in the deployment-level data files archived at NCEI.
This data product has been developed to provide easier access to quality-assured seawater pCO2 and pH data and broaden the user base of these data. This data product is ideal for modelers interested in using fixed time series data to validate Earth system model output or other data users accustomed to working with ship-based time series data. It also makes the time series more accessible to students, researchers from other disciplines, and marine resource managers who may not have a seawater CO2–carbonate chemistry background or the resources necessary to process and interpret the more detailed deployment-level data.
2.3 Statistical analyses
Descriptive statistics from these time series products are presented here to compare the variability in seawater pCO2 and pH across the 40 locations. Seasonal amplitude is the difference in the mean of all observations during winter and summer. For Northern Hemisphere sites, winter is defined as December, January, and February, and summer is June, July, and August (vice versa for Southern Hemisphere sites).
The climatological mean is derived by averaging means for each of the 12 months over the composite, multiyear time series. Interannual variability (IAV) is presented as the standard deviation of individual yearly means throughout the time series. In the case of missing observations, climatological monthly means are substituted to calculate yearly means for IAV. This approach seeks to minimize the impact of data gaps on the IAV estimates. Because long-term trends in pCO2 and pH are not well constrained at all locations, data are not detrended before calculating the IAV. At Woods Hole Oceanographic Institution Hawaii Ocean Time-series Station (WHOTS), for example, removing a trend of 2 µatm yr−1 changes the IAV estimate by 12 %. Therefore, IAV likely has high uncertainty due to the lack of detrending, data gaps, and the relatively short time series lengths (≤12 years). Future efforts to improve these IAV estimates will be able to rely on future assessment of longer time series (moored or observations from other platforms) and regional models that better characterize all modes of temporal variability.
The seasonal cycle is removed from the data using the approaches described in detail in Bates (2001) and Takahashi et al. (2009). This method results in a time series of seasonally detrended monthly anomalies, which are monthly residuals after removing the climatological monthly means.
When applied to environmental data, ToE is a statistical method that estimates the number of years necessary in a time series to detect an anthropogenic signal over the natural variability. This method has been used to determine ToE from, for example, chlorophyll satellite records (Henson et al., 2010) and ocean biogeochemical models (Lovenduski et al., 2015). ToEts (in years) of each time series is derived using the method of Weatherhead et al. (1998):
where σN and ∅ are the standard deviation and autocorrelation (at lag 1) of monthly anomalies, respectively, and ω0 is the anthropogenic signal of 2 µatm pCO2 or 0.002 pH per year, assuming surface seawater is in equilibrium with the global mean rate of atmospheric CO2 increase. This method results in a 90 % probability (dictated by the factor of 3.3 in Eq. 1) of trend detection by the estimated ToEts at the 95 % confidence interval. Uncertainty in ToEts, uToE, is calculated as follows:
where B is the uncertainty factor calculated using the method of Weatherhead et al. (1998). Uncertainty is based on the number of months (m) in the time series and autocorrelation of monthly anomalies (∅):
With time series lengths of ≤12 years, most of the moored time series characterize diurnal to interannual variability of surface ocean pCO2; however, low-frequency decadal variability may not yet be fully captured. Decadal variability of surface ocean carbon is poorly quantified by observations in general (Keller et al., 2012; McKinley et al., 2011; Schuster and Watson, 2007; Séférian et al., 2013). In the absence of the constraint of decadal variability at each of these locations, we consider an example in the tropical Pacific to estimate the impact of decadal variability on ToEts. For this example, we assume the decadal-scale forcing (i.e., primarily the Pacific Decadal Oscillation; Newman et al., 2016) leads to a 27 % change in CO2 flux in the tropical Pacific (Feely et al., 2006). We take a conservative approach and assume this forcing is driven primarily by decadal changes in surface seawater pCO2 of as much as 15 % and determine the impact that added decadal variability has to the ToE estimates at the seven sites on the Tropical Atmosphere Ocean (TAO) array (McPhaden et al, 1998). This is done by repeating the existing pCO2 time series until the time series length is 50 years and applying a 15 % offset in the data on 10-year intervals at random. This simulated 50-year time series is then used to recalculate ToE. The simulation with added low-frequency decadal signals increases ToE by an average of 40 %, with significant variance across the TAO sites. Decadal forcing has less impact at the eastern Pacific TAO sites where subseasonal to interannual variability controlled by equatorial upwelling, tropical instability waves, and biological productivity is dominant, and more impact in the central and western Pacific where these higher-frequency modes of variability are less pronounced.
Decadal forcing may be particularly strong in the tropical Pacific due to the influence of the Pacific Decadal Oscillation on equatorial upwelling of CO2-rich water (Feely et al., 2006; Sutton et al., 2014a) compared with other subtropical sites (Keller et al., 2012; Landschützer et al., 2016; Lovenduski et al., 2015; Schuster and Watson, 2007). However, we apply this 40 % increase in ToEts to all 40 time series in order to provide a conservative estimate of when an anthropogenic signal can be detected using these moored time series data. The reported ToE for each moored time series is the result from Eq. (1) multiplied by 1.4:
For the data sets with a time series length greater than these ToE estimates, monthly anomalies are linearly regressed against time to determine the long-term rate of change. Linear regression statistics, including uncertainty in rate and r2, are calculated using standard methods described in Glover et al. (2011).
3.1 Climatology and natural variability
Across the 40 moored stations, climatological means of surface ocean pCO2 range from 255 to 490 µatm (Fig. 1). The seasonal amplitude of seawater pCO2 varies from 8 to 337 µatm. With more recent establishment of seawater pH observations, only 10 of the 17 sites with pH sensors have the seasonally distributed pH data necessary to determine the climatological mean and seasonal amplitude. At these 10 locations, the climatological mean and seasonal amplitude of seawater pH vary from 8.00 to 8.21 and 0.01 to 0.14, respectively (Fig. 2). All of the sites with a seasonal amplitude reported in Figs. 1 and 2 have observations distributed across all seasons (Fig. 3). The seasonal amplitude of surface seawater pCO2 is highest at the coastal sites (60 to 337 µatm) compared with the open ocean (8 to 71 µatm) and coral reef sites (11 to 178 µatm). While seasonal pH variation is only constrained at 10 of the 40 sites, these patterns also hold for pH with ranges of 0.08 to 0.14, 0.01 to 0.07, and 0.02 to 0.07 at the coastal, open ocean, and coral sites, respectively.
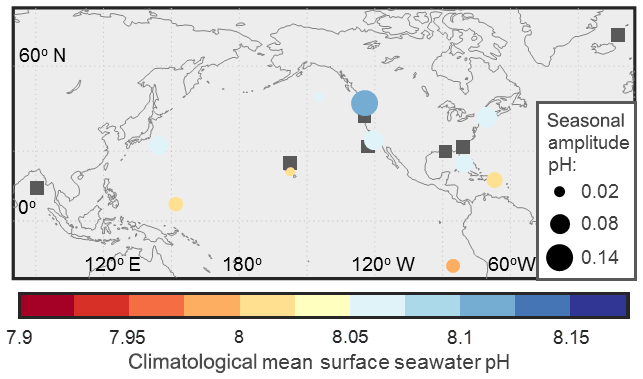
Figure 2Location of 17 moored pH time series. Circle color represents climatological mean seawater pH and size of circle represents seasonal amplitude. Gray squares show the locations of moored pH time series where the lack of seasonal distribution of measurements prevent the calculation of climatological mean or seasonal amplitude. No pH time series are of sufficient length to estimate the IAV as presented for seawater pCO2 in Fig. 1.
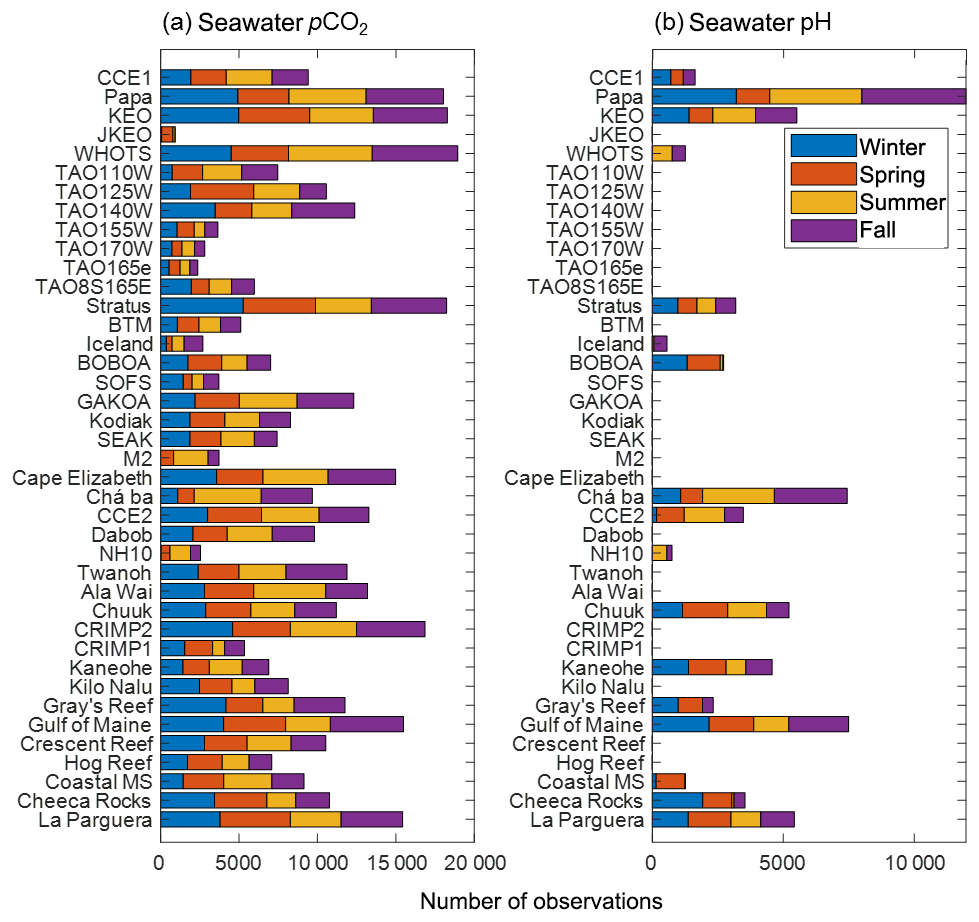
Figure 3Number of surface seawater (a) pCO2 and (b) pH observations by season in each of the 40 moored time series. For Northern Hemisphere sites, winter is defined as December, January, and February; spring is March, April, and May; summer is June, July, and August; and fall is September, October, and November (seasons reversed for Southern Hemisphere sites). The number of observations for Dabob and Twanoh shown here are seawater xCO2.
The IAV of seawater pCO2, which is the standard deviation of yearly means, range from 2 to 29 µatm. The largest IAV is found at the coastal and coral sites with values at Coastal MS, Twanoh, and CRIMP2 of 29, 27, and 25 µatm, respectively. With a large IAV of 25 µatm, CRIMP2 tends to be an anomaly among coral sites, with most tropical coral locations exhibiting an IAV similar to open ocean sites of ≤5 µatm (Fig. 1). Surface seawater pH time series are not yet long enough to determine a robust estimate of IAV.
These descriptive statistics show higher seawater pCO2 values throughout the year in the tropical Pacific where equatorial upwelling of CO2-rich water dominates. Seasonal forcing of pCO2 values in this region is low, but IAV, driven by the El Niño–Southern Oscillation (Feely et al., 2006), is the highest of open ocean time series stations (Fig. 1). The coastal time series stations suggest annual CO2 uptake with climatological means of seawater pCO2 less than atmospheric CO2 levels. Seasonal changes of SST and biological productivity drive the large seasonal amplitudes in pCO2 and pH at the US coastal locations (Fassbender et al., 2018; Reimer et al., 2017; Sutton et al., 2016; Xue et al., 2016). The coastal stations Twanoh and Coastal MS exhibit the highest IAV of seawater pCO2 (reported as seawater xCO2 for Twanoh) due to large variability from year to year in circulation, freshwater input, and biological productivity (Fig. 1). Most coral reef time series stations suggest net annual calcification with positive ΔpCO2 (seawater–air) values. Net calcification has been confirmed by independent assessments at some of these coral reef time series stations (Bates et al., 2010; Courtney et al., 2016; Drupp et al., 2011; Shamberger et al., 2011).
Clusters of fixed time series stations in Washington and California State waters, the Hawaiian island of Oahu, and Bermuda provide examples of how different processes drive ocean carbon chemistry. Seasonal amplitude and IAV are almost twice as large at the time series stations within the freshwater-influenced Puget Sound (Dabob and Twanoh) compared with the stations on the outer coast of Washington (Chá bă and Cape Elizabeth; Fig. 1b). Dabob is closer to ocean source waters and is deeper compared to Twanoh, which experiences greater water residence time and more persistent stratification; these factors result in increased influence of biological production and respiration on seawater xCO2 at Twanoh (Fassbender et al., 2018; Lindquist et al., 2017). These processes can cause subsurface hypoxia and low pH (<7.4) and aragonite saturation (<0.6) conditions in this region of Puget Sound (Feely et al., 2010), which likely contribute to the elevated surface seawater xCO2 levels observed at Dabob and Twanoh. The paired CCE1 and CCE2 moorings in coastal California provide the contrast of open ocean and upwelling regimes, respectively. The climatological mean and seasonal amplitude of pCO2 are both higher at CCE2 where summer upwelling supplies CO2-rich water to the surface. The IAV is similar at both sites, suggesting interannual drivers of pCO2, such as the El Niño–Southern Oscillation (Nam et al., 2011), likely have an influence throughout the southern California Current Ecosystem.
In both Hawaii and Bermuda, coral reef time series stations are paired with offshore, open ocean pCO2 observatories, although the offshore Bermuda Testbed Mooring (BTM) station was discontinued before the Bermuda reef sites were established. In both cases, the offshore stations of WHOTS and BTM both exhibit climatological mean seawater pCO2 slightly below atmospheric values (Fig. 1c), with previous studies indicating that these locations are net annual CO2 sinks (Bates et al., 2014; Dore et al., 2003, 2009; Sutton et al., 2017). The fringing or outer reef sites in Oahu (Kilo Nalu, Ala Wai, Kaneohe) tend to exhibit seawater pCO2 values closer to these open ocean background levels. The lagoonal Oahu reefs (CRIMP1 and CRIMP2) reflect increased water retention time paired with coral reef photosynthesis/respiration and calcification/dissolution, which elevate both annual mean and daily to interannual variability in seawater pCO2 values (Fig. 1c; Courtney et al., 2017; Drupp et al., 2011, 2013). One exception is the similar (almost as large) IAV at the fringing reef Ala Wai site, which is impacted by a nearby urban canal/estuary with high nutrient and organic matter input during storm events (Drupp et al., 2013). Positive ΔpCO2 values at the lagoonal reef sites also suggest that these sites are a net source of CO2 to the atmosphere contrary to the annual net CO2 uptake at the nearby open ocean sites (Fig. 1c).
In contrast, the outer reef site in Bermuda (Hog Reef) has a higher seasonal amplitude and mean pCO2 than the inner reef (Crescent Reef) despite having a shorter water residence time (Fig. 1). This is due to the greater biomass at Hog Reef, reflecting the influence of short-term (∼1–2 days) carbonate chemistry variability of the local active reef community, whereas Crescent Reef reflects the integrated signal of multiple habitats and days (∼6 days; Takeshita et al., 2018). Another caveat is that the coral reef time series in this data product have an inherent spatial bias, as 80 % of the coral reef moorings are located >20∘ latitude. The patterns for cooler, high-latitude reefs (e.g., Oahu and Bermuda) may differ from lower latitude reef sites (e.g., La Parguera and Chuuk), which would generally have less pronounced seasonality.
3.2 Marine boundary layer atmospheric CO2
Atmospheric CO2 observations at the 40 time series sites all show a positive long-term trend (Fig. 4a). The mean trend at the open ocean sites are not significantly different from the global average rate of change of 2 ppm yr−1 (Sutton et al., 2014b). Figure 4a shows all 40 time series of atmospheric xCO2 with a rate of change of approximately 20 µmol mol−1 (or ppm) over a decade; that is, from 380 µmol mol−1 in January 2006 to 400 µmol mol−1 in January 2016.
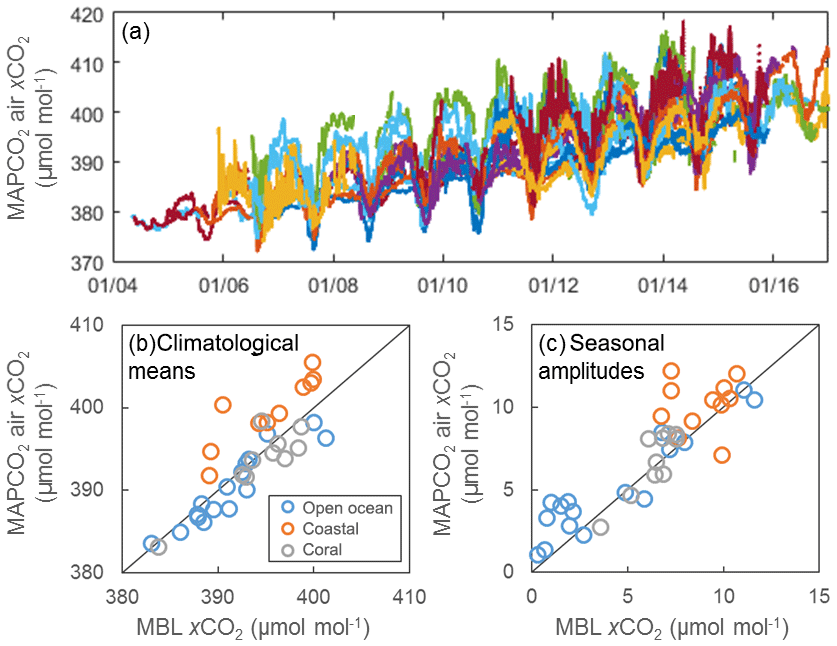
Figure 4(a) Weekly averaged air xCO2 observations from the 40 time series. Different colors represent different time series. Dates are MM/YY. (b) Climatological means and (c) seasonal amplitudes of air xCO2 from the MAPCO2 measurements compared to the GLOBALVIEW-CO2 MBL data product (GLOBALVIEW-CO2, 2013) for open ocean (blue), coastal (orange), and coral reef (gray) time series locations.
Although the global observing network of atmospheric CO2 that tracks anthropogenic CO2 increase requires higher measurement quality (≤0.1 ppm) than the measurement quality of the MAPCO2 system (≤1 ppm), the MAPCO2 air data may be valuable for regional air CO2 studies in coastal regions where land-based activities cause larger hourly to interannual variability in atmospheric CO2 (Bender et al., 2002). In general, the coastal stations exhibit higher annual mean and seasonal amplitude compared to GLOBALVIEW-CO2 MBL values, which is a product based on interpolating high-quality atmospheric measurements around the globe to latitudinal distributions of biweekly CO2 (Fig. 4b, c). Open ocean and coral reef sites do not show this overall pattern compared with GLOBALVIEW-CO2 MBL values, although there is variability across the sites with some time series exhibiting higher means and seasonal amplitudes compared with the data product and vice versa (Fig. 4b, c).
3.3 Detection of anthropogenic trends in surface seawater pCO2 and pH
Estimated length of time for an anthropogenic trend in seawater pCO2 to emerge from natural variability in the 40 time series varies from 8 to 41 years (Fig. 5). This range is 8 to 15 years at the open ocean sites, 16 to 41 years at the coastal sites, and 9 to 22 years at the coral reef sites. For the pH data sets with long enough time series to calculate ToE (i.e., the circles in Fig. 2), there is no significant difference between ToE of pCO2 and pH (ToE calculated using hydrogen ion concentration, [H+], not ); therefore, it is likely that ToE presented in Fig. 5 signifies both surface seawater pCO2 and pH. However, as the pH time series lengthen and variability is better constrained, future work should focus on a more thorough assessment of the ToE of seawater pH.
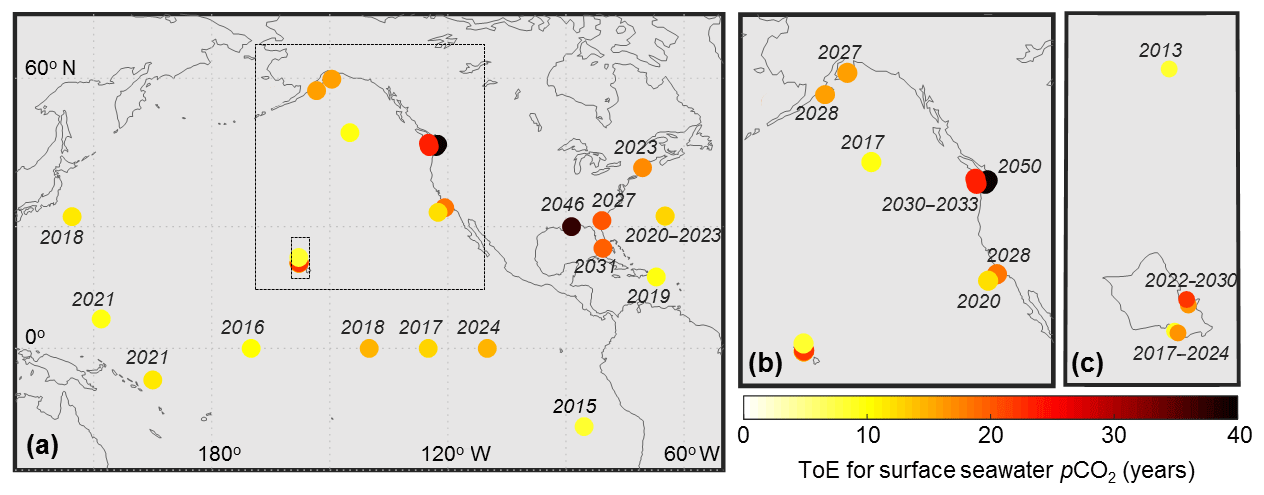
Figure 5(a) Time of trend emergence (ToE) estimates, i.e., number of years of observations necessary to detect an anthropogenic trend, with insets enlarged for (b) the US west coast and (c) the Hawaiian island of Oahu. ToE is not shown for sites with less than 3 years of observations (Kaneohe, Iceland, BOBOA, M2, SEAK, SOFS, BTM, TAO165E, TAO155W, NH-10, and JKEO). Years shown are the earliest dates of seawater pCO2 trend detection for each time series, which is the ToE estimate plus the time series start year (Table 1). These years of trend detection and the associated uncertainty are also shown in Table 2. For the pH data sets with long enough time series to calculate ToE (i.e., the circles in Fig. 2), there is no significant difference between the ToE of pCO2 and pH.
In this application ToE is dependent on the variability in the data, resulting in a pattern where sites that exhibit larger seasonal to interannual variability (Figs. 1 and 2) tend to have longer ToE estimates (Fig. 5). The fringing and outer reef sites of south shore Oahu (Kilo Nalu and Ala Wai) and Kaneohe Bay, respectively, have a shorter ToE compared with the lagoonal sites (CRIMP1 and CRIMP2) with larger seasonal to interannual variability. Similarly, the freshwater-influenced, highly productive Puget Sound sites (Dabob and Twanoh) have the longest ToE of all 40 sites and are approximately twice as long as the nearby time series on the outer coast of Washington (Chá bă and Cape Elizabeth). In the southern California Current, the ToE of the upwelling-influenced CCE2 is 50 % longer than the offshore CCE1 site.
These data also suggest that removing seasonal variability from the times series is essential to reduce the ToE and determine accurate long-term trends. The ToE estimates presented in Fig. 5 are based on seasonally detrended monthly anomalies, which are the residuals of the climatological monthly means. These ToE estimates are on average 55 % shorter than ToE estimated using raw time series data. This reduction in ToE due to seasonally detrending has a larger impact at higher latitudes where the seasonal amplitude of surface seawater pCO2 is larger compared with tropical sites. Using anomalies of climatological monthly means also minimizes the impact of the start and end month of the time series on the resulting trend estimation.
Of the 40 seawater pCO2 time series, ToE estimates suggest that only the WHOTS and Stratus time series are currently long enough to detect an anthropogenic trend. KEO, Papa, Kilo Nalu, and some TAO time series are approaching ToE, but at this time final data are not yet available through 2017. Data available at the time of publication suggest the anthropogenic trend in surface seawater pCO2 at WHOTS from 2004 to 2014 is 1.9±0.3 µatm yr−1 (Fig. 6). In this trend analysis we do not include data from the 2014–2015 anomalous event that warmed the North Pacific Ocean surface water (Bond et al., 2015) and elevated seawater pCO2 values (Feely et al., 2017). This WHOTS trend is not significantly different from the seawater pCO2 trend observed from 1988 to 2013 at the collocated ship-based Station ALOHA of 2.0±0.1 µatm yr−1 (Sutton et al., 2017). Both WHOTS and Station ALOHA trends are not significantly different from the trend expected if surface seawater is in equilibrium with the global average atmospheric CO2 increase.
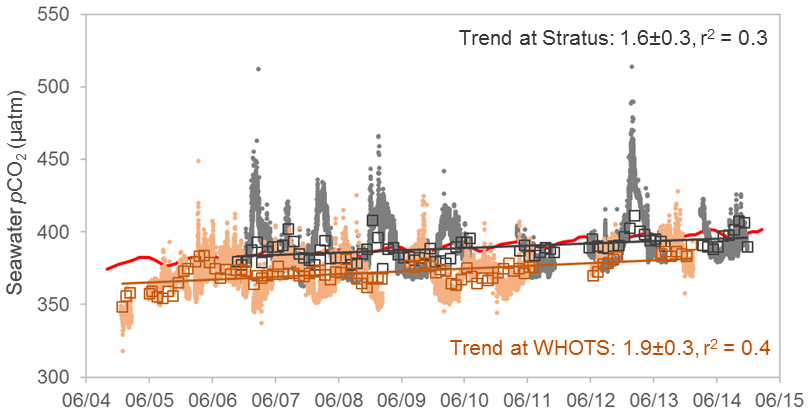
Figure 6Surface seawater pCO2 (µatm) 3-hourly observations (dots), deseasoned monthly anomalies (squares), and trends (lines) for the Stratus (dark gray) and WHOTS (brown) time series. The time series in red is monthly averaged atmospheric xCO2 (µmol mol−1) from Mauna Loa, Hawaii (NOAA ESRL Global Monitoring Division, 2016). Dates are MM/YY.
The long-term trend at Stratus from 2006 to 2015 is 1.6±0.3 µatm yr−1 (Fig. 6). This trend is slightly lower than expected if the seawater pCO2 change is in equilibrium with the atmosphere. Considering the uncertainty in the ToEts estimate (Table 2) and the added uncertainty around unconstrained decadal variability at each of these locations, continued observations will be necessary at this site to confirm whether this lower rate of change persists. In addition to uptake of atmospheric CO2, the seawater pCO2 trend may be impacted by surface meteorological or upper ocean changes in this region. Significant trends in wind speed, wind stress, and the air–sea exchange of heat, freshwater, and momentum were observed from meteorological and surface ocean measurements on Stratus from 2000 to 2009 (Weller, 2015). These trends are related to the intensification of Pacific trade winds over the last 2 decades across the entire basin (England et al., 2014) and are likely to impact surface ocean pCO2 and CO2 flux in other regions of the Pacific. Sustained, continuous time series such as Stratus can contribute to constraining the physical and biogeochemical processes controlling long-term change.
Table 2Data access to deployment-level archived data files at NCEI and the time series data product for each moored buoy location. The earliest date of seawater pCO2 trend detection is based on time series product data and calculated by adding the ToE estimate (Eqs. 1–4) to the time series start year (Table 1). The uncertainty presented here (in years) is the result of Eqs. (2)–(3), which is based on ToEts and does not include any additional uncertainty due to the decadal estimate from Eq. (4). NA denotes sites with less than 3 years of observations where interannual variability is likely not represented in a time series, and ToE is consequently not calculated.
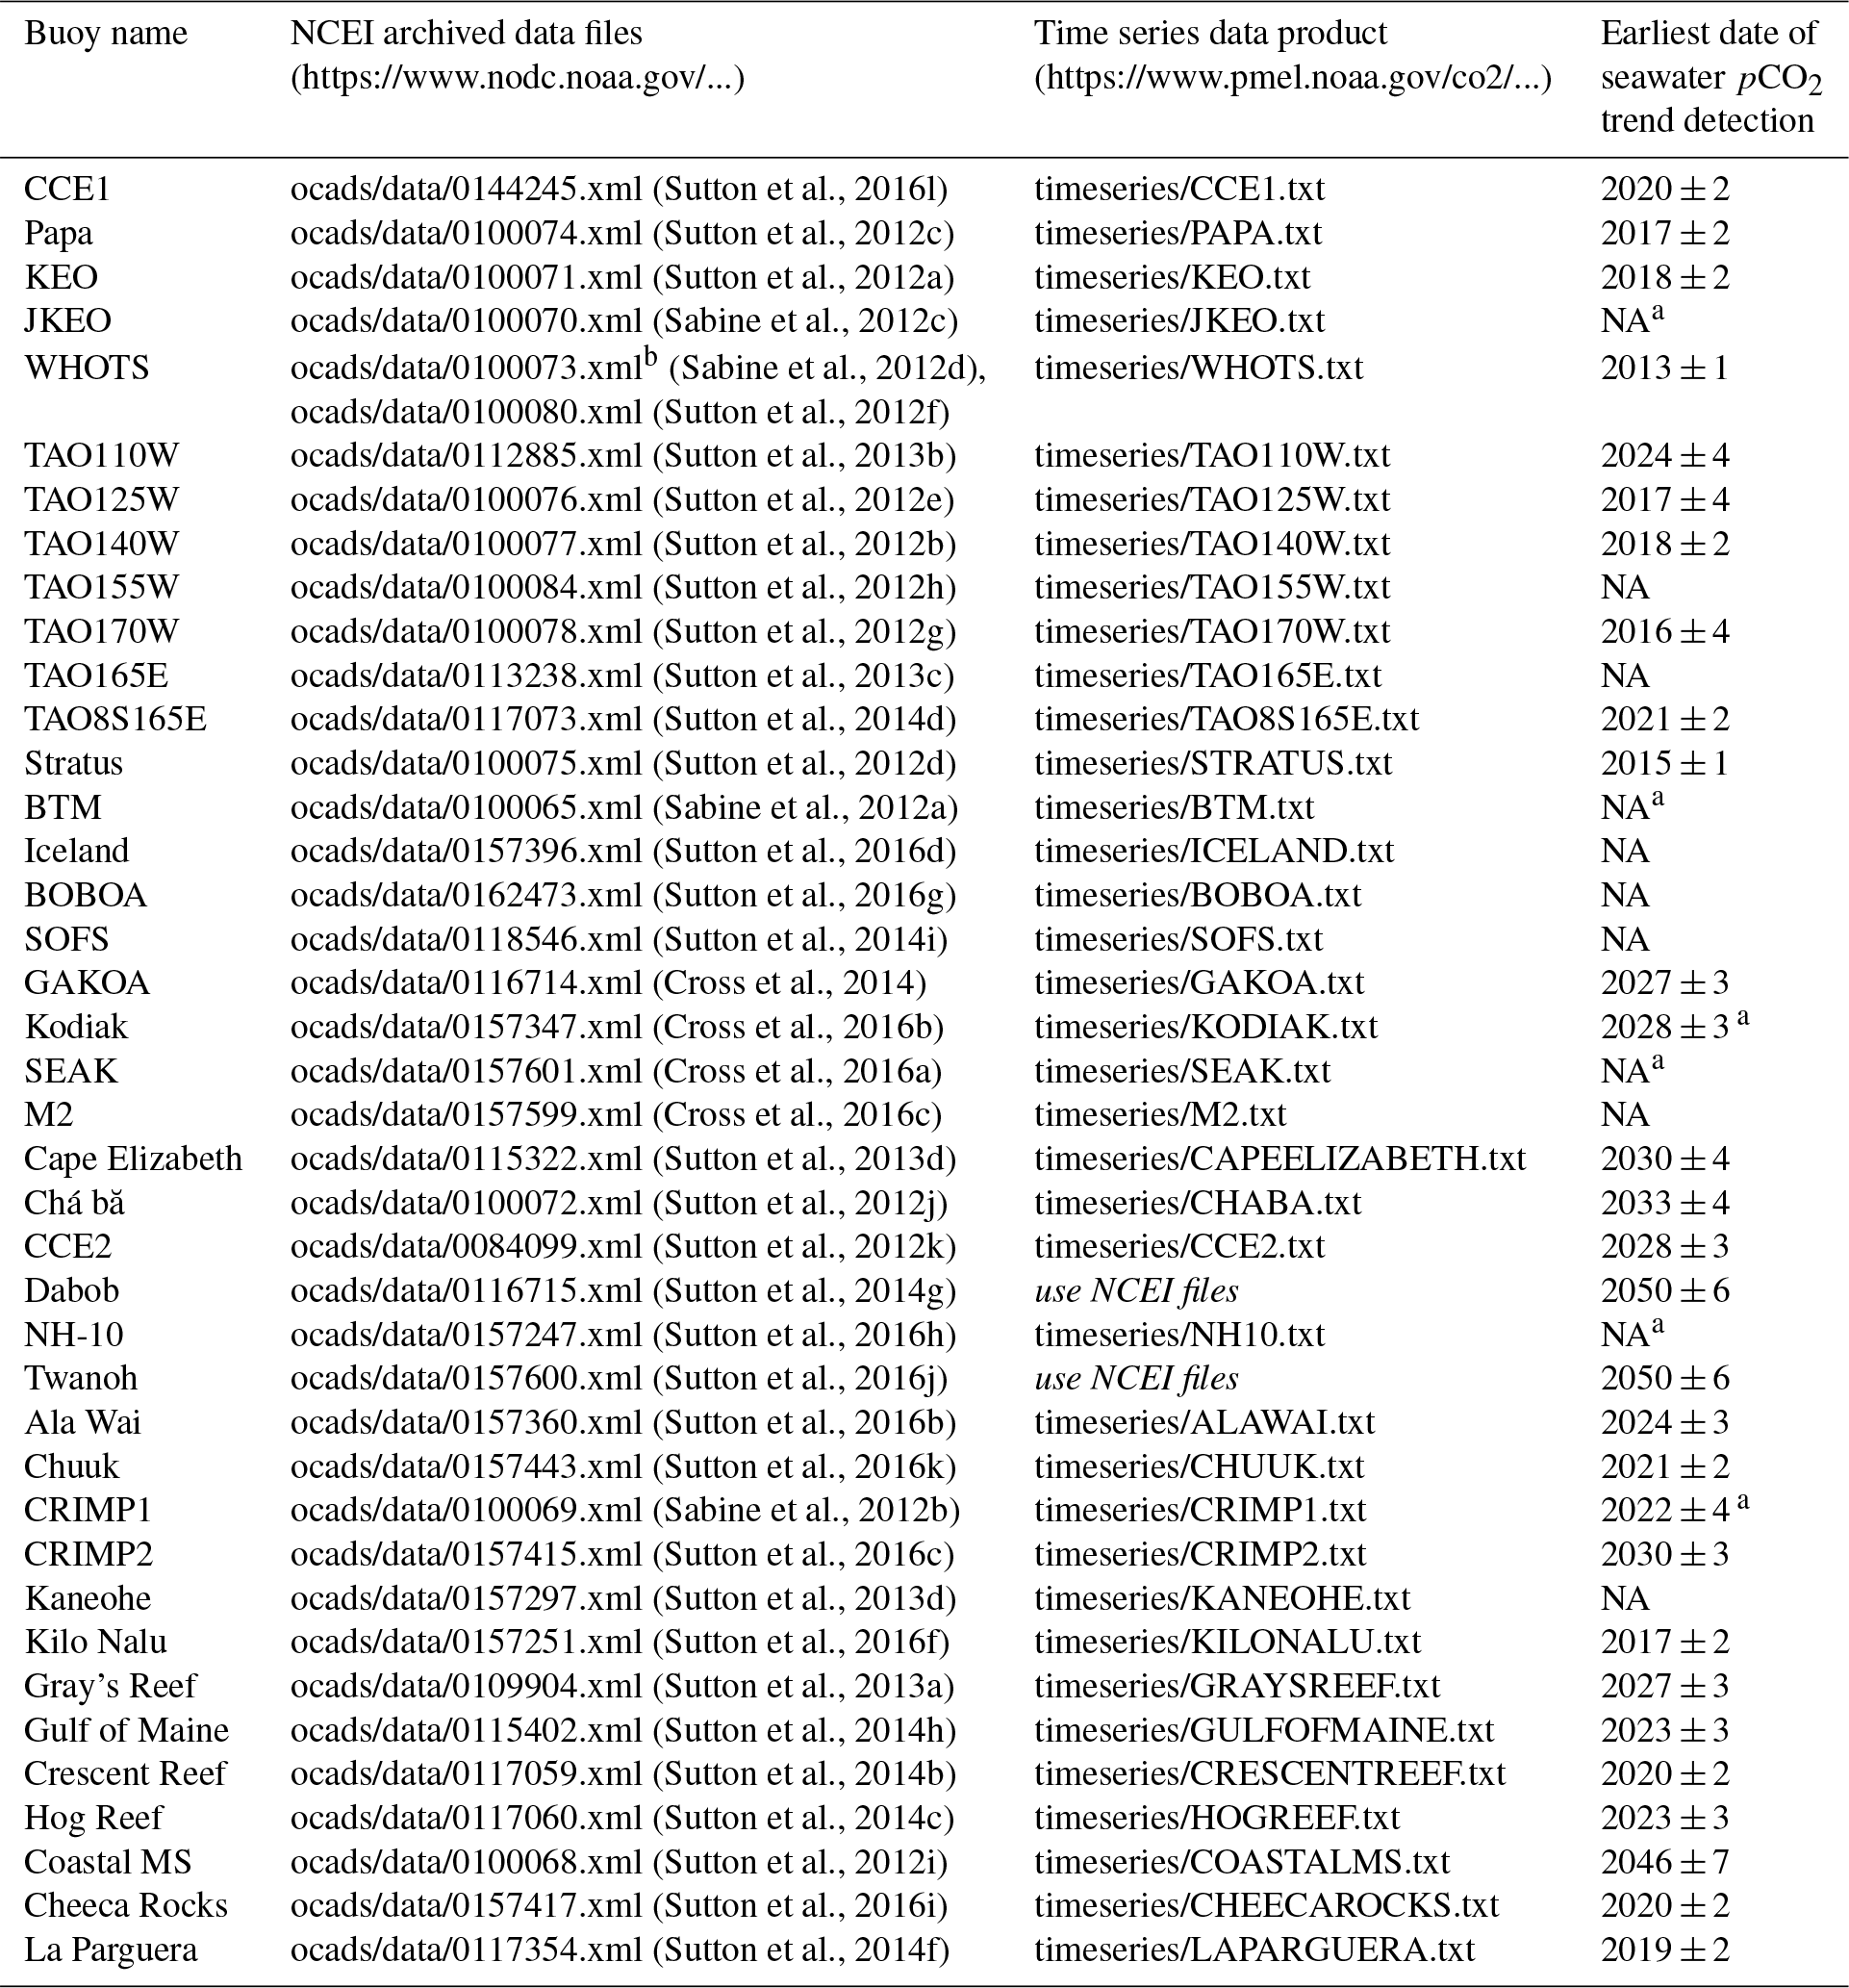
Notes: a discontinued sites where a long-term trend cannot be quantified solely from this time series data product. b Links to NCEI archived deployment-level data files are provided for both MOSEAN and WHOTS; however, these time series are combined in the time series data product.
Locations of deployment-level archived data at NCEI and the time series data product for each mooring site are listed in Table 2. The digital object identifier (DOI) for this data product is https://doi.org/10.7289/V5DB8043 (Sutton et al., 2018). Data users looking for easier access to quality-assured seawater pCO2 and pH data that has been designated as good (QF = 2; see Sect. 2.2) should consider using this time series data product. The time series data files will be updated each time new deployment-level data are submitted to the NCEI archive. Data users interested in all available MAPCO2 and pH data should retrieve deployment-level data from NCEI (links also provided in Table 2).
These data are made freely available to the public and the scientific community in the belief that their wide dissemination will lead to greater understanding and new scientific insights. Users of these time series data products should reference this paper and acknowledge the major funding organizations of this work: NOAA's Ocean Observing and Monitoring Division and Ocean Acidification Program.
This product provides a unique data set for a range of users including providing a more accessible format for non-carbon chemists interested in surface ocean pCO2 and pH time series data. These 40 time series locations represent a range of ocean, coastal, and coral reef regimes that exhibit a broad spectrum of daily to interannual variability. These time series can be used as a tool for estimating climatologies, assessing natural variability, and constraining models to improve predictions of trends in these regions. However, at this time, only two time series data sets (WHOTS and Stratus) are long enough to estimate long-term anthropogenic trends. ToE estimates show that at all but these two sites, an anthropogenic signal cannot be discerned at a statistically significant level from the natural variability of surface seawater pCO2 and pH. If and when that date of trend detection is attained, it is essential to seasonally detrend data prior to any trend analyses. Even though the ToE provided are conservative estimates, data users should still use caution in interpreting that an anthropogenic trend is distinct from decadal-scale ocean forcing that is not well characterized. Future work should be directed at improving upon these ToE estimates in regions where other data, proxies, or knowledge about decadal forcing are more complete.
AJS conducted the analysis and wrote the manuscript. RAF contributed to the analysis. SMJ, SM, CD, NM, and RB are responsible for quality assurance and control of the pCO2 and pH time series data. JO is responsible for data management of the pCO2 and pH time series data. AK is responsible for data archival of the moored time series data at NCEI. JC, AJA, NRB, WJC, MFC, EHDC, BH, SDH, CML, DPM, MJM, MM, JBM, JAN, SEN, JHN, SRO, JES, US, TWT, DCV, and RAW lead the projects that maintain the surface buoy platforms, making the pCO2 and pH time series possible. All coauthors read the manuscript and contributed edits.
The authors declare that they have no conflict of interest.
We gratefully acknowledge the major funders of the pCO2 and pH observations: the Office of Oceanic and Atmospheric Research of the National Oceanic and Atmospheric Administration, US Department of Commerce, including resources from the Ocean Observing and Monitoring Division of the Climate Program Office (fund reference number 100007298) and the Ocean Acidification Program. We rely on a long list of scientific partners and technical staff who carry out buoy maintenance, sensor deployment, and ancillary measurements at sea. We thank these partners and their funders for their continued efforts in sustaining the platforms that support these long-term pCO2 and pH observations, including the following institutions: the Australian Integrated Marine Observing System, the Caribbean Coastal Ocean Observing System, Gray's Reef National Marine Sanctuary, the Marine and Freshwater Research Institute, the Murdock Charitable Trust, the National Data Buoy Center, the National Science Foundation Division of Ocean Sciences, NOAA–Korean Ministry of Oceans and Fisheries Joint Project Agreement, the Northwest Association of Networked Ocean Observing Systems, the Research Moored Array for African-Asian-Australian Monsoon Analysis and Prediction (i.e., RAMA), the University of Washington, the US Integrated Ocean Observing System, and the Washington Ocean Acidification Center. The open ocean sites are part of the OceanSITES program of the Global Ocean Observing System and the Surface Ocean CO2 Observing Network. All sites are also part of the Global Ocean Acidification Observing Network. This paper is PMEL contribution number 4797.
This paper was edited by David Carlson and reviewed by three anonymous referees.
Bakker, D. C. E., Pfeil, B., Landa, C. S., Metzl, N., O'Brien, K. M., Olsen, A., Smith, K., Cosca, C., Harasawa, S., Jones, S. D., Nakaoka, S.-I., Nojiri, Y., Schuster, U., Steinhoff, T., Sweeney, C., Takahashi, T., Tilbrook, B., Wada, C., Wanninkhof, R., Alin, S. R., Balestrini, C. F., Barbero, L., Bates, N. R., Bianchi, A. A., Bonou, F., Boutin, J., Bozec, Y., Burger, E. F., Cai, W.-J., Castle, R. D., Chen, L., Chierici, M., Currie, K., Evans, W., Featherstone, C., Feely, R. A., Fransson, A., Goyet, C., Greenwood, N., Gregor, L., Hankin, S., Hardman-Mountford, N. J., Harlay, J., Hauck, J., Hoppema, M., Humphreys, M. P., Hunt, C. W., Huss, B., Ibánhez, J. S. P., Johannessen, T., Keeling, R., Kitidis, V., Körtzinger, A., Kozyr, A., Krasakopoulou, E., Kuwata, A., Landschützer, P., Lauvset, S. K., Lefèvre, N., Lo Monaco, C., Manke, A., Mathis, J. T., Merlivat, L., Millero, F. J., Monteiro, P. M. S., Munro, D. R., Murata, A., Newberger, T., Omar, A. M., Ono, T., Paterson, K., Pearce, D., Pierrot, D., Robbins, L. L., Saito, S., Salisbury, J., Schlitzer, R., Schneider, B., Schweitzer, R., Sieger, R., Skjelvan, I., Sullivan, K. F., Sutherland, S. C., Sutton, A. J., Tadokoro, K., Telszewski, M., Tuma, M., van Heuven, S. M. A. C., Vandemark, D., Ward, B., Watson, A. J., and Xu, S.: A multi-decade record of high-quality fCO2 data in version 3 of the Surface Ocean CO2 Atlas (SOCAT), Earth Syst. Sci. Data, 8, 383–413, https://doi.org/10.5194/essd-8-383-2016, 2016.
Barton, A., Hales, B., Waldbusser, G. G., Langdon, C., and Feely, R. A.: The Pacific oyster, Crassostrea gigas, shows negative correlation to naturally elevated carbon dioxide levels: Implications for near-term ocean acidification effects, Limnol. Oceanogr., 57, 698–710, https://doi.org/10.4319/lo.2012.57.3.0698, 2012.
Barton, A., Waldbusser, G. G., Feely, R. A., Weisberg, S. B., Newton, J. A., Hales, B., Cudd, S., Eudeline, B., Langdon, C. J., Jefferds, I., King, T., Suhrbier, A., and McLaughlin, K.: Impacts of coastal acidification on the Pacific Northwest shellfish industry and adaptation strategies implemented in response, Oceanography, 28, 146–159, https://doi.org/10.5670/oceanog.2015.38, 2015.
Bates, N. R.: Interannual variability of oceanic CO2 and biogeochemical properties in the western North Atlantic subtropical gyre, Deep-Sea Res. Pt. II, 48, 1507–1528, 2001.
Bates, N. R., Amat, A., and Andersson, A. J.: Feedbacks and responses of coral calcification on the Bermuda reef system to seasonal changes in biological processes and ocean acidification, Biogeosciences, 7, 2509–2530, https://doi.org/10.5194/bg-7-2509-2010, 2010.
Bates, N. R., Astor, Y. M., Church, M. J., Currie, K., Dore, J. E., González-Dávila, M., Lorenzoni, L., Muller-Karger, F., Olafsson, J., and Santana-Casiano, J. M.: A time-series view of changing ocean chemistry due to ocean uptake of anthropogenic CO2 and ocean acidification, Oceanography, 27, 126–141, https://doi.org/10.5670/oceanog.2014.16, 2014.
Bauer, J. E., Cai, W.-J., Raymond, P. A., Bianchi, T. S., Hopkinson, C. S., and Regnier, P. A. G.: The changing carbon cycle of the coastal ocean, Nature, 504, 61–70, https://doi.org/10.1038/nature12857, 2013.
Bednaršek, N., Tarling, G. A., Bakker, D. C. E., Fielding, S., and Feely, R. A.: Dissolution dominating calcification process in polar pteropods close to the point of aragonite undersaturation, PLoS ONE, 9, e109183, https://doi.org/10.1371/journal.pone.0109183, 2014.
Bednaršek, N., Harvey, C. J., Kaplan, I. C., Feely, R. A., and Možina, J.: Pteropods on the edge: Cumulative effects of ocean acidification, warming, and deoxygenation, Prog. Oceanogr., 145, 1–24, https://doi.org/10.1016/j.pocean.2016.04.002, 2016.
Bednaršek, N., Feely, R. A., Tolimieri, N., Hermann, A. J., Siedlecki, S. A., Waldbusser, G. G., McElhany, P., Alin, S. R., Klinger, T., Moore-Maley, B., and Pörtner, H. O.: Exposure history determines pteropod vulnerability to ocean acidification along the US West Coast, Scientific Reports, 7, 4526, https://doi.org/10.1038/s41598-017-03934-z, 2017a.
Bednaršek, N., Klinger, T., Harvey, C. J., Weisberg, S., McCabe, R. M., Feely, R. A., Newton, J., and Tolimieri, N.: New ocean, new needs: Application of pteropod shell dissolution as a biological indicator for marine resource management, Ecol. Indic., 76, 240–244, https://doi.org/10.1016/j.ecolind.2017.01.025, 2017b.
Bender, M., Doney, S., Feely, R. A., Fung, I. Y., Gruber, N., Harrison, D. E., Keeling, R., Moore, J., Sarmiento, J., Sarachik, E., Stephens, B., Takahashi, T., Tans, P. P., and Wanninkhof, R.: A Large Scale Carbon Observing Plan: In Situ Oceans and Atmosphere (LSCOP), Nat. Tech. Info. Service, Springfield, 201 pp., 2002.
Bond, N. A., Cronin, M. F., Freeland, H., and Mantua, N.: Causes and impacts of the 2014 warm anomaly in the NE Pacific, Geophys. Res. Lett., 42, 3414–3420. https://doi.org/10.1002/2015GL063306, 2015.
Bresnahan, P. J., Martz, T. R., Takeshita, Y., Johnson, K. S., and LaShomb, M.: Best practices for autonomous measurement of seawater pH with the Honeywell Durafet, Methods in Oceanography, 9, 44–60, https://doi.org/10.1016/j.mio.2014.08.003, 2014.
Chan, N. C. S. and Connolly, S. R.: Sensitivity of coral calcification to ocean acidification: a meta-analysis, Global Change Biol., 19, 282–290, 2013.
Courtney, T. A., Andersson, A. J., Bates, N. R., Collins, A., Cyronak, T., de Putron, S. J., Eyre, B. D., Garley, R., Hochberg, E. J., Johnson, R., Musielewicz, S., Noyes, T. J., Sabine, C. L., Sutton, A. J., Toncin, J., and Tribollet, A.: Comparing chemistry and census-based estimates of net ecosystem calcification on a rim reef in Bermuda, Frontiers in Marine Science, 3, 181, https://doi.org/10.3389/fmars.2016.00181, 2016.
Courtney, T. A., Lebrato, M., Bates, N. R., Collins, A., de Putron, S. J., Garley, R., Johnson, R., Molinero, J.-C., Noyes, T. J., Sabine, C. L., and Andersson, A. J.: Environmental controls on modern scleractinian coral and reef-scale calcification, Science Advances, 3, e1701356, https://doi.org/10.1126/sciadv.1701356, 2017.
Cross, J. N., Monacci, N. M., Musielewicz, S., and Maenner Jones, S.: High-resolution ocean and atmosphere pCO2 time-series measurements from mooring GAKOA_149W_60N in the Gulf of Alaska from 2011-05-19 to 2017-01-20 (NODC Accession 0116714), Version 5.5, National Oceanographic Data Center, NOAA, Dataset, https://doi.org/10.3334/CDIAC/OTG.TSM_GAKOA_149W_60N, 2014.
Cross, J. N., Mathis, J. T., Monacci, N. M., Musielewicz, S., Maenner Jones, S., and Osborne, J.: Partial pressure (or fugacity) of carbon dioxide, salinity and other variables collected from time series observations using Bubble type equilibrator for autonomous carbon dioxide (CO2) measurement, Carbon dioxide (CO2) gas analyzer and other instruments from MOORING_SOUTHEAST_AK_56N_134W in the Coastal Waters of Southeast Alaska and British Columbia from 2013-03-29 to 2016-02-03 (NCEI Accession 0157601), Version 2.2, NOAA National Centers for Environmental Information, Dataset, https://doi.org/10.3334/CDIAC/OTG.TSM_SOUTHEAST_AK_56N_134W, 2016a.
Cross, J. N., Mathis, J. T., Monacci, N. M., Musielewicz, S., Maenner Jones, S., and Osborne, J.: High-resolution ocean and atmosphere pCO2 time-series measurements from mooring Kodiak_152W_57N (NCEI Accession 0157347), Version 3.3, NOAA National Centers for Environmental Information, Dataset, https://doi.org/10.3334/CDIAC/OTG.TSM_KODIAK_152W_57N, 2016b.
Cross, J. N., Monacci, N. M., Musielewicz, S., and Maenner Jones, S.: High-resolution ocean and atmosphere pCO2 time-series measurements from mooring M2_164W_57N in the Bering Sea from 2013-05-06 to 2016-05-30 (NCEI Accession 0157599), Version 2.2, NOAA National Centers for Environmental Information, Dataset, https://doi.org/10.3334/CDIAC/OTG.TSM_M2_164W_57N, 2016c.
Davis, C. V., Rivest, E. B., Hill, T. M., Gaylord, B., Russell, A. D., and Sanford, E.: Ocean acidification compromises a planktic calcifier with implications for global carbon cycling, Scientific Reports, 7, 2225, https://doi.org/10.1038/s41598-017-01530-9, 2017.
Dickson, A. G., Sabine, C. L., and Christian, J. R. (Eds.): Guide to best practices for ocean CO2 measurements, PICES Special Publication 3, 191 pp., 2007.
Dore, J. E., Lukas, R., Sadler, D. W., and Karl, D. M.: Climate-driven changes to the atmospheric CO2 sink in the subtropical North Pacific Ocean, Nature, 424, 754–757, 2003.
Dore, J. E., Lukas, R., Sadler, D. W., Church, M. J., and Karl, D. M.: Physical and biogeochemical modulation of ocean acidification in the central North Pacific, P. Natl. Acad. Sci. USA, 106, 12235–12240, 2009.
Drupp, P., De Carlo, E. H., Mackenzie, F. T., Bienfang, P., and Sabine, C. L.: Nutrient inputs, phytoplankton response, and CO2 variations in a semi-enclosed subtropical embayment, Kaneohe Bay, Hawaii, Aquat. Geochem., 17, 473–498, https://doi.org/10.1007/s10498-010-9115-y, 2011.
Drupp, P. S., De Carlo, E. H., Mackenzie, F. T., Sabine, C. L., Feely, R. A., and Shamberger, K. E.: Comparison of CO2 dynamics and air-sea gas exchange in differing tropical reef environments, Aquat. Geochem., 19, 371–397, https://doi.org/10.1007/s10498-013-9214-7, 2013.
England, M. H., McGregor, S., Spence, P., Meehl, G. A., Timmermann, A., Cai, W., Gupta, A. S., McPhaden, M. J., Purich, A., and Santoso, A.: Recent intensification of wind-driven circulation in the Pacific and the ongoing warming hiatus, Nat. Clim. Change, 4, 222–227, 2014.
Fabricius, K. E., Langdon, C., Uthicke, S., Humphrey, C., Noonan, S., De'ath, G., Okazaki, R., Muehllehner, N., Glas, M. S., and Lough, J. M.: Losers and winners in coral reefs acclimatized to elevated carbon dioxide concentrations, Nat. Clim. Change, 1, 165–169, 2011.
Fassbender, A. J., Alin, S. R., Feely, R. A., Sutton, A. J., Newton, J. A., Krembs, C., Bos, J., Keyzers, M., Devol, A., Ruef, W., and Pelletier, G.: Seasonal carbonate chemistry variability in marine surface waters of the US Pacific Northwest, Earth Syst. Sci. Data, 10, 1367–1401, https://doi.org/10.5194/essd-10-1367-2018, 2018.
Feely, R. A., Takahashi, T., Wanninkhof, R., McPhaden, M. J., Cosca, C. E., Sutherland, S. C., and Carr, M.-E.: Decadal variability of the air–sea CO2 fluxes in the equatorial Pacific Ocean, J. Geophys. Res., 111, C08S90, https://doi.org/10.1029/2005JC003129, 2006.
Feely, R. A., Alin, S. R., Newton, J., Sabine, C. L., Warner, M., Devol, A., Krembs, C., and Maloy, C.: The combined effects of ocean acidification, mixing, and respiration on pH and carbonate saturation in an urbanized estuary, Estuar. Coast. Shelf S., 88, 442–449, https://doi.org/10.1016/j.ecss.2010.05.004, 2010.
Feely, R. A., Wanninkhof, R., Landschützer, P., Carter, B. R., and Triñanes, J. A.: Ocean carbon, in: State of the Climate in 2016, Global Oceans, B. Am. Meteorol. Soc., 98, S89–S92, 2017.
Gattuso, J.-P., Magnan, A., Billé, R., Cheung, W. W. L., Howes, E. L., Joos, F., Allemand, D., Bopp, L., Cooley, S. R., Eakin, C. M., Hoegh-Guldberg, O., Kelly, R. P., Pörtner, H.-O., Rogers, A. D., Baxter, J. M., Laffoley, D., Osborn, D., Rankovic, A., Rochette, J., Sumaila, U. R., Treyer, S., and Turley, C.: Contrasting futures for ocean and society from different anthropogenic CO2 emissions scenarios, Science, 349, aac4722, https://doi.org/10.1126/science.aac4722, 2015.
GLOBALVIEW-CO2: Cooperative Global Atmospheric Data Integration Project: Multilaboratory compilation of synchronized and gap-filled atmospheric carbon dioxide records for the period 1979–2012 (obspack_co2_1_GLOBALVIEW-CO2_2013_v1.0.4_2013-12-23), compiled by: NOAA Global Monitoring Division: Boulder, Colorado, USA Data product, https://doi.org/10.3334/OBSPACK/1002, 2013 (updated annually).
Glover, D. M., Jenkins, W. J., and Doney, S. C.: Modeling Methods for Marine Science, Cambridge University Press, New York, 2011.
Henson, S. A., Sarmiento, J. L., Dunne, J. P., Bopp, L., Lima, I., Doney, S. C., John, J., and Beaulieu, C.: Detection of anthropogenic climate change in satellite records of ocean chlorophyll and productivity, Biogeosciences, 7, 621–640, https://doi.org/10.5194/bg-7-621-2010, 2010.
Hofmann, G. E., Barry, J. P., Edmunds, P. J., Gates, R. D., Hutchins, D. A., Klinger, T., and Sewell, M. A.: The effect of ocean acidification on calcifying organisms in marine ecosystems: An organism-to-ecosystem perspective, Annu. Rev. Ecol. Evol. S., 41, 127–147, https://doi.org/10.1146/annurev.ecolsys.110308.120227, 2010.
Keller, K. M., Joos, F., Raible, C. C., Cocco, V., Frölicher, T. L., Dunne, J. P., Gehlen, M., Bopp, L., Orr, J. C., Tjiputra, J., Heinze, C., Segschneider, J., Roy, T., and Metzl, N.: Variability of the ocean carbon cycle in response to the North Atlantic Oscillation, Tellus B, 64, 18738, https://doi.org/10.3402/tellusb.v64i0.18738, 2012.
Khatiwala, S., Tanhua, T., Mikaloff Fletcher, S., Gerber, M., Doney, S. C., Graven, H. D., Gruber, N., McKinley, G. A., Murata, A., Ríos, A. F., and Sabine, C. L.: Global ocean storage of anthropogenic carbon, Biogeosciences, 10, 2169–2191, https://doi.org/10.5194/bg-10-2169-2013, 2013.
Kwiatkowski, L. and Orr, J. C.: Diverging seasonal extremes for ocean acidification during the twenty-first century, Nat. Clim. Change, 8, 141–145, 2018.
Landschützer, P., Gruber, N., and Bakker, D. C. E.: Decadal variations and trends of the global ocean carbon sink, Global Biogeochem. Cy., 30, 1396–1417, https://doi.org/10.1002/2015GB005359, 2016.
Landschützer, P., Gruber, N., Bakker, D. C. E., Stemmler, I., Six, K. D.: Strengthening seasonal marine CO2 variations due to increasing atmospheric CO2, Nat. Clim. Change, 8, 146–150, 2018.
Le Quéré, C., Andrew, R. M., Friedlingstein, P., Sitch, S., Pongratz, J., Manning, A. C., Korsbakken, J. I., Peters, G. P., Canadell, J. G., Jackson, R. B., Boden, T. A., Tans, P. P., Andrews, O. D., Arora, V. K., Bakker, D. C. E., Barbero, L., Becker, M., Betts, R. A., Bopp, L., Chevallier, F., Chini, L. P., Ciais, P., Cosca, C. E., Cross, J., Currie, K., Gasser, T., Harris, I., Hauck, J., Haverd, V., Houghton, R. A., Hunt, C. W., Hurtt, G., Ilyina, T., Jain, A. K., Kato, E., Kautz, M., Keeling, R. F., Klein Goldewijk, K., Körtzinger, A., Landschützer, P., Lefèvre, N., Lenton, A., Lienert, S., Lima, I., Lombardozzi, D., Metzl, N., Millero, F., Monteiro, P. M. S., Munro, D. R., Nabel, J. E. M. S., Nakaoka, S.-I., Nojiri, Y., Padin, X. A., Peregon, A., Pfeil, B., Pierrot, D., Poulter, B., Rehder, G., Reimer, J., Rödenbeck, C., Schwinger, J., Séférian, R., Skjelvan, I., Stocker, B. D., Tian, H., Tilbrook, B., Tubiello, F. N., van der Laan-Luijkx, I. T., van der Werf, G. R., van Heuven, S., Viovy, N., Vuichard, N., Walker, A. P., Watson, A. J., Wiltshire, A. J., Zaehle, S., and Zhu, D.: Global Carbon Budget 2017, Earth Syst. Sci. Data, 10, 405–448, https://doi.org/10.5194/essd-10-405-2018, 2018.
Lindquist, A., Sutton, A., Devol, A., Winans, A., Coyne, A., Bodenstein, B., Curry, B., Herrmann, B., Sackmann, B., Tyler, B., Maloy, C., Greengrove, C., Fanshier, C., Krembs, C., Sabine, C., Cook, C., Hard, C., Greene, C., Lowry, D., Harvell, D., McPhee-Shaw, E., Haphey, E., Hannach, G., Bohlmann, H., Burgess, H., Smith, I., Kemp, I., Newton, J., Borchert, J., Mickett, J., Apple, J., Bos, J., Parrish, J., Ruffner, J., Keister, J., Masura, J., Devitt, K., Bumbaco, K., Stark, K., Hermanson, L., Claassen, L., Swanson, L., Burger, M., Schmidt, M., McCartha, M., Peacock, M., Eisenlord, M., Keyzers, M., Christman, N., Hamel, N., Burnett, N., Bond, N., Graham, O., Biondo, P., Hodum, P., Wilborn, R., Feely, R. A., Pearson, S., Alin, S., Albertson, S., Moore, S., Jaeger, S., Pool, S., Musielwicz, S., King, T., Good, T., Jones, T., Ross, T., Sandell, T., Burks, T., Trainer, V., Bowes, V., Ruef, W., and Eash-Loucks, W.: Puget Sound Marine Waters: 2016 Overview, edited by: Moore, S., Wold, R., Stark, K., Bos, J., Williams, P., Hamel, N., Edwards, A., Krembs, C., and Newton, J., NOAA Northwest Fisheries Science Center for the Puget Sound Ecosystem Monitoring Program's (PSEMP) Marine Waters Workgroup, NOAA's Northwest Fisheries Science Center, 2017.
Lovenduski, N. S., Long, M. C., and Lindsay, K.: Natural variability in the surface ocean carbonate ion concentration, Biogeosciences, 12, 6321–6335, https://doi.org/10.5194/bg-12-6321-2015, 2015.
Martz, T. R., Connery, J. G., and Johnson, K. S.: Testing the Honeywell Durafet® for seawater pH applications, Limnol. Oceanogr.-Meth., 8, 172–184, https://doi.org/10.4319/lom.2010.8.172, 2010.
McKinley, G. A., Fay, A. R., Takahashi, T., and Metzl, N.: Convergence of atmospheric and North Atlantic carbon dioxide trends on multidecadal timescales, Nat. Geosci., 4, 606–610, https://doi.org/10.1038/ngeo1193, 2011.
McPhaden, M. J., Busalacchi, A. J., Cheney, R., Donguy, J. -R., Gage, K. S., Halpern, D., Ji, M., Julian, P., Meyers, G., Mitchum, G. T., Niiler, P. P., Picaut, J., Reynolds, R. W., Smith, N., and Takeuchi, K.: The Tropical Ocean-Global Atmosphere (TOGA) observing system: A decade of progress, J. Geophys. Res., 103, 14169–14240, 1998.
Nam, S., Kim, H.-J., and Send, U.: Amplification of hypoxic and acidic events by La Niña conditions on the continental shelf off California, Geophys. Res. Lett., 38, L22602, https://doi.org/10.1029/2011GL049549, 2011.
Newman, M., Alexander, M. A., Ault, T. R., Cobb, K. M., Deser, C., Lorenzo, E. D., Mantua, N. J., Miller, A. J., Minobe, S., Nakamura, H., Schneider, N., Vimont, D. J., Phillips, A. S., Scott, J. D., and Smith, C. A.: The Pacific Decadal Oscillation, revisited, J. Climate, 29, 4399–4427, 2016.
NOAA ESRL Global Monitoring Division: Atmospheric Carbon Dioxide Dry Air Mole Fractions from quasi-continuous measurements at Mauna Loa, Hawaii, compiled by: Thoning, K. W., Kitzis, D. R., and Crotwell, A., National Oceanic and Atmospheric Administration (NOAA), Earth System Research Laboratory (ESRL), Global Monitoring Division (GMD): Boulder, Colorado, USA, Version 2017-8, https://doi.org/10.7289/V54X55RG, 2016 (updated annually).
Pacella, S. R., Brown, C. A., Waldbusser, G. G., Labiosa, R. G., and Hales, B.: Seagrass habitat metabolism increases short-term extremes and long-term offset of CO2 under future ocean acidification, P. Natl. Acad. Sci. USA, 115, 3870–3875, https://doi.org/10.1073/pnas.1703445115, 2018.
Reimer, J. J., Cai, W.-J., Xue, L., Vargas, R., Noakes, S., Hu, X., Signorini, S. R., Mathis, J. T., Feely, R. A., Sutton, A. J., Sabine, C., Musielewicz, S., Chen, B., and Wanninkhof, R.: Time series pCO2 at a coastal mooring: Internal consistency, seasonal cycles, and interannual variability, Cont. Shelf Res., 145, 95–108, https://doi.org/10.1016/j.csr.2017.06.022, 2017.
Reum, J. C. P., Alin, S. R., Harvey, C. J., Bednaršek, N., Evans, W., Feely, R. A., Hales, B., Lucey, N., Mathis, J. T., McElhany, P., Newton, J., and Sabine, C. L.: Interpretation and design of ocean acidification experiments in upwelling systems in the context of carbonate chemistry co-variation with temperature and oxygen, ICES J. Mar. Sci., 73, 582–595, https://doi.org/10.1093/icesjms/fsu231, 2015.
Sabine, C. L., Bates, N., Maenner Jones, S., Bott, R., and Sutton, A. J.: High-resolution ocean and atmosphere pCO2 time-series measurements from mooring BTM_64W_32N (NODC Accession 0100065), Version 3.3, National Oceanographic Data Center, NOAA, Dataset, https://doi.org/10.3334/CDIAC/OTG.TSM_BTM_64W_32N, 2012a.
Sabine, C. L., De Carlo, E. H., Musielewicz, S., Maenner Jones, S., Bott, R., and Sutton, A. J.: High-resolution ocean and atmosphere pCO2 time-series measurements from mooring CRIMP1_158W_21N (NODC Accession 0100069), Version 4.4, National Oceanographic Data Center, NOAA, Dataset, https://doi.org/10.3334/CDIAC/OTG.TSM_CRIMP1_158W_21N, 2012b.
Sabine, C. L., Dickey, T. D., Maenner Jones, S., Bott, R., and Sutton, A. J.: High-resolution ocean and atmosphere pCO2 time-series measurements from mooring JKEO_147E_38N (NODC Accession 0100070), Version 2.2. National Oceanographic Data Center, NOAA, Dataset, https://doi.org/10.3334/CDIAC/OTG.TSM_JKEO_147E_38N, 2012c.
Sabine, C. L., Maenner Jones, S., Bott, R., and Sutton, A. J.: High-resolution ocean and atmosphere pCO2 time-series measurements from mooring MOSEAN_158W_23N (NODC Accession 0100073), Version 2.2, National Oceanographic Data Center, NOAA, Dataset, https://doi.org/10.3334/CDIAC/OTG.TSM_MOSEAN, 2012d.
Schuster, U. and Watson, A. J.: A variable and decreasing sink for atmospheric CO2 in the North Atlantic, J. Geophys. Res., 112, C11006, https://doi.org/10.1029/2006JC003941, 2007.
Séférian, R., Bopp, L., Swingedouw, D., and Servonnat, J.: Dynamical and biogeochemical control on the decadal variability of ocean carbon fluxes, Earth Syst. Dynam., 4, 109–127, https://doi.org/10.5194/esd-4-109-2013, 2013.
Seidel, M. P., DeGrandpre, M. D., and Dickson, A. G.: A sensor for in situ indicator-based measurements of seawater pH, Mar. Chem., 109, 18–28, 2008.
Shamberger, K. E. F., Feely, R. A., Sabine, C. L., Atkinson, M. J., DeCarlo, E. H., Mackenzie, F. T., Drupp, P. S., and Butterfield, D. A.: Calcification and organic production on a Hawaiian coral reef, Mar. Chem., 127, 64–75, https://doi.org/10.1016/j.marchem.2011.08.003, 2011.
Sutton, A. J., Sabine, C. L., Dietrich, C., Maenner Jones, S., Musielewicz, S., Bott, R., and Osborne, J.: High-resolution ocean and atmosphere pCO2 time-series measurements from mooring KEO_145E_32N in the North Pacific Ocean from 2007-09-26 to 2015-08-12 (NODC Accession 0100071), Version 6.6, National Oceanographic Data Center, NOAA, Dataset, https://doi.org/10.3334/CDIAC/OTG.TSM_KEO_145E_32N, 2012a.
Sutton, A. J., Sabine, C. L., Dietrich, C., Maenner Jones, S., Musielewicz, S., Bott, R., and Osborne, J.: High-resolution ocean and atmosphere pCO2 time-series measurements from mooring MOORING TAO140W_0N in the Equatorial Pacific Ocean from 2004-05-23 to 2016-06-28 (NODC Accession 0100077), Version 7.7, National Oceanographic Data Center, NOAA, Dataset, https://doi.org/10.3334/CDIAC/OTG.TSM_TAO140W, 2012b.
Sutton, A. J., Sabine, C. L., Dietrich, C., Maenner Jones, S., Musielewicz, S., Bott, R., and Osborne, J.: High-resolution ocean and atmosphere pCO2 time-series measurements from mooring Papa_145W_50N in the North Pacific Ocean from 2010-06-15 to 2015-06-15 (NODC Accession 0100074), Version 5.5, National Oceanographic Data Center, NOAA, Dataset, https://doi.org/10.3334/CDIAC/OTG.TSM_PAPA_145W_50N, 2012c.
Sutton, A. J., Sabine, C. L., Dietrich, C., Maenner Jones, S., Musielewicz, S., Bott, R., and Osborne, J.: High-resolution ocean and atmosphere pCO2 time-series measurements from mooring Stratus_85W_20S (NODC Accession 0100075), Version 3.3, National Oceanographic Data Center, NOAA, Dataset, https://doi.org/10.3334/CDIAC/OTG.TSM_STRATUS_85W_20S, 2012d.
Sutton, A. J., Sabine, C. L., Dietrich, C., Maenner Jones, S., Musielewicz, S., Bott, R., and Osborne, J.: High-resolution ocean and atmosphere pCO2 time-series measurements from mooring TAO125W_0N (NODC Accession 0100076), Version 7.7, National Oceanographic Data Center, NOAA, Dataset, https://doi.org/10.3334/CDIAC/OTG.TSM_TAO125W, 2012e.
Sutton, A. J., Sabine, C. L., Dietrich, C., Maenner Jones, S., Musielewicz, S., Bott, R., and Osborne, J.: High-resolution ocean and atmosphere pCO2 time-series measurements from mooring WHOTS_158W_23N (NODC Accession 0100080), Version 6.6, National Oceanographic Data Center, NOAA, Dataset, https://doi.org/10.3334/CDIAC/OTG.TSM_WHOTS, 2012f.
Sutton, A. J., Sabine, C. L., Dietrich, C., Maenner Jones, S., Musielewicz, S., Bott, R., and Osborne, J.: High-resolution ocean pCO2 time-series measurements from mooring TAO170W_0N in the Equatorial Pacific Ocean from 2005-07-04 to 2016-08-29 (NODC Accession 0100078), Version 8.8, National Oceanographic Data Center, NOAA, Dataset, https://doi.org/10.3334/CDIAC/OTG.TSM_TAO170W_0N, 2012g.
Sutton, A. J., Sabine, C. L., Dietrich, C., Maenner Jones, S., Musielewicz, S., Bott, R., and Osborne, J.: High-resolution ocean pCO2 time-series measurements from mooring TAO155W_0N in the Equatorial Pacific Ocean from 1997-11-14 to 2015-12-12 (NODC Accession 0100084), Version 6.6. National Oceanographic Data Center, NOAA, Dataset, https://doi.org/10.3334/CDIAC/OTG.TSM_TAO155W, 2012h.
Sutton, A. J., Sabine, C. L., Howden, S. D., Musielewicz, S., Maenner Jones, S., Dietrich, C., Bott, R., Osborne, J.: High-resolution ocean and atmosphere pCO2 time-series measurements from mooring CoastalMS_88W_30N in the Coastal Waters of Louisiana and Gulf of Mexico from 2009-05-12 to 2015-03-30 (NODC Accession 0100068), Version 5.5, National Oceanographic Data Center, NOAA, Dataset, https://doi.org/10.3334/CDIAC/OTG.TSM_COASTALMS_88W_30N, 2012i.
Sutton, A. J., Sabine, C. L., Newton, J., Mickett, J., Musielewicz, S., Maenner Jones, S., Dietrich, C., Bott, R., Osborne, J.: High-resolution ocean and atmosphere pCO2 time-series measurements from mooring LaPush_125W_48N in the Pacific Ocean (NODC Accession 0100072), Version 8.8, National Oceanographic Data Center, NOAA, Dataset, https://doi.org/10.3334/CDIAC/OTG.TSM_LAPUSH_125W_48N, 2012j.
Sutton, A. J., Sabine, C. L., Send, U., Ohman, M., Musielewicz, S., Maenner Jones, S., Dietrich, C., Bott, R., Osborne, J.: High-resolution ocean and atmosphere pCO2 time-series measurements from Mooring CCE2_121W_34N (NODC Accession 0084099), Version 6.6, National Oceanographic Data Center, NOAA, Dataset, https://doi.org/10.3334/CDIAC/OTG.TSM_CCE2_121W_34N, 2012k.
Sutton, A. J., Sabine, C. L., Cai, W. -J., Noakes, S., Musielewicz, S., Maenner Jones, S., Dietrich, C., Bott, R., and Osborne, J.: High-resolution ocean and atmosphere pCO2 time-series measurements from mooring GraysRf_81W_31N from 2006-07-18 to 2015-10-15 (NODC Accession 0109904). Version 6.6, National Oceanographic Data Center, NOAA, Dataset, https://doi.org/10.3334/CDIAC/OTG.TSM_GRAYSRF_81W_31N, 2013a.
Sutton, A. J., Sabine, C. L., Dietrich, C., Maenner Jones, S., Musielewicz, S., Bott, R., and Osborne, J.: High-resolution ocean and atmosphere pCO2 time-series measurements from mooring TAO110W_0N (NODC Accession 0112885), Version 6.6, National Oceanographic Data Center, NOAA, Dataset, https://doi.org/10.3334/CDIAC/OTG.TSM_TAO110W, 2013b.
Sutton, A. J., Sabine, C. L., Dietrich, C., Maenner Jones, S., Musielewicz, S., Bott, R., and Osborne, J.: High-resolution ocean and atmosphere pCO2 time-series measurements from mooring TAO165E0N, Pacific Ocean 2010–2017 (NODC Accession 0113238), Version 5.5, National Oceanographic Data Center, NOAA, Dataset, https://doi.org/10.3334/CDIAC/OTG.TSM_TAO165E0N, 2013c.
Sutton, A. J., Sabine, C. L., Musielewicz, S., Maenner Jones, S., Dietrich, C., Bott, R., and Osborne, J.: High-resolution ocean and atmosphere pCO2 time-series measurements from mooring WA_125W_47N in the North Pacific Ocean, US West Coast from 2006-06-23 to 2015-10-30 (NODC Accession 0115322), Version 10.10, National Oceanographic Data Center, NOAA, Dataset, https://doi.org/10.3334/CDIAC/OTG.TSM_WA_125W_47N, 2013d.
2014a Sutton, A. J., Feely, R. A., Sabine, C. L., McPhaden, M. J., Takahashi, T., Chavez, F. P., Friederich, G. E., and Mathis, J. T.: Natural variability and anthropogenic change in equatorial Pacific surface ocean pCO2 and pH, Global Biogeochem. Cy., 28, 131–145, https://doi.org/10.1002/2013GB004679, 2014a.
Sutton, A. J., Sabine, C. L., Andersson, A., Bates, N., Musielewicz, S., Maenner Jones, S., Dietrich, C., Bott, R., and Osborne, J.: High-resolution ocean and atmosphere pCO2 time-series measurements from mooring Crescent_64W_32N, North Atlantic Ocean, 2010–2016 (NODC Accession 0117059), Version 5.5, National Oceanographic Data Center, NOAA, Dataset, https://doi.org/10.3334/CDIAC/OTG.TSM_CRESCENT_64W_32N, 2014b.
Sutton, A. J., Sabine, C. L., Andersson, A., Bates, N., Musielewicz, S., Maenner Jones, S., Dietrich, C., Bott, R., and Osborne, J.: High-resolution ocean and atmosphere pCO2 time-series measurements from mooring Hog_Reef_64W_32N, North Atlantic Ocean, 2010–2016 (NODC Accession 0117060), Version 5.5, National Oceanographic Data Center, NOAA, Dataset, https://doi.org/10.3334/CDIAC/OTG.TSM_HOG_REEF_64W_32N, 2014c.
Sutton, A. J., Sabine, C. L., Dietrich, C., Maenner Jones, S., Musielewicz, S., Bott, R., and Osborne, J.: High-resolution ocean and atmosphere pCO2 time-series measurements from mooring TAO165E8S, south Pacific Ocean, 2009–2013 (NODC Accession 0117073), Version 4.4, National Oceanographic Data Center, NOAA, Dataset, https://doi.org/10.3334/CDIAC/OTG.TSM_TAO165E8S, 2014d.
2014b Sutton, A. J., Sabine, C. L., Maenner-Jones, S., Lawrence-Slavas, N., Meinig, C., Feely, R. A., Mathis, J. T., Musielewicz, S., Bott, R., McLain, P. D., Fought, H. J., and Kozyr, A.: A high-frequency atmospheric and seawater pCO2 data set from 14 open-ocean sites using a moored autonomous system, Earth Syst. Sci. Data, 6, 353–366, https://doi.org/10.5194/essd-6-353-2014, 2014e.
Sutton, A. J., Sabine, C. L., Morell, J. M., Musielewicz, S., Maenner Jones, S., Dietrich, C., Bott, R., and Osborne, J.: High-resolution ocean and atmosphere pCO2 time-series measurements from mooring La_Parguera_67W_18N in the Caribbean Sea (NODC Accession 0117354), Version 6.6, National Oceanographic Data Center, NOAA, Dataset, https://doi.org/10.3334/CDIAC/OTG.TSM_LA_PARGUERA_67W_18N, 2014f.
Sutton, A. J., Sabine, C. L., Newton, J., Mickett, J., Musielewicz, S., Maenner Jones, S., Dietrich, C., Bott, R., and Osborne, J.: High-resolution ocean and atmosphere pCO2 time-series measurements from mooring Dabob_122W_48N (NODC Accession 0116715). Version 7.7, National Oceanographic Data Center, NOAA, Dataset, https://doi.org/10.3334/CDIAC/OTG.TSM_DABOB_122W_478N, 2014g.
Sutton, A. J., Sabine, C. L., Salisbury, J. E., Vandemark, D., Musielewicz, S., Maenner Jones, S., Dietrich, C., Bott, R., and Osborne, J.: High-resolution ocean and atmosphere pCO2 time-series measurements from mooring NH_70W_43N (NODC Accession 0115402), Version 7.7, National Oceanographic Data Center, NOAA, Dataset, https://doi.org/10.3334/CDIAC/OTG.TSM_NH_70W_43N, 2014h.
Sutton, A. J., Sabine, C. L., Trull, T., Dietrich, C., Maenner Jones, S., Musielewicz, S., Bott, R., and Osborne, J.: High-resolution ocean and atmosphere pCO2 time-series measurements from mooring SOFS_142W_46S in the Indian Ocean from 2011-11-24 to 2016-06-17 (NODC Accession 0118546), Version 5.5, National Oceanographic Data Center, NOAA, Dataset, https://doi.org/10.3334/CDIAC/OTG.TSM_SOFS_142W_46S, 2014i.
Sutton, A. J., Sabine, C. L., Feely, R. A., Cai, W.-J., Cronin, M. F., McPhaden, M. J., Morell, J. M., Newton, J. A., Noh, J.-H., Ólafsdóttir, S. R., Salisbury, J. E., Send, U., Vandemark, D. C., and Weller, R. A.: Using present-day observations to detect when anthropogenic change forces surface ocean carbonate chemistry outside preindustrial bounds, Biogeosciences, 13, 5065–5083, https://doi.org/10.5194/bg-13-5065-2016, 2016a.
Sutton, A. J., Sabine, C. L., De Carlo, E. H., Musielewicz, S., Maenner Jones, S., Dietrich, C., Bott, R., and Osborne, J.: High-resolution ocean and atmosphere pCO2 time-series measurements from mooring Alawai_158W_21N (NCEI Accession 0157360), Version 2.2, NOAA National Centers for Environmental Information, Dataset, https://doi.org/10.3334/CDIAC/OTG.TSM_ALAWAI_158W_21N, 2016b.
Sutton, A. J., Sabine, C. L., De Carlo, E. H., Musielewicz, S., Maenner Jones, S., Dietrich, C., Bott, R., and Osborne, J.: High-resolution ocean and atmosphere pCO2 time-series measurements from mooring CRIMP2_158W_21N, North Pacific Ocean, 2008-2016 (NCEI Accession 0157415), Version 4.4, NOAA National Centers for Environmental Information, Dataset, https://doi.org/10.3334/CDIAC/OTG.TSM_CRIMP2_158W_21N, 2016c.
Sutton, A. J., Sabine, C. L., Dietrich, C., Maenner Jones, S., Musielewicz, S., Bott, R., and Osborne, J.: High-resolution ocean and atmosphere pCO2 time-series measurements from mooring Iceland_12W_68N in the North Greenland Sea from 2013-08-16 to 2015-08-15 (NCEI Accession 0157396), Version 4.4, NOAA National Centers for Environmental Information, Dataset, https://doi.org/10.3334/CDIAC/OTG.TSM_Iceland_12W_68N, 2016d.
Sutton, A. J., Sabine, C. L., De Carlo, E. H., Musielewicz, S., Maenner Jones, S., Dietrich, C., Bott, R., and Osborne, J.: High-resolution ocean and atmosphere pCO2 time-series measurements from mooring Kaneohe_158W_21N from 2011-09-30 to 2016-10-10 (NCEI Accession 0157297), Version 3.3, NOAA National Centers for Environmental Information, Dataset, https://doi.org/10.3334/CDIAC/OTG.TSM_KANEOHE_158W_21N, 2016e.
Sutton, A. J., Sabine, C. L., De Carlo, E. H., Musielewicz, S., Maenner Jones, S., Dietrich, C., Bott, R., and Osborne, J.: High-resolution ocean and atmosphere pCO2 time-series measurements from mooring Kilo_Nalu_158W_21N in the North Pacific Ocean (NCEI Accession 0157251), Version 4.4, NOAA National Centers for Environmental Information, Dataset, https://doi.org/10.3334/CDIAC/OTG.TSM_KILO_NALU_158W_21N, 2016f.
Sutton, A. J., Sabine, C. L., Dietrich, C., Maenner Jones, S., Musielewicz, S., Bott, R., and Osborne, J.: High-resolution ocean and atmosphere pCO2 time-series measurements from mooring Mooring BOBOA_90E_15N (NCEI Accession 0162473), Version 2.2, NOAA National Centers for Environmental Information, Dataset, https://doi.org/10.7289/V5H70D1K, 2016g.
Sutton, A. J., Sabine, C. L., Hales, B., Musielewicz, S., Maenner Jones, S., Dietrich, C., Bott, R., and Osborne, J.: High-resolution ocean and atmosphere pCO2 time-series measurements from mooring NH10_124W_44N (NCEI Accession 0157247), Version 2.2, NOAA National Centers for Environmental Information, Dataset, https://doi.org/10.3334/CDIAC/OTG.TSM_NH10_124W_44N, 2016h.
Sutton, A. J., Sabine, C. L., Manzello, D., Musielewicz, S., Maenner Jones, S., Dietrich, C., Bott, R., and Osborne, J.: High-resolution ocean and atmosphere pCO2 time-series measurements from mooring Cheeca_80W_25N (NCEI Accession 0157417), Version 5.5, NOAA National Centers for Environmental Information, Dataset, https://doi.org/10.3334/CDIAC/OTG.CHEECA_80W_25N, 2016i.
Sutton, A. J., Sabine, C. L., Newton, J., Mickett, J., Musielewicz, S., Maenner Jones, S., Dietrich, C., Bott, R., and Osborne, J.: High-resolution ocean and atmosphere pCO2 time-series measurements from mooring Twanoh_123W_47N (NCEI Accession 0157600), Version 2.2, NOAA National Centers for Environmental Information, Dataset, https://doi.org/10.3334/CDIAC/OTG.TSM_TWANOH_123W_47N, 2016j.
Sutton, A. J., Sabine, C. L., Noh, J. -H. Lee, C. M., Musielewicz, S., Maenner Jones, S., Dietrich, C., Bott, R., and Osborne, J.: High-resolution ocean and atmosphere pCO2 time-series measurements from mooring ChuukK1_152E_7N (NCEI Accession 0157443), Version 1.1, NOAA National Centers for Environmental Information, Dataset, https://doi.org/10.3334/CDIAC/OTG.TSM_CHUUKK1_152E_7N, 2016k.
Sutton, A. J., Sabine, C. L., Send, U., Ohman, M., Dietrich, C., Maenner Jones, S., Musielewicz, S., Bott, R., and Osborne, J.: High-resolution ocean and atmosphere pCO2 time-series measurements from mooring CCE1_122W_33N (NCEI Accession 0144245), Version 4.4, NOAA National Centers for Environmental Information, Dataset, https://doi.org/10.3334/CDIAC/OTG.TSM_CCE1_122W_33N, 2016l.
Sutton, A. J., Wanninkhof, R., Sabine, C. L., Feely, R. A., Cronin, M. F., and Weller, R. A.: Variability and trends in surface seawater pCO2 and CO2 flux in the Pacific Ocean, Geophys. Res. Lett., 44, 5627–5636, https://doi.org/10.1002/2017GL073814, 2017.
Sutton, A. J., Feely, R. A., Maenner Jones, S., Musielewicz, S., Osborne, J., Dietrich, C., Monacci, N. M., Cross, J. N., Bott, R., and Kozyr, A.: Autonomous seawater partial pressure of carbon dioxide (pCO2) and pH time series from 40 surface buoys between 2004 and 2017 (NCEI Accession 0173932), Version 1.1, NOAA National Centers for Environmental Information, Dataset, https://doi.org/10.7289/V5DB8043, 2018.
Takahashi, T., Sutherland, S. C., Wanninkhof, R., Sweeney, C., Feely, R. A., Chipman, D. W., Hales, B., Friederich, G., Chavez, F., Sabine, C., Watson, A., Bakker, D. C. E., Schuster, U., Metzl, N., Yoshikawa-Inoue, H., Ishii, M., Midorikawa, T., Nojiri, Y., Körtzinger, A., Steinhoff, T., Hoppema, M., Olafsson, J., Arnarson, T. S., Tilbrook, B., Johannessen, T., Olsen, A., Bellerby, R., Wong, C. S., Delille, B., Bates, N. R., and de Baar, H. J. W.: Climatological mean and decadal change in surface ocean pCO2, and net sea–air CO2 flux over the global oceans, Deep-Sea Res. Pt. II, 56, 554–577, 2009.
Takeshita, Y., Cyronak, T., Martz, T. R., Kindeberg, T., and Andersson, A. J.: Coral reef carbonate chemistry variability at different functional scales, Frontiers in Marine Science, 5, 175, https://doi.org/10.3389/fmars.2018.00175, 2018.
Tiao, G. C., Reinsel, G. C., Xu, D., Pedrick, J. H., Zhu, X., Miller, A. J., DeLuisi, J. J., Mateer, C. L., and Wuebbles, D. J.: Effects of autocorrelation and temporal sampling schemes on estimates of trend and spatial correlation, J. Geophys Res., 95, 20507–20517, 1990.
Wanninkhof, R., Park, G.-H., Takahashi, T., Sweeney, C., Feely, R., Nojiri, Y., Gruber, N., Doney, S. C., McKinley, G. A., Lenton, A., Le Quéré, C., Heinze, C., Schwinger, J., Graven, H., and Khatiwala, S.: Global ocean carbon uptake: magnitude, variability and trends, Biogeosciences, 10, 1983–2000, https://doi.org/10.5194/bg-10-1983-2013, 2013.
Weatherhead, E. C., Reinsel, G. C., Tiao, G. C., Meng, X.-L., Choi, D., Cheang, W.-K., Keller, T., DeLuisi, J., Wuebbles, D. J., Kerr, J. B., Miller, A. J., Oltmans, S. J., and Frederick, J. E.: Factors affecting the detection of trends: Statistical considerations and applications to environmental data, J. Geophys. Res., 103, 17149–17161, 1998.
Weiss, R. F.: Carbon dioxide in water and seawater: the solubility of a non-ideal gas, Mar. Chem., 2, 203–215, 1974.
Weller, R. A.: Variability and trends in surface meteorology and air–sea fluxes at a site off Northern Chile, J. Climate, 28, 3004–3023, https://doi.org/10.1175/JCLI-D-14-00591.1, 2015.
Xue, L., Cai, W.-J., Hu, X., Sabine, C., Jones, S., Sutton, A. J., Jiang, L.-Q., and Reimer, J. J.: Sea surface carbon dioxide at the Georgia time series site (2006–2007): Air–sea flux and controlling processes, Prog. Oceanogr., 140, 14–26, 2016.