
Volatile Organic Compounds in Primary Schools in Ho Chi Minh City, Vietnam: Characterization and Health Risk Assessment


1
Faculty of Technology, Van Lang University, Ho Chi Minh City 700000, Vietnam
2
Institute of Applied Technology, Thu Dau Mot University, Thu Dau Mot City 820000, Binh Duong, Vietnam
*
Author to whom correspondence should be addressed.
Atmosphere 2021, 12(11), 1421; https://doi.org/10.3390/atmos12111421
Submission received: 8 October 2021
/
Revised: 24 October 2021
/
Accepted: 25 October 2021
/
Published: 28 October 2021
(This article belongs to the Topic Assessing Indoor Pollution and Its Impacts on the Human Health)
Abstract
:Limited information about exposure to volatile organic compounds (VOCs) in primary schools in Vietnam is available. In this study, we aimed to characterize indoor VOCs in four primary schools situated in Ho Chi Minh City, a metropolis in the south of Vietnam and assess health risks linked to the students’ exposure to VOCs. Indoor and outdoor air samples were collected in the schools and analyzed for volatile composition using gas chromatography coupled with mass spectrometry. Different classes of VOCs, including aromatic hydrocarbons, alkanes, aldehydes, esters, cyclic terpenes, and chlorinated hydrocarbons, were identified and quantified in classrooms of the schools. The results showed that the concentrations of the VOCs differed significantly among the schools and between ground-floor and first floor classrooms. In addition, VOC profiles differed considerably between air-conditioned and non-air-conditioned classrooms. Limonene, a compound associated with fragrance products, was the most abundant VOC, with the median (range) concentration of 26.12 (10.29, 50.08) μg/m3. The concentrations of the compounds examined in the study were in general found to be higher indoors compared with outdoors, signifying indoor emission sources. Potential harmful effects are expected as a result of exposure to benzene, ethylbenzene, naphthalene, 1,4-dichlorobenzene and tetrachloroethylene in the investigated schools. Further research is needed to fully assess the health risks to students, teachers, and staff in these educational environments.
1. Introduction
There are approximately 8.5 million students in primary education in Vietnam [1]. Primary students usually spend 5–9 h per day and five days per week in schools. This highlights significant exposure to indoor air in such educational environments. Recently, research revealed children’s exposure to volatile toxicants, such as benzene, toluene, ethylbenzene, and xylenes (BTEX), in preschools located in the north of Vietnam [2]. Due to the children’s considerable time spent in the presence of toxicants in schools, studies on the determination of indoor volatile organic compounds (VOCs) in schools are necessary.
There is intense interest in investigations related to chemical exposure in educational settings and its impacts on the health of young students. For example, Kim et al. (2007) revealed a link between students’ asthmatic symptoms and the presence of microbial VOCs and plasticizers in primary schools [3]. Similarly, poor air quality found in some classrooms of primary schools in France likely accounted for an increased prevalence of asthma and rhinitis among schoolers [4]. Sofuoglu et al. (2011) reported risks of exposure to highly toxic and carcinogenic VOCs, such as formaldehyde and benzene derivatives, in three primary schools located in Turkey [5]. Wang et al. (2016) assessed exposure to chlorinated hydrocarbons in primary schools near an oil refinery plant in Taiwan [6]. There is much evidence to show that these VOCs may cause eye and nose irritation, liver, or kidney damages [7]. Limonene, used as an ingredient of numerous consumer products, and its reactive degradants may cause airway inflammation and irritation [8]. Reportedly, acute exposure to formaldehyde often released from rigid polyurethane foams, adhesives and inks can lead to eye, skin, and throat irritation while chronic exposure was linked to certain types of cancer [9]. A quantitative study showed that exposure to this aldehyde was positively correlated with children’s asthma [10]. Oxidative stress associated with children’s exposure to BTEX, often emitted from gasoline or used as solvents in cleaning agents and paint thinners, was recently observed [11]. Additionally, a recent review commenting on children’s health effects linked to ambient air pollution indicated that volatile constituents in gasoline or diesel exhausts are associated with an elevated risk of childhood leukemia [12]. Toxicants in the air have also been shown to have negative impacts on performance in reading, math, and science among primary schoolers in the US [13]. At these ages, primary school children are distinctively susceptible to air pollution because their organs are developing and they breath more air per body weight.
Despite growing awareness of environmental threats to children due to VOC exposure, very limited data about indoor air quality in primary schools in Vietnam is available. Previous research has mainly focused on a few volatile pollutants, such as BTEX, nitrogen oxide and carbon dioxide, in childcare facilities and primary schools in Hanoi [2,14]. Beyond these, no data about other volatile pollutants, such as chlorinated hydrocarbons, have been investigated. To our knowledge, information about indoor air quality in schools has not been collected in Ho Chi Minh City (HCMC), the most populous area, which often ranks high in air pollution. The aims of the present study were to characterize and quantify the monitored VOCs in four primary schools located in HCMC and assess the health risks of VOC exposure.
2. Materials and Methods
2.1. Sample Collection and VOC Analysis
In the present study, indoor air quality of classrooms at four primary schools located in HCMC were investigated. Building characteristics, locations relative to low/high traffic or industrial areas, and levels of cleaning supplies used in the schools were taken into consideration to evaluate their impacts on the indoor air quality. The information about building characteristics and locations of the schools was provided in Table S1 (Supplementary data). Ho Chi Minh City has a tropical climate characterized by dry and rainy seasons, with the temperature varying slightly (22–35 °C) throughout the year.
All the air samples were collected during class sessions (7:00 AM–3:45 PM) at the schools with the aid of the Department of Education and Training of HCMC. Air samples were collected in eight classrooms for first grade to third grade. An air sampling pump (224-PCXR8, SKC Inc., Eighty Four, PA, USA) connected with a pre-cleaned sampling tube was set up at a representative spot in the classroom or hallway outside of the room. The sample tube used in the study was packed with layers of sorbent material (Tenax-TA/Carboxen-1000/Carbosieve) and positioned at 1.2 m above the floor (near the heights of children’s noses). The air sampling was conducted by pumping air through the tube at 0.1 L/min for 5 h. After sampling, the tube was disconnected from the pump, carefully stored at −18 °C and analyzed within 72 h.
The analysis of VOCs in air samples was conducted using a CDS 7550S thermal desorption unit (CDS, Oxford, PA, USA). The system was connected to an Agilent 7890B gas chromatograph coupled with a 5977A quadrupole mass spectrometer (Agilent Technologies, Santa Clara, CA, USA). The characterization and identification of VOCs were conducted following the method previously described by Vu et al. (2018) with minor modifications [15]. The list of VOCs screened in the study was provided in Table S2 (Supplementary data). The quantification was based on calibration curves constructed from six concentration points (1.0, 5.0, 10.0, 25.0, 50.0, 100.0 μg/mL) of the standard solutions. The linear regression successfully fitted all the calibration data with correlation coefficients (R2) ranging between 0.96 and 0.99. Estimates for the recovery rate of the analytical method were made by injecting 1 μL of a standard solution (25 μg/mL) containing targeted compounds into a sampling tube. Average recovery rates above 85% were observed for all the analytes. Background contamination was taken into consideration by using field blank and laboratory blank samples. The breakthrough phenomenon was examined by using a secondary sorbent tube and the results showed that none of the VOCs of interest were detected in the secondary tubes.
2.2. Health Risk Assessment
The risks to children’s health posed by volatile pollutants in the primary schools were estimated. In this study, chronic exposure to VOCs potentially resulting in cancer or other health issues was focused. Based on the U.S. Environmental Protection Agency (EPA) method, the adverse health effects related to inhalation exposure to toxic VOCs for non-cancer and cancer risks in the studied schools were addressed. The Risk Assessment Guidance for Superfund Volume I: Human Health Evaluation Manual–Part F was used for the health risk assessment process [16].
2.3. Statistical Analyses
The gas chromatography-mass spectrometry data generated from the VOC analysis were processed using MassHunter (Agilent Technologies, Santa Clara, California, USA). Non-parametric Kruskal–Wallis test was employed to unravel spatial variations in the VOC profile of the schools. A significant level of p < 0.05 was used in the statistical tests. Box plots prepared by Minitab 19 (State College, Pennsylvania, USA) were applied to visualize the differences in VOC levels at the schools, displaying 25th and 75th percentiles, minimum and maximum values. Minitab 19 was also used to perform all the statistical analyses.
3. Results and Discussion
3.1. Indoor Concentrations of VOCs
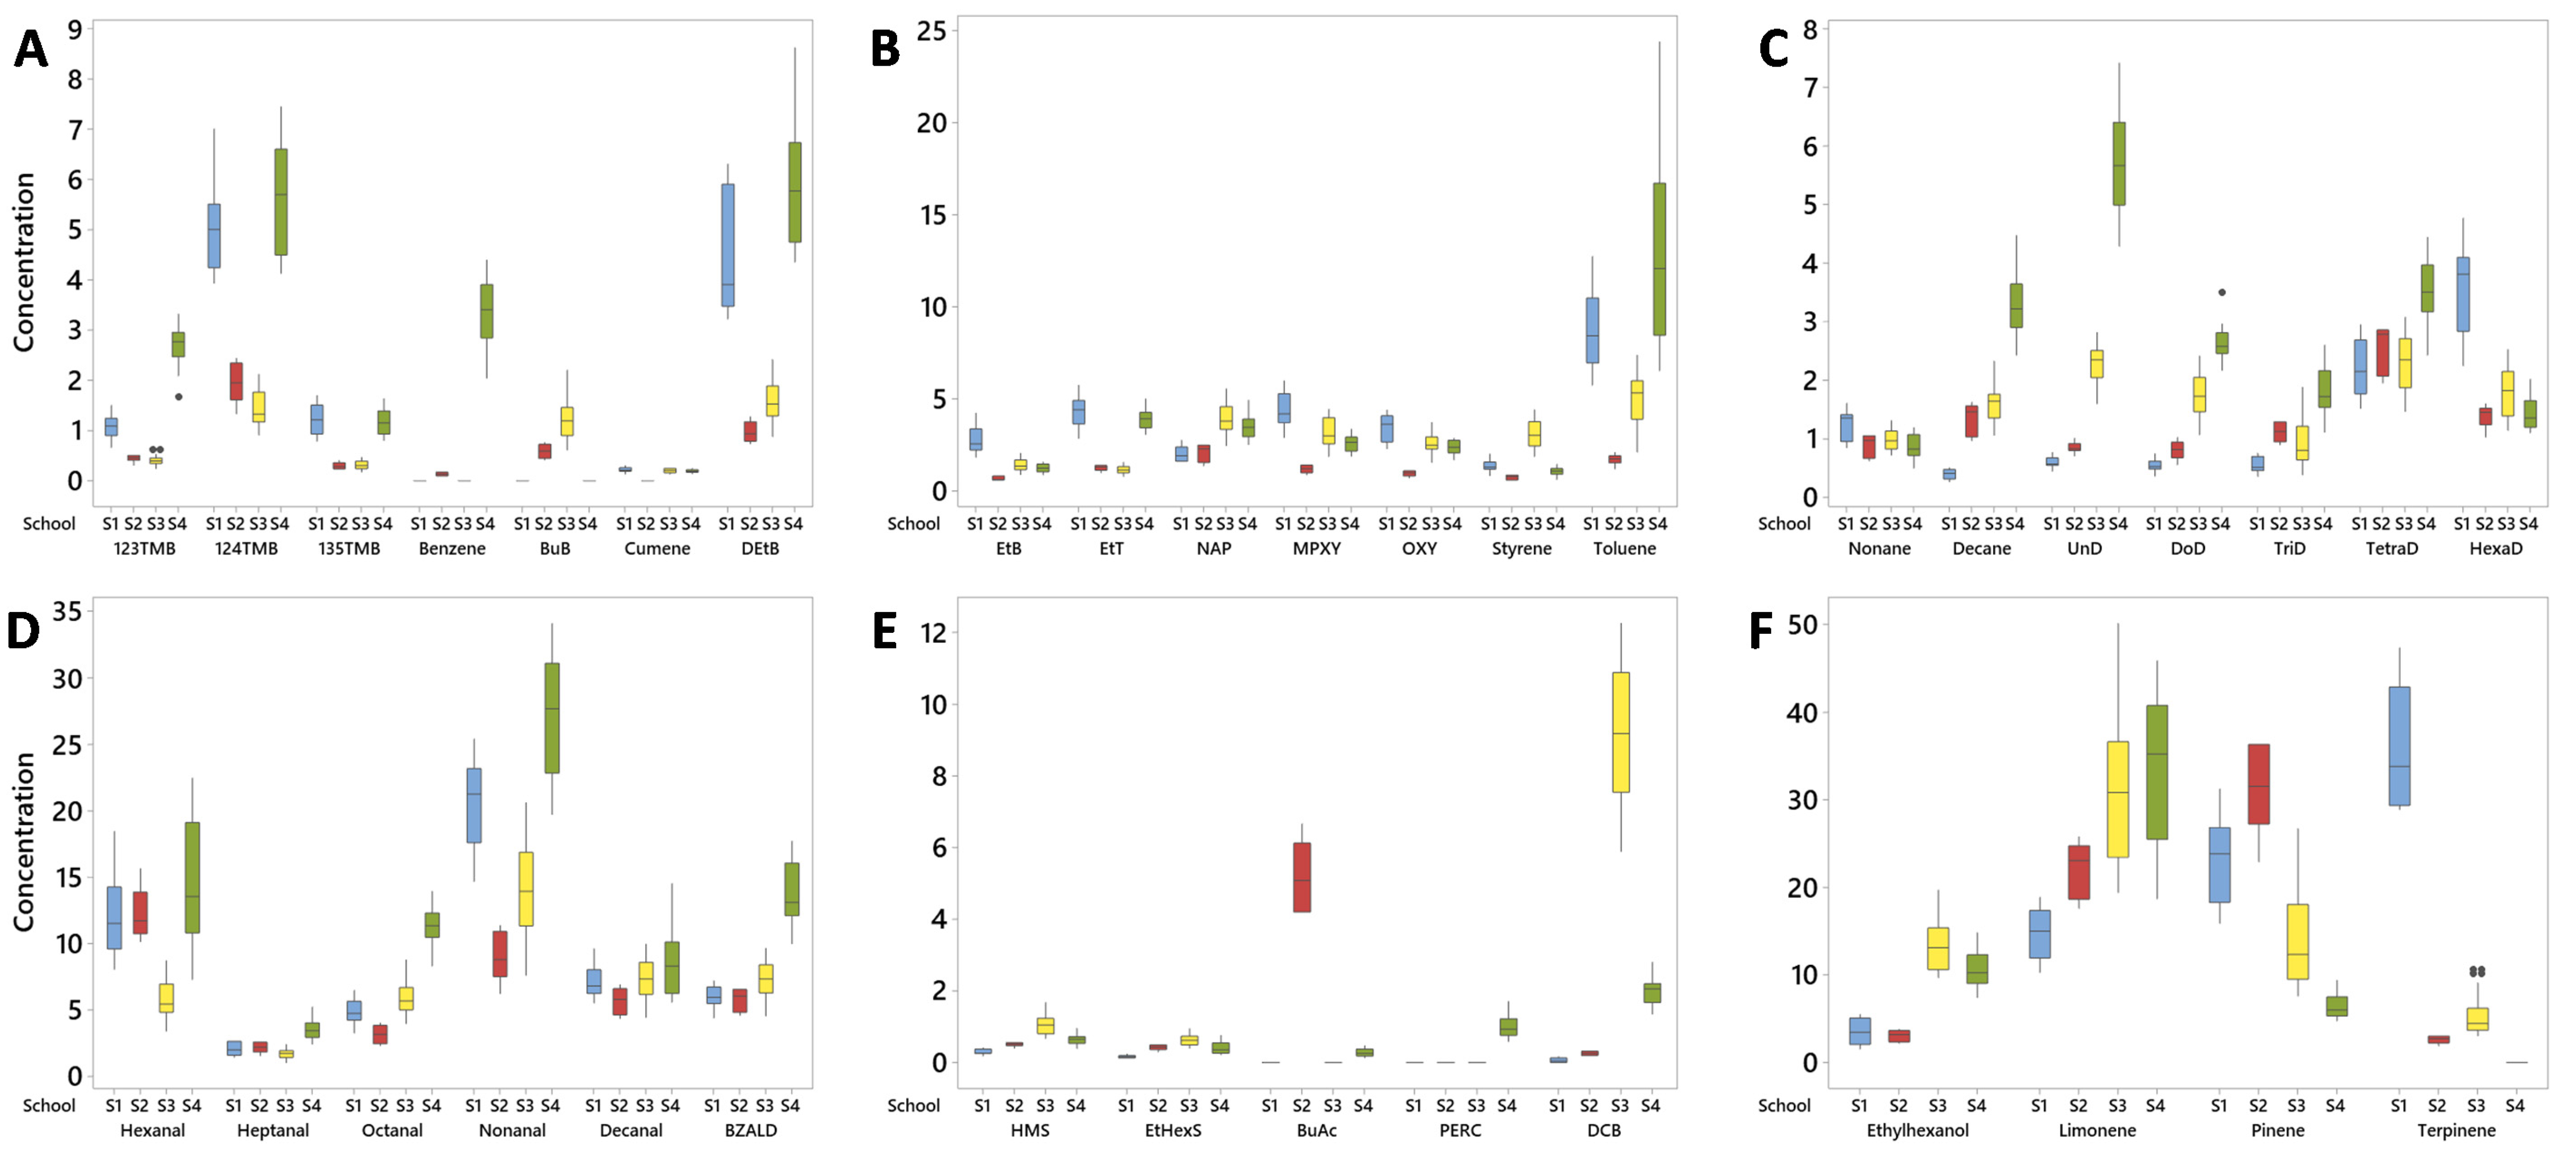
In total, 60 air samples were successfully collected from the ten classrooms during the fourth quarter of the year 2020. The results demonstrated the presence of 41 VOCs in the classrooms of the four examine primary schools. These compounds, including aromatic hydrocarbons, alkanes, cyclic monoterpenes, aldehydes, esters, and chlorinated hydrocarbons, were characterized by comparing their mass spectra with those of commercially available analytical standards and National Institute for Standard and Technology (NIST) mass spectral database. Figure 1 depicts the concentrations of the VOCs in box plot form. Furthermore, the VOC profiles of the schools were compared using the non-parametric Kruskal–Wallis test. The results indicated their concentrations differed significantly among the schools (Table S3, Supplementary data).
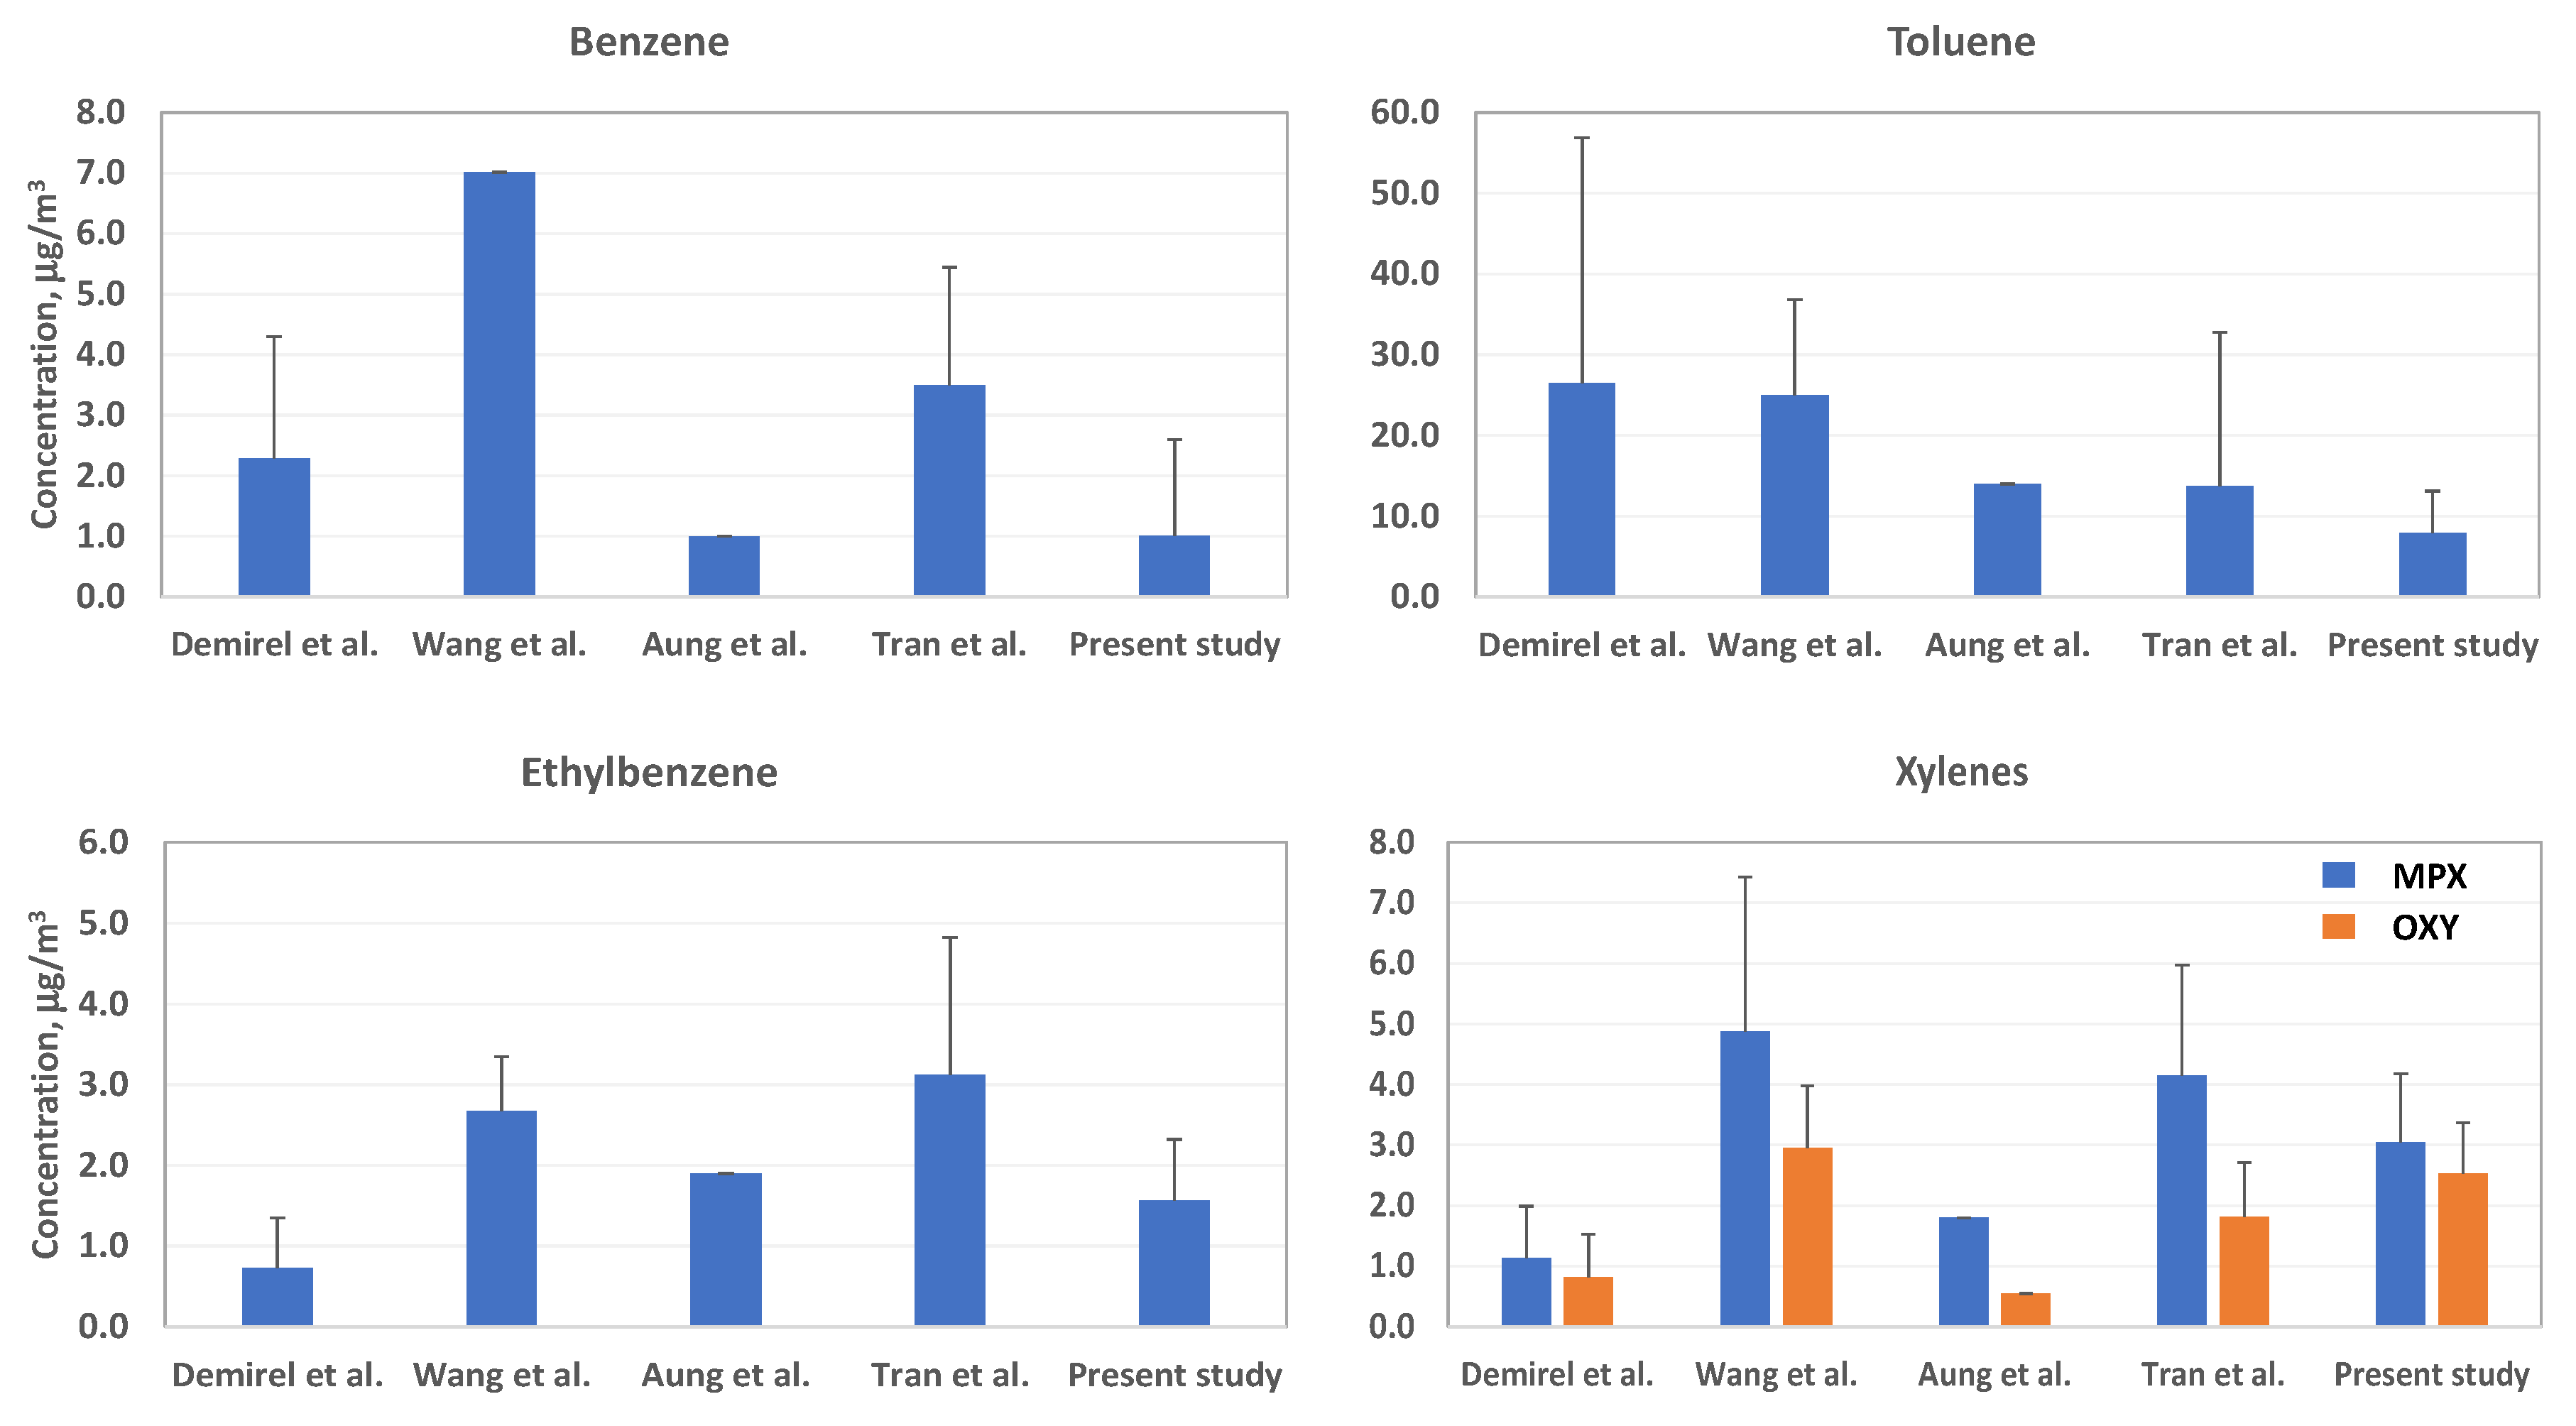
Aromatic hydrocarbons. With exceptions of benzene, n-butylbenzene, and cumene, the compounds of this group were detected in all the air samples (Figure 1A,B). Toluene was identified as one of the most abundant compounds monitored in all the air samples, with the concentrations widely ranging between 1.21 and 24.37 μg/m3. This aromatic hydrocarbon predominated over the others in the schools S1 and S4, which can be due to minor renovations these two schools underwent during the air sampling time. Its concentrations were also found to vary considerably among the schools, with the median concentrations following the order: S4 > S1 > S3 > S2. Previously, toluene was reported to be among the dominant compounds in elementary schools in Asia [6,17]. In Vietnam, while no data about toluene in primary schools are available, the presence of this compound with indoor levels ranging from 1.59 to 63.40 μg/m3 in preschools was recently revealed [2]. Similar to toluene, trimethylbenzenes, diethylbenzenes, and ethyltoluenes were detected at higher levels in S1 and S4 compared with the other schools. The median levels of these VOCs in S4 were at least 3 times as high as those in S2 and S3. Benzene was found only in S2 and S4 at median concentrations of 0.14 and 3.41 μg/m3, respectively. Along with benzene and toluene, ethylbenzene, and xylenes (also known as BTEX) were frequently investigated to assess the indoor air quality of educational environments. Therefore, the data about these aromatic hydrocarbons in the present study were pooled and mean concentrations of BTEX components were used to compare with those reported in prior research. Of these, the BTEX information reported by Tran et al. (2020) was for preschools in Vietnam while the others were observed for primary schools in Myanmar, Taiwan, and Turkey [2,6,18,19]. As seen in Figure 2, BTEX levels in the present study were lower than those documented by Wang et al. (2016) in Taiwan [6]. In general, comparable results were noted among the studies conducted in Vietnam and Myanmar. In comparison with the investigation by Demirel et al. (2014) [19], our study presented higher levels of ethylbenzene and xylenes but considerably lower levels of benzene and toluene. A factor contributing to the presence of BTEX in schools is their proximity to gas stations, traffic roads or oil refineries. In addition, plants may have a capacity to release these VOCs. Uses of oil-based lubricants, adhesives, air sampling, and VOC analytical methods can affect BTEX levels.
Alkanes. Our study showed the detection of seven alkanes (i.e., acyclic saturated hydrocarbons), including nonane, decane, undecane, dodecane, tridecane, tetradecane, and hexadecane, in all the schools (Figure 1C). Median concentrations of the alkanes, excluding nonane and hexadecane, were found highest in S4. This may be due to this school’s location which is close to traffic roads or commercial sources (Table S1, Supplementary data). Indeed, these alkanes can often be found in petroleum-based products, such as fuels, organic solvents, paints, and detergents [20].
Aldehydes. Benzaldehyde and alkanals, including hexanal, heptanal, octanal, nonanal and decanal, were present in all the investigated schools, with median concentrations measured in S4 substantially higher than in the other schools (Figure 1D). Reportedly, these compounds are widely used as solvents in paint removers, lacquers or ingredients of perfume or cosmetics. For most of the schools, nonanal was found to preponderate over the other alkanals, with concentrations falling within the range from 8.80 to 27.66 μg/m3. Previous research showed that nonanal was found at a concentration of 2.3 μg/m3 in a primary school located in Myanmar [18]. The highest concentration of nonanal was 16.0 μg/m3, which was observed for childcare centers in California, USA [21]. It was shown that an abundance of alkanals in indoor air positively correlated with the use of air fresheners [21]. The median concentration of benzaldehyde in S4 was found about 80–120% higher than those in the other schools. Benzaldehyde is often used as a component in cosmetics and in natural fruit flavors [22]. This aromatic aldehyde is also plant-derived VOC and emission of this compound is often indicative of volatile communication of plants to insect.
Esters. The list of VOCs detected in the air samples also includes three esters, namely homomenthyl salicylate (HMS), 2-ethylhexyl salicylate (EtHexS), and butyl acetate (Figure 1E). The former two VOCs were present in all the schools, with median concentrations found highest in S3 (1.05 and 0.62 μg/m3, respectively). These salicylates are widely used chemicals in sunscreens and skin care products due to their ability to absorb ultraviolet light. Butyl acetate was detected in only S2 and S4, with the median concentration in the former 20 times as high compared with the latter.
Terpenes. Three cyclic terpenes (limonene, pinene and terpinene) were found with different distributions among the schools. The median concentrations of limonene followed the order: S4 > S3 > S2 > S1. As displayed in Figure 1F, S4 (35.24 μg/m3) had twice as much of limonene as S1 (15.01 μg/m3). The median concentrations of pinene were found to be highest in S2 (31.53 μg/m3) while the figures for terpinene were in S1 (33.82 μg/m3). Notably, no detection of terpinene was documented in S4 during the period of sampling time. These VOCs are often used to help impart citrus or pine scents in cleaning products and air fresheners [23]. They also occur more commonly in nature; for example, terpenes can be emitted from various plant parts to provide a way for plants to communicate with the environment.
Chlorinated hydrocarbons. The results also yielded evidence of tetrachloroethylene (PERC) and 1,4-dichlorobenzene (DCB) (Figure 1E). PERC was present only in S4 with the median (range) concentration of 0.93 (0.58, 1.70) μg/m3. No studies on indoor air quality in educational facilities conducted previously in Vietnam reported the presence of this compound. PERC can have endocrine-disrupting effects and is classified as a probable human carcinogen. The chemical is known to be an effective dry-cleaning solvent and is often used in dry-cleaning shops in Vietnam. The presence of PERC observed only in S4 can be linked to emission sources of this compound in proximity of the school. DCB was found in all the schools, with the median concentration in S3 found to be highest (9.18 μg/m3). This compound is commonly used as an active ingredient of toilet deodorizers in Vietnam. The variations in DCB concentrations among the schools may be due to differences in use frequency of deodorizers.
3.2. Comparison with the Literature
There have been few studies reporting a wide range of VOCs beyond BTEX in educational facilities. In this section, a comparison of these VOCs among the studies was made to provide a better understanding of their emission sources. As shown in Table 1, the previous studies reported trimethylbenzenes were detected at lower concentrations. In addition, the presence of these compounds resulted from vehicle-associated emission [21]. Naphthalene was previously found at comparable concentrations and linked to the use of consumer cleaning products. Styrene reflecting emissions from decorative materials, computers or printers was found at lower concentrations in a study conducted by Godwin and Batterman (2006) [24]. The presence of alkanes was documented in three of the prior studies, with concentrations comparable with those in the present study. Alkanals were shown to be present at concentrations approximating to the present study [21]. Terpenes are often monitored in indoor air partly due to their frequent uses in fragrance products [25,26]. Of these, limonene has often been identified as one of the most abundant VOCs in schools and attracted much attention regarding its health concerns [27]. The present study revealed that the compound had the median (range) concentration of 26.12 (10.29, 50.08) μg/m3. In regard to 1,4-dichlorobenzene, the present study recorded that the maximum level of this compound was 12.24 μg/m3, much higher than those reported previously, and this may be due to its high use frequency as discussed earlier.
3.3. Correlation Analysis and Group Distribution
In this study, we examined the Spearman correlation matrices to evaluate the relationships between VOCs. The results showed that multiple aromatic hydrocarbons had positive correlations with each other (r > 0.4, Table S4, Supplementary data). The strongest correlation estimated was between diethylbenzenes and toluene (r = 0.88, p < 0.0001). Likewise, the strongest correlation among the alkanes was between undecane and dodecane (r = 0.90, p < 0.0001) (Table S5, Supplementary data). As expected, HMS and EtHexS were found to be positively correlated, with r = 0.84 (p < 0.0001) denoting the strongest correlation among the aldehydes, alcohol, and terpenes (Table S6, Supplementary data).
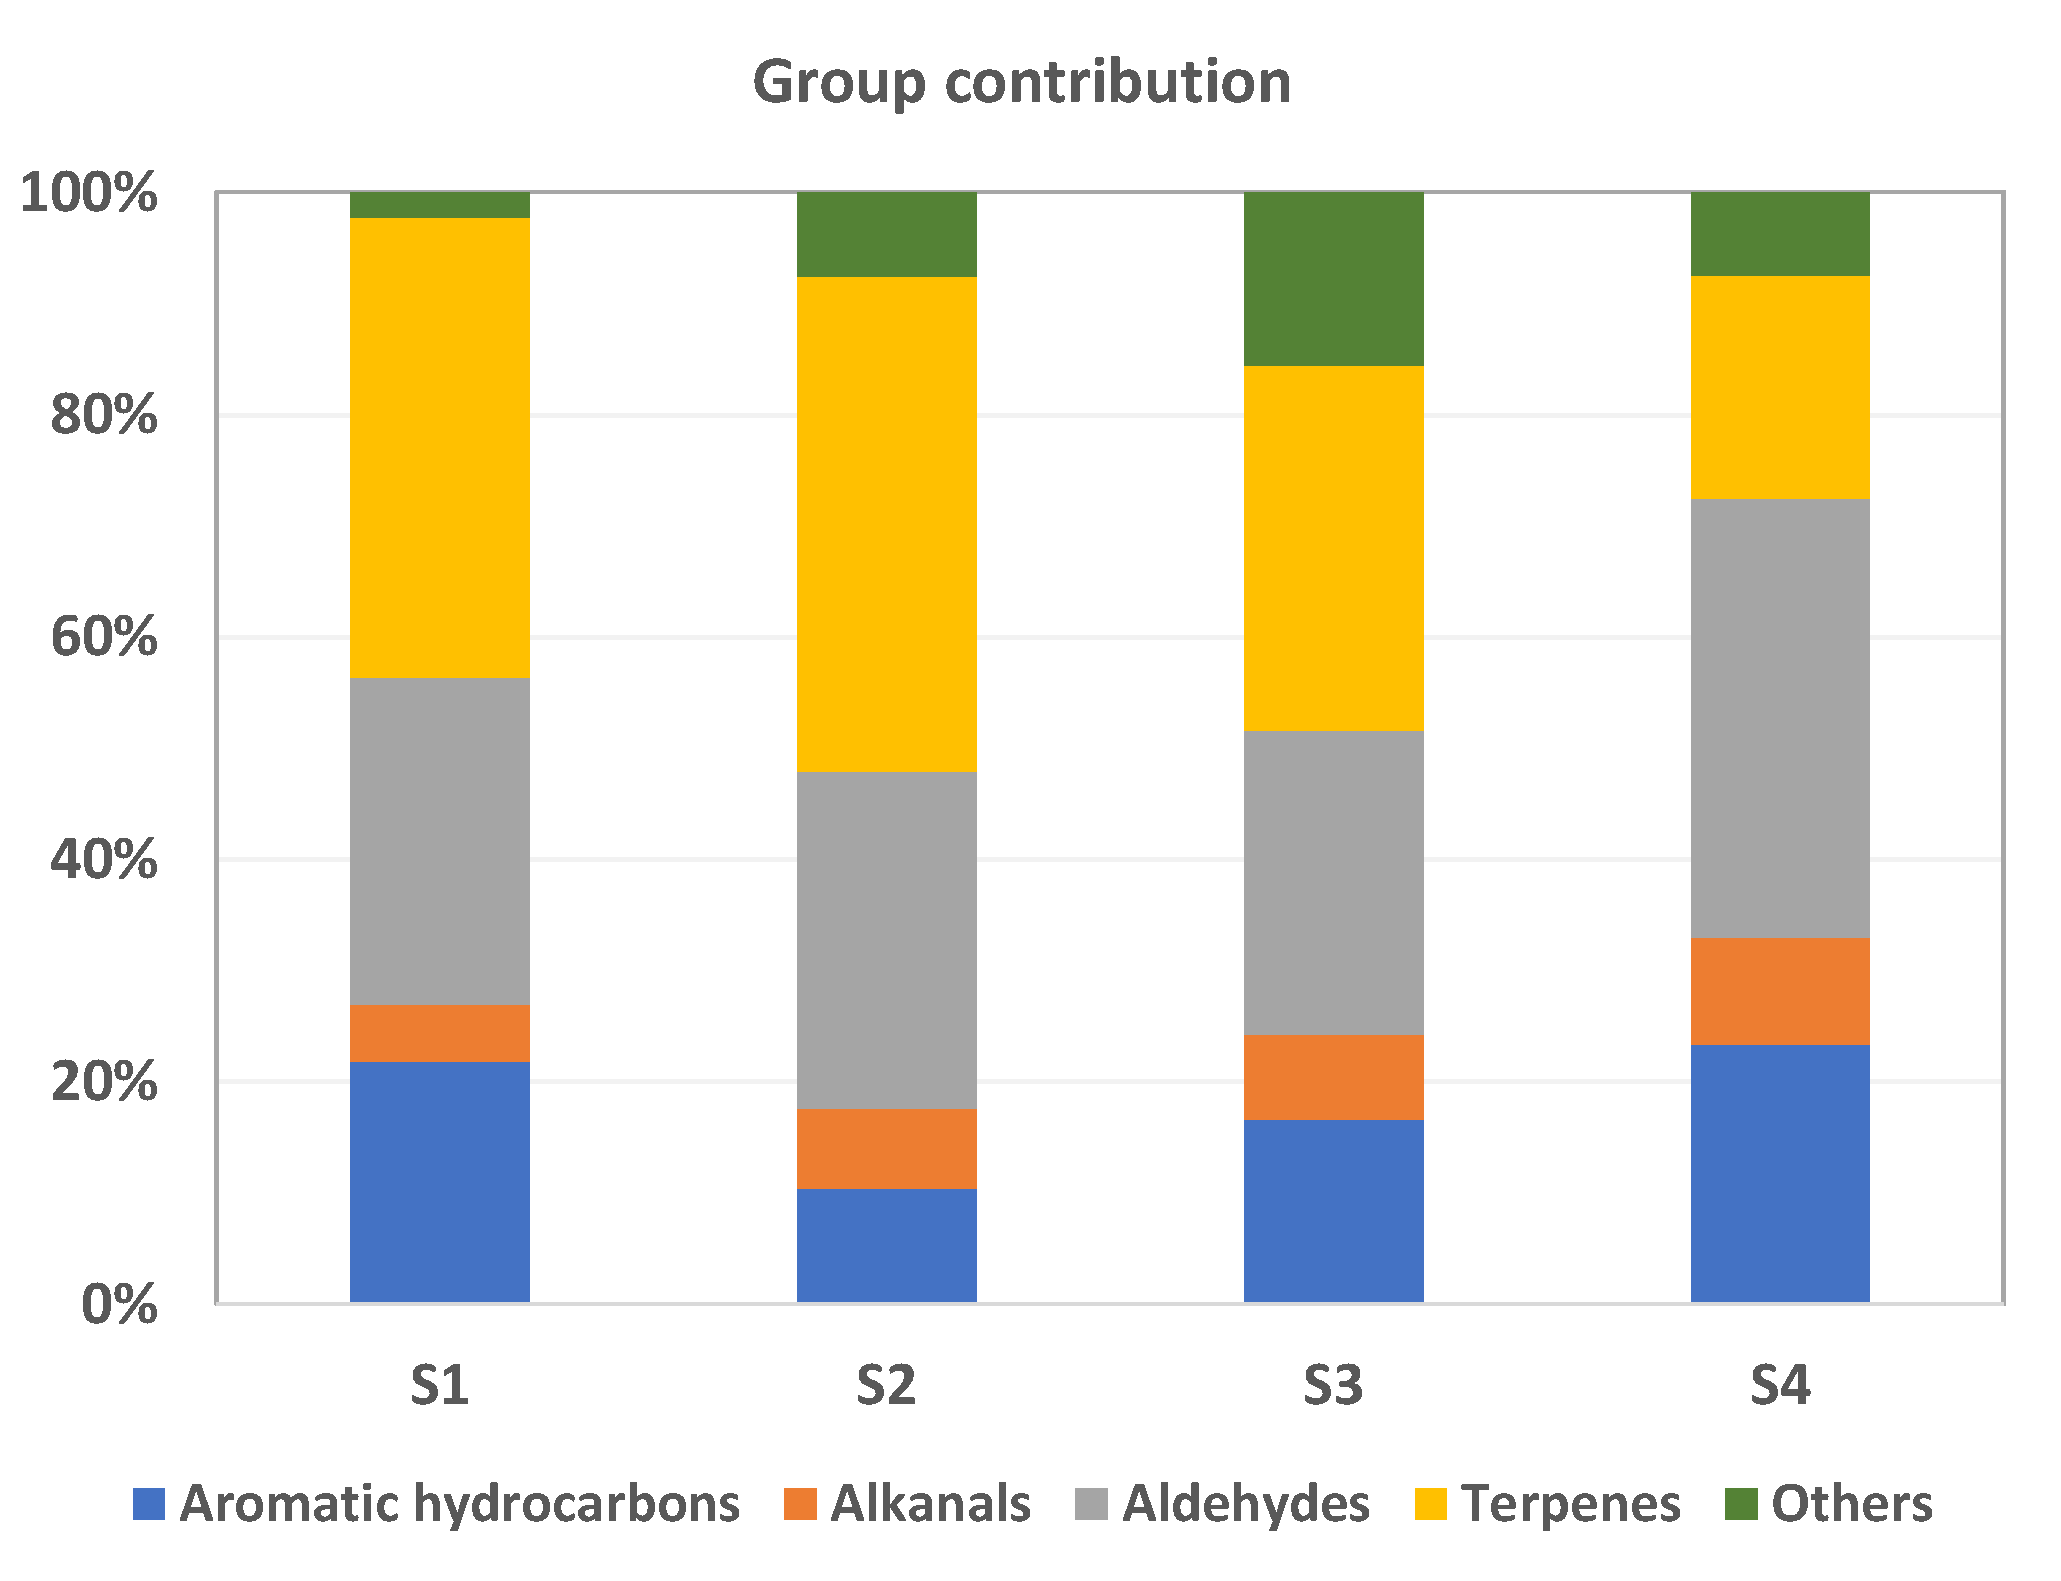
In the present study, the contribution of each group (aromatic hydrocarbons, alkanes, alkanals, aldehydes and others) to the total amount of VOCs was estimated to assess determinants of exposure to VOCs. As depicted in Figure 3, the aromatic hydrocarbon group comprised 10.4–23.3% and alkanes accounted for 5.1–9.6% of the total VOCs. Notably, aldehydes with the contribution percentage ranging from 27.4 to 39.5% were the most abundant group in S4 while terpenes (20.1–44.6%) predominated over the other groups of VOCs in S1, S2, and S3.
3.4. Variations in VOC Compositions among Classroom Types
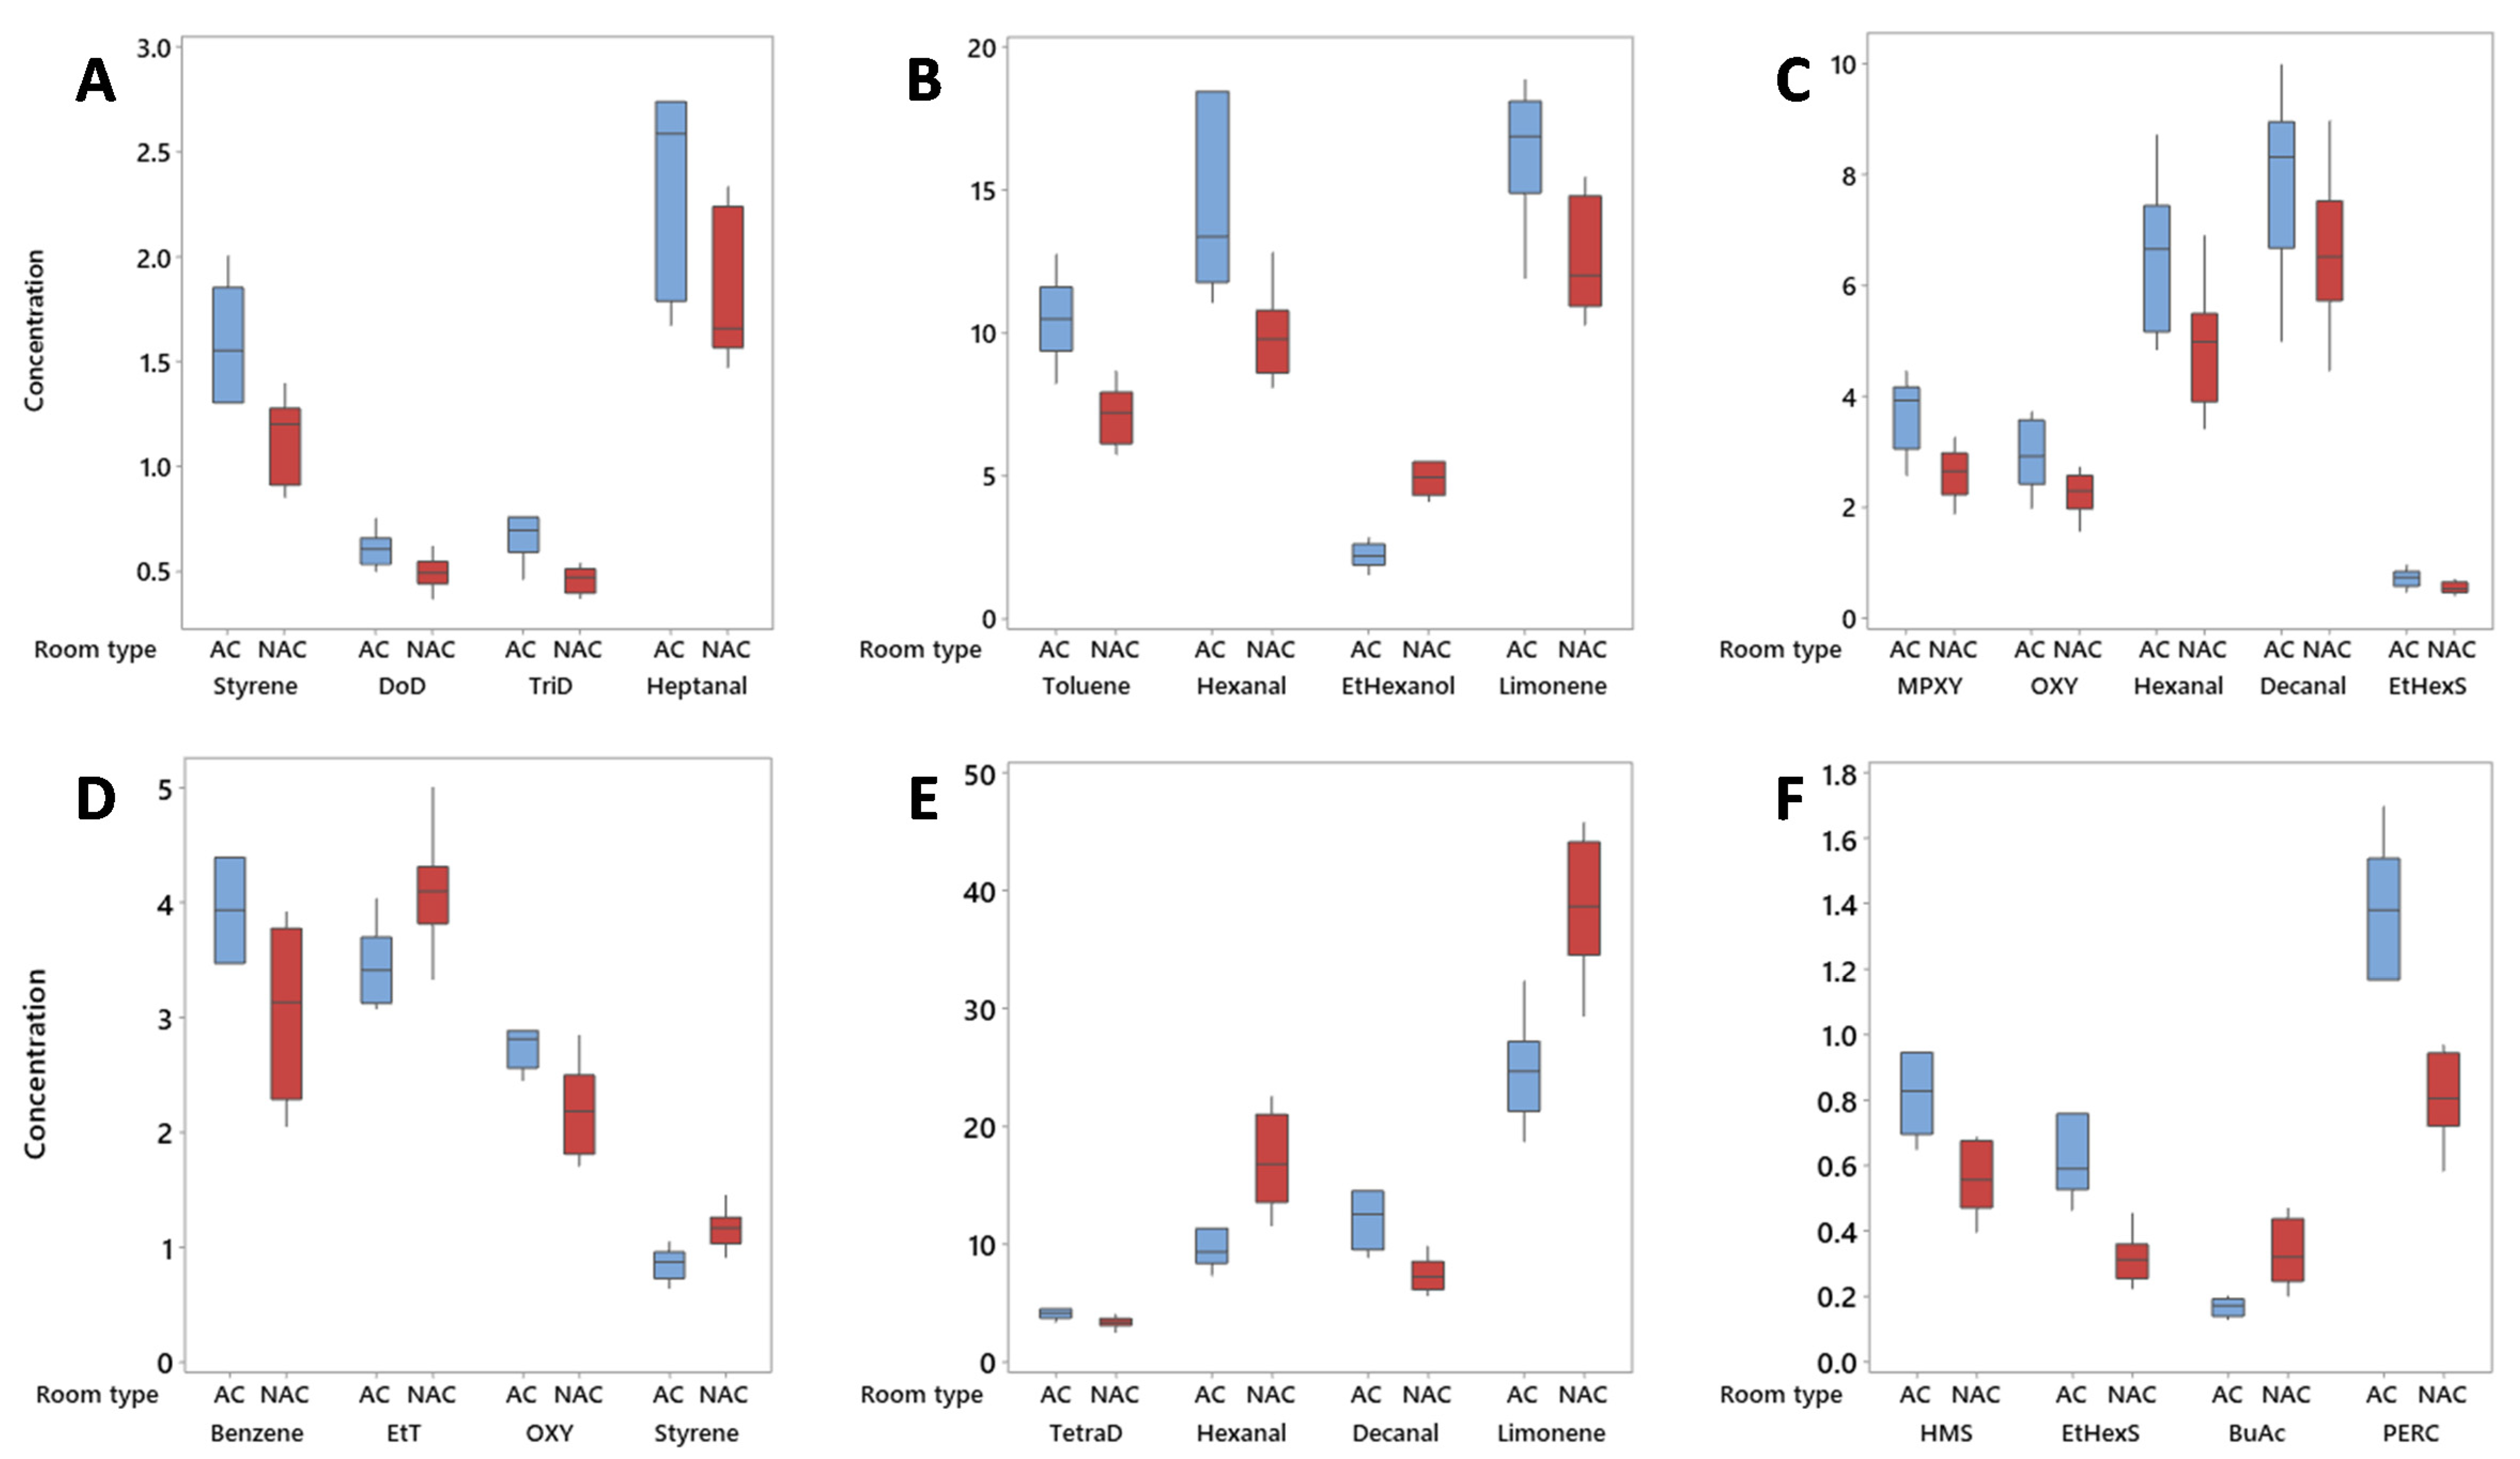
Several works have focused on indoor air quality of classrooms equipped with air conditioners or ceiling fans [14,31]. In general, these reports have not examined differences in VOC profiles among classrooms. In the present study, we compared the levels of VOCs in the air samples collected in air-conditioned (AC) and non-air-conditioned (NAC) classrooms by applying a non-parametric Mann–Whitney U test. It is noted that both types of room are installed with ceiling fans and no ventilation openings. Among the schools, S1, S3, and S4 have both classroom types. In S1, eight VOCs, including styrene, toluene, hexanal, heptanal, dodecane, tridecane, 2-ethylhexanol, and limonene had the concentrations measured in AC and NAC rooms varying significantly (Figure 4A,B). In this school, the number of air samples collected in each room type was six. We observed that the median concentration of 2-ethylhexanol in the NAC room was about twice as much as that in the AC room. Conversely, the median concentrations of all the other compounds were found 20–60% higher in AC compared and those in the NAC room. In S3, the two room types differed significantly on the concentrations of xylenes, hexanal, decanal, and 2-ethylhexyl salicylate (Figure 4C) and the median concentrations of these VOCs were found 27–48% higher in AC room. With respect to S4, twelve compounds were present at concentrations varying significantly between the two room types (Figure 4D–F). Notably, of these, ethyltoluenes, styrene, hexanal, limonene, and butyl acetate did not follow the same trend as those observed in S3. Their median concentrations were found to be 20–88% higher in NAC than those in the AC room. This suggests the presence of emission sources of these compounds (e.g., plywood furniture and/or fragrance products) in or near the NAC room. For most of the cases, rooms installed with air conditioners tended to have higher VOC levels compared with rooms without air conditioners. It is important to note that during class sessions, when the air conditioners were turned on, windows of the AC rooms were all closed to reduce ventilation rates that can ensure cooling efficiency. In contrast, windows of the NAC rooms were often left open to enhance ventilation rates, creating a comfortable study space. Prior studies demonstrated that reduced ventilation rates often caused higher levels of VOCs emitted from indoor sources [5,32,33]. Furthermore, a combination of ceiling fan and ventilation openings, which is tantamount to the NAC rooms in the present study, can result in intense air movement, evenly-distributed indoor temperature and improvement in indoor air quality [34]. These points may explain the variations in VOC levels observed in the present study.
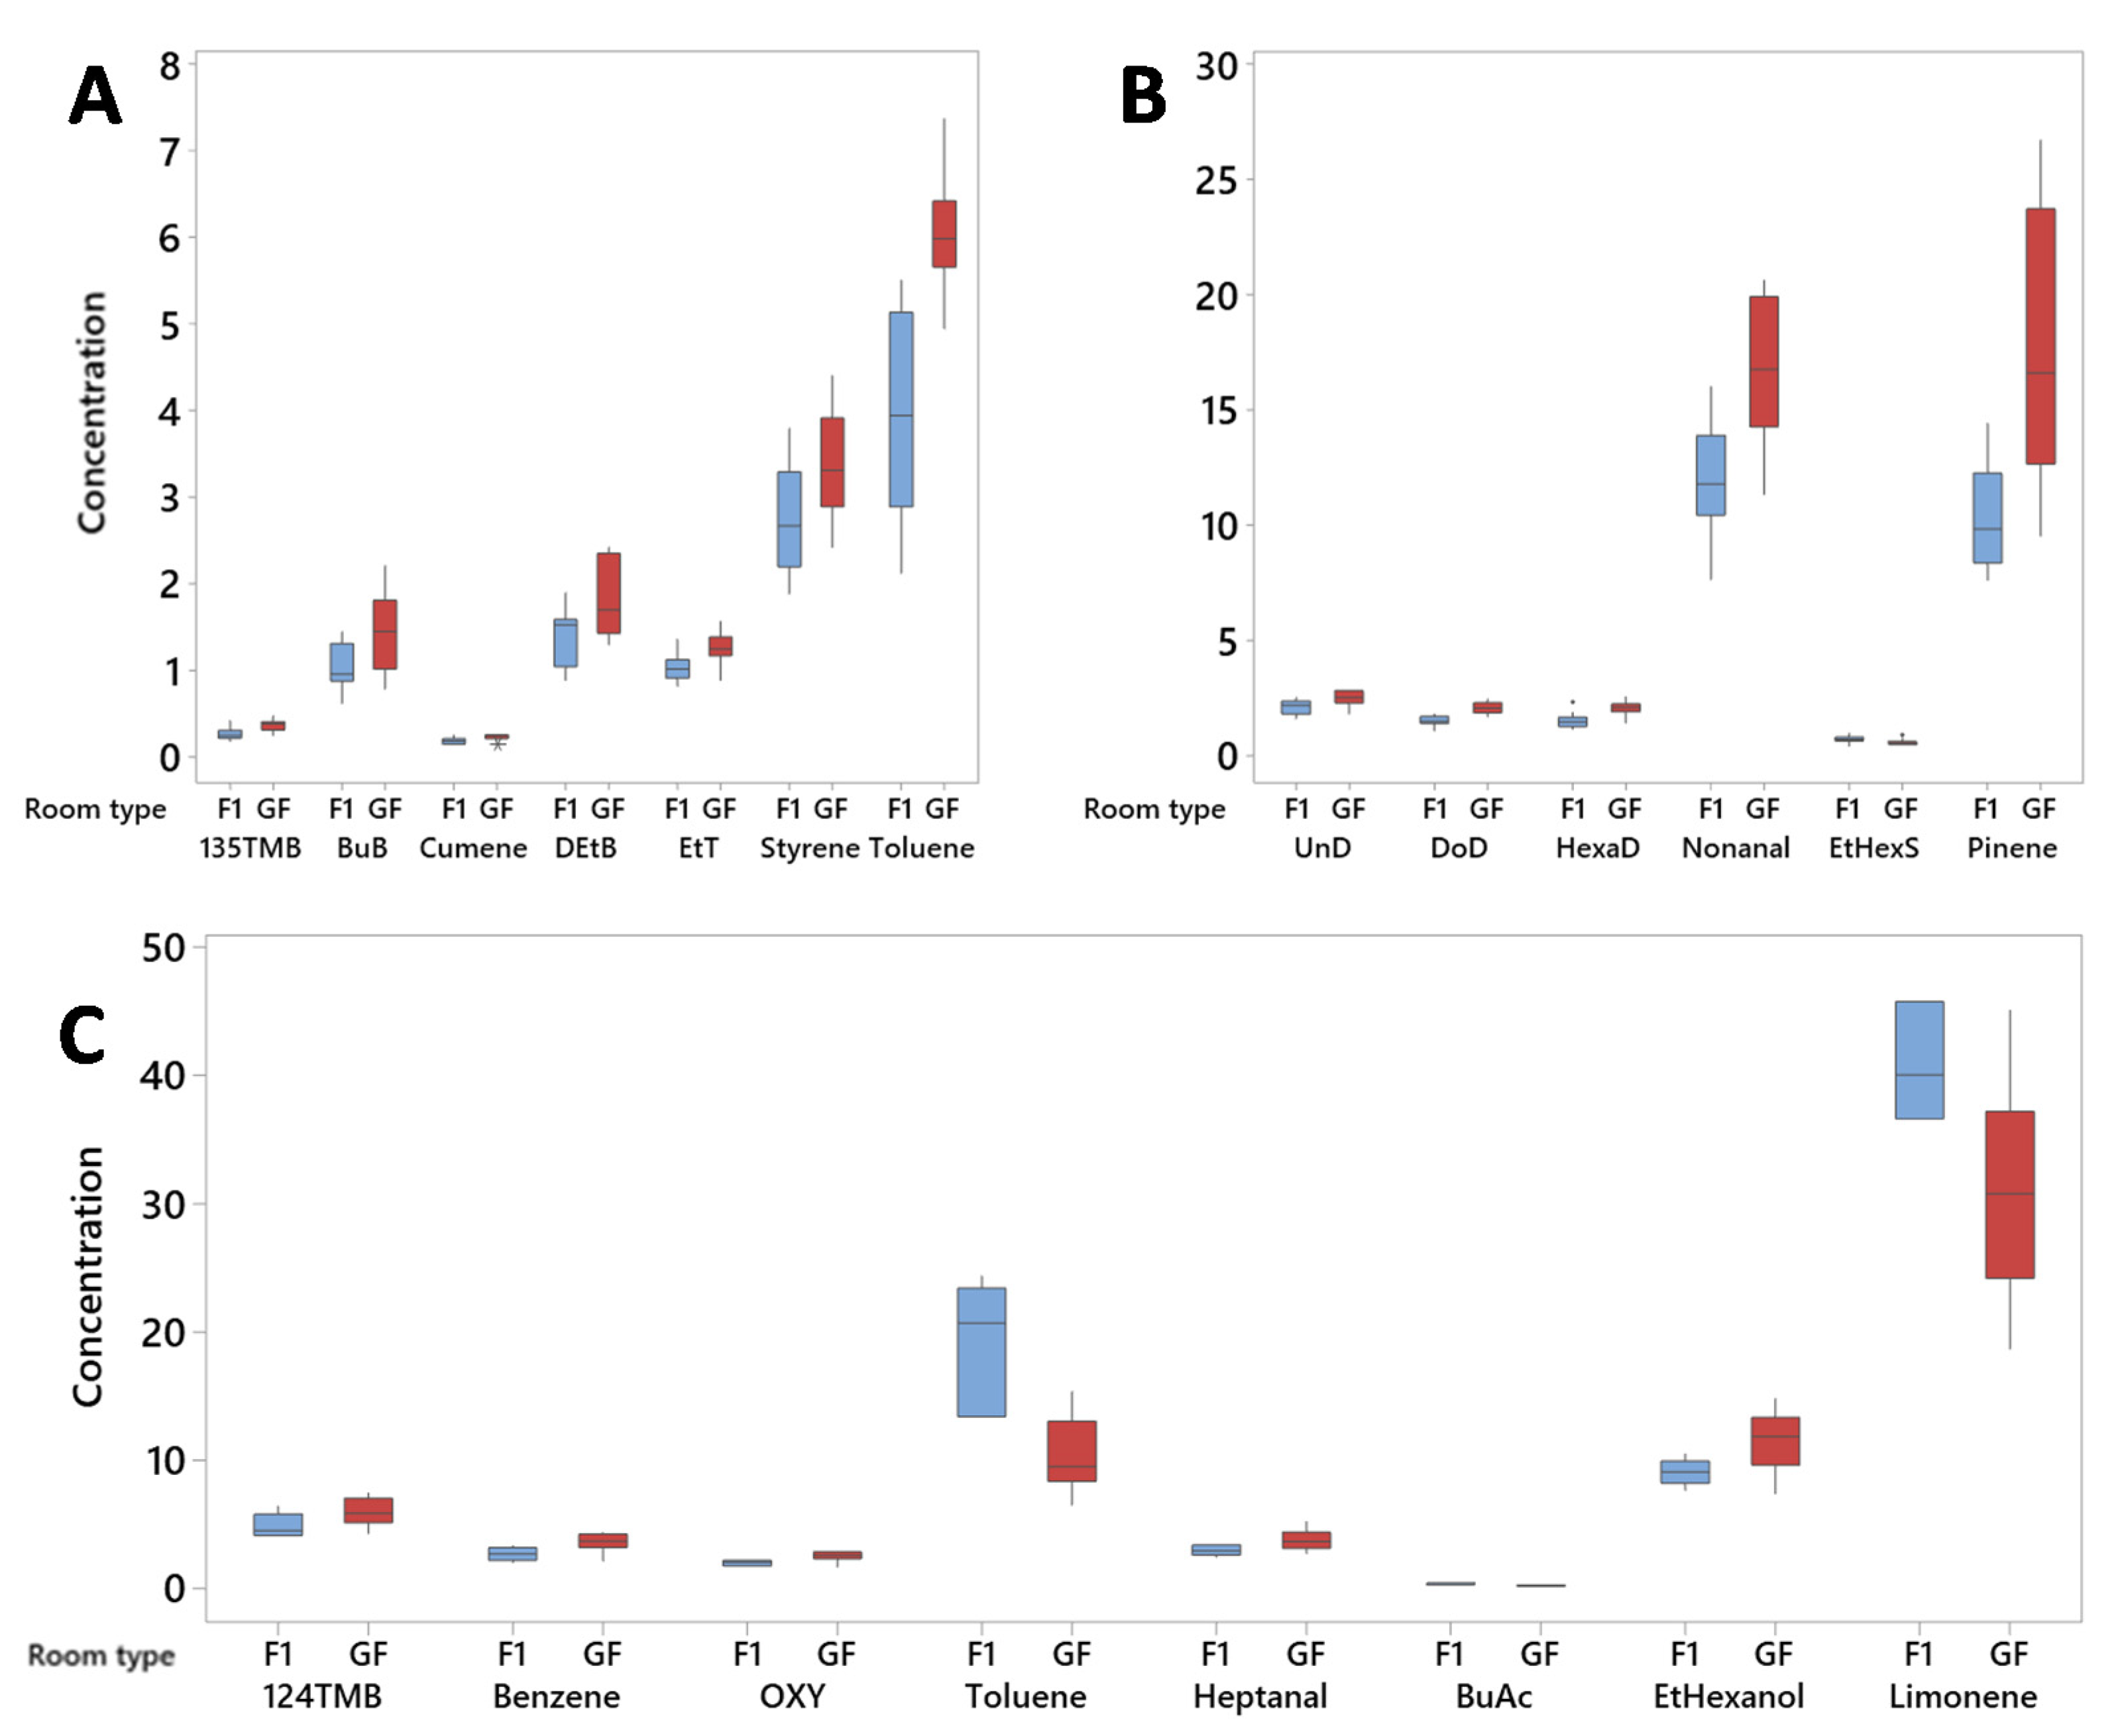
Similarly, we investigated the differences in VOC levels between classrooms located either on the ground floor (GF) or first floor (F1) and the results are graphically presented in Figure 5. In total, twelve indoor air samples per type of classroom were collected in S3. Thirteen VOCs were found with the concentrations varying significantly between GF and F1 in this school (Figure 5A,B). Regarding S4, twelve GF and six F1 samples were collected, showing eight compounds with significantly different concentrations between the two rooms (Figure 5C). The results indicated that the VOCs detected in GF rooms often had higher median concentrations in F1 rooms. Prior research into indoor air quality in multilevel classrooms showed that concentrations of indoor air pollutants followed a decreasing trend with an increase in floor height [35]. The explanation for this can be attributed to higher air exchange rates in F1 rooms compared with GF rooms. It can also be due to cleaning supplies, solvents and air fresheners often stored on GF area of the schools. However, unlike the pattern observed, toluene and limonene in S4 were more abundant in F1 samples. This may be due to the renovation activity enabling the use of toluene emission sources (e.g., oil-based paints) as described in the earlier section. Regarding limonene, this suggests the presence of fragrance products (e.g., air fresheners) in or near an F1 room. Based on our data, limited use and proper storage of consumer cleaning products as well as remodeling of classrooms by installing appropriate ventilation to improve indoor air quality in primary school buildings should be considered.
3.5. Indoor-to-Outdoor Ratios of the VOCs
The ratios of indoor to outdoor concentrations (I/O) of VOCs are often used to evaluate emission sources of VOCs in buildings. In this study, the I/O values were computed and presented in Table 2. The results indicated that about 84% of aromatic hydrocarbons had higher concentrations indoors than outdoors, with the I/O values observed for all the schools ranging from >1 to >100, pointing out influential indoor sources for these compounds. Conversely, the figures for benzene and butylbenzene in S1 and cumene in S2 were lower than 1, hinting that outdoor sources may affect the indoor air composition. Naphthalene, a possible carcinogen, was detected with comparatively high I/O values in S1, S3, and S4. Toluene often identified as a component of oil-based paints and adhesives consistently had slightly higher indoor concentrations in all the schools. The I/O values calculated for aldehydes, esters, and terpenes widely ranged between >1 and >500, indicating indoor sources were predominant for these compounds. The results showed that the I/O value for PERC in S4 was <1 and this can be explained by emission sources related to a dry-cleaning business nearby the school (Table S1).
3.6. Health Risk Assessment
In this study, we made the estimates for non-cancer risk based on the data about trimethylbenzenes, benzene, butylbenzene, cumene, ethylbenzene, naphthalene, styrene, toluene, xylenes, butyl acetate, DCB, and PERC. Among these, benzene, ethylbenzene, naphthalene, DCB, and PERC were further assessed for their carcinogenic risks. In detail, the calculation of non-cancer and cancer risks for the inhalation pathway was provided in Equations (S7)–(S9) (Supplementary data). Information about the exposure parameter and toxicity values used for the calculation was shown in Tables S7 and S8 (Supplementary data). The hazard quotient is an important approach in risk assessment of air toxicants. It is defined as the ratio of the potential exposure to a chemical and the concentration at which no adverse effects occur [16]. In the present study, the total non-cancer risk quantified by the sum of the hazard quotients for students in each primary school was lower than 1 (Table 3), and therefore signifies negligible hazard. With respect to the cancer risk, the assessment is shown as a lifetime risk, denoting the risk of developing cancer resulting from exposure to the VOCs detected over a normal lifetime of 70 years. As seen in Table 3, the cancer risk values obtained for ethylbenzene and PERC in all the schools were lower than 10−6. In contrast, the values for naphthalene were all found to be higher than 10−6, ranging from 3.22 (in S1) to 6.35 (in S3). The cancer risk values for students exposed to benzene and DCB in S4 exceeded 10−6. Along with S4, S3 was the facility that showed a high cancer risk of exposure to DCB. The total cancer risk estimated for exposure to all the five VOCs stated above in each school was found to be greater than 10−6, this is indicative of potentially harmful effects as a result of VOC exposure in the investigated schools. It should be noted that the risk assessment was likely underestimated due to several reasons: (1) the VOCs without toxicity values currently available in the literature were excluded in the risk assessment, (2) the students in the present study were likely exposed to these chemicals in other locations and via exposure scenarios other than the inhalation pathway, and (3) synergistic or antagonistic effects resulting from VOC exposure were unknown.
4. Conclusions
This work is the first to investigate VOC exposure in schools situated in a metropolitan area in the south of Vietnam. Different classes of VOCs present in four primary schools located in Ho Chi Minh City, Vietnam, were characterized. The concentrations of the compounds varied significantly among the schools and between classroom types. The VOCs examined in the study were generally found to have higher concentrations indoors than outdoors. The VOCs associated with fragrance products were found to be the most abundant compounds in the indoor samples. The exposure to benzene, ethylbenzene, naphthalene, DCB, and PERC in the investigated primary schools indicated that potentially harmful effects were occurring. Our findings provide critical information for policymakers and educational professionals to alleviate the adverse health effects associated with indoor VOCs present in school buildings. Additional research is needed to better understand health risks to students, teachers, and staff in the schools due to exposure to the other chemicals without toxicological data. Meanwhile, appropriate ventilation and uses of deodorizers and odorants should be considered to improve indoor air quality in schools.
Supplementary Materials
The following are available online at https://www.mdpi.com/article/10.3390/atmos12111421/s1, Table S1: Building and classroom characteristics, Table S2: List of VOCs monitored in this study, Table S3. Comparison of VOC profile among the schools using the Kruskal-Wallis test, Table S4. Spearman rank correlation coef-ficients for aromatic hydrocarbons, Table S5. Spearman rank correlation coefficients for alkanes, Table S6. Spearman rank correlation coefficients for aldehydes, esters and terpenes, Table S7. Exposure parameter values. Table S8. Toxicity values.
Author Contributions
Conceptualization, D.C.V.; methodology, D.C.V.; validation, K.H.L. and Q.T.N.; formal analysis, K.H.L., Q.T.N. and X.T.V.; investigation, K.H.L., Q.T.N. and X.T.V.; data curation, K.H.L. and Q.T.N.; writing—original draft preparation, K.H.L., D.C.V. and Q.T.N.; writing—review and editing, K.H.L., D.C.V. and Q.T.N.; supervision, K.H.L.; project administration, K.H.L.; funding acquisition, K.H.L. All authors have read and agreed to the published version of the manuscript.
Funding
The study was supported by The Youth Incubator for Science and Technology Program, managed by Youth Development Science and Technology Center—Ho Chi Minh Communist Youth Union and Department of Science and Technology of Ho Chi Minh City, the contract number is 26/2020/HĐ-KHCNT-VƯ.
Institutional Review Board Statement
Not applicable.
Informed Consent Statement
Not applicable.
Data Availability Statement
The data generated or analyzed during the study are included in the article and its supplementary data file.
Conflicts of Interest
The authors declare no conflict of interest.
Abbreviations
| 123TMB | 1,2,3-trimethylbenzene |
| 124TMB | 1,2,4-trimethylbenzene |
| 135TMB | 1,3,5-trimethylbenzene |
| BuB | butyl benzene |
| DEtB | diethylbenzenes |
| EtB | ethylbenzene |
| EtT | ethyltoluenes |
| NAP | naphthalene |
| MPXY | m/p-xylenes |
| OXY | o-xylene |
| UnD | undecane |
| DoD | dodecane |
| TriD | tridecane |
| TetraD | tetradecane |
| HexaD | hexadecane |
| BZALD | benzaldehyde |
| HMS | homomenthyl salicylate |
| EtHexS | 2-ethylhexyl salicylate |
| BuAc | butyl acetate |
| PERC | tetrachloroethylene |
| DCB | 1,4-dichlorobenzene |
References
- Ministry of Education and Training (MOET). Vietnam Education and Training 2019. Available online: https://moet.gov.vn/content/tintuc/Lists/News (accessed on 20 August 2021).
- Tran, T.D.; Nguyen, T.X.; Nguyen, H.T.T.; Vo, H.T.L.; Nghiem, D.T.; Le, T.H.; Dao, D.S.; Van Nguyen, N. Seasonal Variation, Sources, and Health Risk Assessment of Indoor/Outdoor BTEX at Nursery Schools in Hanoi, Vietnam. Water Air Soil Pollut. 2020, 231, 1–18. [Google Scholar] [CrossRef]
- Kim, J.-L.; Elfman, L.; Mi, Y.; Wieslander, G.; Smedje, G.; Norbäck, D. Indoor molds, bacteria, microbial volatile organic compounds and plasticizers in schools: Associations with asthma and respiratory symptoms in pupils. Indoor Air 2007, 17, 153–163. [Google Scholar] [CrossRef]
- Annesi-Maesano, I.; Hulin, M.; Lavaud, F.; Raherison, C.; Kopferschmitt, C.; de Blay, F.; Charpin, D.A.; Denis, C. Poor air quality in classrooms related to asthma and rhinitis in primary schoolchildren of the French 6 Cities Study. Thorax 2012, 67, 682–688. [Google Scholar] [CrossRef] [PubMed] [Green Version]
- Sofuoglu, S.C.; Aslan, G.; Inal, F.; Sofuoglu, A. An assessment of indoor air concentrations and health risks of volatile organic compounds in three primary schools. Int. J. Hyg. Environ. Health 2011, 214, 36–46. [Google Scholar] [CrossRef] [PubMed] [Green Version]
- Wang, Y.-C.; Lin, C.; Lin, Y.-K.; Wang, Y.-F.; Weng, W.-H.; Kuo, Y.-M. Characteristics and determinants of ambient volatile organic compounds in primary schools. Environ. Sci. Process. Impacts 2016, 18, 1458–1468. [Google Scholar] [CrossRef] [PubMed]
- Environmental Protection Agency (EPA). Volatile Organic Compounds’ Impact on Indoor Air Quality. Available online: https://www.epa.gov/indoor-air-quality-iaq/volatile-organic-compounds-impact-indoor-air-quality (accessed on 22 July 2021).
- Hansen, J.S.; Nørgaard, A.W.; Koponen, I.K.; Sørli, J.B.; Paidi, M.D.; Hansen, S.W.K.; Clausen, P.A.; Nielsen, G.D.; Wolkoff, P.; Larsen, S.T. Limonene and its ozone-initiated reaction products attenuate allergic lung inflammation in mice. J. Immunotoxicol. 2016, 13, 793–803. [Google Scholar] [CrossRef]
- Daisey, J.M.; Angell, W.J.; Apte, M.G. Indoor air quality, ventilation and health symptoms in schools: An analysis of existing information. Indoor Air 2003, 13, 53–64. [Google Scholar] [CrossRef] [PubMed]
- McGwin Jr, G.; Lienert, J.; Kennedy Jr, J.I. Formaldehyde exposure and asthma in children: A systematic review. Environ. Health Persp. 2010, 118, 313–317. [Google Scholar] [CrossRef] [PubMed] [Green Version]
- Rafiee, A.; Delgado-Saborit, J.M.; Sly, P.D.; Amiri, H.; Hoseini, M. Exploring urinary biomarkers to assess oxidative DNA damage resulting from BTEX exposure in street children. Environ. Res. 2022, 203, 111725. [Google Scholar] [CrossRef]
- Brumberg, H.L.; Karr, C.J. Ambient Air Pollution: Health Hazards to Children. Pediatrics 2021, 147. [Google Scholar] [CrossRef] [PubMed]
- Grineski, S.E.; Collins, T.W.; Adkins, D.E. Hazardous air pollutants are associated with worse performance in reading, math, and science among US primary schoolchildren. Environ. Res. 2020, 181, 108925. [Google Scholar] [CrossRef]
- Le, H.A.; Linh, V.T.Q. Investigation of Indoor and Outdoor Air Quality at Elementary Schools in Hanoi, Vietnam. VNU J. Sci. Earth Environ. Sci. 2020, 36. [Google Scholar] [CrossRef]
- Vu, D.C.; Ho, T.L.; Vo, P.H.; Carlo, G.; McElroy, J.A.; Davis, A.N.; Nagel, S.C.; Lin, C.-H. Determination of volatile organic compounds in child care centers by thermal desorption gas chromatography-mass spectrometry. Anal. Methods 2018, 10, 730–742. [Google Scholar] [CrossRef]
- Environmental Protection Agency (EPA). Risk Assessment Guidance for Superfund (RAGS): Part F. 2009. Available online: https://www.epa.gov/risk/risk-assessment-guidance-superfund-rags-part-f (accessed on 10 May 2021).
- Byun, H.; Ryu, K.; Jang, K.; Bae, H.; Kim, D.; Shin, H.; Chu, J.; Yoon, C. Socioeconomic and personal behavioral factors affecting children’s exposure to VOCs in urban areas in Korea. J. Environ. Monitor. 2010, 12, 524–535. [Google Scholar] [CrossRef] [PubMed]
- Aung, W.-Y.; Noguchi, M.; Yi, E.-E.P.-N.; Thant, Z.; Uchiyama, S.; Win-Shwe, T.-T.; Kunugita, N.; Mar, O. Preliminary assessment of outdoor and indoor air quality in Yangon city, Myanmar. Atmos. Pollut. Res. 2019, 10, 722–730. [Google Scholar] [CrossRef]
- Demirel, G.; Özden, Ö.; Döğeroğlu, T.; Gaga, E.O. Personal exposure of primary school children to BTEX, NO2 and ozone in Eskişehir, Turkey: Relationship with indoor/outdoor concentrations and risk assessment. Sci. Total Environ. 2014, 473, 537–548. [Google Scholar] [CrossRef]
- Lagoudi, A.; Loizidou, M.; Asimakopoulos, D. Volatile organic compounds in office buildings: 2. Identification of pollution sources in indoor air. Indoor Built Environ. 1996, 5, 348–354. [Google Scholar] [CrossRef]
- Hoang, T.; Castorina, R.; Gaspar, F.; Maddalena, R.; Jenkins, P.L.; Zhang, Q.Z.; McKone, T.E.; Benfenati, E.; Shi, A.Y.; Bradman, A. VOC exposures in California early childhood education environments. Indoor Air 2016, 27, 609–621. [Google Scholar] [CrossRef] [PubMed]
- Andersen, A. Final report on the safety assessment of benzaldehyde. Int. J. Toxicol. 2006, 25, 11–27. [Google Scholar] [PubMed]
- Bennett, D.; Apte, M.; Wu, X.; Trout, A.; Faulkner, D.; Maddalena, R.; Sullivan, D. Indoor Environmental Quality and Heating, Ventilating, And Air Conditioning Survey of Small And Medium Size Commercial Buildings: Field Study; Final Report for CEC-500-2011-043. California Energy Commission: Sacramento, CA, USA, 2011. [Google Scholar]
- Godwin, C.; Batterman, S. Indoor air quality in Michigan schools. Indoor Air 2007, 17, 109–121. [Google Scholar] [CrossRef] [PubMed] [Green Version]
- Uhde, E.; Schulz, N. Impact of room fragrance products on indoor air quality. Atmos. Environ. 2015, 106, 492–502. [Google Scholar] [CrossRef]
- Vu, D.C.; Ho, T.L.; Vo, P.H.; Bayati, M.; Davis, A.N.; Gulseven, Z.; Carlo, G.; Palermo, F.; McElroy, J.A.; Nagel, S.C. Assessment of indoor volatile organic compounds in Head Start child care facilities. Atmos. Environ. 2019, 215, 116900. [Google Scholar] [CrossRef]
- Kim, Y.W.; Kim, M.J.; Chung, B.Y.; Bang, D.Y.; Lim, S.K.; Choi, S.M.; Lim, D.S.; Cho, M.C.; Yoon, K.; Kim, H.S. Safety evaluation and risk assessment of d-limonene. J. Toxicol. Environ. Health Part B 2013, 16, 17–38. [Google Scholar] [CrossRef]
- St-Jean, M.; St-Amand, A.; Gilbert, N.L.; Soto, J.C.; Guay, M.; Davis, K.; Gyorkos, T.W. Indoor air quality in Montreal area day-care centres, Canada. Environ. Res. 2012, 118, 1–7. [Google Scholar] [CrossRef] [PubMed]
- Raysoni, A.U.; Stock, T.H.; Sarnat, J.A.; Chavez, M.C.; Sarnat, S.E.; Montoya, T.; Holguin, F.; Li, W.-W. Evaluation of VOC concentrations in indoor and outdoor microenvironments at near-road schools. Environ. Pollut. 2017, 231, 681–693. [Google Scholar] [CrossRef] [PubMed]
- Zhong, L.; Su, F.-C.; Batterman, S. Volatile organic compounds (VOCs) in conventional and high performance school buildings in the US. Int. J. Environ. Res. Public Health 2017, 14, 100. [Google Scholar] [CrossRef] [PubMed] [Green Version]
- Lee, S.C.; Chang, M. Indoor and outdoor air quality investigation at schools in Hong Kong. Chemosphere 2000, 41, 109–113. [Google Scholar] [CrossRef]
- Adgate, J.L.; Church, T.R.; Ryan, A.D.; Ramachandran, G.; Fredrickson, A.L.; Stock, T.H.; Morandi, M.T.; Sexton, K. Outdoor, indoor, and personal exposure to VOCs in children. Environ. Health Persp. 2004, 112, 1386–1392. [Google Scholar] [CrossRef] [Green Version]
- Zuraimi, M.S.; Tham, K.W. Effects of child care center ventilation strategies on volatile organic compounds of indoor and outdoor origins. Environ. Sci. Technol. 2008, 42, 2054–2059. [Google Scholar] [CrossRef]
- Sun, D.; Jia, C. Study on joint management of indoor natural ventilation environment by coupling ceiling fan with air conditioner. J. Asian Archit. Build. Eng. 2021, 1–13. [Google Scholar] [CrossRef]
- Agarwal, N.; Nagendra, S.M.S. Modelling of particulate matters distribution inside the multilevel urban classrooms in tropical climate for exposure assessment. Build. Environ. 2016, 102, 73–82. [Google Scholar] [CrossRef]
Figure 1.
Box plots presenting indoor concentrations (μg/m3) of VOCs in the primary schools. (A,B) aromatic hydrocarbons, (C) alkanes, (D) aldehydes, (E) esters and chlorinated hydrocarbons, and (F) 2-ethylhexanol and terpenes.
Figure 1.
Box plots presenting indoor concentrations (μg/m3) of VOCs in the primary schools. (A,B) aromatic hydrocarbons, (C) alkanes, (D) aldehydes, (E) esters and chlorinated hydrocarbons, and (F) 2-ethylhexanol and terpenes.

Figure 2.
Comparison of mean BTEX levels among the studies in Asia. Error bars indicate standard deviation of the mean. Data from the prior studies [2,6,18,19] were used to construct the bar graphs.

Figure 3.
Chemical group distributions among the schools.

Figure 4.
Comparison of VOC concentrations (μg/m3) between AC and NAC classrooms. (A,B) with n = 6 samples collected in S1, (C) with n = 12 samples collected in S3, (D–F) with n = 6 and 12 for AC and NAC classrooms in S4, respectively.
Figure 4.
Comparison of VOC concentrations (μg/m3) between AC and NAC classrooms. (A,B) with n = 6 samples collected in S1, (C) with n = 12 samples collected in S3, (D–F) with n = 6 and 12 for AC and NAC classrooms in S4, respectively.

Figure 5.
Comparison of VOC concentrations (μg/m3) between ground floor and first floor classrooms. (A,B) with n = 12 samples in S3, (C) with n = 6 and 12 samples for F1 and GF classrooms in S4, respectively.
Figure 5.
Comparison of VOC concentrations (μg/m3) between ground floor and first floor classrooms. (A,B) with n = 12 samples in S3, (C) with n = 6 and 12 samples for F1 and GF classrooms in S4, respectively.


Table 1.
Comparison of VOC compositions (μg/m3) among the studies on indoor air quality of childcare centers and primary schools.
Table 1.
Comparison of VOC compositions (μg/m3) among the studies on indoor air quality of childcare centers and primary schools.
| Godwin et al. [24] | St. Jean et al. [28] | Raysoni et al. [29] | Hoang et al. [21] | Zhong et al. [30] | The Present Study | |
|---|---|---|---|---|---|---|
| 123TMB | 0.03–0.92 * | ≤1.0 | 0.25–3.32 | |||
| 124TMB | ≤1.5 | ≤2.7 | ≤4.2 | 0.92–7.44 | ||
| 135TMB | ≤0.2 | 0.18–1.70 | ||||
| Benzene | ≤1.6 | 0.9–6.3 | 0.20–1.68 | ≤2.6 | ≤4.4 | ≤4.39 |
| BuB | ≤0.2 | ≤2.20 | ||||
| Cumene | ≤0.3 | |||||
| DEtB | 0.74–8.61 | |||||
| EtB | ≤2.8 | 0.5–14.8 | 0.09–2.11 | ≤2.0 | ≤2.0 | 0.56–4.21 |
| EtT | 0.81–5.74 | |||||
| NAP | ≤10.3 | 0.3–3.1 | ≤2.9 | 1.37–5.55 | ||
| Xylenes | ≤66.8 | 2.5–63.8 | 0.20–3.72 | ≤9.4 | ≤9.6 | 1.87–9.54 |
| Styrene | ≤1.4 | 0.56–4.40 | ||||
| Toluene | ≤74.6 | 3.2–49.0 | 0.36–17.06 | ≤12.4 | ≤83.8 | 1.20–24.37 |
| Nonane | 0.04–0.74 | 0.50–1.61 | ||||
| Decane | 0.04–1.88 | ≤4.5 | 0.27–4.47 | |||
| UnD | ≤4.3 | 0.45–7.42 | ||||
| DoD | ≤5.0 | ≤3.0 | 0.37–3.50 | |||
| TriD | ≤1.5 | 0.37–2.60 | ||||
| TetraD | ≤17.3 | ≤8.2 | 1.47–4.44 | |||
| HexaD | ≤4.1 | ≤2.6 | 1.03–4.77 | |||
| Hexanal | ≤52.2 | ≤22.5 | 3.42–22.45 | |||
| Heptanal | ≤2.7 | 1.06–5.23 | ||||
| Octanal | ≤5.7 | 2.33–13.94 | ||||
| Nonanal | ≤16.0 | 6.24–34.05 | ||||
| Decanal | ≤22.0 | 4.36–14.51 | ||||
| BZALD | ≤9.4 | 4.43–17.69 | ||||
| HMS | 0.19–1.67 | |||||
| EtHexS | 0.12–0.94 | |||||
| BuAc | ≤6.65 | |||||
| EtHexanol | ≤3.9 | 1.55–19.67 | ||||
| Limonene | ≤45.1 | 0.11–16.56 | ≤81.5 | ≤158.5 | 10.29–50.08 | |
| Pinene | ≤35.2 | 0.7–26.2 | 0.04–0.64 | ≤57.7 | ≤55.7 | 4.76–36.30 |
| Terpinene | ≤7.1 | ≤47.28 | ||||
| PERC | ≤0.3 | ≤7.8 | ≤1.70 | |||
| DCB | 0.04–1.80 | ≤2.9 | ≤12.24 |
* Total trimethylbenzenes.
Table 2.
Indoor-to-outdoor ratios (I/O) of the VOCs.
| I/O | ||||
|---|---|---|---|---|
| S1 | S2 | S3 | S4 | |
| 1,2,3-Trimethylbenzene | >1–10 | >1–10 | >10–50 | >1–10 |
| 1,2,4-Trimethylbenzene | >1–10 | >1–10 | >10–50 | >1–10 |
| 1,3,5-Trimethylbenzene | >10–50 | >1–10 | >10–50 | >1–10 |
| Benzene | <1 | >1–10 | n.a. | >1–10 |
| Butylbenzene | <1 | >100 | >100 | n.a. |
| Cumene | >1–10 | <1 | >1–10 | >1–10 |
| Diethylbenzenes | >1–10 | >1–10 | >10–50 | >1–10 |
| Ethylbenzene | >1–10 | >1–10 | >10–50 | >1–10 |
| Ethyltoluenes | >1–10 | >1–10 | >10–50 | >1–10 |
| Naphthalene | >50–100 | >1–10 | >100 | >10–50 |
| m/p-Xylenes | >10–50 | >1–10 | >10–50 | >1–10 |
| o-Xylene | >10–50 | >1–10 | >10–50 | >1–10 |
| Styrene | >100 | >1–10 | n.a. | >10–50 |
| Toluene | >1–10 | >1–10 | >1–10 | >1–10 |
| Nonane | >1–10 | >1–10 | >10–50 | >1–10 |
| Decane | >10–50 | >1–10 | >10–50 | >10–50 |
| Undecane | >10–50 | >1–10 | >10–50 | >10–50 |
| Dodecane | >50–100 | >10–50 | >50–100 | >50–100 |
| Tridecane | >100 | >100 | >10–50 | n.a. |
| Tetradecane | >100 | >50–100 | >100 | >100 |
| Hexadecane | >500 | >500 | >500 | >100 |
| Hexanal | >10–50 | >10–50 | >10–50 | >10–50 |
| Heptanal | >10–50 | >10–50 | >10–50 | >10–50 |
| Octanal | >50–100 | >10–50 | >100 | >10–50 |
| Nonanal | >50–100 | >10–50 | >50–100 | >50–100 |
| Decanal | >50–100 | >50–100 | >50–100 | >100 |
| Benzaldehyde | >1–10 | >1–10 | >1–10 | >10–50 |
| Homomenthyl salicylate | >100 | >100 | >100 | >500 |
| Ethylhexyl salicylate | >100 | >100 | >100 | >100 |
| Butyl acetate | <1 | >100 | n.a. | n.a. |
| 2-Ethylhexanol | >50–100 | >10–50 | >50–100 | >50–100 |
| Limonene | >100 | >100 | >100 | >50–100 |
| Pinene | >100 | >100 | >100 | >10–50 |
| Terpinene | >100 | >100 | >100 | n.a. |
| PERC | n.a. | n.a. | n.a. | <1 |
| 1,4-Dichlorobenzene | <1 | >1–10 | >100 | >10–50 |
n.a.: not available.
Table 3.
Non-cancer and cancer risks of exposure to VOCs in the investigated schools.
| S1 | S2 | S3 | S4 | ||
|---|---|---|---|---|---|
| Non-cancer risk a | Mean risk value | 0.24 | 0.21 | 0.38 | 0.40 |
| 95% CI c | 0.21, 0.26 | 0.16, 0.26 | 0.35, 0.42 | 0.37, 0.43 | |
| Mean cancer risk of individual VOCs (×10−6) | Benzene | 0 | 0.19 | 0 | 4.53 |
| Ethylbenzene | 0.32 | 0.08 | 0.17 | 0.15 | |
| Naphthalene | 3.22 | 3.34 | 6.35 | 5.47 | |
| DCB | 0.03 | 0.13 | 4.68 | 1.04 | |
| PERC | 0 | 0 | 0 | 0.29 | |
| Cancer risk b (×10−6) | Mean risk value | 10.74 | 11.24 | 33.59 | 34.43 |
| 95% CI | 9.39, 12.08 | 8.67, 13.80 | 31.04, 36.15 | 32.28, 36.58 |
a Total non-cancer risks were evaluated for exposure to trimethylbenzenes, benzene, butylbenzene, cumene, ethylbenzene, naphthalene, xylenes, styrene, toluene, butyl acetate, DCB, and PERC. b Total cancer risks were assessed for exposure to benzene, ethylbenzene, naphthalene, DCB and PERC. c 95% confident interval of the mean is presented by lower bound and upper bound.
Publisher’s Note: MDPI stays neutral with regard to jurisdictional claims in published maps and institutional affiliations. |
© 2021 by the authors. Licensee MDPI, Basel, Switzerland. This article is an open access article distributed under the terms and conditions of the Creative Commons Attribution (CC BY) license (https://creativecommons.org/licenses/by/4.0/).
Share and Cite
MDPI and ACS Style
Lu, K.H.; Vu, D.C.; Nguyen, Q.T.; Vo, X.T. Volatile Organic Compounds in Primary Schools in Ho Chi Minh City, Vietnam: Characterization and Health Risk Assessment. Atmosphere 2021, 12, 1421. https://doi.org/10.3390/atmos12111421
AMA Style
Lu KH, Vu DC, Nguyen QT, Vo XT. Volatile Organic Compounds in Primary Schools in Ho Chi Minh City, Vietnam: Characterization and Health Risk Assessment. Atmosphere. 2021; 12(11):1421. https://doi.org/10.3390/atmos12111421
Chicago/Turabian StyleLu, Khang H., Danh C. Vu, Quang T. Nguyen, and Xuyen T. Vo. 2021. "Volatile Organic Compounds in Primary Schools in Ho Chi Minh City, Vietnam: Characterization and Health Risk Assessment" Atmosphere 12, no. 11: 1421. https://doi.org/10.3390/atmos12111421
Note that from the first issue of 2016, this journal uses article numbers instead of page numbers. See further details here.