
Assessment of Aerosol Mechanisms and Aerosol Meteorology Feedback over an Urban Airshed in India Using a Chemical Transport Model

Centre for Atmospheric Sciences, Indian Institute of Technology Delhi, Hauz Khas, New Delhi 110016, India
*
Author to whom correspondence should be addressed.
Atmosphere 2021, 12(11), 1417; https://doi.org/10.3390/atmos12111417
Submission received: 1 October 2021
/
Revised: 25 October 2021
/
Accepted: 26 October 2021
/
Published: 28 October 2021
(This article belongs to the Special Issue Parameterization of Near-Surface Turbulence Processes in Atmospheric Models: Past, Present and Future)
Abstract
:The direct aerosol-radiative effects in the WRF-Chem model account for scattering/absorption of solar radiation due to aerosols, while aerosol–cloud interactions result in modifying wet scavenging of the ambient concentrations as an indirect aerosol effect. In this study, impact of aerosol on meteorological parameters, PM10 and ozone concentrations are analysed which revealed (i) that a net decrease in shortwave and longwave radiation by direct feedback results in decrease in temperature up to 0.05 K, (ii) that a net increase due to longwave and shortwave radiation when both direct and indirect effects are taken together results in an increase in temperature up to 0.25 K (where the mean of temperature is 33.5 °C and standard deviation 2.13 °C), (iii) a marginal increase in boundary layer height of 50 m with increase in temperature with feedbacks, (iv) overall net increase in radiation by direct and indirect effect together result in an increase in PM10 concentration up to 12 μg m−3 (with PM10 mean as 84.5 μg m−3 and standard deviation 28 μg m−3) and an increase in ozone concentration up to 3 μg m−3 (with ozone mean as 29.65 μg m−3 and standard deviation 5.2 μg m−3) mainly due to net increase in temperature. Furthermore, impact of sensitivity of different aerosol mechanisms on PM10 concentrations was scrutinized for two different mechanisms that revealed underestimation by both of the mechanisms with MOSAIC scheme, showing less fractional bias than MADE/SORGAM. For the dust storm period, MOSAIC scheme simulated higher mass concentrations than MADE/SORGAM scheme and performed well for dust-storm days while closely capturing the peaks of high dust concentrations. This study is one of the first few to demonstrate the impact of both direct and indirect aerosol feedback on local meteorology and air quality using a meteorology–chemistry modelling framework; the WRF-Chem model in a tropical urban airshed in India located in semi-arid climatic zone. It is inferred that semi-arid climatic conditions behave in a vastly different manner than other climatic zones for direct and indirect radiative feedback effects.
1. Introduction
The formation of aerosols in the atmosphere occurs through series of hundreds of complex chemical reactions involving several chemical species. Thereby, chemical transport models (CTMs) such as Weather Research and Forecasting Model with Chemistry module (WRF-Chem) are useful in providing the necessary framework for integration of our understanding of individual atmospheric processes and study of their interactions at various spatial and temporal scales. Several studies have investigated particulates and aerosols over different regions of the world [1,2,3,4,5]. Michael et al. [6] implemented the WRF-Chem model over India and inferred that simulated aerosol optical depth of the less polluted regions was better compared to that of the locations where the aerosol loading was high. Gupta and Mohan [7] implemented the WRF-Chem model to assess impact of long-range transport on PM10 concentrations over megacity Delhi. Seethala et al. [8] studied the regional distribution and optical properties of aerosols and its effect on radiation over India with the model efficiently capturing the broad regional hotspots. The CTMs employed for various studies in the recent past for aerosols optical properties showed significant deviations from observations, indicating further scope of improvement. Mohan and Gupta [9] in their study over Delhi highlighted the importance of dependency between meteorological and air quality parameters. The WRF-Chem model allows for coupled simulations of atmospheric chemistry and meteorology such that feedbacks can be considered [1,2,10,11,12]. San Jose et al. [13] studied feedback effects on pollutant concentrations and meteorological variables over Europe using the WRF-Chem model and reported slightly better results for simulations when feedback effects were included. The study showed an increase of about 70% in solar radiation over cloudy areas with indirect aerosol effect, about 10% decrease over more sunny locations via backscattering and 20% decrease in planetary boundary layer height along with about 3% increase in ozone over Mediterranean area and about 4% decrease over rest of the study area. Similar study over Europe was performed to investigate direct aerosol effect on radiation and indirect effect of aerosol particles on meteorological fields [14]. Zhang et al. [15] observed that model simulated aerosols can reduce incoming solar radiation by up to 11.3 W m−2 (−9.1%) in January and up to 39.5 W m−2 (−16.1%) in July via backscattering. The study further investigated that due to warming caused by black carbon (BC) in the PBL and the cooling at surface resulting from reduced solar radiation, the PBL height reduced by up to −23% to −24% which could further result in PBL becoming more stable and thus exacerbating air pollution.
Various other studies over different parts of the world were also performed to study aerosol feedback effects [16,17,18]. Although all the studies successfully documented the significant impact of an aerosol direct effect on both meteorology and back on to chemistry, there were still concerns pertaining to aerosol indirect effects. Forkel et al. [14] suggested further investigations in relation to evaluate magnitude of the indirect aerosol effect simulated over Europe and if varied boundary conditions for chemistry might have a dampening impact on the too strong indirect effect for low aerosol particle concentrations. Another study by Forkel et al. [19] found that inclusion of aerosol–cloud interactions for regions with low aerosol concentrations led to lower cloud droplet number and higher downward solar radiation by almost 50% for a Russian wildfire episode. Kong et al. [20] stated the challenges in assessing indirect effects are enormous, given the large uncertainties in model representation of the clouds (timing, placement and its extent), suggesting improvement of representation of aerosol indirect effects on online-coupled models.
For accurate representations of aerosol feedback effects in atmospheric models, more studies and simulations must be targeted around the world to be able to reduce uncertainties associated with meteorological and air quality predictions. Further, with rapid changes noted with increased air pollutant concentrations and gradual change in climatic conditions leading to increased extreme events in the country and around the world, a number of policies are being formulated to curb the particulate matter concentrations thus, it is requisite to study in detail such atmospheric processes. In addition, as these online atmospheric models have complex physical and chemical processes and demand high computational cost and time, more studies available for different parts of world can further assist in improvement of the model and better representation of these feedback processes. As no such study is yet found in the literature for an Indian region, where feedback effects of aerosol–meteorology using the WRF-Chem model is studied in detail, this is one of the first studies to attempt to fill that gap in literature. Based on this background, this study focuses impact of aerosol–meteorology interactions and feedbacks on meteorological variables and ambient concentrations using the WRF-Chem model framework in India for National Capital Territory (NCT), Delhi, which can be considered to depict semi-arid climatic conditions. Moreover, from the perspective of atmospheric pollution, Delhi presents a unique case study, being first amongst the 10 most polluted cities in the world [21] located in Indo-Gangetic plane, which is typically characterised with a high level of emissions and low winds.
2. Methodology
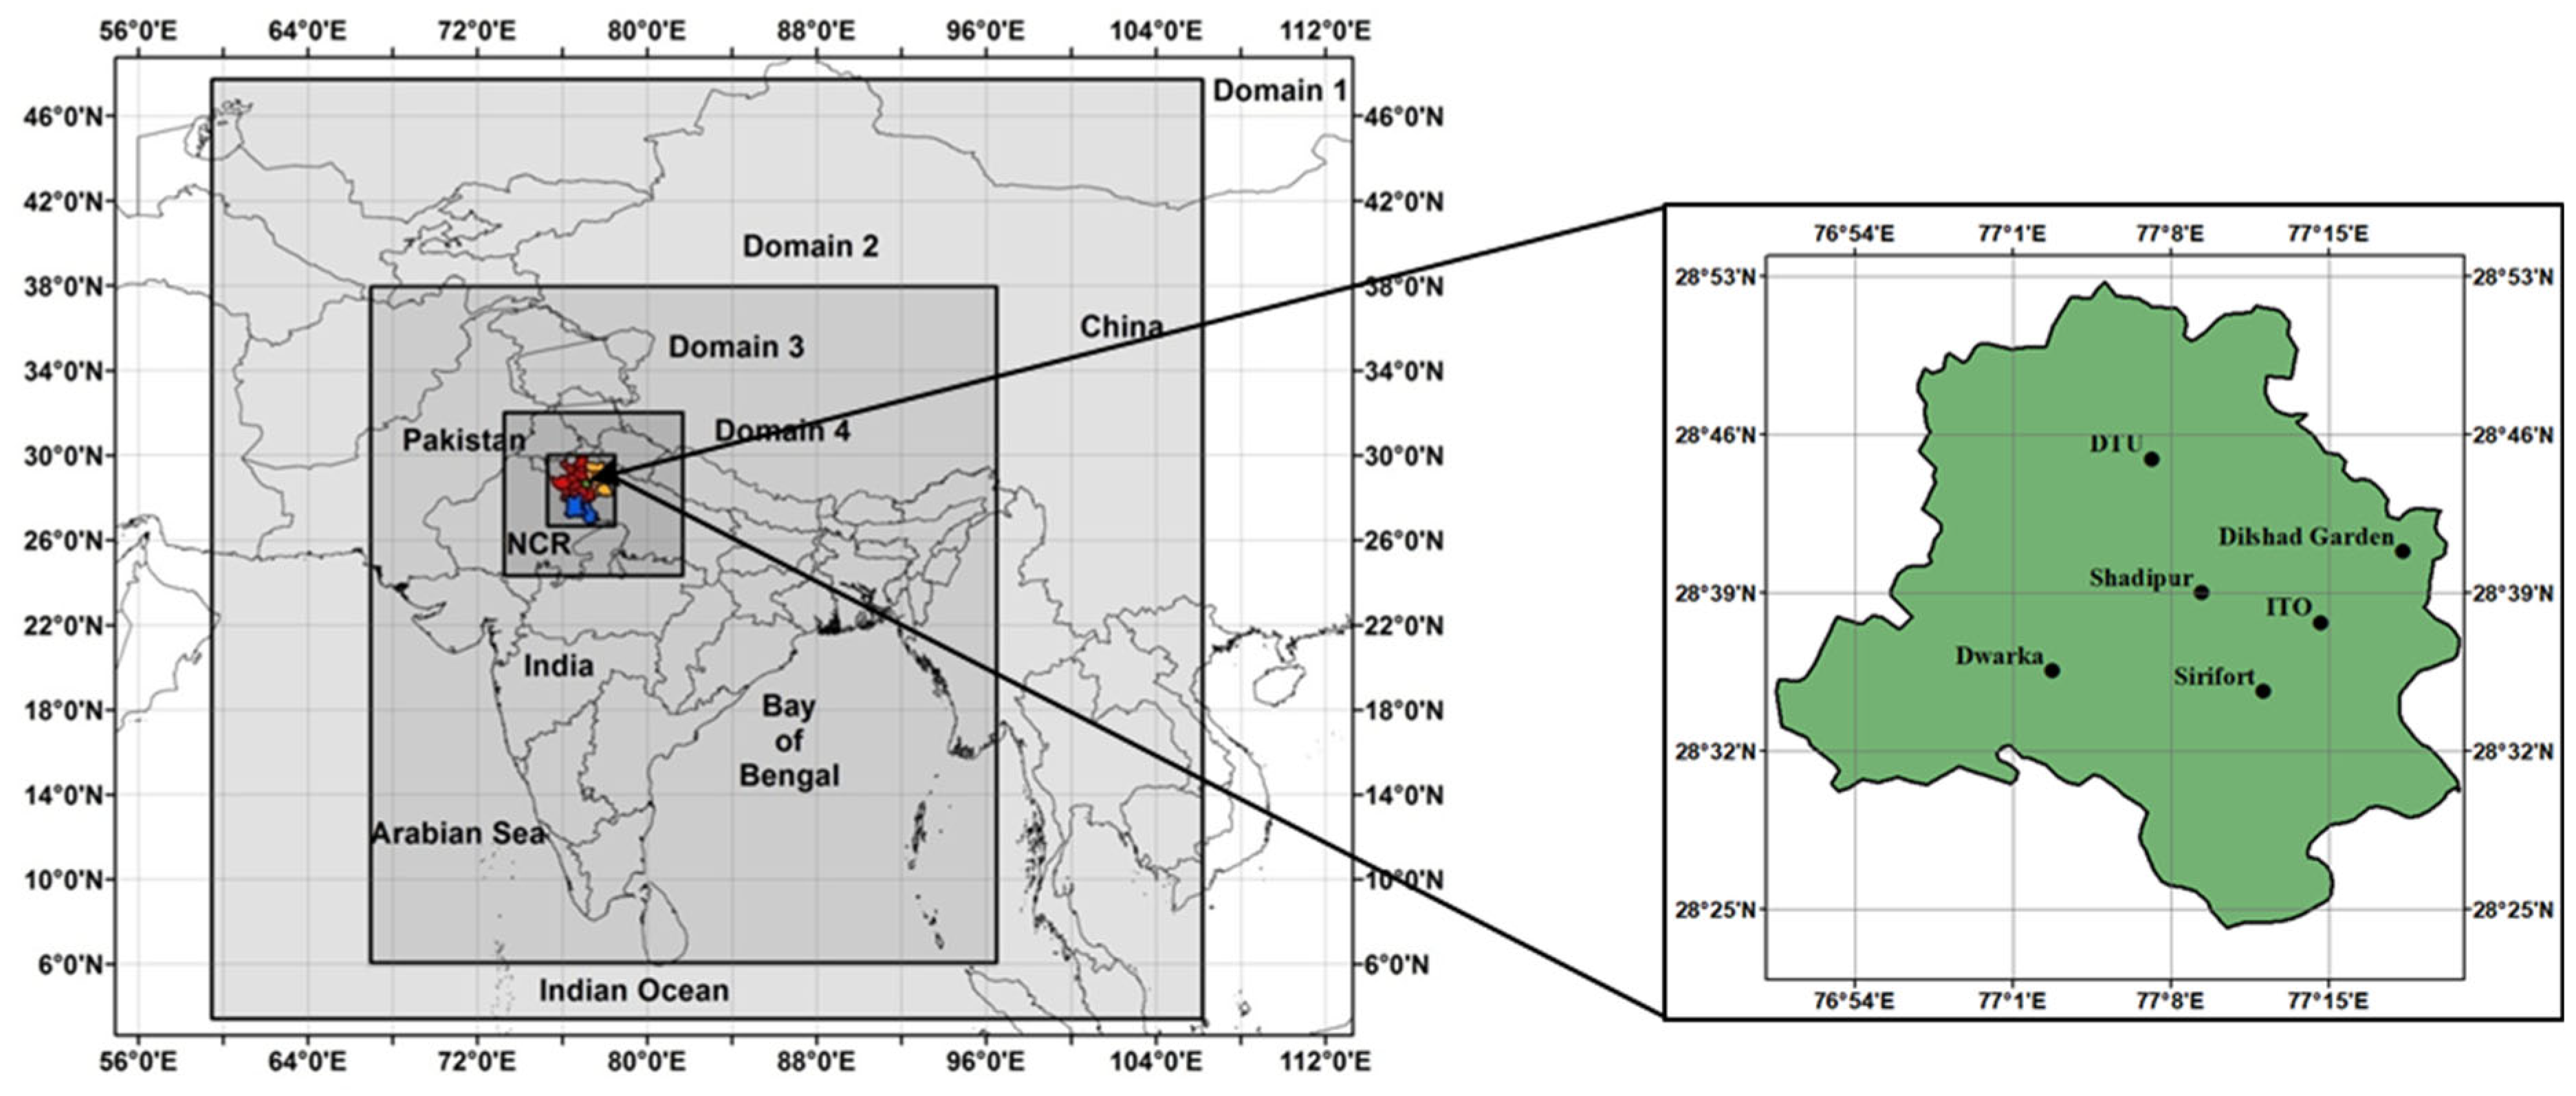
The Organisation for Economic Co-operation and Development (OECD) estimated that by the year 2050 annual PM10 levels are expected to shoot up to 150 μg m−3 in all major cities of India including its capital city Delhi [22]. The particulate pollution of NCT has been steadily increasing since 2005 despite the various regulatory measures been employed by the regulatory bodies. NCT is a sub-tropical region that experiences extreme weather conditions with hot and humid summers and cold and dry winters. The simulation domains selected for the present study are represented in Figure 1. The selection of domains is made with consideration to the contribution of long-range transport to the pollutant concentration [7]. Figure 1 shows the simulation domains with parent domain covering parts of Asia at a resolution of 54 km, the first nested domain surrounding the entire India at 18 km, second nested domain at resolution of 6 km and the third nested domain encapsulates National Capital Region (NCR) at a fine resolution of 2 km. The simulation period selected for the study is 1–15 June for four consecutive years 2007, 2008, 2009 and 2010 [7,23]. The simulated model results over NCR are first validated against in situ observations. The application of the WRF-Chem model by studies conducted over India have employed both available aerosol mechanisms, namely, MADE/SORGAM aerosol mechanism [6,24,25,26] and MOSAIC aerosol mechanism [27,28,29]. However, performance evaluation using different aerosol mechanisms is necessitated for further scrutiny. Thereby, prior to analysing the impact of aerosol feedback effects, impact of different aerosol mechanisms on aerosol concentrations is studied to be able to select appropriate aerosol mechanism for further simulations and is covered in Section 4.1.
For appropriate selection of an aerosol mechanism, the model performance evaluation is undertaken for two different aerosol mechanisms in the first part of analysis. The sensitivity analysis is only performed with aerosol mechanism in this study, while the sensitivity of gas phase chemical mechanisms selected is based on performance evaluation conducted in a previous study [23]. The WRF-Chem model may be found to have model bias for underprediction and needs further improvement though, validation studies for the study area show that it largely satisfies the model evaluation benchmark indices [9,30]. Further, subsequent to model validation exercise including aerosol mechanism sensitivity in this study, it is implemented to study the relative contributions from direct, indirect and semi-direct effects where it is considered that model performance and biases will impact all simulation scenarios with similar magnitudes for all practical purposes. Subsequently, model simulations are performed for the direct and indirect feedback effects. Simulation details are covered in the following section.
3. Simulation Details
3.1. Physical and Chemical Schemes
WRF-Chem version 3.5 is the chemical module of WRF that simulates trace gases and particulates simultaneously with the meteorological fields using the mass and scalar conserving flux form of the governing equations and a terrain following mass vertical coordinate system [2]. The physical parameterization schemes for the simulations are selected based on the sensitivity studies performed over Delhi [9,31] that includes Lin et al. [32] microphysics parameterization; Noah Land Surface Model; the YSU PBL scheme, Kain-Fritsch cumulus parameterization scheme and Goddard scheme for atmospheric shortwave radiation. Rapid Radiative Transfer Model (RRTM) is selected for the computation of longwave radiation which is compatible with the chemical options of the WRF-Chem [7]. The aerosol mechanisms selected are (1) MADE/SORGAM aerosol module coupled with RACM mechanism and (2) MOSAIC scheme coupled with CBMZ mechanism and the photolysis scheme Madronich [23].
3.2. Data Requirements
USGS 24 classification category land-use data are used for interpolating topography and land use with spatial resolution of 30″. Meteorological initial and boundary conditions are obtained from National Centre for Environmental Prediction (NCEP) final analysis data (FNL) of 1° resolution. These datasets can be downloaded from WRF model website [33]. Emission Database for Global Atmospheric Research (EDGAR) provides global anthropogenic emissions of greenhouse gases and air pollutants by country and on spatial grid of 0.1° × 0.1° [34]. Chemical initial and boundary conditions are extracted from Model for ozone and Related chemical Tracers, version 4 (MOZART-4) global chemical transport model [35]. MOZART-4 global dataset is provided every 6 h at a resolution of 1.9° × 2.5° with 56 levels.
For model validation, the sites are selected based on availability of data which are Sirifort, Income Tax Office (ITO), Delhi Technological University (DTU), Dwarka, Dilshad Garden and Shadipur after removing outliers from the data. These selected sites represent a cluster of different categories with Sirifort classified as a Residential and Sports complex; ITO, Dwarka and Shadipur as Traffic junctions; DTU and Dilshad Garden as Institutional sites. These in situ observation datasets are obtained from Central Pollution Control Board (CPCB), a statutory organization in India which monitors air pollutant concentrations [36].
4. Results and Discussion
Different simulations are carried out with different set of options to assess WRF-Chem model sensitivity. Thus, model simulated aerosols are discussed with regard to (i) model performance evaluation of sensitivity of aerosol mechanisms to PM10 concentrations which is covered in Section 4.1 in detail and (ii) impact of aerosol–meteorology interaction to the WRF-Chem simulations detailed in Section 4.2. The results are analysed based on time series plots, scatter plots and statistical parameters. A suite of performance measures is considered to judge the performance of models. The statistical performance measures chosen for model evaluation are normalized mean square error (NMSE), index of agreement (IOA), fractional bias (FB) and fraction of data where predictions are within a factor of two of observations (FAC2). These parameters are chosen based on recommendations of World Meteorological Organisation [37] for meteorological and air pollution consolidated list of model evaluation methods.
4.1. Model Sensitivity to Aerosol Mechanisms
The performance of the aerosol mechanisms is evaluated only for PM10 concentrations as the impact of different chemical mechanisms on ozone and meteorological parameter (temperature) has already been studied in detail and published [23] by the authors for the same simulation configuration. Although slight model biases were noted, with ozone (FB = −0.24 and IOA = 0.82) and temperature (FB = 0.03 and IOA = 0.91) in the study [23], but it mostly showed satisfying results giving the confidence for further application of the model for the study area.
In this study, the sensitivity is performed with two aerosol schemes (i) MADE/SORGAM scheme and (ii) MOSAIC scheme on PM10 concentrations. Figure 2 shows the hourly scatter plots of PM10 levels averaged for the years 2007–2010 for all the stations. Figure 2a,b) shows the PM10 levels simulated with MOSAIC and MADE/SORGAM aerosol module respectively. The MOSAIC scheme is able to capture the high PM10 levels (>400 µg m−3) well as depicted in Figure 2a. The MADE/SORGAM scheme is unable to simulate PM10 levels above >400 µg m−3 (Figure 2b) which resulted in higher biases in model simulated values. The dotted lines in Figure 2 represent the FAC2 area, i.e., the points lying in this area show the fraction of simulated data that are within a factor of two of observations and the data points on solid line represents that the values of both simulated and observed are same. The FAC2 value for PM10 with MOSAIC scheme is 0.4 which is marginally better as compared to FAC2 value of 0.36 with MADE/SORGAM scheme. The aerosol schemes in the WRF-Chem differ in their approach to describe the aerosols in terms of size distribution, composition and interaction with gas and aqueous phase chemistry, clouds and radiation [38,39,40,41]. The MADE/SORGAM scheme follows a modal aerosol approach with Secondary Organic Aerosol (SOA) [42,43], whereas the MOSAIC aerosol scheme follows the sectional approach [41]. The MADE scheme is partitioned into aitken/nucleation, accumulation and coarse mode where aerosol is internally mixed in each mode. SORGAM calculates the gas/particle partitioning of semi-volatile organic vapours and treats oxidation products of VOCs such as higher alkenes/alkanes, toluene, xylene, cresols, α-pinene and limonene [44,45,46,47]. With the MOSAIC scheme, the aerosol compounds are internally mixed in each bin, i.e., 4 or 8 size bins [46,48,49,50]. Due to lower computational costs modal approaches are favoured over sectional schemes [40].
The MOSAIC scheme performed better in comparison to MADE/SORGAM scheme for simulating PM10 concentrations and the same is inferred with the aid of the statistical analysis. The NMSE value for MADE/SORGAM mechanism is 2.07 and for MOSAIC mechanism it is 1.2. FB represents the models ability of over or under prediction of simulated values. FB values are 0.98 and 0.48 for MADE/SORGAM and MOSAIC mechanisms respectively. The positive value of FB represents underestimation for both of the mechanisms. However, MOSAIC mechanism shows less underestimation in comparison to MADE/SORGAM mechanism. The value of IOA for MOSAIC is 0.61 while for MADE/SORGAM it is 0.55. It was observed in other studies that for simulated PM10 concentrations, the accepted statistical value of NMSE is <4 [51], FB is ±0.30 [52] and IOA is ≥0.5 [53] which shows that with both schemes the model performance is satisfactory. However, the statistical parameters show better model performance for PM10 concentrations with MOSAIC scheme than with MADE/SORGAM scheme. Further the role of ammonia in aerosol formation is studied in the two mechanisms. Currently, the chemical system considered in MADE is restricted to sulphate, nitrate, ammonium and water components in the aerosol phase. The sulphate formed in the model by oxidation of SO2 in the gas-phase and by liquid-phase reactions in clouds is neutralized by ammonia resulting in irreversible aerosol formation according to
with the index s or aq denoting the phase state of the particles. Excess ammonia can additionally react with nitric acid in the model resulting in the reversible formation of ammonium nitrate aerosol.
2NH3 + H2SO4 → (NH4)2SO4s, aq
NH3 + H2SO4 → NH4HSO4s, aq
NH3 + HNO3 ↔ NH4NO3s, aq
In the MOSAIC scheme also the H2SO4 and HNO3 are mainly condensed or neutralized with NH3 to form (NH4)2SO4 and NH4NO3 respectively.
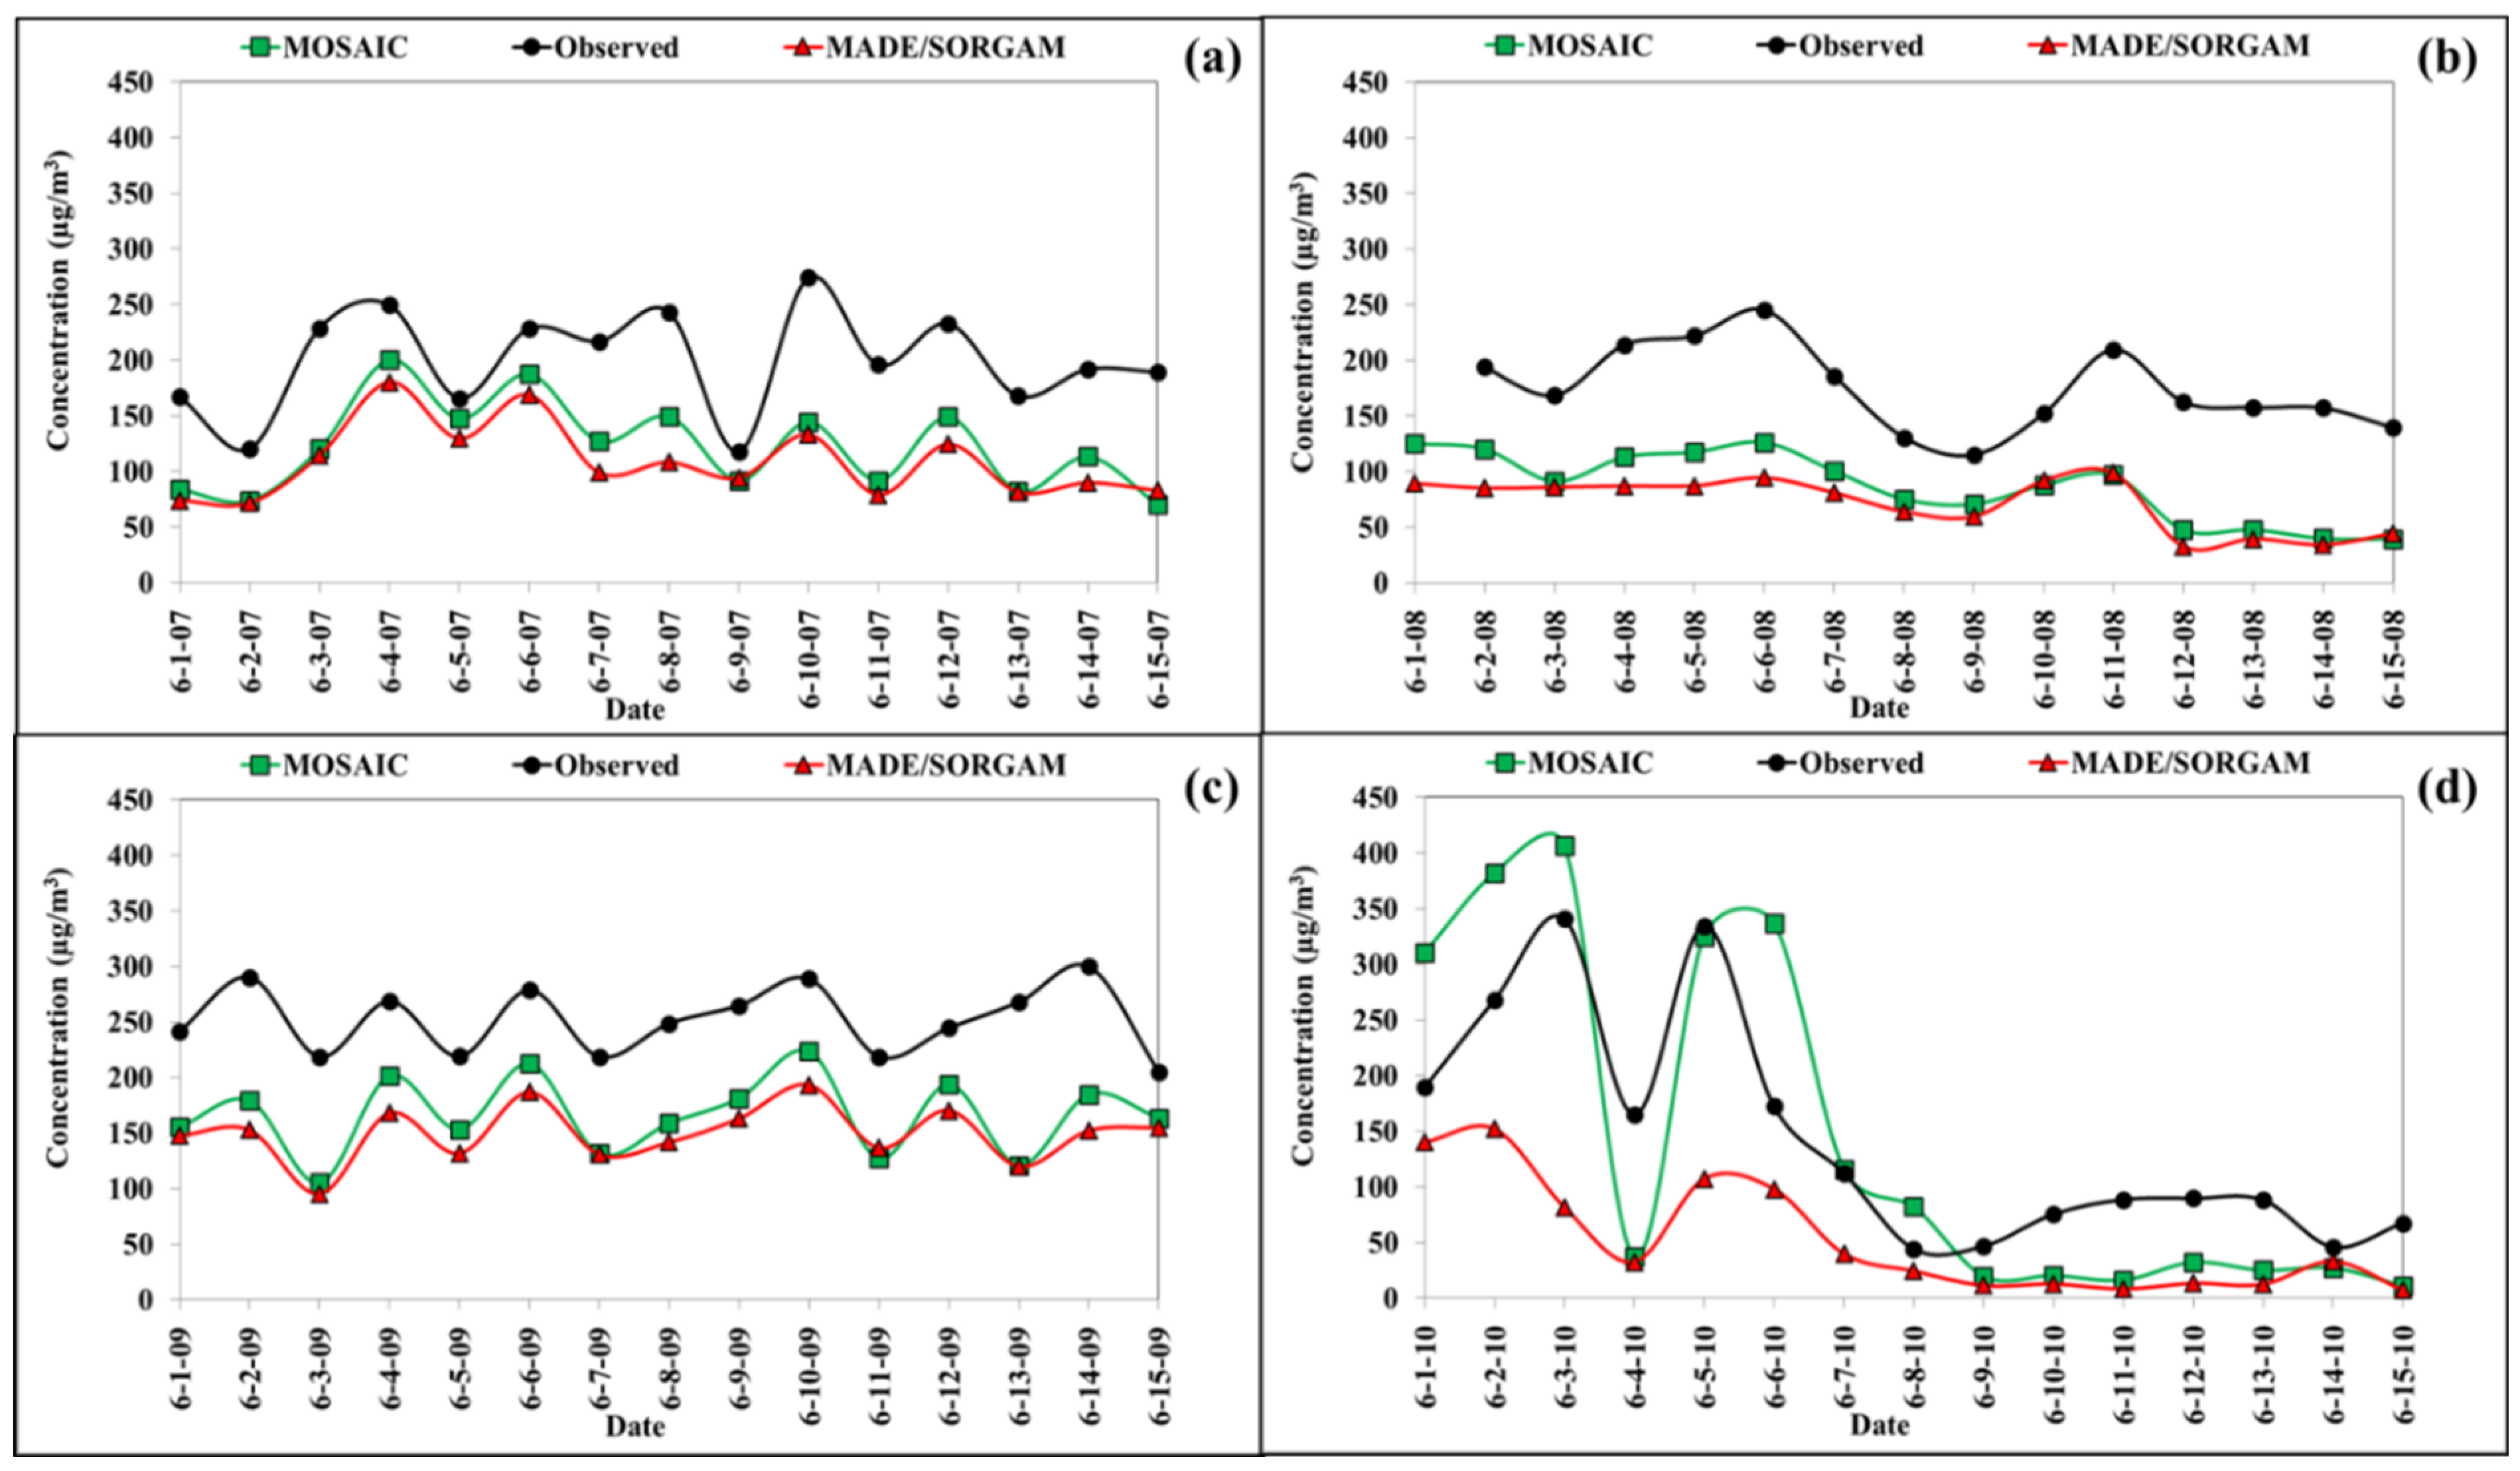
To further understand the difference between the two mechanisms, a daily average time series of PM10 levels for the years 2007 to 2010 was plotted as shown in Figure 3a–d. The daily averaged PM10 concentrations for year 2010 were analysed as for the other years (2007 to 2009) the simulated concentrations with both the mechanisms were fairly consistent and notable variation in the first and second week of year 2010 for PM10 levels was observed as discussed hereafter. Figure 3d gives the daily averaged PM10 levels where the black line represents the observed values, red line shows the PM10 levels simulated with MADE/SORGAM aerosol module and green line shows the concentrations simulated with MOSAIC aerosol module. There was significant difference in the simulated PM10 concentrations by the two aerosol mechanisms for the first seven days while for the remaining seven days more or less similar PM10 concentrations are obtained. The first seven days of simulation (i.e., 1–7 June 2010) had witnessed dust storms in Delhi and the MOSAIC aerosol module simulated concentrations were able to capture the peaks during the dust storm episode and performed far better than MADE/SORGAM while the difference in simulated concentrations during non-dusty days of the two mechanisms was not as large. It is therefore inferred that dust-storm peak concentrations can be simulated far better from MOSAIC for the study area located in the semi-arid zone. It was observed that one of the factors contributing to this difference is the function of the dust model for the two aerosol mechanisms that is influenced differently by the modal and sectional approach in MADE/SORGAM and MOSAIC mechanisms respectively.
MADE/SORGAM in the WRF-Chem uses the modal approach to represent the aerosol size distribution with three log normal modes, i.e., Aitken mode (0.01–0.1 μm), Accumulation mode (0.1–1 μm) and Coarse mode (1–10 μm). MOSAIC uses a sectional approach where the aerosol size distribution is divided into discrete size bins (0.039–0.156, 0.156–0.625, 0.625–2.5, and 2.5–10 μm). The physical processes such as threshold fraction velocity, horizontal saltation flux and vertical flux in the model helps to determine the emitted dust. The dust scheme distributes the emitted dust into two size bins (0.5–1 and 1–10 μm in radius). As dust is distributed in the size bins over 0.5 to 10 μm, it is assumed that the dust particles are emitted in third and fourth bins for MOSAIC scheme and in accumulation mode and coarse mode for MADE/SORGAM scheme [54]. The dust mechanism for both aerosol schemes is same which simulates up to PM10.
The dust scheme does not directly provide the log-normal size distribution parameters of emitted dust (i.e., volume median diameter and standard deviation of the log-normal distribution and the mass fractions among different modes) that are required for the MADE/SORGAM aerosol model [54]. Thus, it was inferred by Zhao et al. [54] that numerical representation of the aerosol size distribution highly influences the evolution of dust size distribution and with same dust scheme MADE/SORGAM aerosol scheme retains 8% less coarse dust particles (1.25 µm < r < 5 µm) than the sectional approach of MOSAIC aerosol scheme. Thereby, overall, the WRF-Chem model showed better simulations of PM10 with MOSAIC as compared to MADE/SORGAM module. However, simulated PM10 levels are underestimated by both the mechanisms. This inference is also noted by Govardhan et al. [55] who have further suggested necessary improvements in the simulations for meteorological variables as vital in improving the simulated aerosol.
4.2. Sensitivity Analysis of Aerosol–Meteorology Interactions and Aerosol Feedback Effects
Aerosols have a significant impact on the meteorology of a region. The perturbation in meteorological fields due to aerosols further impacts the air quality of that particular region. The impact of aerosols has been categorized into direct and indirect aerosol effects. The scattering/absorption of solar radiation due to presence of aerosols in the atmosphere is known as the direct aerosol effect. Aerosols also act as cloud nuclei and has an indirect impact on cloud microphysics (such as cloud droplet sizes) and precipitation [56]. With increase in aerosol concentrations, the size of cloud droplets reduces which effects clouds albedo. The net increase in the planetary albedo is referred to as the first aerosol indirect or Twomey effect [57,58]. The second indirect aerosol effect concerns the suppression or delay of precipitation due to which the cloud becomes stable, cloud lifetime increases and as less radiation reaches the surface thereby, increasing planetary albedo also referred to as the Albrecht effect [56,57,59]. The reflective properties of clouds are indirectly affected by the impact of aerosols on cloud drop formation. To identify the degree of impact of feedback effects in the model on atmospheric pollutants and meteorological variables, the results were studied with respect to the control case when no feedback effect was taken into consideration. To study the impact of aerosol–meteorology interactions on both meteorology and air quality, WRF-Chem simulations were performed considering three scenarios (i) a control case scenario where no feedback is considered (Case A) (ii) only aerosol-radiation feedback (i.e., the direct effect) considered (Case B) and (iii) aerosol-radiation feedback along with cloud interactions (i.e., direct effect + indirect effect) which activates wet scavenging are taken into account (Case C). The aerosol–cloud interactions (ACI) estimated in the WRF-Chem model [60] are as follows:
where, Nd is the cloud droplet number concentration, α is a proxy for aerosol burden, COD is the cloud optical depth
The microphysical component of the albedo effect can be detected using several related cloud microphysical properties: cloud optical depth, cloud drop effective radius (re) and cloud drop number concentration, Nd. As aerosol concentration increases, Nd increases and re decreases, thus increasing COD through stronger backscattering from more, and smaller cloud droplets (for a constant cloud liquid water path, LWP) [60]. The droplet number and cloud water mixing ratio is used to compute effective cloud-particle size for the cloud optical depth in shortwave radiation scheme [61].
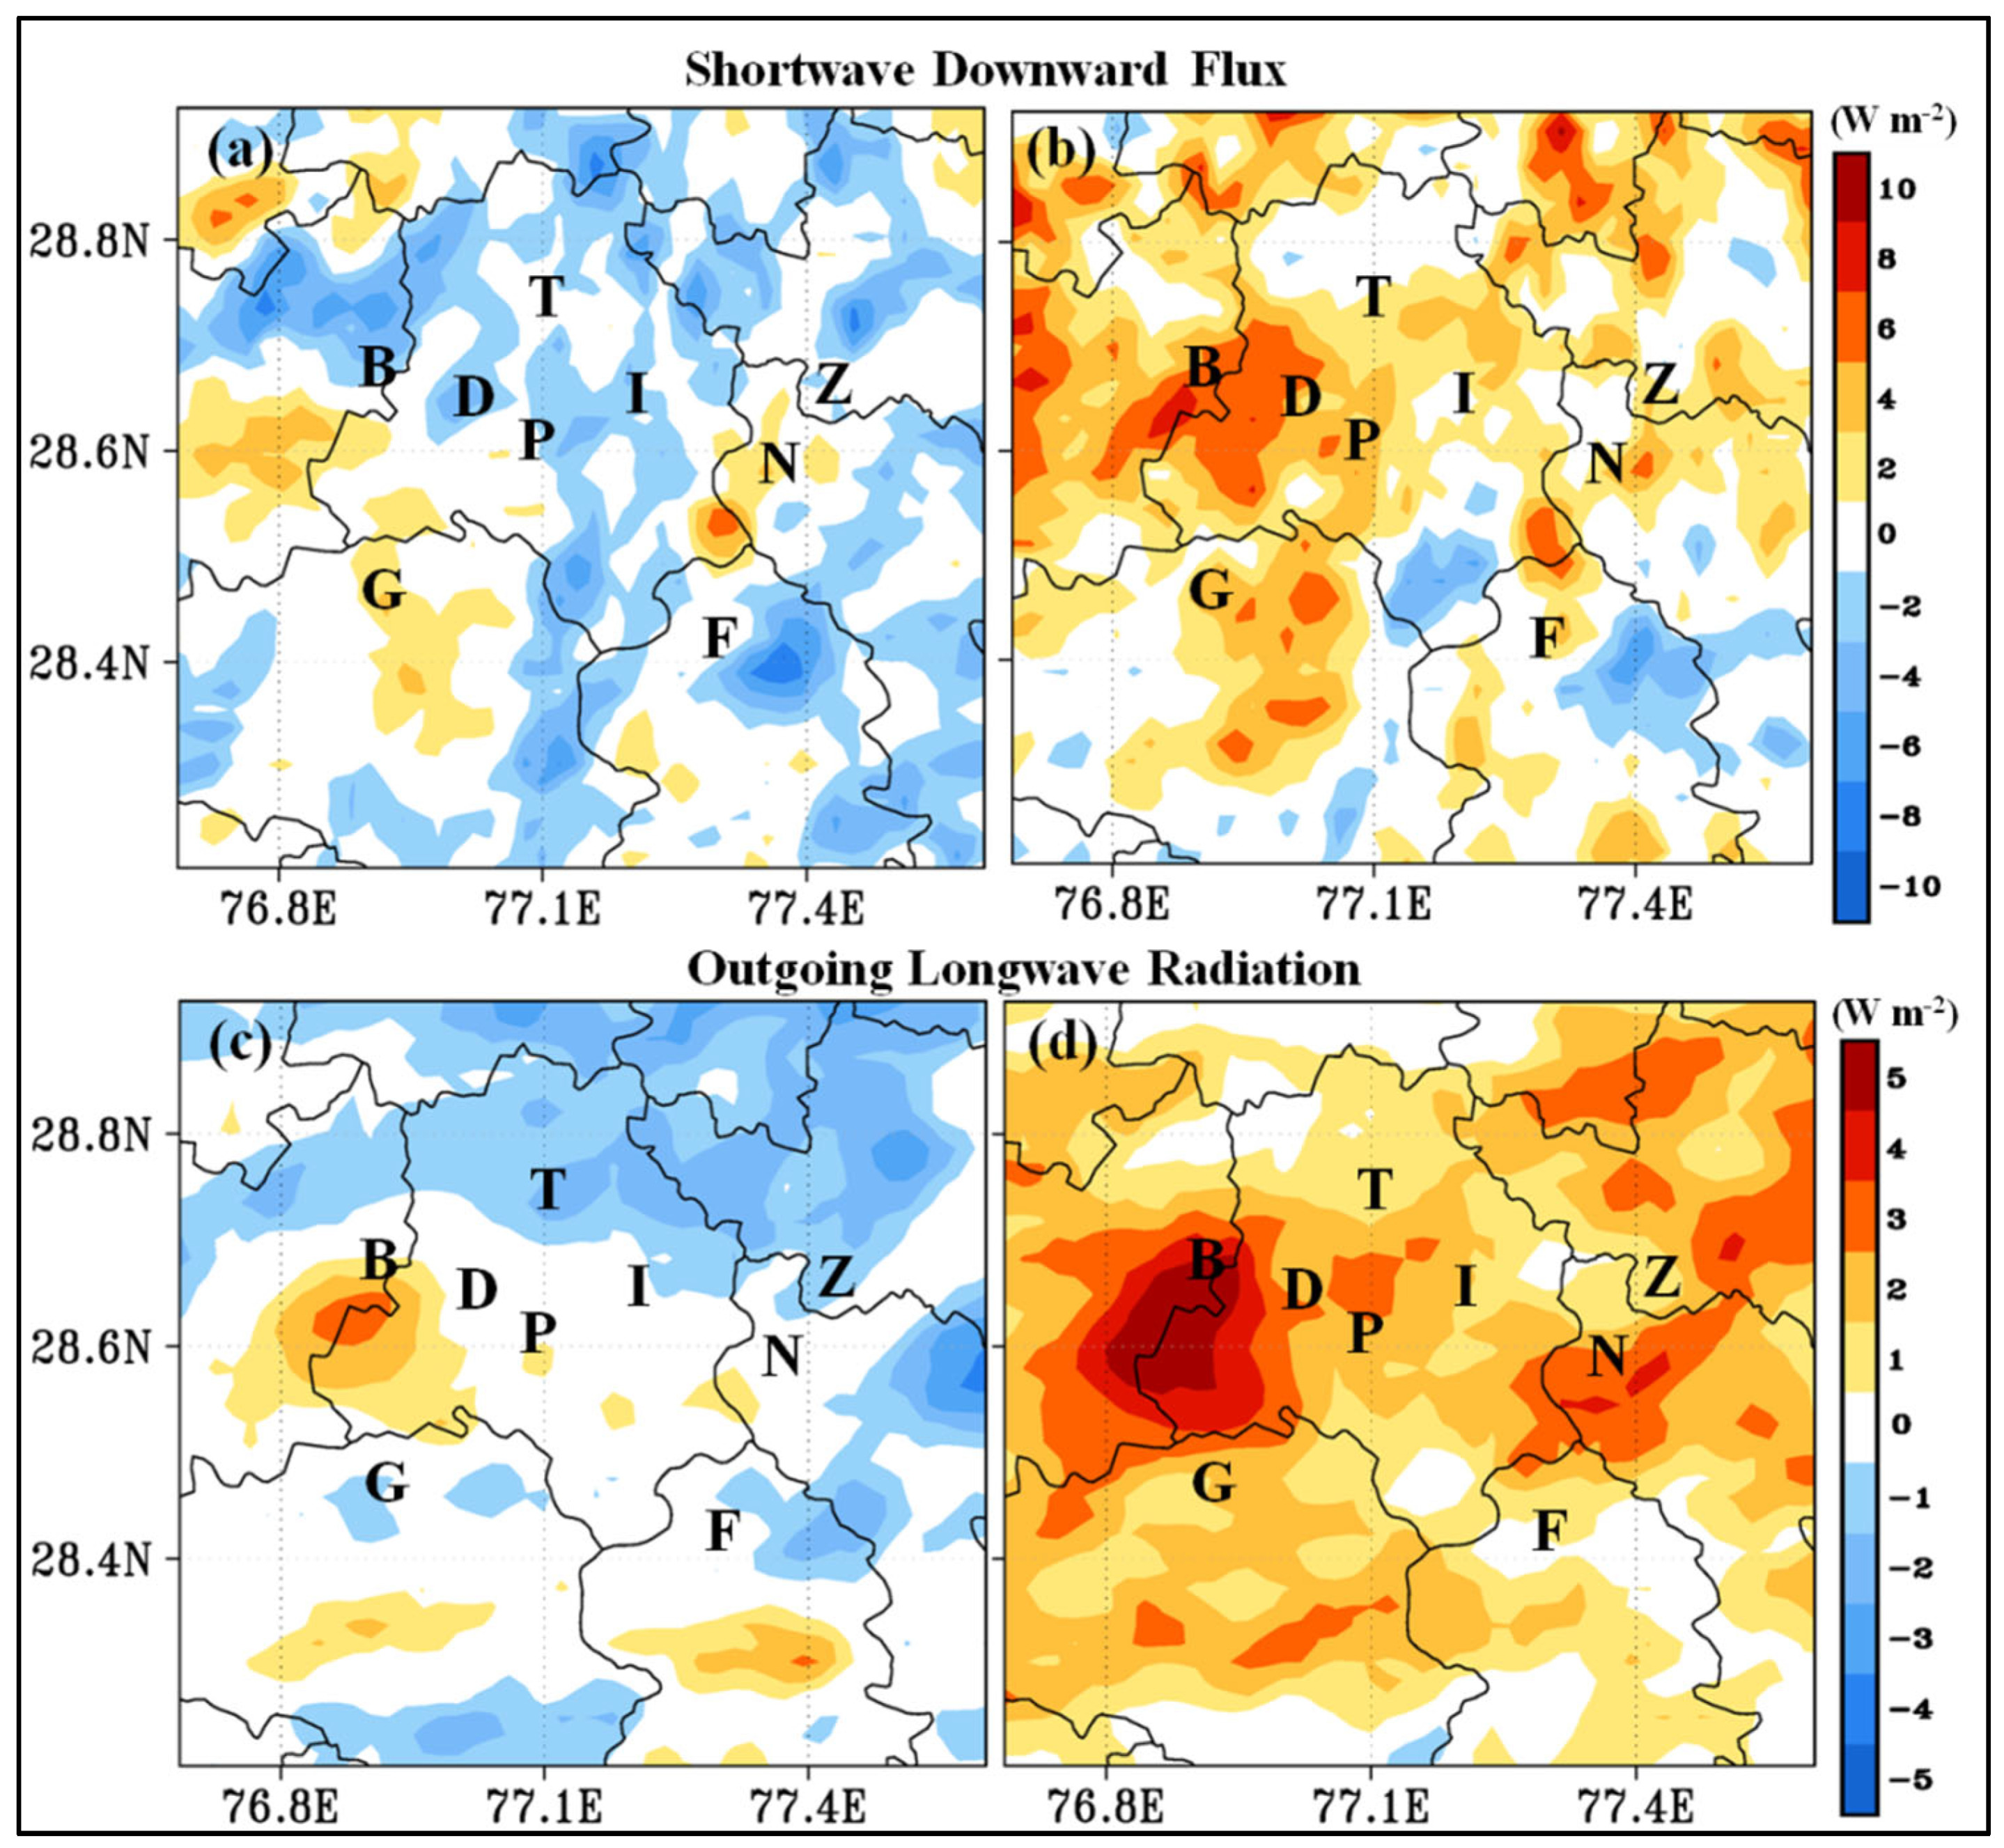
To understand model performance for aerosol–meteorology interactions, the model behaviour over the entire study region with inclusion of feedback effects was studied. Spatial distribution of averaged temperature (from model simulations of 15 days, 1–15 June, period for all four years, i.e., 2007–2010, excluding the first 24 h as spin up) vis-a-vis PM10 concentration and ozone concentration was studied along with shortwave downward flux and outgoing longwave radiation over Delhi. Figure 4, Figure 5, Figure 6 and Figure 7 represents the (right side) difference between the no feedback scenario and case with direct feedback considered and (left side) the difference between no feedback case and case with direct + indirect feedback taken into consideration over Delhi for shortwave downward flux and outgoing longwave radiation, temperature, PM10 concentrations and ozone concentrations respectively. Shortwave radiation was simulated by the model for the daytime (0530 to 1830 h) and for longwave radiation the nocturnal values were mostly stable with variations only during the daytime. As noted generally in ozone chemistry, high values were observed during the day with low values during the nocturnal hours, whereas not much variation was noted with PM10 concentrations.
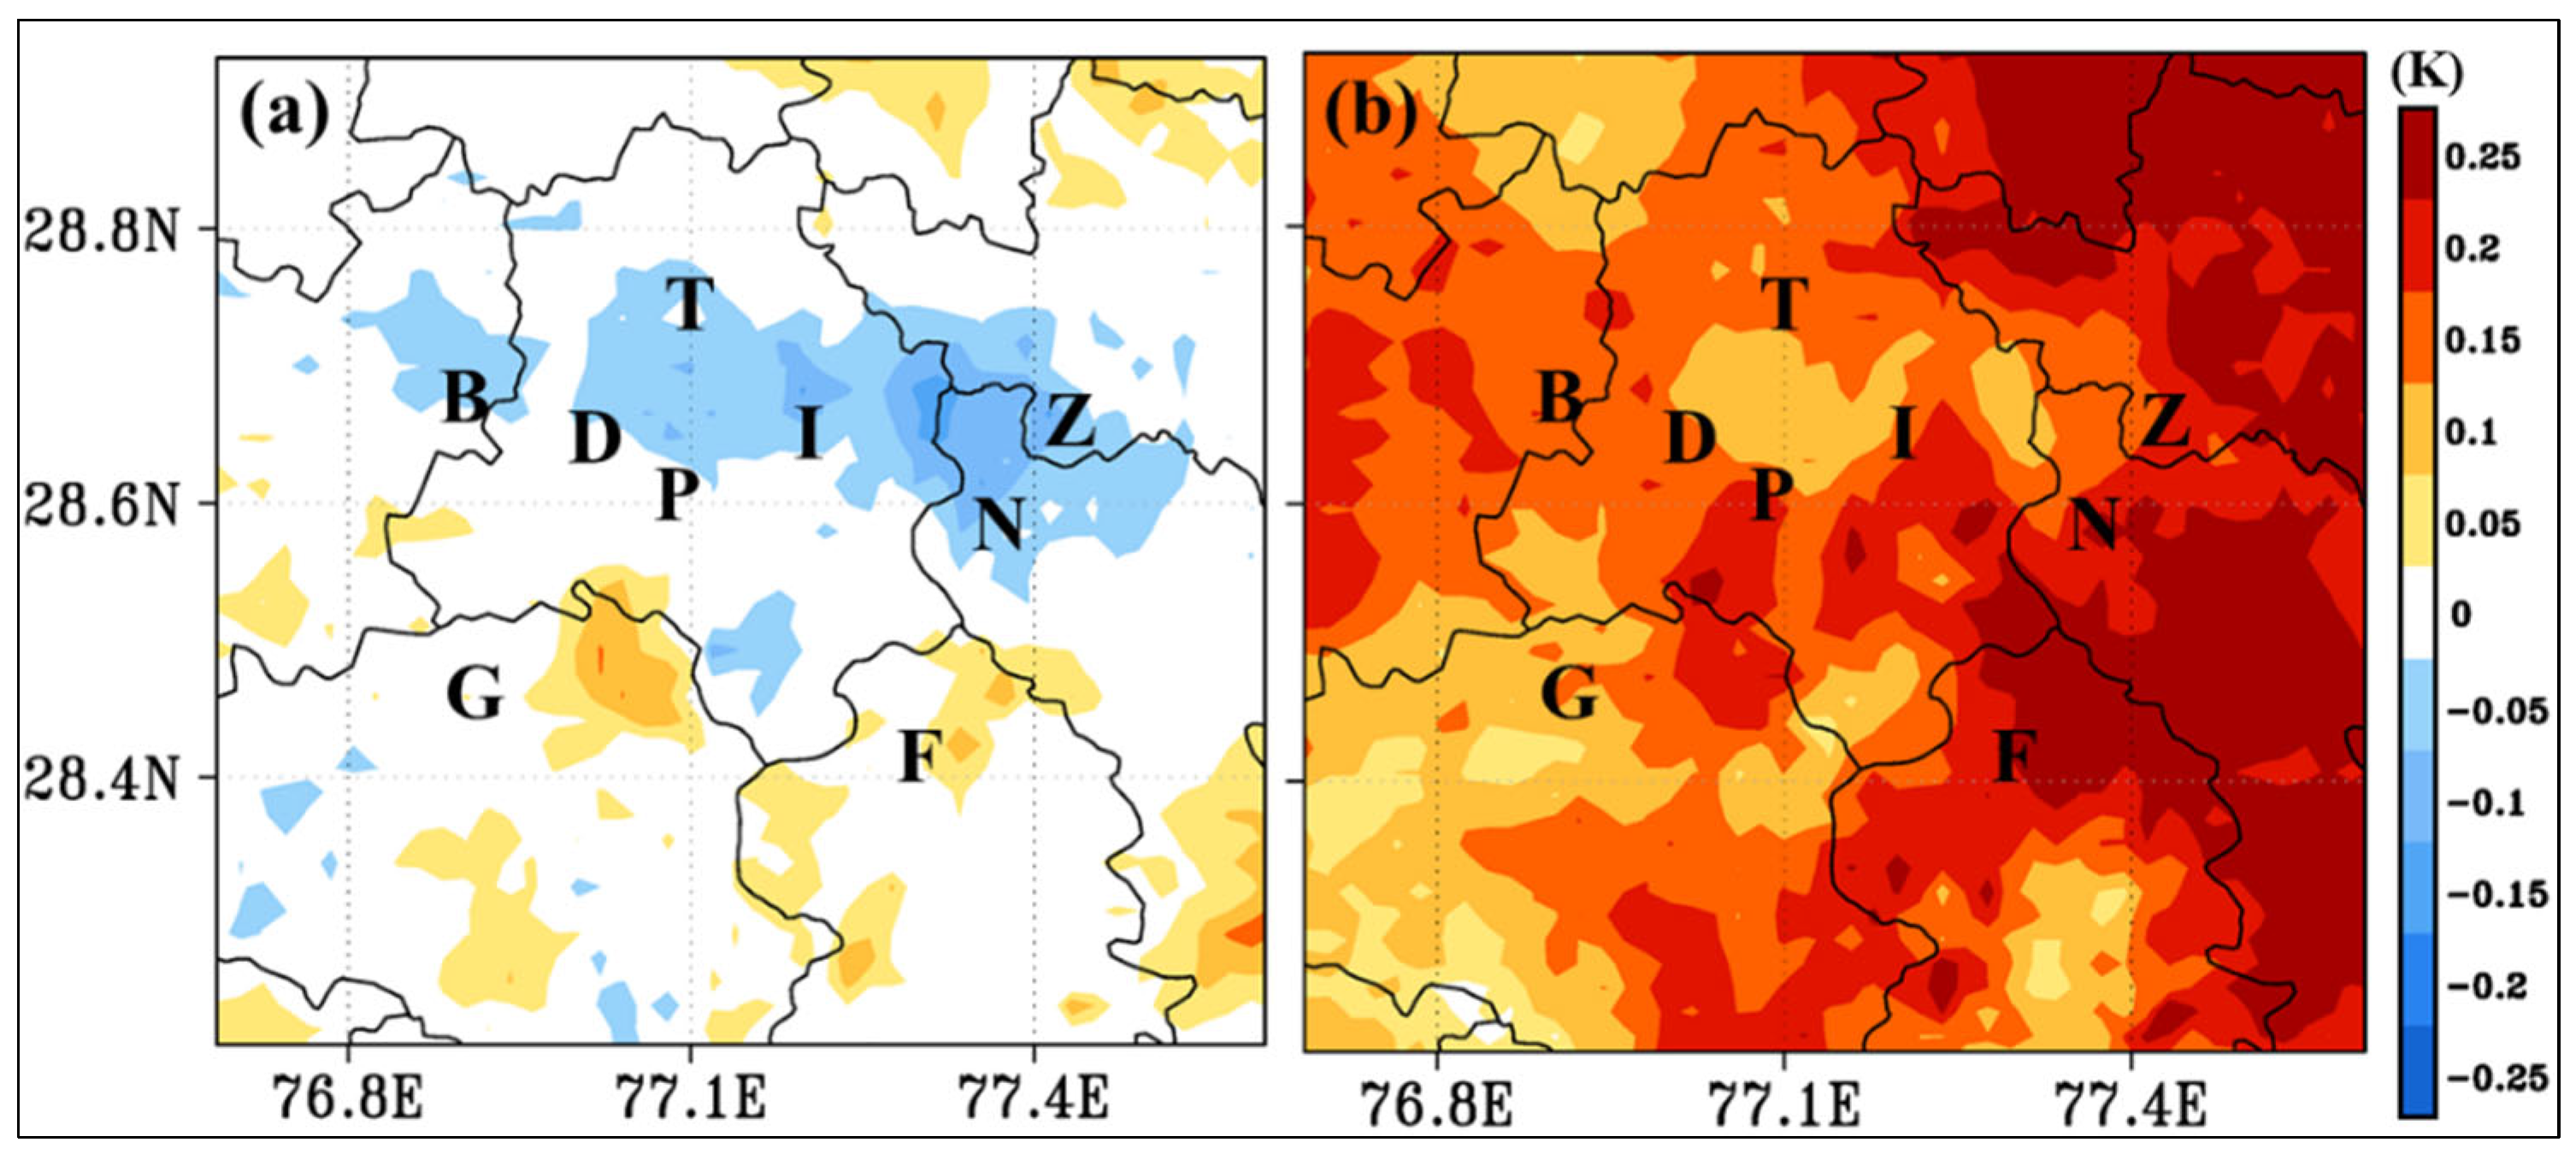
Figure 4a gives the shortwave downward flux with inclusion of direct feedback effect which shows a decrease of about 2 Wm−2 over the entire region except Gurugram and Noida which show an increase of 2 Wm−2. The longwave radiation on inclusion of direct feedback effect (Figure 4c) shows a decrease of 1 Wm−2 for Gurugram and Ghaziabad and 2 Wm−2 for DTU expect for an increase of about 1 Wm−2 at Bahadurgarh. This decrease in radiation is reflected in the decrease in temperature for the direct feedback. In Figure 5a due to inclusion of direct feedback effect, a decrease of about 0.05 to 0.1 K was noted for temperature over entire Delhi, Noida, Ghaziabad and Bahadurgarh however, an increase of 0.05 K was noted for Faridabad. Similarly in Figure 4b,d, the change in shortwave downward flux and longwave radiation respectively due to inclusion of direct + indirect feedback effect over Delhi observed an increase of about 2 to 8 Wm−2 for shortwave downward flux and an increase of about 1 to 5 Wm−2 for longwave radiation. This increase in radiation due to both direct + indirect feedback effect also reflects in the increase in temperature as presented in Figure 5b where an increase of 0.15 K was observed for Bahadurgarh, Gurugram, Dwarka, ITO and DTU, 0.2 K over Punjabi Bagh and Ghaziabad and 0.25 K over Faridabad and Noida. The emitted longwave radiation mostly warms the lower atmosphere thereby, resulting in increase in temperature [62] as given in the Stefan-Boltzmann relationship (FB = σT4) where, the energy flux, FB (W m−2) integrated over all wavelengths is directly proportional to the temperature of the body, T (K). This change in temperature relative to the incorporation of feedback effects was investigated vis-à-vis the absorbing and non-absorbing aerosols. In case of absorbing aerosols, no change was observed in both black carbon (BC) and organic carbon (OC) on inclusion of direct feedback effect neither was a change observed in non-absorbing aerosols. However, for direct + indirect feedback effect, a decrease in simulated non absorbing aerosols (about 0.01 to 0.05 µg/kg-dryair for both sulphate and nitrate) was noted, whereas the simulated absorbing aerosols showed an increase. This increase in absorbing aerosols and decrease in non-absorbing aerosols attributed to the increase noted in radiation which was reflected in the increase in temperature for the direct + indirect feedback effect case. It is also inferred that spatially about 100% of the domain undergoes a change in temperature on inclusion of direct + indirect feedback effect as compared to the 40% change in the domain for direct feedback effect. Planetary boundary layer was also studied where an increase of 10 to 20 m was observed over Delhi, Gurugram and Bahadurgarh and a decrease of 10 m was noted over Faridabad for case with direct feedback effect. With direct + indirect feedback effect included an increase of 20 m was observed over ITO, DTU, Faridabad and Gurugram and 30 m over Ghaziabad, Dwarka and Punjabi Bagh and 50 m over Noida and Bahardurgarh. For the direct feedback effect, with increase in PBL height the surface PM10 concentrations showed a decrease. High near-surface aerosol layer can lead to a warming effect near the surface, such as a thin cloud or fog [63]. In extreme cases such as dust storms, aerosols can cause local longwave warming at the surface as their concentrations can result in alteration of microphysical properties of clouds for the indirect effect [63,64]. Thereby, as dust storms were also witnessed for few days during the simulation, this warming of longwave further impacts the increase in temperature over the study domain. Further, the spatial plots of PM10 and ozone concentrations were analysed.
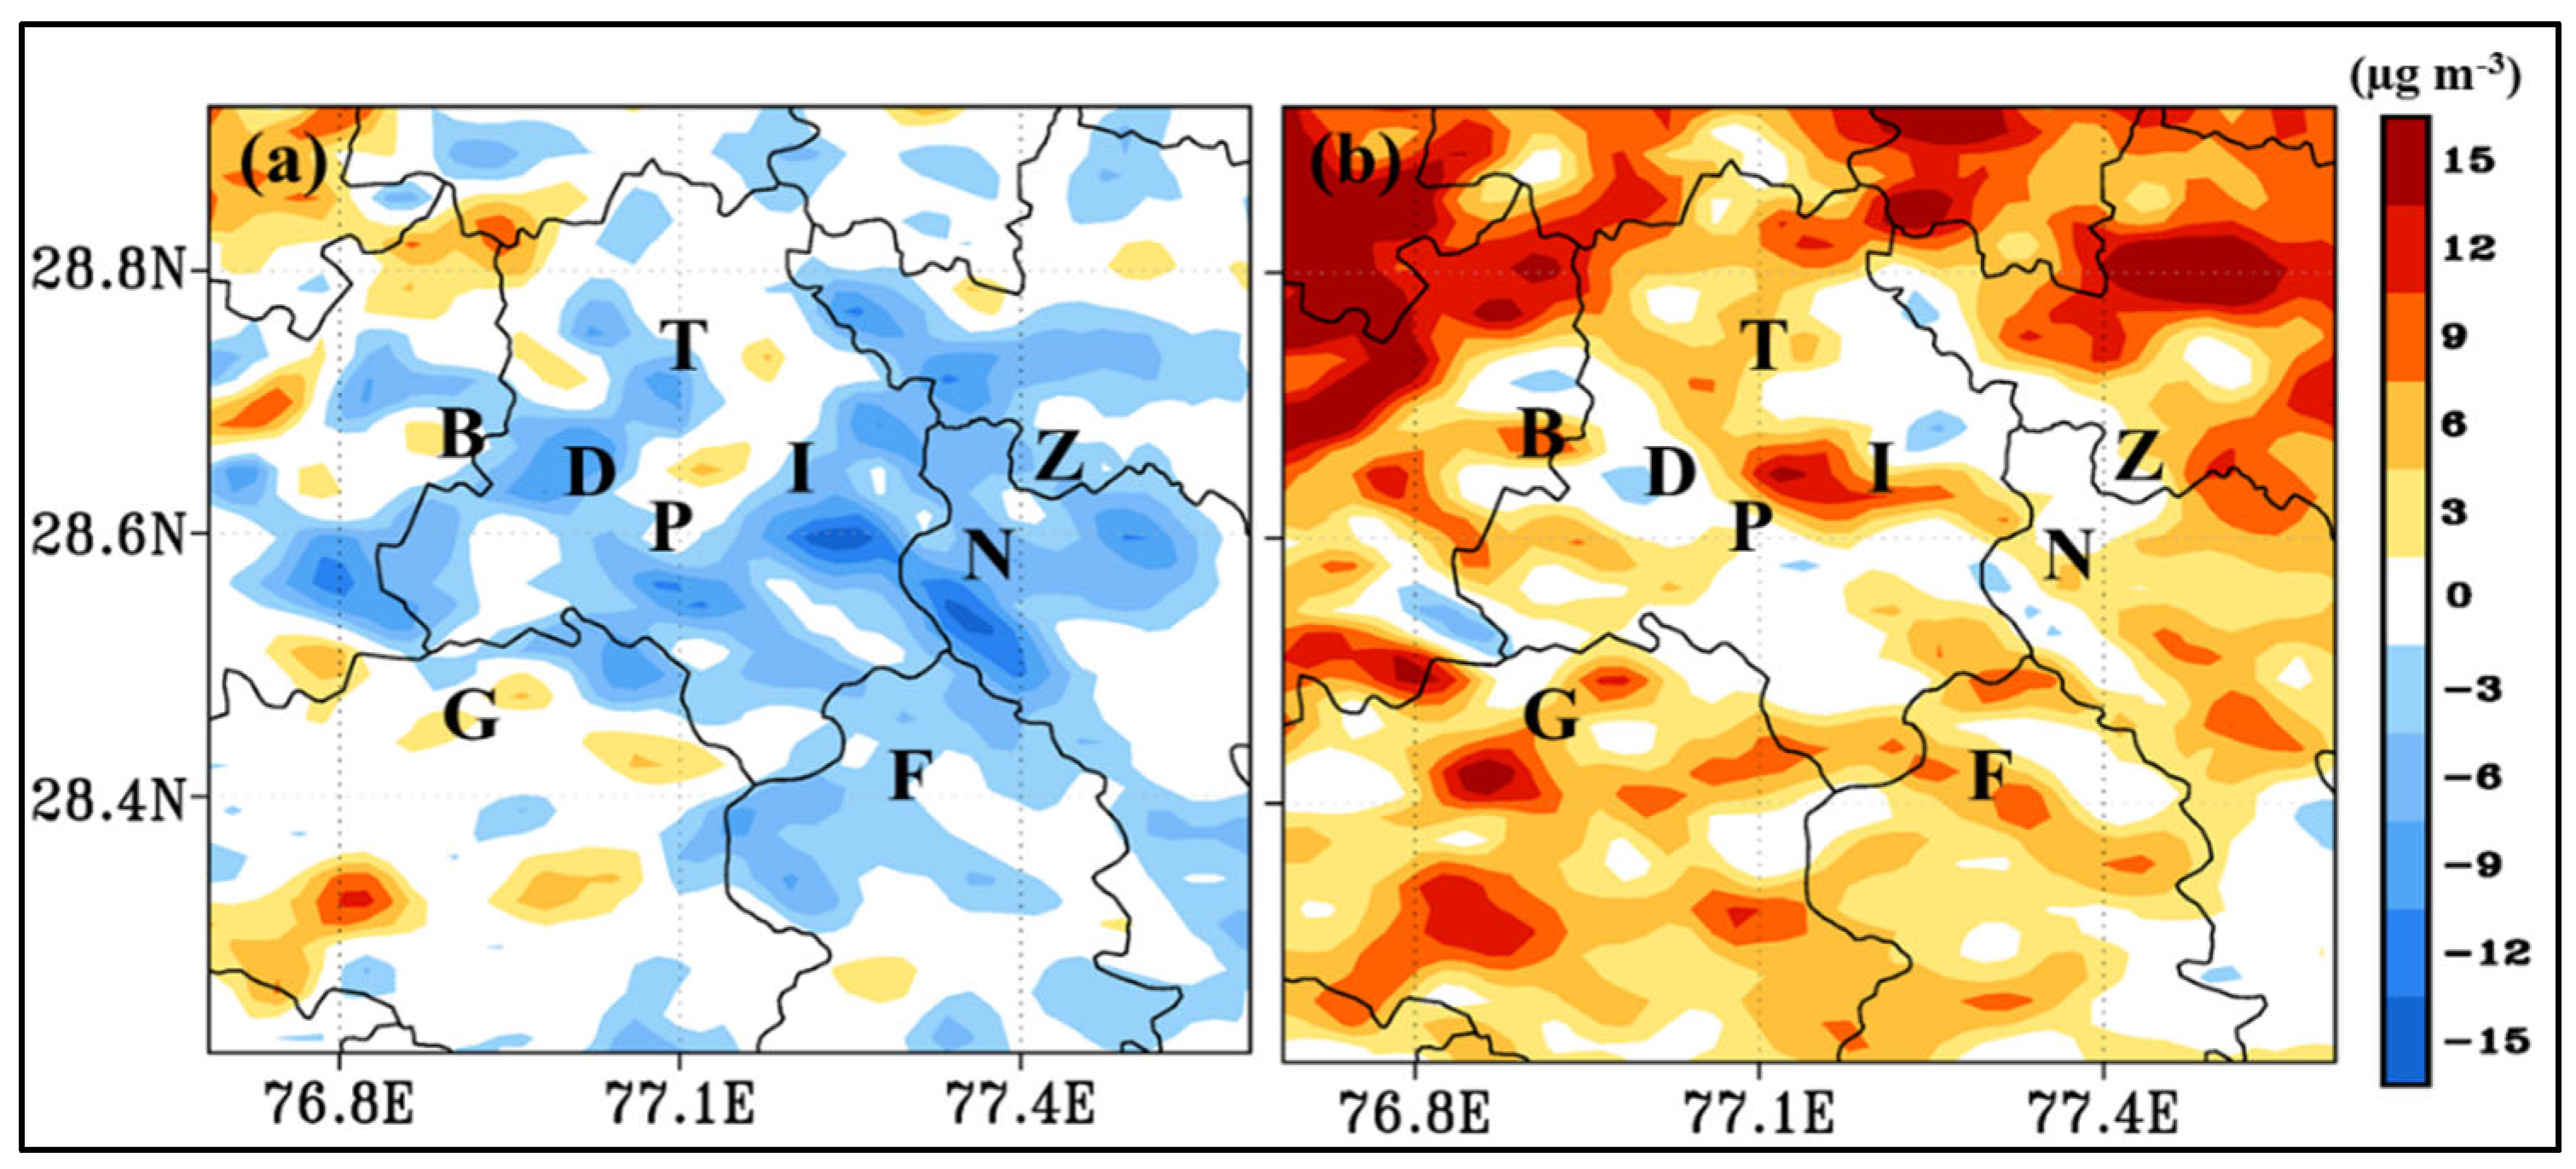
Figure 6a, with inclusion of direct feedback effect the PM10 concentrations, shows a decrease of 3 to 6 µg m−3 and for direct + indirect effect (Figure 6b), PM10 concentrations showed an increase of 6 to 12 µg m−3 over parts of Delhi, Faridabad, Gurugram, Ghaziabad, Noida and Bahadurgarh. As discussed above, the increase in PM10 concentrations is due to the increase in absorbing aerosols. Similar inference was noted in study [20] for assessing impact of meteorology–chemistry interactions over Europe, where for the direct + indirect feedback case, absorbing aerosols showed an increase, as noted in the previous paragraph, which further attributed to increase in PM10 concentrations.
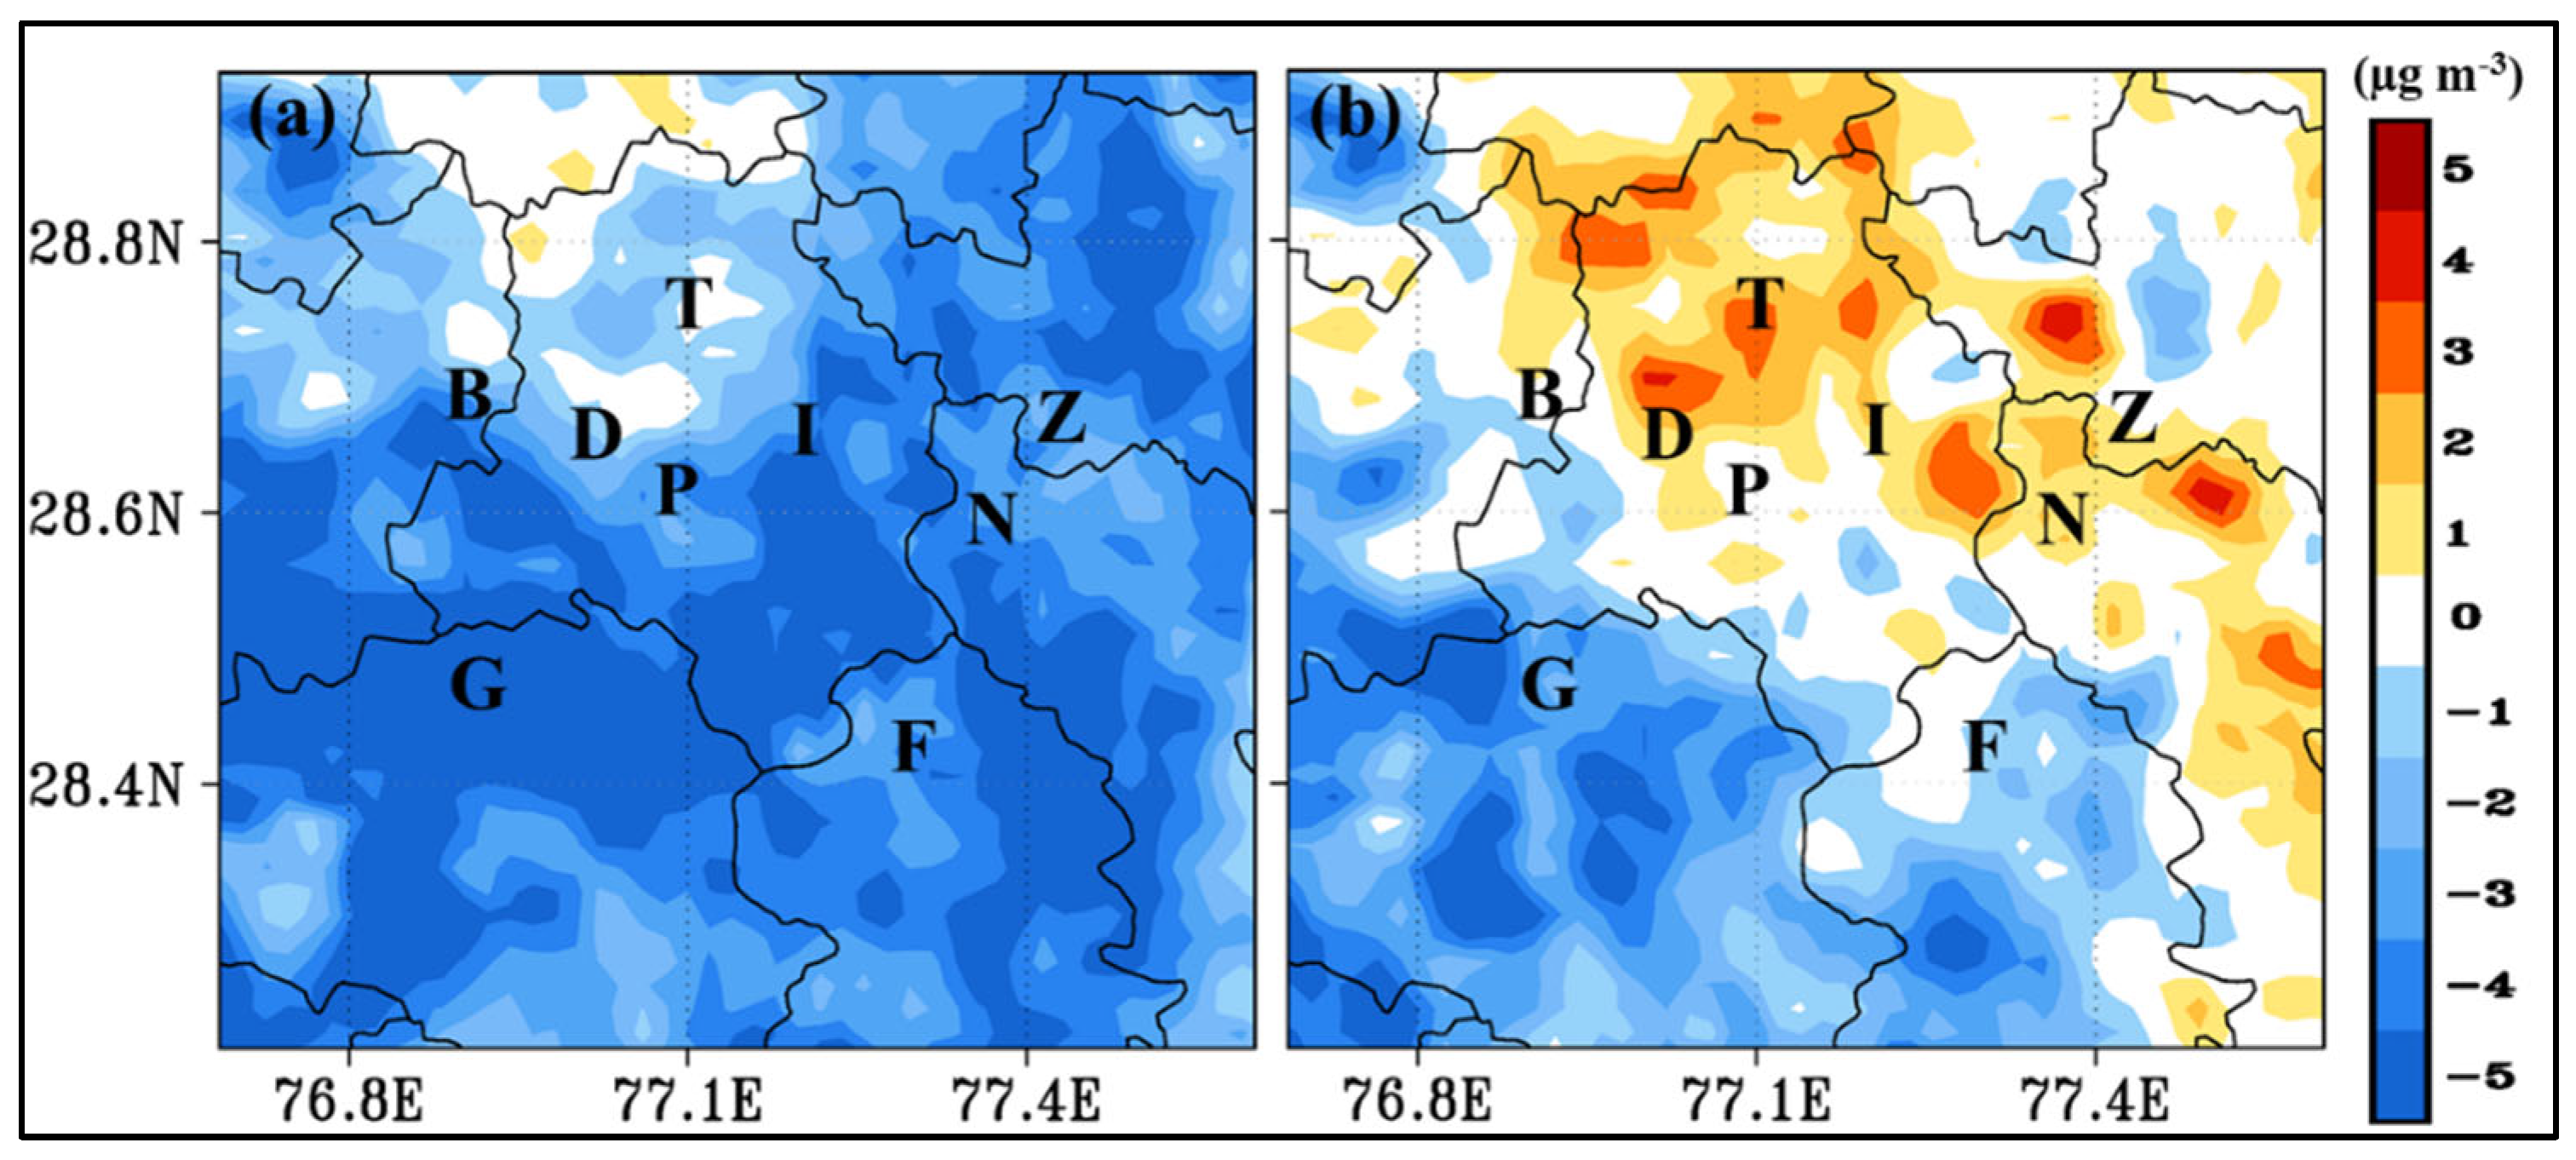
The change in ozone concentrations with inclusion of direct feedback effect (Figure 7a) mostly resulted in decrease of concentration by 1 to 5 µg m−3 over Delhi and surrounding regions and when both direct + indirect feedback effect was taken into account (Figure 7b) the ozone concentrations mostly depicted an increase of 1 to 4 µg m−3 over Delhi, Ghaziabad and Noida. For direct + indirect effect, high temperature enhances reaction rate of ozone production reactions and thus an increase in ozone concentration is noted over Delhi, Noida and Ghaziabad however, a decrease is noted of 1 to 3 µg m−3 over Gurugram and Faridabad. Both ozone chemistry and secondary aerosols are considered in aerosol–cloud interactions schemes (direct + indirect effect). As net radiative forcing from both direct and indirect effects of aerosols modifies temperatures, which in turn impacts the photochemistry pertaining to ozone formation as well as complex chemistry of secondary aerosol formation. The above discussed results are further summarized in Table 1 that represents the quantitative impacts on both meteorological and air quality parameters along with reference to other reported studies performed over Europe [19,20] under varied climatic conditions. The values considered from the reported studies are for the summer season and both of these studies have employed the WRF-Chem model as in the present study. Quantitatively, the range of the present study results for various parameters fall within the range of the two earlier reported studies however, the range of the reported studies are relatively vast in comparison to the range of present study for the correspondingly similar parameters. As the reported study [19] varied climatic zones (such as arid, temperate, cold and polar) as opposed to NCT (present study domain) which is mainly categorized as semi-arid under Köppen climate classification, a vast range of values noted were indicative of the different regions in Europe (such as North and Central Europe, North Atlantic, Russia, major cities such as Po Valley in Northern Italy etc). The PM10 concentrations showed lower values on inclusion of indirect effects except for areas over Mediterranean (with positive biases noted) for reported studies in comparison to the present study. Contrary to this, an increase in PM10 was noted over NCT (present study) for indirect effect, which is similar to the case of areas over Mediterranean. This similarity with the Mediterranean could be due to somewhat similar climatic conditions of both Mediterranean and NCT that experiences hot and dry summers and the areas covered are mostly major cities accompanied with urban anthropogenic PM emissions. As the present study has addressed the feedback effects on semi-arid climatic condition, the impacts noted in meteorological and air quality parameters are more representative of semi-arid climatic condition unlike earlier reported studies that covered more varied climatic zones.
Further, the simulated pollutant concentrations were evaluated against observed data via statistical analysis for cases with and without feedback interaction effects. Model performance of PM10 and ozone concentrations for NCT was evaluated with aid of other statistical parameters viz. NMSE, IOA and FB. The value of NMSE improved from 1.34 (Case A) to 1.2 (Case B) to 1.03 (Case C) for PM10 and 0.72 (Case A) to 0.9 (Case B) to 0.68 (Case C) for ozone. The IOA also showed improvement for Case C with values 0.65 and 0.56 for PM10 and ozone respectively as compared to 0.6 (Case A) and 0.61 (Case B) for PM10 and 0.53 (Case A) and 0.47 (Case B) for ozone. With inclusion of the feedback effects, the under estimation in PM10 concentrations were reduced with FB values improving from 0.6 (Case A) to 0.48 (Case B) to 0.43 (Case C). Similarly, the over estimation in ozone concentrations were also minimized as noted with change in FB values from −0.22 (Case A) to −0.26 (Case B) to −0.18 (Case C). Improvement in model performance is noted with inclusion of direct + indirect feedback effects for PM10 and ozone concentrations. The reason for Case C with better performance could be attributed to the fact that the WRF-Chem model is capable of taking into account the feedback interactions where both meteorological and air quality parameters are simultaneously simulated. With inclusion of feedback effects, it is expected that a more accurate and realistic representation of atmospheric processes is exhibited by the model and thus, the simulated model results are closer to the observations. Aerosol mechanisms showed a greater degree of sensitivity for dust storm days than the effect of aerosol feedbacks on PM10 concentrations in comparison to the non-dust storm days. This emphasizes the importance of appropriate selection of chemical and aerosol mechanisms. The sensitivity to gas phase mechanism has been addressed in an earlier study for the same study area [23], thus the focus in this study was mostly on the aerosol mechanisms and direct and indirect radiative effects that also refers to semi-arid climatic conditions and may further be studied with reference to similar kind of climatic conditions across geographical regions.
5. Conclusions
The present study quantitatively demonstrates the influence of feedback mechanisms over a tropical highly polluted urban airshed of NCT Delhi representing semi-arid climatic conditions. An attempt has been made here to use a chemical transport modelling framework such as the WRF-Chem to showcase the significant impact of both direct and indirect aerosol feedback on local meteorology and air quality. Direct and indirect feedback effects generally contradict each other, which are quantified separately, and the net outcome of the two was analysed in totality. In addition, different aerosol mechanisms are evaluated prior to model implementation for feedback. The salient features of the study are as follows:
- Model simulates PM10 better with MOSAIC as compared to MADE/SORGAM module. It was inferred that using the same dust emission scheme, the sectional approach (MOSAIC) had an advantage over the modal approach (MADE/SORGAM), which simulated higher mass concentrations for dust particles and could also capture the peak concentrations that occurred during the dust-storm period, while MADE/SORGAM showed significant underprediction.
- An overall net increase in radiation indicates that indirect effect dominates due to an increase in absorbing properties of aerosol that is reflected in an increase in PM10 concentration up to 12 μg m−3 for the direct + indirect feedback effect case.
- Spatially, about 40% of the domain showed a change in temperature on inclusion of direct feedback effect as compared to the 100% change in temperature over the study domain for direct + indirect feedback effect.
- For direct + indirect feedback case, an increase in PM10 concentrations (6 to 12 μg m−3) was noted due to an increase in absorbing aerosols and decrease in non-absorbing aerosols, which was attributed to the increase noted in radiation and consequently the temperature (0.15 to 0.25 K).
- The increase in temperature resulted in an increase in ozone concentrations (1 to 3 μg m−3) due to enhanced reaction rates of ozone production reactions and vice-versa for the direct feedback case.
- The warming effect noted due to an increase in temperature was also reflected in the increase in PBL height (about 50 m) with net effect from direct and indirect feedback together.
- As the present study focuses more on a specific climatic zone including greater extremes (i.e., semi-arid), the changes noted in meteorological and air quality parameters are having less variations compared to the reported values of other climatic zones (such as arid, temperate, cold and polar) in the literature. Although for the semi-arid region, temperature change seemed to be low when only the direct effect is considered, the change increased with both direct and indirect effect taken into account, which has impacted the air quality significantly. The vertical profile of concentrations was also affected with such a small change in temperature.
It was inferred that the WRF-Chem model can be successfully applied for future studies in order to provide a better understanding of the interaction between the atmospheric processes and the air quality for the study domain. Despite inclusion of aerosol–meteorology interaction and appropriate gas-phase and aerosol mechanisms, the model still underestimates PM10. Thus, for operational forecast purposes, further improvement is required in the model, such as an improvement in temporal and spatial resolution of emission inventory, improved prediction of meteorological parameters in WRF, finer grid resolution of model domain, urban canopy, heat emissions, etc., which are likely to minimize the model-simulated biases, thereby leading to fewer uncertainties in model predictions. Nevertheless, for process studies, the model provided a greater insight in understanding the various phenomena.
Author Contributions
M.G. arranged the conceptualization, Methodology Validation and Writing-original draft; M.M. arranged the conceptualization, supervision and Writing-review & editing. All authors have read and agreed to the published version of the manuscript.
Funding
This research was supported by Ministry of Earth Sciences under ContractMOES/16/41/2012-RDEAS dt 11/05/2015 and Indian Institute of Technology Delhi under Contract DST-FIST 2014 Project Grant for HPC facility).
Institutional Review Board Statement
Not applicable.
Informed Consent Statement
Not applicable.
Data Availability Statement
Not applicable.
Acknowledgments
The authors thank Central Pollution Control Board (CPCB) for providing air quality data over Delhi. The authors would also like to acknowledge the partial financial assistance by the Ministry of Earth Sciences, Government of India for the project entitled “Study of Atmospheric Aerosols over NCR using Chemical Transport Model” (MOES/16/41/2012-RDEAS dt 11/05/2015) and for providing partial financial assistance as senior research fellowship under the ‘Capacity building in the field of Earth and Atmospheric Sciences’ at CAS (IIT Delhi). The authors acknowledge the DST-FIST 2014 Project grant at CAS (IIT Delhi) provided for the High Performance Computing facility that was useful for conducting this study.
Conflicts of Interest
The authors declare no conflict of interest.
References
- Chapman, E.G.; Gustafson, W.I., Jr.; Easter, R.C.; Barnard, J.C.; Ghan, S.J.; Pekour, M.S.; Fast, J.D. Coupling aerosol-cloud-radiative processes in the WRF-Chem model: Investigating the radiative impact of elevated point sources. Atmos. Chem. Phys. 2009, 9, 945–964. [Google Scholar] [CrossRef] [Green Version]
- Fast Jerome, D.; Gustafson William, I.; Easter Richard, C.; Zaveri Rahul, A.; Barnard James, C.; Chapman Elaine, G.; Grell, G.A.; Peckham Steven, E. Evolution of ozone, particulates, and aerosol direct radiative forcing in the vicinity of Houston using a fully coupled meteorology-chemistry-aerosol model. J. Geophys. Res. Atmos. 2006, 111. [Google Scholar] [CrossRef]
- Liu, Y.; Park Rokjin, J.; Jacob Daniel, J.; Li, Q.; Kilaru, V.; Sarnat Jeremy, A. Mapping annual mean ground-level PM2.5 concentrations using Multiangle Imaging Spectroradiometer aerosol optical thickness over the contiguous United States. J. Geophys. Res. Atmos. 2004, 109. [Google Scholar] [CrossRef]
- Saide, P.E.; Spak, S.N.; Carmichael, G.R.; Mena-Carrasco, M.A.; Yang, Q.; Howell, S.; Leon, D.C.; Snider, J.R.; Bandy, A.R.; Collet, J.L.; et al. Evaluating WRF-Chem aerosol indirect effects in Southeast Pacific marine stratocumulus during VOCALS-REx. Atmos. Chem. Phys. 2012, 12, 3045–3064. [Google Scholar] [CrossRef] [Green Version]
- Schaap, M.; Apituley, A.; Timmermans, R.M.A.; Koelemeijer, R.B.A.; de Leeuw, G. Exploring the relation between aerosol optical depth and PM2.5 at Cabauw, The Netherlands. Atmos. Chem. Phys. 2009, 9, 909–925. [Google Scholar] [CrossRef] [Green Version]
- Michael, M.; Yadav, A.; Tripathi, S.N.; Kanawade, V.P.; Gaur, A.; Sadavarte, P.; Venkataraman, C. Simulation of trace gases and aerosols over the Indian domain: Evaluation of the WRF-Chem model. Geosci. Model Dev. Discuss. 2014, 2014, 431–482. [Google Scholar] [CrossRef]
- Gupta, M.; Mohan, M. Assessment of contribution to PM10 concentrations from long range transport of pollutants using WRF/Chem over a subtropical urban airshed. Atmos. Pollut. Res. 2013, 4, 405–410. [Google Scholar] [CrossRef] [Green Version]
- Seethala, C.; Pandithurai, G.; Fast, J.D.; Polade, S.D.; Reddy, M.S.; Peckham, S.E. Evaluating WRF-Chem multi-scale model in simulating aerosol radiative properties over the tropics—A case study over India. MAPAN 2011, 26, 269–284. [Google Scholar] [CrossRef]
- Mohan, M.; Gupta, M. Sensitivity of PBL parameterizations on PM10 and ozone simulation using chemical transport model WRF-Chem over a sub-tropical urban airshed in India. Atmos. Environ. 2018, 185, 53–63. [Google Scholar] [CrossRef]
- Grell, G.A.; Peckham, S.E.; Schmitz, R.; McKeen, S.A.; Frost, G.; Skamarock, W.C.; Eder, B. Fully coupled “online” chemistry within the WRF model. Atmos. Environ. 2005, 39, 6957–6975. [Google Scholar] [CrossRef]
- Peckham, S.; Grell, G.A.; McKeen, S.A.; Barth, M.; Pfister, G.; Wiedinmyer, C.; Fast, J.D.; Gustafson, W.I.; Zaveri, R.A.; Easter, R.C.; et al. WRF/Chem Version 3.3 User’s Guide, NOAA Technical Memo; US Dept. of Commerce, National Oceanic and Atmospheric Administration, Oceanic and Atmospheric Research Laboratories, Global Systems Division: Washington, DC, USA; Boudler, CO, USA, 2011; pp. 1–99.
- Zhang, H.; DeNero, S.P.; Joe, D.K.; Lee, H.H.; Chen, S.H.; Michalakes, J.; Kleeman, M.J. Development of a source oriented version of the WRF/Chem model and its application to the California regional PM10/PM2.5 air quality study. Atmos. Chem. Phys. 2014, 14, 485–503. [Google Scholar] [CrossRef] [Green Version]
- San, J.R.; Pérez, J.L.; Balzarini, A.; Baró, R.; Curci, G.; Forkel, R.; Galmarini, S.; Grell, G.; Hirtl, M.; Honzak, L.; et al. Sensitivity of feedback effects in CBMZ/MOSAIC chemical mechanism. Atmos. Environ. 2015, 115, 646–656. [Google Scholar] [CrossRef] [Green Version]
- Forkel, R.; Werhahn, J.; Hansen, A.B.; McKeen, S.; Peckham, S.; Grell, G.; Suppan, P. Effect of aerosol-radiation feedback on regional air quality—A case study with WRF/Chem. Atmos. Environ. 2012, 53, 202–211. [Google Scholar] [CrossRef]
- Zhang, Y.; Wen, X.Y.; Jang, C.J. Simulating chemistry-aerosol-cloud-radiation-climate feedbacks over the continental U.S. using the online-coupled Weather Research Forecasting Model with chemistry (WRF/Chem). Atmos. Environ. 2010, 44, 3568–3582. [Google Scholar] [CrossRef]
- Archer-Nicholls, S.; Lowe, D.; Schultz, D.M.; McFiggans, G. Aerosol–radiation–cloud interactions in a regional coupled model: The effects of convective parameterisation and resolution. Atmos. Chem. Phys. 2016, 16, 5573–5594. [Google Scholar] [CrossRef] [Green Version]
- Huang, Y.; Dickinson, R.E.; Chameides, W.L. Impact of aerosol indirect effect on surface temperature over East Asia. Proc. Natl. Acad. Sci. USA 2006, 103, 4371. [Google Scholar] [CrossRef] [Green Version]
- Luo, G.; Yu, F. Simulation of particle formation and number concentration over the Eastern United States with the WRF-Chem + APM model. Atmos. Chem. Phys. 2011, 11, 11521–11533. [Google Scholar] [CrossRef] [Green Version]
- Forkel, R.; Balzarini, A.; Baró, R.; Bianconi, R.; Curci, G.; Jiménez-Guerrero, P.; Hirtl, M.; Honzak, L.; Lorenz, C.; Im, U.; et al. Analysis of the WRF-Chem contributions to AQMEII phase2 with respect to aerosol radiative feedbacks on meteorology and pollutant distributions. Atmos. Environ. 2015, 115, 630–645. [Google Scholar] [CrossRef]
- Kong, X.; Forkel, R.; Sokhi, R.S.; Suppan, P.; Baklanov, A.; Gauss, M.; Brunner, D.; Barò, R.; Balzarini, A.; Chemel, C.; et al. Analysis of meteorology–chemistry interactions during air pollution episodes using online coupled models within AQMEII phase2. Atmos. Environ. 2015, 115, 527–540. [Google Scholar] [CrossRef]
- WHO. WHO Global Urban Ambient Air Pollution Database. Update 2018. Available online: http://www.who.int/phe/health_topics/outdoorair/databases/cities/en/ (accessed on 11 May 2018).
- OECD. OECD Environmental Outlook to 2050: The Consequences of Inaction; OECD Publishing: Paris, France, 2012. [Google Scholar] [CrossRef]
- Gupta, M.; Mohan, M. Validation of WRF/Chem model and sensitivity of chemical mechanisms to ozone simulation over megacity Delhi. Atmos. Environ. 2015, 122, 220–229. [Google Scholar] [CrossRef]
- Gao, Y.; Zhao, C.; Liu, X.; Zhang, M.; Leung, L.R. WRF-Chem simulations of aerosols and anthropogenic aerosol radiative forcing in East Asia. Atmos. Environ. 2014, 92, 250–266. [Google Scholar] [CrossRef]
- Kumar, R.; Naja, M.; Pfister, G.G.; Barth, M.C.; Brasseur, G.P. Source attribution of carbon monoxide in India and surrounding regions during wintertime. J. Geophys. Res. Atmos. 2013, 118, 1981–1995. [Google Scholar] [CrossRef] [Green Version]
- Kumar, R.; Naja, M.; Pfister, G.G.; Barth, M.C.; Wiedinmyer, C.; Brasseur, G.P. Simulations over South Asia using the Weather Research and Forecasting model with Chemistry (WRF-Chem): Chemistry evaluation and initial results. Geosci. Model Dev. 2012, 5, 619–648. [Google Scholar] [CrossRef] [Green Version]
- Beig, G.; Chate, D.M.; Ghude, S.D.; Mahajan, A.S.; Srinivas, R.; Ali, K.; Sahu, S.K.; Parkhi, N.; Surendran, D.; Trimbake, H.R. Quantifying the effect of air quality control measures during the 2010 Commonwealth Games at Delhi, India. Atmos. Environ. 2013, 80, 455–463. [Google Scholar] [CrossRef]
- Jiang, X.; Barth, M.C.; Wiedinmyer, C.; Massie, S.T. Influence of anthropogenic aerosols on the Asian monsoon: A case study using the WRF-Chem model. Atmos. Chem. Phys. Discuss. 2013, 2013, 21383–21425. [Google Scholar] [CrossRef] [Green Version]
- Marrapu, P.; Cheng, Y.; Beig, G.; Sahu, S.; Srinivas, R.; Carmichael, G.R. Air quality in Delhi during the Commonwealth Games. Atmos. Chem. Phys. 2014, 14, 10619–10630. [Google Scholar] [CrossRef] [Green Version]
- Sati, A.P.; Mohan, M. Impact of increase in urban sprawls representing five decades on summer-time air quality based on WRF-Chem model simulations over central-National Capital Region, India. Atmos. Pollut. Res. 2021, 12, 404–416. [Google Scholar] [CrossRef]
- Mohan, M.; Bhati, S. Analysis of WRF Model Performance over Subtropical Region of Delhi, India. Adv. Meteorol. 2011, 2011. [Google Scholar] [CrossRef] [Green Version]
- Lin, Y.-L.; Farley, R.D.; Orville, H.D. Bulk parameterization of the snow field in a cloud model. J. Clim. Appl. Meteorol. 1983, 22, 1065–1092. [Google Scholar] [CrossRef] [Green Version]
- WRF. 2012. Available online: http://www.mmm.ucar.edu/wrf/users/downloads.html (accessed on 22 March 2012).
- Janssens-Maenhout, G.; Crippa, M.; Guizzardi, D.; Dentener, F.; Muntean, M.; Pouliot, G.; Keating, T.; Zhang, Q.; Kurokawa, J.; Wankmüller, R.; et al. HTAP_v2.2: A mosaic of regional and global emission grid maps for 2008 and 2010 to study hemispheric transport of air pollution. Atmos. Chem. Phys. 2015, 15, 11411–11432. [Google Scholar] [CrossRef] [Green Version]
- Emmons, L.K.; Walters, S.; Hess, P.G.; Lamarque, J.F.; Pfister, G.G.; Fillmore, D.; Granier, C.; Guenther, A.; Kinnison, A.; Laepple, T.; et al. Description and evaluation of the Model for Ozone and Related chemical Tracers, version 4 (MOZART-4). Geosci. Model Dev. 2010, 3, 43–67. [Google Scholar] [CrossRef] [Green Version]
- CPCB. 2018. Available online: http://www.cpcb.gov.in/CAAQM/frmUserAvgReportCriteria.aspx (accessed on 17 May 2018).
- WMO. Overview of Tools and Methods for Meteorological and Air Pollution Mesoscale Model Evaluation and User Training. Joint Report of COST Action 728 and GURME; World Meteorological Organization: Geneva, Switzerland, 2008; Available online: http://www.cost.eu/media/publications/09-08-Overview-of-Tools-and-Methods-for-Meteorological-and-Air-Pollution-Mesoscale (accessed on 12 March 2012).
- Ahmadov, R.; McKeen, S.A.; Robinson, A.L.; Bahreini, R.; Middlebrook, A.M.; Gouw, J.A.; Meagher, J.; Hsie, E.-Y.; Edgerton, E.; Shaw, S.; et al. A volatility basis set model for summertime secondary organic aerosols over the eastern United States in 2006. J. Geophys. Res. Atmos. 2012, 117. [Google Scholar] [CrossRef]
- Fast, J. How Do We Know that Aerosol Forecasts are Improving for the Right Reasons? Using Testbeds to Address Modeling Challenges; Pacific Northwest National Laboratory, IWAQFR: Washington, DC, USA; Boulder, CO, USA, 2009. [Google Scholar]
- Mann, G.W.; Carslaw, K.S.; Ridley, D.A.; Spracklen, D.V.; Pringle, K.J.; Merikanto, J.; Korhonen, H.; Schwarz, J.P.; Lee, L.A.; Manktelow, P.T.; et al. Intercomparison of modal and sectional aerosol microphysics representations within the same 3-D global chemical transport model. Atmos. Chem. Phys. 2012, 12, 4449–4476. [Google Scholar] [CrossRef] [Green Version]
- Zaveri Rahul, A.; Easter Richard, C.; Fast Jerome, D.; Peters Leonard, K. Model for Simulating aerosol interactions and chemistry (MOSAIC). J. Geophys. Res. Atmos. 2008, 113. [Google Scholar] [CrossRef]
- Ackermann, I.J.; Hass, H.; Memmesheimer, M.; Ziegenbein, C.; Ebel, A. The parameterization of the sulfate-nitrate-ammonia aerosol system in the long-range transport model EURAD. Meteorol. Atmos. Phys. 1995, 57, 101–114. [Google Scholar] [CrossRef]
- Schell, B.; Ackermann Ingmar, J.; Hass, H.; Binkowski Francis, S.; Ebel, A. Modeling the formation of secondary organic aerosol within a comprehensive air quality model system. J. Geophys. Res. Atmos. 2001, 106, 28275–28293. [Google Scholar] [CrossRef]
- Bromley Leroy, A. Thermodynamic properties of strong electrolytes in aqueous solutions. AIChE J. 1973, 19, 313–320. [Google Scholar] [CrossRef]
- Nenes, A.; Pandis, S.N.; Pilinis, C. ISORROPIA: A new thermodynamic equilibrium model for multiphase multicomponent inorganic aerosols. Aquat. Geochem. 1998, 4, 123–152. [Google Scholar] [CrossRef]
- Wexler, A.S.; Lurmann, F.W.; Seinfeld, J.H. Modelling urban and regional aerosols—I. model development. Atmos. Environ. 1994, 28, 531–546. [Google Scholar] [CrossRef]
- Whitby, E.R.; McMurry, P.H.; Shankar, U.; Binkowski, F.S. Modal Aerosol Dynamics Modeling. Rep. 600/3—91/020. Atmospheric Research and Exposure Assess; Lab., U.S. Environmental Protection Agency: Research Triangle Park, NC, USA, 1991; (available as NTIS PB91- 161729/AS from Natl. Tech. Inf. Serv., Springfield, VA, USA, 1991).
- Jacobson, M.Z.; Turco, R.P.; Jensen, E.J.; Toon, O.B. Modeling coagulation among particles of different composition and size. Atmos. Environ. 1994, 28, 1327–1338. [Google Scholar] [CrossRef]
- Zaveri Rahul, A.; Easter Richard, C.; Peters Leonard, K. A computationally efficient Multicomponent Equilibrium Solver for Aerosols (MESA). J. Geophys. Res. Atmos. 2005, 110. [Google Scholar] [CrossRef]
- Zaveri Rahul, A.; Easter Richard, C.; Wexler Anthony, S. A new method for multicomponent activity coefficients of electrolytes in aqueous atmospheric aerosols. J. Geophys. Res. Atmos. 2005, 110. [Google Scholar] [CrossRef]
- Tewari, M.; Warner, T.T.; Coirier, W.J.; Kim, S. Numerical Modeling Study of Wind Flow Over the Salt Lake City Region Using Integrated WRF– Noah–UCM Model at Meso–Gamma Scale. 2005. Available online: http://www.mmm.ucar.edu/wrf/users/workshops/WS2005/presentations/session4/3–Tewari.pdf (accessed on 12 March 2012).
- Spak, S.N.; Holloway, T. Seasonality of speciated aerosol transport over the Great Lakes region. J. Geophys. Res. Atmos. 2009, 114, D08302. [Google Scholar] [CrossRef]
- Zawar-Reza, P.; Kingham, S.; Pearce, J. Evaluation of a year-long dispersion modelling of PM10 using the mesoscale model TAPM for Christchurch, New Zealand. Sci. Total Environ. 2005, 349, 249–259. [Google Scholar] [CrossRef]
- Zhao, C.; Liu, X.; Leung, L.R.; Johnson, B.; McFarlane, S.A.; Gustafson, W.I., Jr.; Fast, J.D.; Easter, R. The spatial distribution of mineral dust and its shortwave radiative forcing over North Africa: Modeling sensitivities to dust emissions and aerosol size treatments. Atmos. Chem. Phys. 2010, 10, 8821–8838. [Google Scholar] [CrossRef] [Green Version]
- Govardhan, G.; Nanjundiah, R.S.; Satheesh, S.K.; Krishnamoorthy, K.; Kotamarthi, V.R. Performance of WRF-Chem over Indian region: Comparison with measurements. J. Earth Syst. Sci. 2015, 124, 875–896. [Google Scholar] [CrossRef] [Green Version]
- Gunturu, U.B. Aerosol-Cloud Interactions: A New Perspective in Precipitation Enhancement. Ph.D. Thesis, Massachusetts Institute of Technology, Cambridge, MA, USA, 2010. Available online: https://globalchange.mit.edu/sites/default/files/Gunturu_PhD_10.pdf (accessed on 27 March 2012).
- Bangert, M.; Nenes, A.; Vogel, B.; Vogel, H.; Barahona, D.; Karydis, V.A.; Kumar, P.; Kottmeier, C.; Blahak, U. Saharan dust event impacts on cloud formation and radiation over Western Europe. Atmos. Chem. Phys. 2012, 12, 4045–4063. [Google Scholar] [CrossRef] [Green Version]
- Twomey, S. Pollution and the planetary albedo. Atmos. Environ. 1974, 8, 1251–1256. [Google Scholar] [CrossRef]
- Albrecht, B.A. Aerosols, cloud microphysics, and fractional cloudiness. Science 1989, 245, 1227. [Google Scholar] [CrossRef] [PubMed]
- McComiskey, A.; Feingold, G.; Frisch, A.S.; Turner David, D.; Miller Mark, A.; Chiu, J.C.; Min, Q.; Ogren John, A. An assessment of aerosol-cloud interactions in marine stratus clouds based on surface remote sensing. J. Geophys. Res. Atmos. 2009, 114. [Google Scholar] [CrossRef] [Green Version]
- Fast, J. Aerosol-Radiation-Microphysics Interactions; WRF-Chem Tutorial, 3 August 2015, Boulder, CO, USA; Pacific Northwest National Laboratory: Washington, DC, USA, 2015. Available online: https://ruc.noaa.gov/wrf/wrf-chem/wrf_tutorial_2015/WRF_CHEM_feedbacks.pdf (accessed on 27 May 2012).
- NASA—National Aeronautics and Space Administration. Science Mission Directorate. The Earth’s Radiation Budget. 2010. Available online: http://science.nasa.gov/ems/13_radiationbudget (accessed on 17 January 2018).
- Zhou, Y.; Savijari, H. The effect of aerosols on long wave radiation and global warming. Atmos. Environ. 2014, 135–136, 102–111. [Google Scholar] [CrossRef] [Green Version]
- Wang, C.; Tang, B.-H.; Wu, H.; Tang, R.; Zhao, L. Estimation of downwelling surface longwave radiation under heavy dust aerosol sky. Remote Sens. 2017, 9, 207. [Google Scholar] [CrossRef] [Green Version]
Figure 1.
Simulation domains (left panel) covering (i) Asia (54 km resolution) as domain 1, India (18 km resolution) as domain 2, parts of North India (6 km resolution) as domain 3 and domain 4 enveloping National Capital Region (2 km resolution) along with Delhi map (right panel) indicating location of monitoring stations of Central Pollution Control Board (CPCB).

Figure 2.
Hourly scatter plot of simulated PM10 concentrations with (a) MOSAIC aerosol module and (b) MADE/SORGAM aerosol module against observed PM10 levels over Delhi.
Figure 2.
Hourly scatter plot of simulated PM10 concentrations with (a) MOSAIC aerosol module and (b) MADE/SORGAM aerosol module against observed PM10 levels over Delhi.

Figure 3.
Daily averaged time-series plot of simulated PM10 concentrations with MADE/SORGAM aerosol module (red) and MOSAIC aerosol module (green) against observed PM10 levels (black) for years (a) 2007, (b) 2008, (c) 2009 and (d) 2010 over Delhi.
Figure 3.
Daily averaged time-series plot of simulated PM10 concentrations with MADE/SORGAM aerosol module (red) and MOSAIC aerosol module (green) against observed PM10 levels (black) for years (a) 2007, (b) 2008, (c) 2009 and (d) 2010 over Delhi.

Figure 4.
Spatial plots of (a) difference of shortwave downward flux (W m−2) between case with direct feedback and no feedback (Case B—Case A). (b) Difference of shortwave downward flux (W m−2) between case with direct and indirect feedback and no feedback (Case C—Case A) over NCT. (c) Difference of outgoing longwave radiation (W m−2) between case with direct feedback and no feedback (Case B—Case A). (d) Difference of outgoing longwave radiation (W m−2) between case with direct and indirect feedback and no feedback (Case C—Case A) over NCT. (P: Punjabi Bagh, D: Dwarka, I: ITO, T: DTU, N: Noida, Z: Ghaziabad, F: Faridabad, G: Gurugram and B: Bahadurgarh).

Figure 5.
Spatial plots of (a) difference of temperature values (K) between case with direct feedback and no feedback (Case B—Case A). (b) Difference of temperature values (K) between case with direct and indirect feedback and no feedback (Case C—Case A) over NCT. (P: Punjabi Bagh, D: Dwarka, I: ITO, T: DTU, N: Noida, Z: Ghaziabad, F: Faridabad, G: Gurugram and B: Bahadurgarh).

Figure 6.
Spatial plots of (a) difference of PM10 concentrations (µg m−3) between case with direct feedback and no feedback (Case B—Case A) and (b) difference of PM10 concentrations (µg m−3) between case with direct and indirect feedback and no feedback (Case C—Case A) over NCT. (P: Punjabi Bagh, D: Dwarka, I: ITO, T: DTU, N: Noida, Z: Ghaziabad, F: Faridabad, G: Gurugram and B: Bahadurgarh).

Figure 7.
Spatial plots of (a) difference of ozone concentrations (µg m−3) between case with direct feedback and no feedback (Case B—Case A) and (b) difference of ozone concentrations (µg m−3) between case with direct and indirect feedback and no feedback (Case C—Case A) over NCT. (P: Punjabi Bagh, D: Dwarka, I: ITO, T: DTU, N: Noida, Z: Ghaziabad, F: Faridabad, G: Gurugram and B: Bahadurgarh).


Table 1.
Quantitative impact on both meteorological and air quality parameters for aerosol-radiation feedback (i.e., direct effect) and aerosol–radiation–cloud feedback (i.e., direct + indirect effect) for NCT.
Table 1.
Quantitative impact on both meteorological and air quality parameters for aerosol-radiation feedback (i.e., direct effect) and aerosol–radiation–cloud feedback (i.e., direct + indirect effect) for NCT.
| Temperature (K) | Shortwave Downward Flux (W m−2) | Outgoing Longwave Radiation Flux (W m−2) | PM10 Concentration (μg m−3) | Ozone Concentration (μg m−3) | |
|---|---|---|---|---|---|
| Impact of Direct Effect | |||||
| Present Study | −0.1 to 0.1 | −6 to 6 | −2 to −1 | −6 to −3 | −5 to −1 |
| Reported Values [19,20] | −0.35 to −0.05 | −32 to −2 | - | −6 to 1 | −1.8 to −0.2 |
| Impact of Direct Effect + Indirect Effect | |||||
| Present Study | 0.15 to 0.25 | 2 to 8 | 1 to 5 | 6 to 12 | 1 to 3 |
| Reported Values [19,20] | −0.35 to 0.45 | −32 to 36 | - | −10 to 6 | 2 to 18 |
Publisher’s Note: MDPI stays neutral with regard to jurisdictional claims in published maps and institutional affiliations. |
© 2021 by the authors. Licensee MDPI, Basel, Switzerland. This article is an open access article distributed under the terms and conditions of the Creative Commons Attribution (CC BY) license (https://creativecommons.org/licenses/by/4.0/).
Share and Cite
MDPI and ACS Style
Gupta, M.; Mohan, M. Assessment of Aerosol Mechanisms and Aerosol Meteorology Feedback over an Urban Airshed in India Using a Chemical Transport Model. Atmosphere 2021, 12, 1417. https://doi.org/10.3390/atmos12111417
AMA Style
Gupta M, Mohan M. Assessment of Aerosol Mechanisms and Aerosol Meteorology Feedback over an Urban Airshed in India Using a Chemical Transport Model. Atmosphere. 2021; 12(11):1417. https://doi.org/10.3390/atmos12111417
Chicago/Turabian StyleGupta, Medhavi, and Manju Mohan. 2021. "Assessment of Aerosol Mechanisms and Aerosol Meteorology Feedback over an Urban Airshed in India Using a Chemical Transport Model" Atmosphere 12, no. 11: 1417. https://doi.org/10.3390/atmos12111417
Note that from the first issue of 2016, this journal uses article numbers instead of page numbers. See further details here.