
Dust Criteria Derived from Long-Term Filter and Online Observations at Gosan in South Korea
by
Xiaona Shang
1,2, 
Meehye Lee
2,*,
Saehee Lim
2,
Örjan Gustafsson
3,4,
Gangwoong Lee
5 and
Limseok Chang
6 1
School of Chemical and Environmental Engineering, Shanghai Institute of Technology, Shanghai 201418, China
2
Department of Earth and Environmental Sciences, Korea University, Seoul 02841, Korea
3
Department of Applied Environmental Science, Stockholm University, 10691 Stockholm, Sweden
4
Bolin Centre for Climate Research, Stockholm University, 10691 Stockholm, Sweden
5
Department of Environmental Science, Hankuk University of Foreign Studies, Yongin 17035, Korea
6
Climate and Air Quality Research Department, National Institute of Environmental Research (NIER), Incheon 22689, Korea
*
Author to whom correspondence should be addressed.
Atmosphere 2021, 12(11), 1419; https://doi.org/10.3390/atmos12111419
Submission received: 6 September 2021
/
Revised: 16 October 2021
/
Accepted: 27 October 2021
/
Published: 28 October 2021
(This article belongs to the Special Issue Physical and Chemical Properties of Aerosols and Their Role in Weather and Climate)
Abstract
:Dust and pollution are frequently mixed together in East Asia, causing large uncertainties in assessing climate change and environmental influence and in relevant policymaking. To discern the dust effect on particle mass, we carried out long-term measurements of the mass and key chemical compositions of PM10, PM2.5, and PM1 from August 2007 to February 2012 and collected hourly data of PM10 and PM2.5 concentrations from January 2012 to October 2020 at Gosan, South Korea. The principal component analysis of measured species reveals two dominant factors, pollution and dust, accounting for 46% and 16% of the total variance, respectively. The mode distribution of PM10, PM2.5, and PM1 mass in addition to the dust events helps to provide a robust criterion of the dust impact. Dust can be identified by the mean + standard deviation (σ) of PM10, while the threshold is down to the mean concentration when dust particles experience precipitation. High PM2.5 concentration also presents dust impact; however, the criterion decreases from mean + σ in 2007–2012 to mean in 2012–2020. It indicates that dust is no longer a high-concentration event of PM2.5, but its influence gradually appears in low-concentration particles. Therefore, the dust criterion obtained from long-term PM10 concentration data is robust; however, the standard is based on PM2.5 changes over time and still needs to be determined by follow-up long-term observations.
1. Introduction
Mineral dust is one of the dominant components in atmospheric aerosols and comprises the dry aerosol mass loading by ~60% globally [1]. The annual dust emission in Asia is 27~873 Tg year−1 [2]. Dust has been not only observed in the coarse mode particles (PM10), but also in the fine particles (PM2.5) [3]. Such high abundance of dust not only reduces air quality, but also causes climate change. For example, the radiative forcing of dust accounts for −0.3~+0.1 W m−2 and there is great uncertainty from the regional to the global scale due to the huge difference in sources, chemical components, and sizes [4]. Moreover, dust has also been found to promote ozone and particle formation under pollution [5,6,7]. The dust influence is further reflected in the modification in the microphysical process of cloud formation [8,9].
Dust with high mass burden usually comes from arid areas [10,11], but it is endowed with different physiochemical and optical properties due to different soil types [12,13,14,15,16]. For instance, African iron-rich dust absorbs more light than dust from Asia [17,18]. Northeast Asia is not only one of the main dust areas, but also has the highest concentration of sulfur, nitrogen, and carbonaceous compounds and deposition due to the large emissions of SO2, NOx, and VOCs [19,20]. While being transported away from source regions, dust particles mixed with these pollutants and raised the particle mass concentration [21,22]. Thereby, it becomes a challenge to determine the cause of the deterioration in air quality. The mixture of dust and pollutants could be one of the culprits for the formation of haze. For instance, when pollutants were highly coated on dust particles, mixed particles became a dominant source of cloud condensation nuclei, which subsequently contributed to heavy haze events in China [23].
At present, there is a lack of a criterion for identifying dust from bulk aerosols. The current methods of identifying dust particles are mainly based on their light extinction property or receptor models to track the source of the particles. However, it is still a big challenge to estimate the optical property of major aerosol types in East Asia, especially dust particles, because dust and other chemical components possess similar optical properties when mixed together [24,25]. For the receptor model, factor analysis is often used, and the effects of dust on PM10 have been successfully extracted through high loadings of Mg2+ and Ca2+ as well as crustal elements [26,27]. Heavy metals have been used to diagnose different types of urban dust (soil dust mixed with anthropogenic species) in Central China using principal component analysis (PCA) [28]. For large measurement sets, positive matrix factorization (PMF) is a powerful tool for quantitatively identifying various sources [29]. For those with fewer parameters, non-negative matrix factorization (NMF) can also be used for aerosol source identification [30]. However, these receptor models are all based on the monitoring of the chemical composition of particulate matter, and it is extremely challenging to establish a regional or even global-scale network for such online monitoring. In contrast, online monitoring of the concentration of particles of different sizes is relatively complete.
To partition the dust impact on particles in the atmosphere and further provide robust dust criteria based on particle masses, long-term filter and online observation of PM10, PM2.5 and PM1 were conducted during 2007–2020. The recent mass observations of PM10 and PM2.5 (2012–2020) were downloaded to verify the accuracy of the dust criteria provided in this study. This work not only fills the gap in the long-term continuous data of size-segregated particles, but also provides a reliable standard for dust and pollution diagnosis based on modal distribution and principal component analysis. Both dust criteria and diagnostic methods will further serve the update of the optical model.
2. Methods
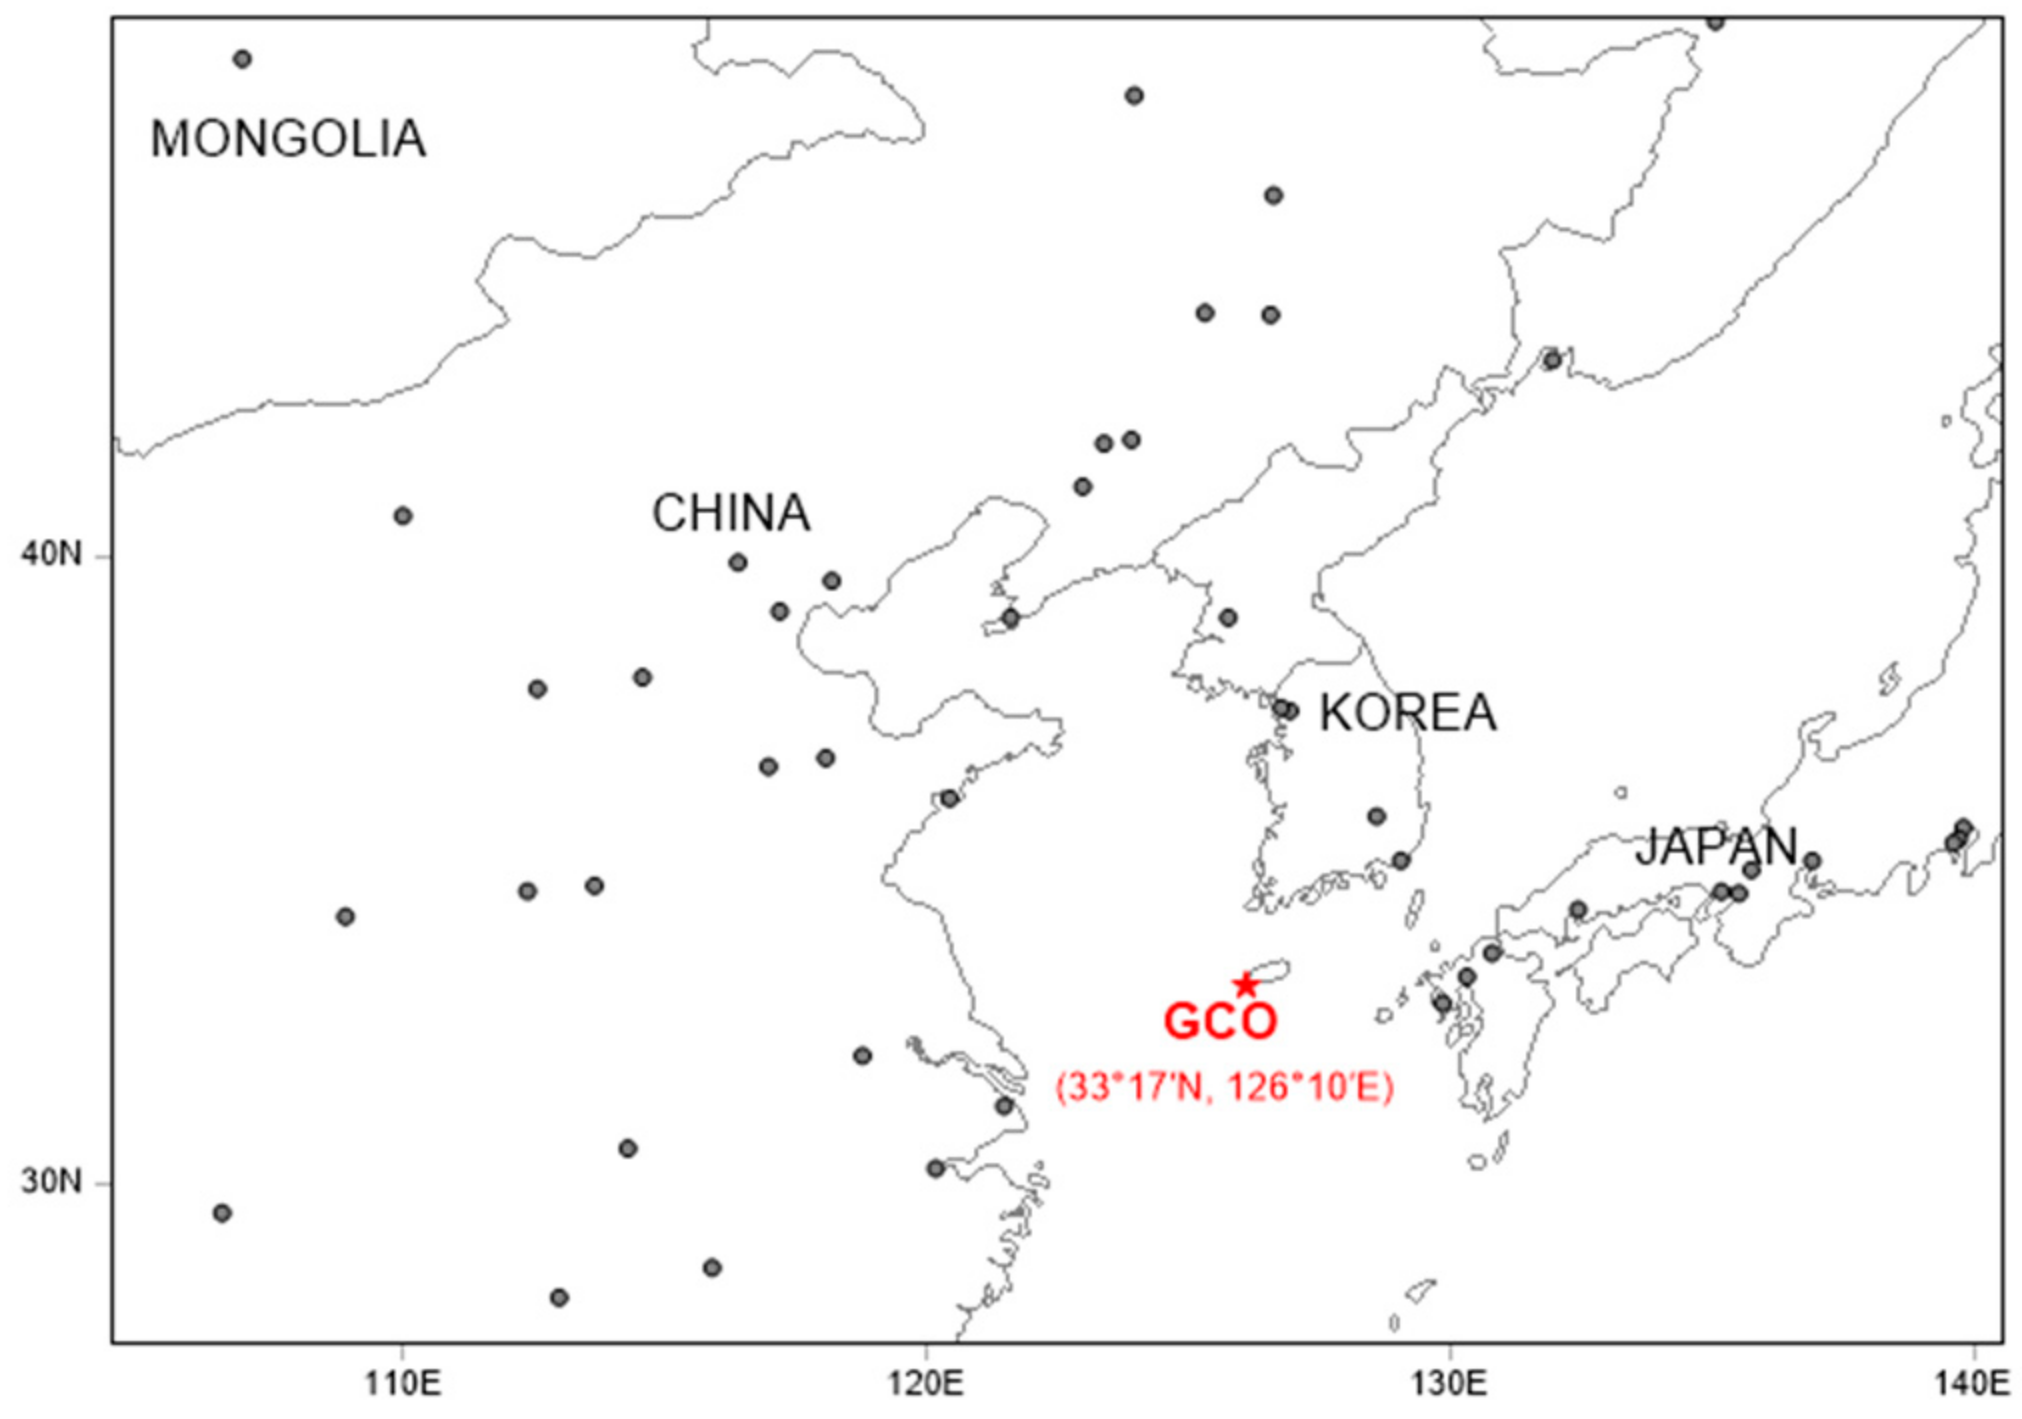
Aerosol samples were collected separately for PM1, PM2.5, and PM10 onto Teflon and quartz filters (37 mm, Pall Corp., New York, NY, USA) by cyclones (sharp-cut, URG, Chapel Hill, NC, USA) at the Gosan Climate Observatory (GCO) (33°17′ N, 126°10′ E), Jeju Island, South Korea from 2007 to 2012 (Figure 1). GCO is a background station for atmospheric observations, located on the downwind pathways of the Asian continental airflow. As an ideal location for observing the outflows of the Northeast Asia continent, GCO has been used as an important measurement site, not only for intensive field campaigns such as ABC-EAREX2005 (Atmospheric Brown Cloud—East Asia Regional Experiment) [31], but also for long-term studies [32].
Sampling was undertaken for 24 h at the air flow rate of 16.7 lpm from 10:00 the first day to 10:00 the next day, using PM1, PM2.5, and PM10 sharp-cut cyclone (URG). The particle masses on 37 mm Teflon filters (Pall Corp.) were weighed before and after sampling, and their concentrations were calculated by dividing their difference by the actual air flow rate read on the dry gas meter. During the five-year period (2007–2012), samples of PM10, PM2.5, and PM1 were concurrently collected approximately every 6–8 days apart from event days. For example, we collected few samples on rainy, snowy, and typhoon days to avoid negative values (the difference in filter weight before and after sampling) or the problem of chemical component concentrations below detection limit of the instruments. However, on days of dust and heavy pollution (e.g., haze), the sampling frequency was appropriately increased according to the duration of the event. We obtained a total of 152 sets of samples (see Table S1 for sample date), of which five dust and eleven haze samples were recorded (see Table S2 for sample date) according to the reports of the Korea Meteorological Administration (KMA). The air mass trajectories of five dust events are presented in Figure S1.
The mass of particles was calculated by using the weight difference measured by an analytical balance (Denver, Germany) after one-day conditioning in desiccators (30–40% humidity, SANPLATEC, Osaka, Japan) from August 2007 to February 2012. A mixing solvent of deionized water and methanol (volume ratio 19:1) was prepared to extract water-soluble ions (Cl−, NO3−, SO42−, Na+, NH4+, K+, Mg2+, and Ca2+), which were then detected in ion chromatography (IC 25, Dionex, Sunnyvale, CA, USA). The analytical system is mainly composed of guard and analytical columns (AG11, AS11 and CG11, CS11, Dionex, Sunnyvale, California, USA) and suppressors (ASRSIIULTRA-4 mm and CSRSIIULTRA-4 mm). The relevant eluent was 39 mM KOH and 20 mM MSA, respectively. The conductivity detector (Dionex, Sunnyvale, CA, USA) was used to detect signals. The calibration curve was obtained from the peak signals of the eight gradient standards. Via parallel blank measurement, ionic detection limits were calculated to range from 0.01 to 0.09 µg/m3. According to the thermal/optical reflectance (TOR) method provided by the Desert Research Institute (Reno, NV, USA), we used the Interagency Monitoring of Protected Visual Environments (IMPROVE) protocol to measure carbonaceous compounds in the samples collected from August 2007 to July 2010. OC comprised OC1, OC2, OC3, OC4, and OP. OC1-4 were measured at 120 °C, 250 °C, 450 °C and 550 °C in a He atmosphere. The pyrolyzed OC (OP) was measured in an O2/He atmosphere before the reflected light returned to its initial value. EC was analyzed as EC1, EC2 and EC3 at 550 °C, 700 °C and 850 °C, respectively, after introducing 2% O2/98% He. A detailed description of the measurements is available in our previous studies [33,34].
To understand the factors that determine the changes in particulate matters and partition the impact of dust on them, in Origin 8.6, the long-term filter measurements of the mass and major chemical constituents (including eight water-soluble ions, OC, and EC) of PM10, PM2.5 and PM1 were used for PCA. To estimate the extents of dust in bulk aerosol particles of different sizes, a mode analysis was applied for PM10, PM2.5, and PM1 mass using filter measurements over the past five years (2007–2012). The mode analysis here refers to the fitting operation of the frequency distribution of the ln-scale particle mass concentration in Fityke 1.0.1. Then, the hourly concentrations of PM10 and PM2.5 from January 2012 to December 2020 were downloaded from the website of http://www.airkorea.or.kr/ (accessed on 26 October 2021) to verify the dust criteria provided in this study. PM10 and PM2.5 were collected on the filter once an hour and then β rays penetrated the particles, recorded the light attenuation before and after sampling, and converted their differences into mass concentrations. In order to further verify the dust standard, the downloaded hourly concentration values were averaged for 24 h, and the mode analysis was also performed.
3. Results
During the entire period of August 2007~February 2012, the average mass concentrations of PM10, PM2.5, and PM1 were 30 µg/m3, 19 µg/m3, and 14 µg/m3, respectively (Table 1), which were comparable to those previously reported data (28.4 µg/m3, 17.2 µg/m3, and 13.7 µg/m3) at GCO from August 2007 to September 2008 [33]. On dust days, their concentrations were 78 µg/m3, 38 µg/m3, and 21 µg/m3, which increased by 2.6, 2.0, and 1.5 times, respectively. Among them, the PM10 concentration increased the most accompanied by the increases of Cl−, Ca2+, and OC (particularly OC4 and OP) concentration by more than twice. In haze days, the concentrations of the three particle sizes were 60 µg/m3, 45 µg/m3, and 37 µg/m3. In contrast, the increase in the concentration of PM1 and PM2.5 was greater than that of PM10, with the elevation of SO42−, NO3−, NH4+, K+, and EC concentration more than twice the data of the entire period.
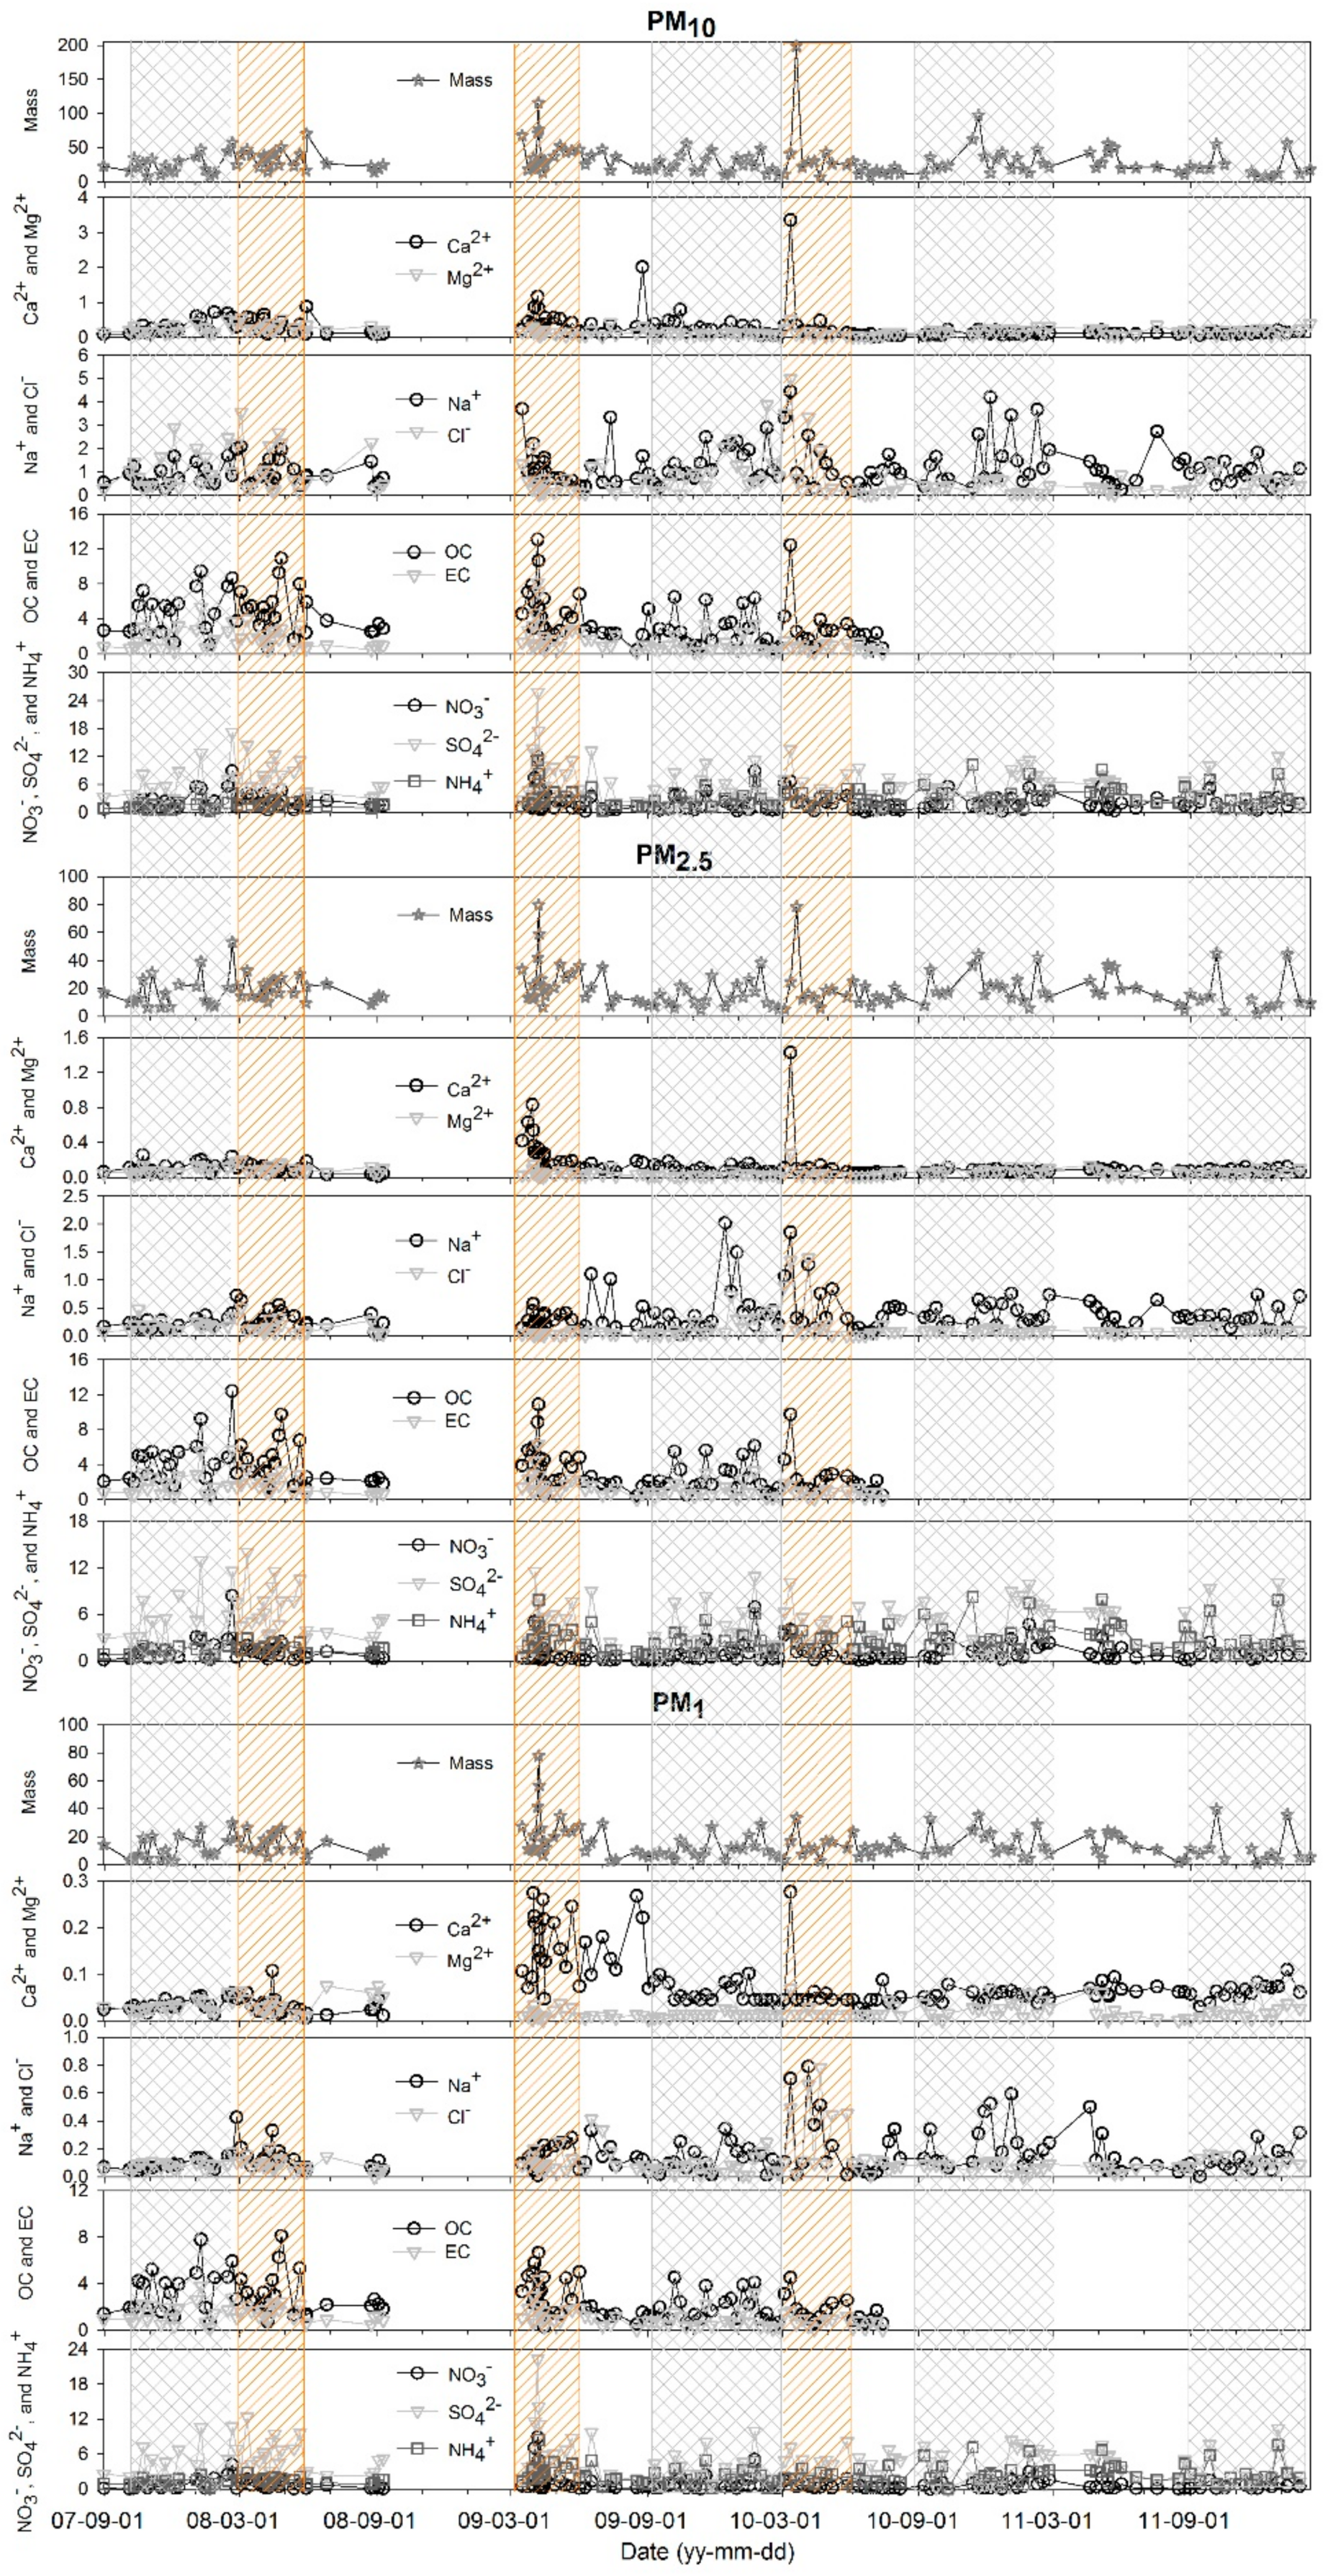
The elevation of Ca2+ concentrations was almost synchronized with the increase of PM10 mass in spring (March~May, r2 = 0.83) (Figure 2). By comparison, the anthropogenic compositions (SO42−, NO3−, NH4+, K+, OC, and EC) evidently increased the mass concentration of PM1 (comprising 84%) in fall-to-winter seasons. For PM2.5, the concentration was occasionally high in spring or winter. The mineral or pollution species increased sharply with the enhancement of particle masses when dust or haze events occurred. On dust days, PM10 and PM2.5 concentrations increased by more than twice from 2007 to 2012. However, in the haze events, the anthropogenic species enhanced two-fold with the increase of PM1 concentration. When dust and haze occurred at the same time (e.g., 20 March 2010), the PM10 concentration increased to a maximum of 199 µg/m3 during the filter study period. Nevertheless, the increase in PM10 did not necessarily correspond to the dust event as recorded by KMA (e.g., March 2008).
4. Discussion
4.1. PCA of PM10, PM2.5, and PM1
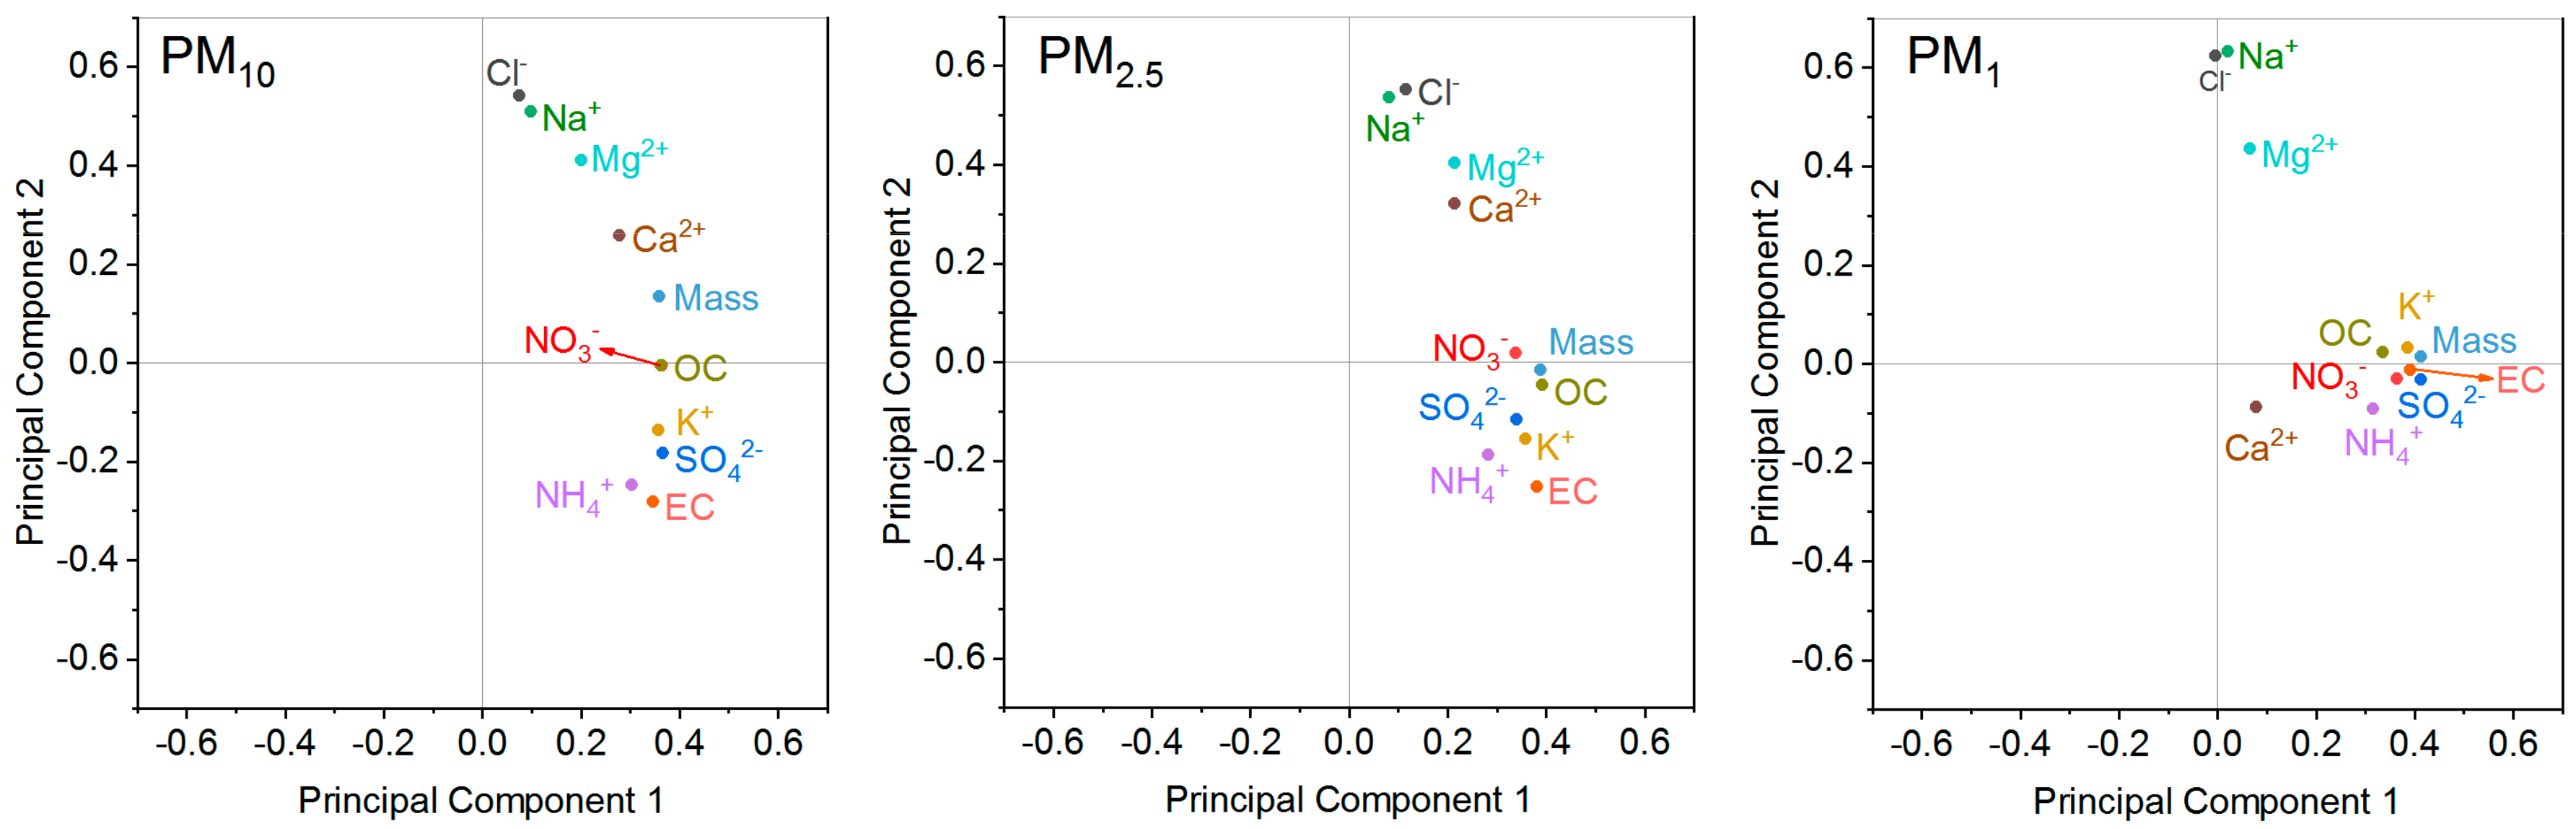
Principal component analysis (PCA) was applied to all measured species of PM10, PM2.5, and PM1 (measurement ions, carbonaceous compounds, and mass) from 2007 to 2012, and the related variables were classified through orthogonal transformation and presented characteristics of each principal component. Note that the widely used PMF cannot use the data in this study to identify dust factor, probably because its method of processing negative factors masks the characteristics of dust. This work identified two principal components that accounted for more than 60% of the total variance (Figure S2). Principal component 1 (PC1) was characterized by SO42−, NO3−, NH4+, K+, OC, and EC, comprising 46% of the total variance, and was the dominant contributor of PM1 (Figure 3). Principal component 2 (PC2) comprised 16% of the total variance and was characterized by Na+, Cl−, Mg2+ and Ca2+, which mainly presented in PM10 and PM2.5. Note that sea-salt and dust were difficult to separate because Ca2+ was correlated to Mg2+, and Mg2+ is correlated to Cl− and Na+ in PM10 and PM2.5, which indicated the mixing effect of sea-salt and dust. The relevant correlation matrix for each particle size is given in Table S3.
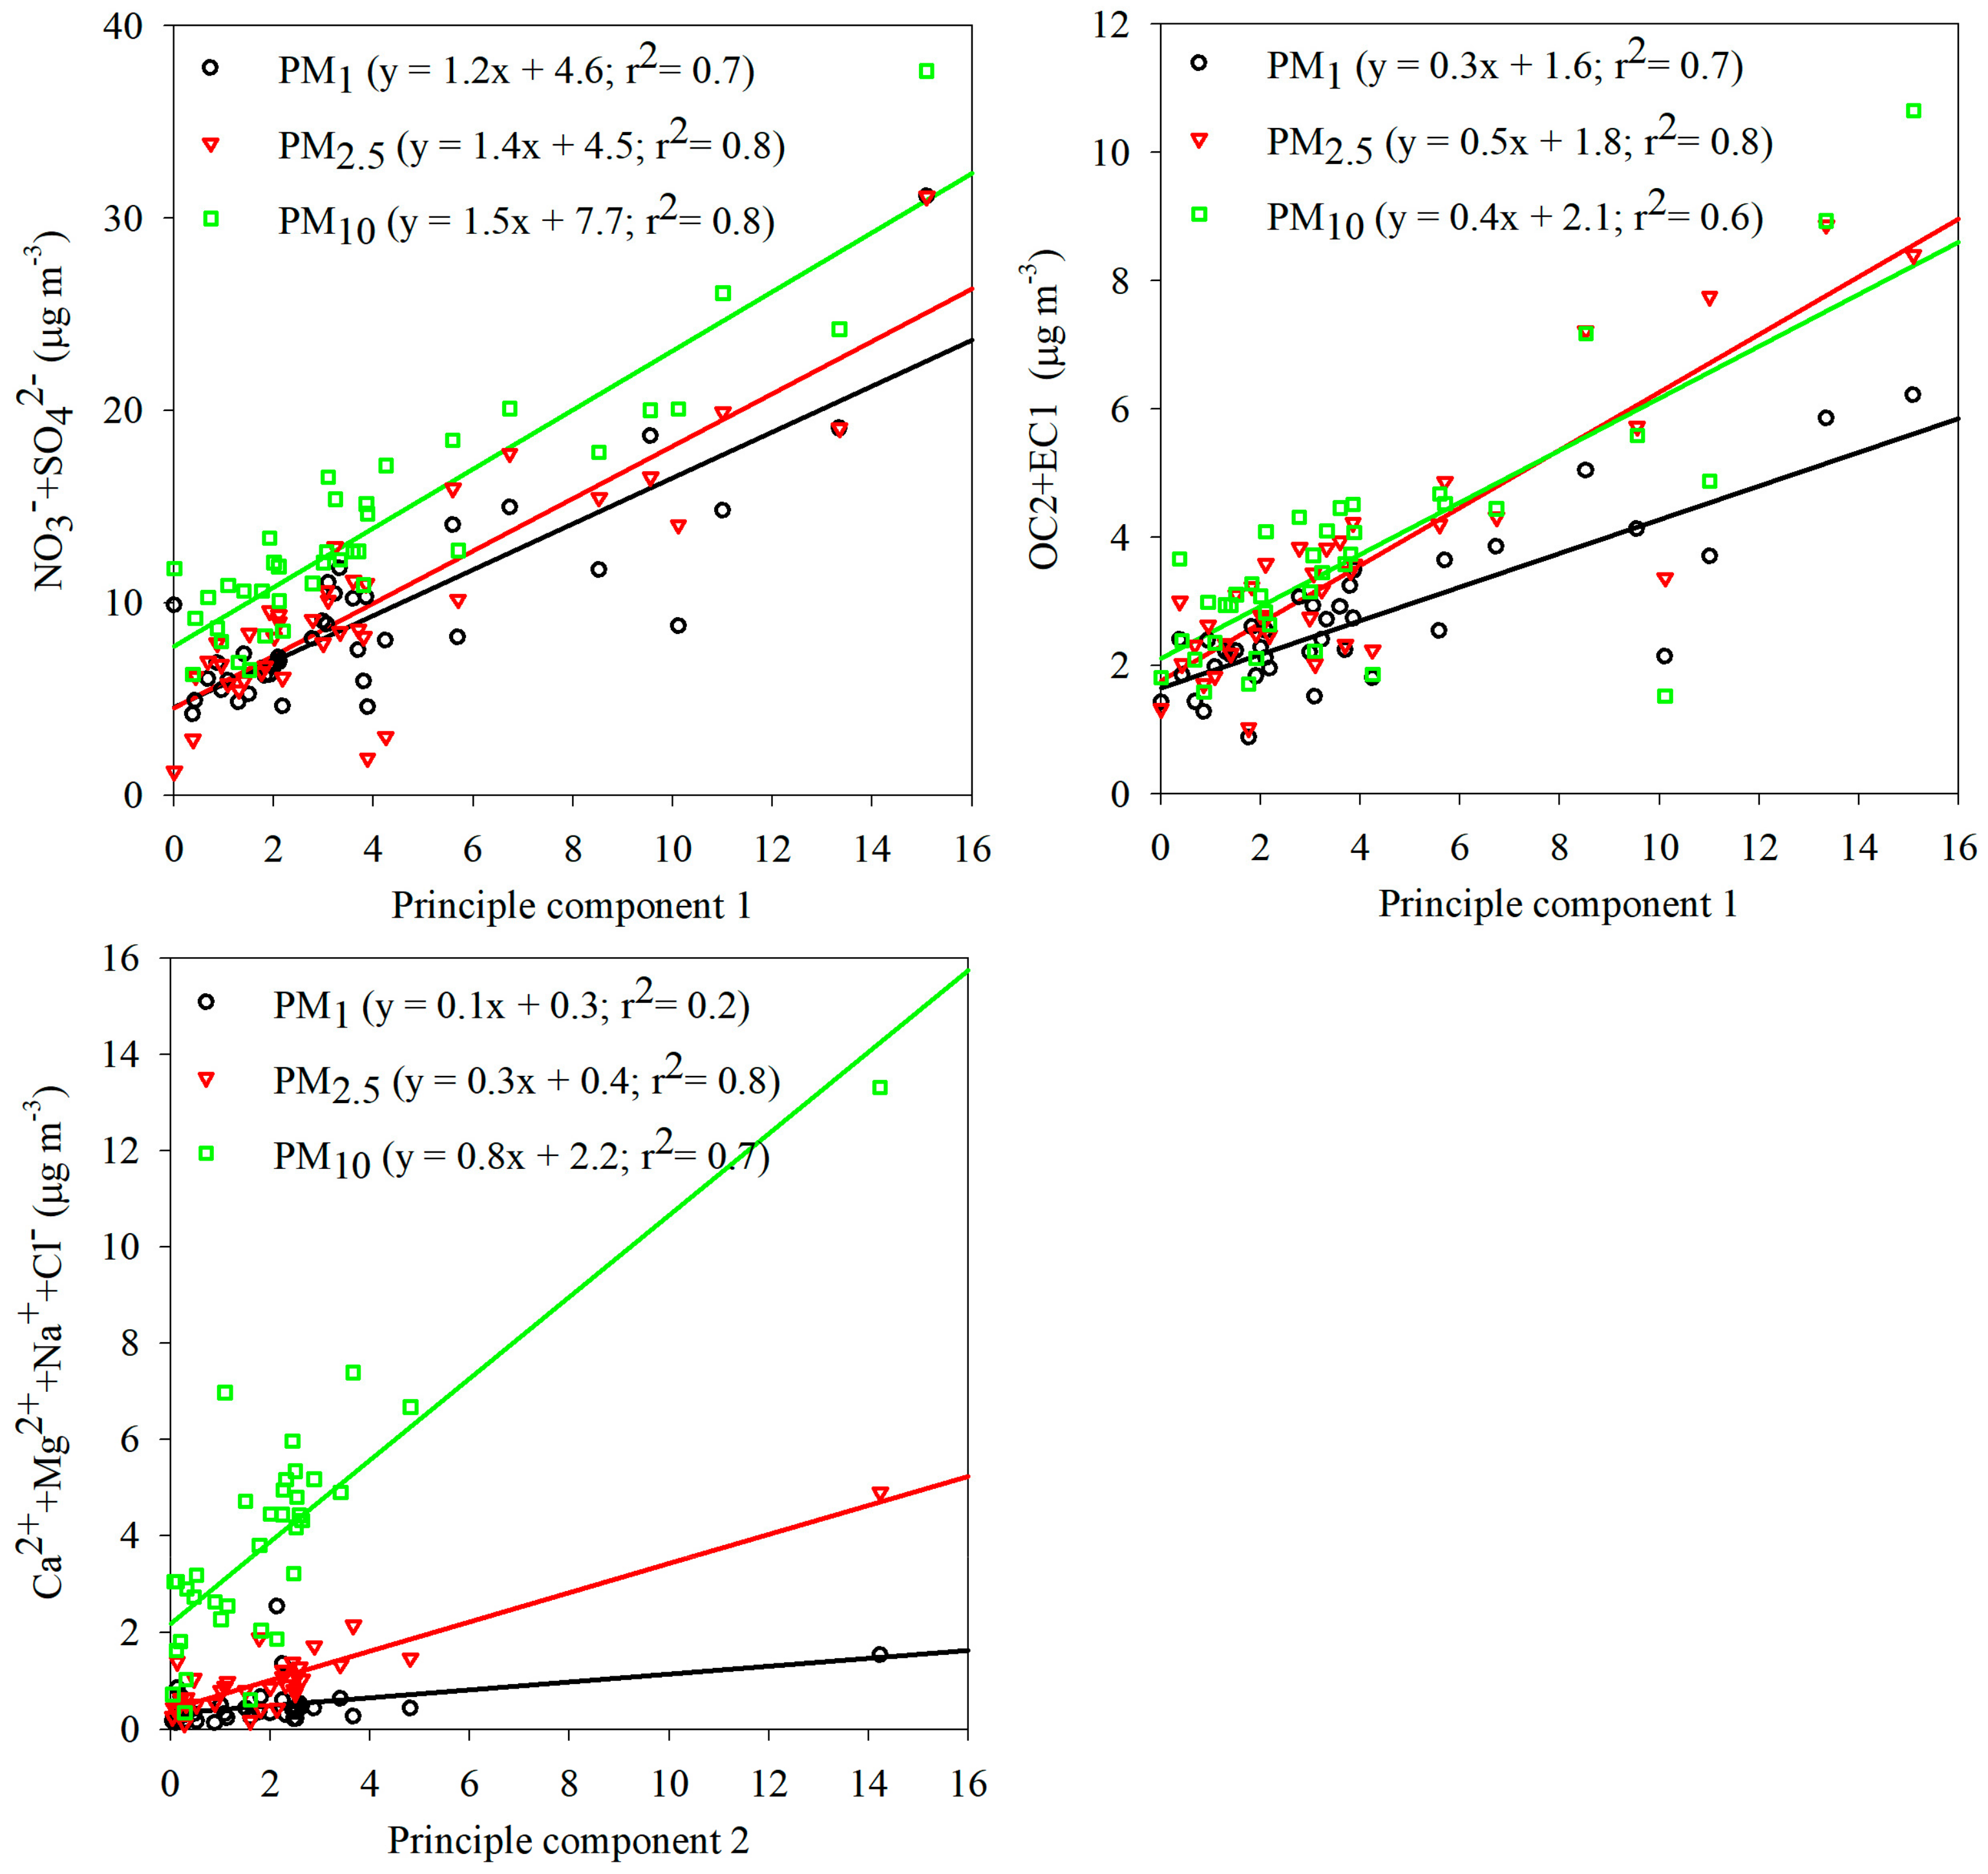
SO42−, NO3−, OC2 and EC1 were the most abundant species of all sizes of particles in PC1 (Figure 4), which supported the determination of PC1 as a pollution factor [33,35]. The concentrations of Ca2+, Mg2+, Na+, and Cl− correlated to PC2 loading. Since the sea-salt species in PC2 appeared with dust species, sea-salt Ca2+ was calculated and it was only 12% in PM2.5 and 19% in PM10. During the sampling period, Na+ and Cl− concentrations were high in summer, and the mass concentration of particles in the marine airflow was the lowest. Therefore, PC2 was characterized as a dust factor.
Therefore, these two principal components manifest the main source of particulate matters in the study region. As an anthropogenic source, PC1 is predominant in PM1 and PM2.5, PC2 demonstrates the influence of soil dust on PM10 and PM2.5. To quantify their contribution to the PMs masses at GCO, factor loadings were run in a multi-linear regression analysis. The formulas are as follows:
where PC1 and PC2 are factor loadings.
The intercepts are about the averages of PM10, PM2.5, and PM1 (Table 1 and Table 2), which suggests that the two PCs well explain the changes in PMs concentrations. The factor contribution calculation showed that PC1 occupied approximately half of PM10, almost all of PM1, and 87% of PM2.5. PC2 mainly influenced PM10 (45%) and slightly impacted PM2.5 (13%). Moreover, the insignificant negative contribution of PC2 in PM1 indicated that dust particles might have a scavenging effect on pollutants [36].
4.2. Partitioning the Effect of Dust on Particulate Matters
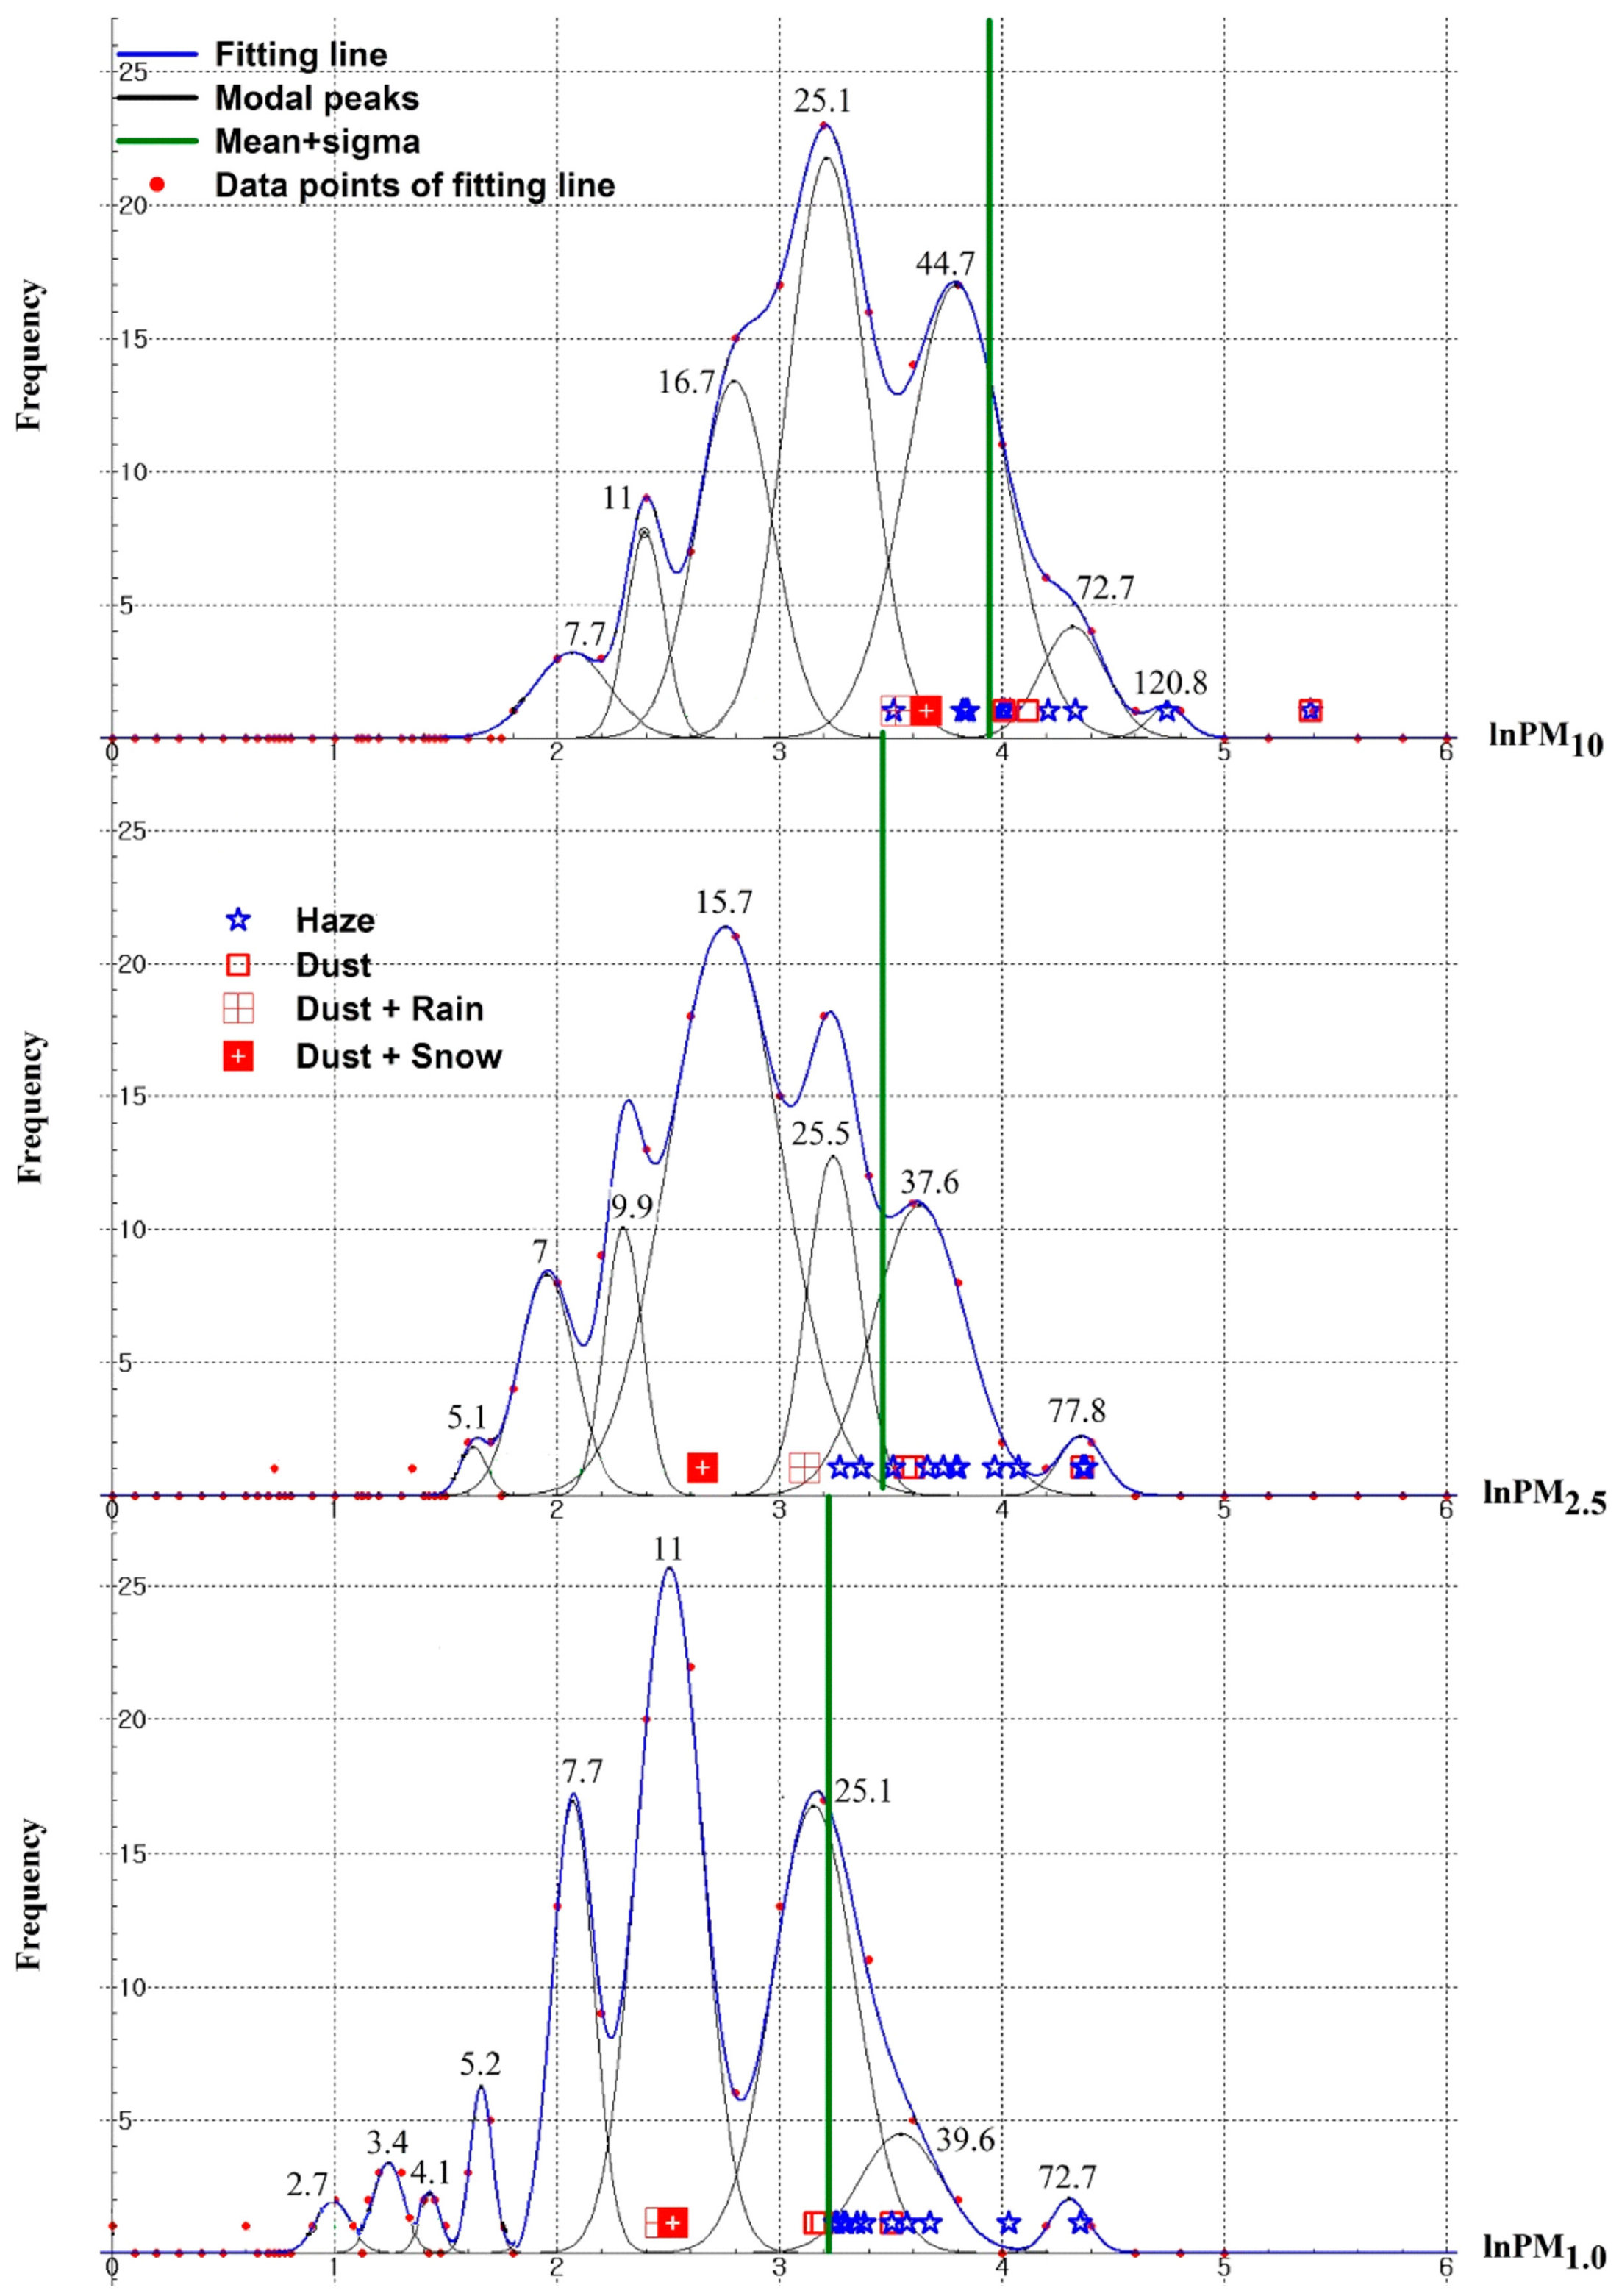
Dust used to be considered to elevate the mass concentration of PM10 in northeastern Asia [37], but pollution investigations were mostly focused on PM2.5, and relevant pollution control was also based on the regulation of PM2.5 (Environmental Protection Agency, 2012) due to the lack of PM1 standard. In Korea, dust and haze frequently cause an elevation in the abundance of airborne particles [38,39]. Hence, the dust and haze events recorded by the KMA were used to recognize the dust and pollution impact on the modal distribution of PM10, PM2.5, and PM1. All modes of PM10, PM2.5, and PM1 in ln-scale were fitted with filter data of 2007–2012 (Figure 5). The peak concentration of the main mode of the three particle sizes was almost equivalent to their median concentrations shown in Table 3 and Figure 5. For PM10 and PM2.5, the peak concentration of main mode (25 µg/m3 and 16 µg/m3) was far below their national standards (annual mean is 50 µg/m3 and 25 µg/m3, respectively). However, for PM1, the main mode concentration (11 µg/m3) was comparable to the PM2.5 (10 µg/m3) standard [40]. As mentioned above, the dust fraction in PM2.5 mass was about 10% (~2 µg/m3).
Although the main mode concentrations and the corresponding standard deviations were close to the medians of PMs, the average concentrations were evidently higher than the medians by 25%, which probably resulted from high-concentration events such as dust and haze. These results showed that the mass concentrations varied in a wide range due to high-concentration events. The mean + SD concentration of PM10 (52 µg/m3) was comparable to the annual standard in Korea, but for PM2.5, the mean + SD value exceeded the annual standard (25 µg/m3) by 28%. At present, there is no international or national standard for PM1, but the mean + SD of PM1 (25 µg/m3) was the same as the standard concentration of PM2.5. In addition, all mean + SD concentrations well matched their 90th percentiles, again confirming the accuracy of the high-concentration threshold.
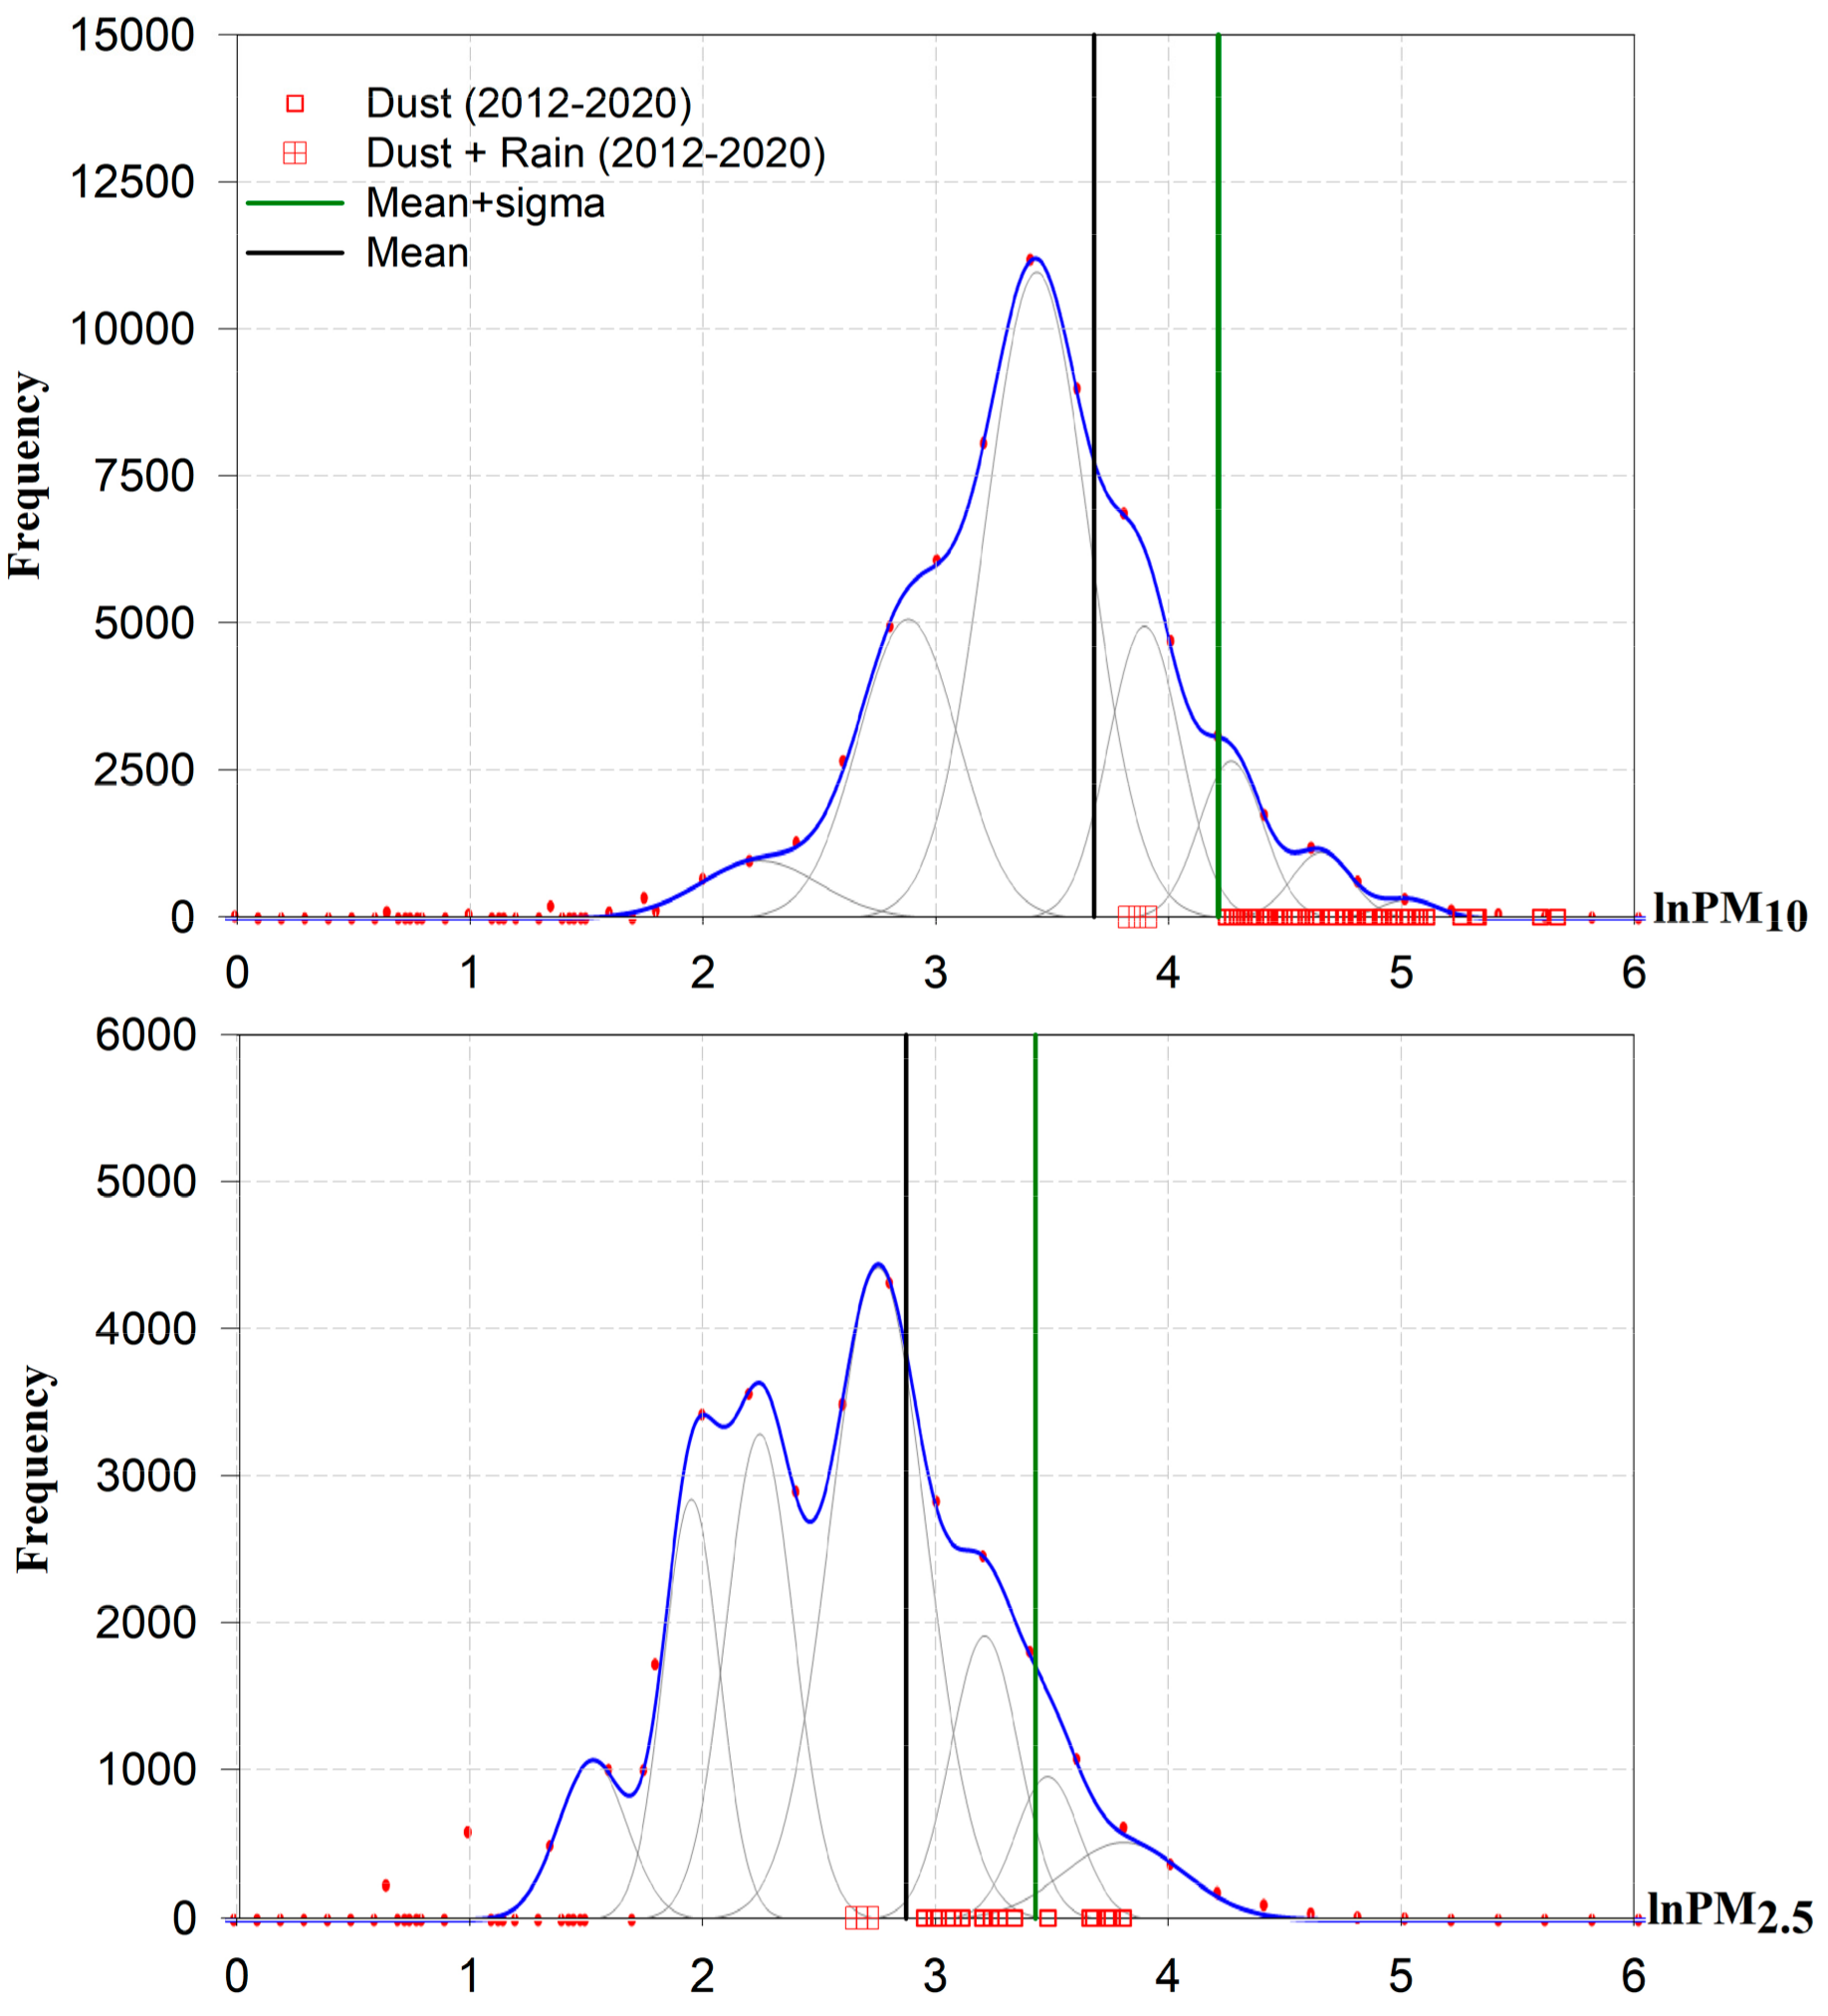
The current dust discrimination lacks particulate criteria. Dust is issued by eye observation. In addition, the haze is determined to be RH (relative humidity) >75%, and the visibility range is 1 km to 10 km in Korea. To find the relationship between particle masses (size) and dust or haze events, and further provide quantitative criteria based on the masses of the high-concentration events, all observed dust and haze samples are presented in the form of lnPMs at the bottom of Figure 5 (for the period of 2007–2012) and Figure 6 (for the period of 2012–2020). During the period of August 2007–February 2012, dust particles distributed in the high-concentration mode, and their concentration was higher than the mean + SD of PM10 and PM2.5. The haze samples were observed in the high-concentration mode of PM1, and their concentration was higher than the mean + SD (Figure 5). From January 2012 to December 2020, 48 dust events corresponding to effective PM10 measurements were recorded. In order to correspond to dust events, the hourly PM10 concentrations were averaged for 24 h, and their frequency distribution showed that all dust data points were located above the mean + SD of filter-based PM10 (Figure 6), suggesting that the mean + SD was a powerful criterion for partitioning the effect of mineral dust on particulate matters. It is noted that when there was precipitation (rain or snow as recorded by the KMA), the concentration standard will be reduced to the average value of PM10. However, for PM2.5, there have also been dust events with a concentration lower than the mean + SD but higher than the average, indicating that the dust impact in the lower concentration range has become obvious in recent years (2012–2020). In addition, the top ten percentile Ca2+ and Mg2+ were observed in high concentrations of PM10 and PM2.5 (>mean + SD). In particular, the concentrations of PM10- and PM2.5-Ca2+ in high-concentration events (0.7 µg/m3) were three times higher than the mean value (Table 1), indicating that the dust effect on PM10 and PM2.5 cannot be ignored.
At GCO, the two-period measurements of both filter and online aerosol masses reveal that without precipitation, a significant dust impact is traceable by the mean + SD (the top ten percentile) of the PM10 mass concentration, no matter if the event occurred or not, but the concentration criterion decreases to the average in the case of precipitation. In contrast, pollution dominated in the mean + SD (top ten percentile) mass concentrations of PM1. As previous literatures reported, the dust influence should be taken seriously in PM2.5 in the downwind of the dust belts [41,42,43]. In this study, PM2.5 was also found to be impacted by both dust and pollution, but the concentration-based criteria varied with time and weather conditions (here, precipitation). Therefore, it is necessary to further determine the PM2.5 indicator standard for dust and pollution.
5. Conclusions
At GCO, filter samples of PM10, PM2.5, and PM1 were analyzed, including mass, ions and carbonaceous compounds during the period of 2007~2012. The average concentrations of PM10, PM2.5, and PM1 were 30, 19, and 14 μg/m3, respectively.
For principal component analysis, all measurement species of PM10, PM2.5, and PM1 were used, and two principal components (PC1 and PC2) were identified. PC1 (representing 46% of the total variance) was characterized as a pollution factor by high loadings of SO42–, NO3–, NH4+, K+, OC, and EC. PC2 was dominated by Ca2+, Mg2+, Na+, and Cl−, which originated from mineral dust with a slight sea-salt impact. These loadings of PCs were used for multi-linear regression analysis, and it showed that the pollution factor comprised 100% and 55% of the total variance of PM1 and PM10, respectively. Dust mainly impacted PM10 (45%), followed by the PM2.5 (13%).
The mode analysis of PM10, PM2.5, and PM1 mass concentrations during 2007–2012 showed that high-concentration events were well distinguished by the mean + SD concentration (90th percentile), and resulted in the average concentrations being higher than the medians. Furthermore, the dust and haze events recorded by the KMA verified the mean + SD as the threshold for dust and pollution in PM10 and PM1, respectively. Among them, dust criterion changed when precipitation (rain or snow) occurred together and decreased to the average of PM10 concentration. The observation data of hourly PM10 concentration during the period of 2012–2020 were downloaded. The data further supported the mean + SD as a robust dust criterion without precipitation. The dust and pollution influence were also observed in PM2.5, and the corresponding concentration criteria were comparable to PM10 and PM1. However, unlike PM10 and PM1, PM2.5 does not provide a constant standard. These standards will change with time and weather conditions. In this regard, it is necessary to further determine the relevant dust and pollution standards for PM2.5.
Supplementary Materials
The following are available online at https://www.mdpi.com/article/10.3390/atmos12111419/s1, Table S1. The number of samples taken from 2007 to 2012; Table S2. The list of the event samples accompanied with the date from 2007 to 2012; Figure S1. The five air mass trajectories that represent the influence of dust areas, and their dates correspond to Table S2. The Lagrangian particle dispersion model FLEXPART (http://zardoz.nilu.no/~andreas/STATIONS/GOSAN/index.html, accessed on 25 October 2021) is used to calculate the backward trajectory every 3 h; Figure S2. Eigenvalues according to the number of principal components; Table S3. The matrix of correlations for each size of particles.
Author Contributions
Conceptualization, X.S. contributed to the paper writing and data analysis, S.L. contributed to the data quality control, and M.L., Ö.G., G.L., L.C. contributed to the paper revisions. Among them, M.L. is one of the main persons who organized the entire sampling and monitoring work. All authors have read and agreed to the published version of the manuscript.
Funding
This research was supported by the Basic Science Research Program through the National Research Foundation of Korea (NRF) funded by the Ministry of Science, Information, and Communications Technology (NRF2020M3G1A111499812).
Institutional Review Board Statement
Not applicable.
Informed Consent Statement
Not applicable.
Data Availability Statement
Data are available by contacting the corresponding author.
Acknowledgments
We would like to thank the National Institute of Environmental Research, Gwangju Institute of Science and Technology, and the Korea Meteorological Administration for sharing measurement data. We also give thanks to Air Korea for the opening data of the PMs and meteorological events.
Conflicts of Interest
The authors declare no conflict of interest.
References
- Textor, C.; Schulz, M.; Guibert, S.; Kinne, S.; Balkanski, Y.; Bauer, S.; Berntsen, T.; Berglen, T.; Boucher, O.; Chin, M.; et al. Analysis and quantification of the diversities of aerosol life cycles within AeroCom. Atmos. Chem. Phys. 2006, 6, 1777–1813. [Google Scholar] [CrossRef] [Green Version]
- Huneeus, N.; Schulz, M.; Balkanski, Y.; Griesfeller, J.; Prospero, J.; Kinne, S.; Bauer, S.; Boucher, O.; Chin, M.; Dentener, F.; et al. Global dust model intercomparison in AeroCom phase I. Atmos. Chem. Phys. 2011, 11, 7781–7816. [Google Scholar] [CrossRef] [Green Version]
- Tian, Y.; Pan, X.; Wang, Z.; Wang, D.; Ge, B.; Liu, X.; Zhang, Y.; Liu, H.; Lei, S.; Yang, T.; et al. Transport Patterns, Size Distributions, and Depolarization Characteristics of Dust Particles in East Asia in Spring 2018. J. Geophys. Res. Atmos. 2020, 125, e2019JD031752. [Google Scholar] [CrossRef]
- IPCC. Climate Change 2013: The Physical Science Basis. Contribution of Working Group I to the Fifth Assessment Report of the Intergovernmental Panel on Climate Change; Stocker, T.F., Qin, D., Plattner, G.-K., Tignor, M., Allen, S.K., Boschung, J., Nauels, A., Xia, Y., Bex, V., Midgley, P.M., Eds.; Cambridge University Press: Cambridge, UK; New York, NY, USA, 2013; p. 1535. [Google Scholar]
- Dickerson, R.R.; Kondragunta, S.; Stenchikov, G.; Civerolo, K.L.; Doddridge, B.G.; Holben, B.N. The Impact of Aerosols on Solar Ultraviolet Radiation and Photochemical Smog. Science 1997, 278, 827–830. [Google Scholar] [CrossRef] [Green Version]
- Nie, W.; Ding, A.; Wang, T.; Kerminen, V.-M.; George, C.; Xue, L.; Wang, W.; Zhang, Q.; Petäjä, T.; Qi, X.; et al. Polluted dust promotes new particle formation and growth. Sci. Rep. 2014, 4, 6634. [Google Scholar] [CrossRef] [PubMed] [Green Version]
- He, H.; Wang, Y.; Ma, Q.; Ma, J.; Chu, B.; Ji, D.; Tang, G.; Liu, C.; Zhang, H.; Hao, J. Mineral dust and NOx promote the conversion of SO2 to sulfate in heavy pollution days. Sci. Rep. 2014, 4, 4172. [Google Scholar] [CrossRef] [PubMed]
- Bègue, N.; Tulet, P.; Pelon, J.; Aouizerats, B.; Berger, A.; Schwarzenboeck, A. Aerosol processing and CCN formation of an intense Saharan dust plume during the EUCAARI 2008 campaign. Atmos. Chem. Phys. 2015, 15, 3497–3516. [Google Scholar] [CrossRef] [Green Version]
- Min, Q.-L.; Li, R.; Lin, B.; Joseph, E.; Wang, S.; Hu, Y.; Morris, V.; Chang, F. Evidence of mineral dust altering cloud microphysics and precipitation. Atmos. Chem. Phys. 2009, 9, 3223–3231. [Google Scholar] [CrossRef] [Green Version]
- Prospero, J.M.; Ginoux, P.; Torres, O.; Nicholson, S.E.; Gill, T.E. Environmental Characterization of Global Sources of Atmospheric Soil Dust Identified with the Nimbus 7 Total Ozone Mapping Spectrometer (Toms) Absorbing Aerosol Product. Rev. Geophys. 2002, 40, 2-1–2-31. [Google Scholar] [CrossRef]
- Choobari, O.A.; Zawar-Reza, P.; Sturman, A. The global distribution of mineral dust and its impacts on the climate system: A review. Atmos. Res. 2014, 138, 152–165. [Google Scholar] [CrossRef]
- Zhang, X.; Zhuang, G.; Yuan, H.; Rahn, K.A.; Wang, Z.; An, Z. Aerosol Particles from Dried Salt-Lakes and Saline Soils Carried on Dust Storms over Beijing. Terr. Atmos. Ocean. Sci. 2009, 20, 619–628. [Google Scholar] [CrossRef] [Green Version]
- Cheng, M.-C.; You, C.-F.; Cao, J.; Jin, Z. Spatial and seasonal variability of water-soluble ions in PM2.5 aerosols in 14 major cities in China. Atmos. Environ. 2012, 60, 182–192. [Google Scholar] [CrossRef]
- Kunwar, B.; Kawamura, K. One-year observations of carbonaceous and nitrogenous components and major ions in the aerosols from subtropical Okinawa Island, an outflow region of Asian dusts. Atmos. Chem. Phys. 2014, 14, 1819–1836. [Google Scholar] [CrossRef] [Green Version]
- Tao, J.; Gao, J.; Zhang, L.; Zhang, R.; Che, H.; Zhang, Z.; Lin, Z.; Jing, J.; Cao, J.; Hsu, S.-C. PM2.5 pollution in a megacity of southwest China: Source apportionment and implication. Atmos. Chem. Phys. 2014, 14, 8679–8699. [Google Scholar] [CrossRef] [Green Version]
- Attiya, A.A.; Jones, B.G. Assessment of mineralogical and chemical properties of airborne dust in Iraq. SN Appl. Sci. 2020, 2, 1–21. [Google Scholar] [CrossRef]
- Formenti, P.; Schütz, L.; Balkanski, Y.; Desboeufs, K.; Ebert, M.; Kandler, K.; Petzold, A.; Scheuvens, D.; Weinbruch, S.; Zhang, D. Recent progress in understanding physical and chemical properties of African and Asian mineral dust. Atmos. Chem. Phys. 2011, 11, 8231–8256. [Google Scholar] [CrossRef] [Green Version]
- Zhang, X.L.; Wu, G.J.; Xu, T.L.; Zhou, Q.Q. What is the real role of iron oxides in the optical properties of dust aerosols? Atmos. Chem. Phys. 2015, 15, 12159–12177. [Google Scholar] [CrossRef] [Green Version]
- Vet, R.; Artz, R.S.; Carou, S. A global assessment of precipitation chemistry and deposition of sulfur, nitrogen, sea salt, base cations, organic acids, acidity and pH, and phosphorus. Atmos. Environ. 2014, 93, 1–2. [Google Scholar] [CrossRef]
- Xu, R.; Tian, H.; Pan, S.; Prior, S.; Feng, Y.; Batchelor, W.D.; Chen, J.; Yang, J. Global ammonia emissions from synthetic nitrogen fertilizer applications in agricultural systems: Empirical and process-based estimates and uncertainty. Glob. Chang. Biol. 2019, 25, 314–326. [Google Scholar] [CrossRef] [Green Version]
- Kim, J.; Lee, J.; Lee, H.C.; Higurashi, A.; Takemura, T.; Song, C.H. Consistency of the aerosol type classification from satellite remote sensing during the Atmospheric Brown Cloud–East Asia Regional Experiment campaign. J. Geophys. Res. Space Phys. 2007, 112. [Google Scholar] [CrossRef]
- Shin, S.-K.; Müller, D.; Lee, C.; Lee, K.H.; Shin, D.; Kim, Y.J.; Noh, Y.M. Vertical variation of optical properties of mixed Asian dust/pollution plumes according to pathway of air mass transport over East Asia. Atmos. Chem. Phys. 2015, 15, 6707–6720. [Google Scholar] [CrossRef] [Green Version]
- Ma, J.; Chen, Y.; Wang, W.; Yan, P.; Liu, H.; Yang, S.; Hu, Z.; Lelieveld, J. Strong air pollution causes widespread haze-clouds over China. J. Geophys. Res. Space Phys. 2010, 115, 115. [Google Scholar] [CrossRef]
- Bahadur, R.; Praveen, P.S.; Xu, Y.; Ramanathan, V. Solar absorption by elemental and brown carbon determined from spectral observations. Proc. Natl. Acad. Sci. USA 2012, 109, 17366–17371. [Google Scholar] [CrossRef] [PubMed] [Green Version]
- Chung, C.E.; Ramanathan, V.; Decremer, D. Observationally constrained estimates of carbonaceous aerosol radiative forcing. Proc. Natl. Acad. Sci. USA 2012, 109, 11624–11629. [Google Scholar] [CrossRef] [PubMed] [Green Version]
- Choi, J.C.; Lee, M.; Chun, Y.; Kim, J.; Oh, S. Chemical composition and source signature of spring aerosol in Seoul, Korea. J. Geophys. Res. Space Phys. 2001, 106, 18067–18074. [Google Scholar] [CrossRef] [Green Version]
- Klopper, D.; Formenti, P.; Namwoonde, A.; Cazaunau, M.; Chevaillier, S.; Feron, A.; Gaimoz, C.; Hease, P.; Lahmidi, F.; Mirande-Bret, C.; et al. Chemical composition and source apportionment of atmospheric aerosols on the Namibian coast. Atmos. Chem. Phys. 2020, 20, 15811–15833. [Google Scholar] [CrossRef]
- Yongming, H.; Peixuan, D.; Junji, C.; Posmentier, E.S. Multivariate analysis of heavy metal contamination in urban dusts of Xi’an, Central China. Sci. Total Environ. 2006, 355, 176–186. [Google Scholar] [CrossRef] [PubMed]
- Betsou, C.; Diapouli, E.; Tsakiri, E.; Papadopoulou, L.; Frontasyeva, M.; Eleftheriadis, K.; Ioannidou, A. First-Time Source Apportionment Analysis of Deposited Particulate Matter from a Moss Biomonitoring Study in Northern Greece. Atmosphere 2021, 12, 208. [Google Scholar] [CrossRef]
- Shang, X.; Zhang, K.; Meng, F.; Wang, S.; Lee, M.; Suh, I.; Kim, D.; Jeon, K.; Park, H.; Wang, X.; et al. Characteristics and source apportionment of fine haze aerosol in Beijing during the winter of 2013. Atmos. Chem. Phys. 2018, 18, 2573–2584. [Google Scholar] [CrossRef] [Green Version]
- Lee, M.; Song, M.; Moon, K.J.; Han, J.S.; Lee, G.; Kim, K.-R. Origins and chemical characteristics of fine aerosols during the northeastern Asia regional experiment (Atmospheric Brown Cloud–East Asia Regional Experiment 2005). J. Geophys. Res. Space Phys. 2007, 112. [Google Scholar] [CrossRef] [Green Version]
- Lim, S.; Lee, M.; Laj, P.; Kim, S.W.; Ahn, K.H.; Gil, J.; Shang, X.; Zanatta, M.; Kang, K.S. Physical and chemical constraints on transformation and mass-increase of fine aerosols in northeast Asia. Atmos. Chem. Phys. 2021, 2021, 1–33. [Google Scholar] [CrossRef]
- Lim, S.; Lee, M.; Lee, G.; Kim, S.; Yoon, S.; Kang, K. Ionic and carbonaceous compositions of PM10, PM2.5 and PM1.0 at Gosan ABC Superstation and their ratios as source signature. Atmos. Chem. Phys. 2012, 12, 2007–2024. [Google Scholar] [CrossRef] [Green Version]
- Lim, S.; Lee, M.; Kim, S.-W.; Yoon, S.-C.; Lee, G.; Lee, Y.J. Absorption and scattering properties of organic carbon versus sulfate dominant aerosols at Gosan climate observatory in Northeast Asia. Atmos. Chem. Phys. 2014, 14, 7781–7793. [Google Scholar] [CrossRef] [Green Version]
- Zhang, R.; Jing, J.; Tao, J.; Hsu, S.-C.; Wang, G.; Cao, J.; Lee, C.S.L.; Zhu, L.; Chen, Z.; Zhao, Y.; et al. Chemical characterization and source apportionment of PM2.5 in Beijing: Seasonal perspective. Atmos. Chem. Phys. 2013, 13, 7053–7074. [Google Scholar] [CrossRef] [Green Version]
- Matsumoto, J.; Takahashi, K.; Matsumi, Y.; Yabushita, A.; Shimizu, A.; Matsui, I.; Sugimoto, N. Scavenging of pollutant acid substances by Asian mineral dust particles. Geophys. Res. Lett. 2006, 33. [Google Scholar] [CrossRef]
- Yang, M.; Howell, S.G.; Zhuang, J.; Huebert, B.J. Attribution of aerosol light absorption to black carbon, brown carbon, and dust in China—Interpretations of atmospheric measurements during EAST-AIRE. Atmos. Chem. Phys. 2009, 9, 2035–2050. [Google Scholar] [CrossRef] [Green Version]
- Kim, H.; Zhang, Q.; Sun, Y. Measurement report: Characterization of severe spring haze episodes and influences of long-range transport in the Seoul metropolitan area in March 2019. Atmos. Chem. Phys. 2020, 20, 11527–11550. [Google Scholar] [CrossRef]
- Song, J.-M.; Bu, J.-O.; Yang, S.-H.; Lee, J.-Y.; Kim, W.-H.; Kang, C.-H. Influences of Asian Dust, Haze, and Mist Events on Chemical Compositions of Fine Particulate Matters at Gosan Site, Jeju Island in 2014. J. Korean Soc. Atmos. Environ. 2016, 32, 67–81. [Google Scholar] [CrossRef] [Green Version]
- World Health Organization; Regional Office for Europe. Air Quality Guidelines: Global Update 2005: Particulate Matter, Ozone, Nitrogen Dioxide and Sulfur Dioxide; World Health Organization: Geneva, Switzerland, 2006; Available online: https://apps.who.int/iris/handle/10665/107823 (accessed on 26 October 2021).
- Escudero, M.; Querol, X.; Cuevas, E.; Ávila, A. Origin of the Exceedances of the European Daily Pm Limit Value in Regional Background Areas of Spain. Atmos. Environ. 2007, 41, 730–744. [Google Scholar] [CrossRef]
- Escudero, M.; Querol, X.; Cuevas, E.; Escudero, M.; Querol, X.; Pey, J.; Alastuey, A.; Pérez, N.; Ferreira, F.; Alonso, S.; et al. A Methodology for the Quantification of the Net African Dust Load in Air Quality Monitoring Networks. Atmos. Environ. 2007, 41, 5516–5524. [Google Scholar] [CrossRef]
- Zhang, X.; Lijing, Z.; Daniel, Q.T.; Guangjian, W.; Mo, D.; Bo, T. A Systematic Review of Global Desert Dust and Associated Human Health Effects. Atmosphere 2016, 7, 158. [Google Scholar] [CrossRef] [Green Version]
Figure 1.
The map showing the Gosan Climate Observatory (GCO) site (black dots) in the westernmost part of Jeju Island, South Korea.
Figure 1.
The map showing the Gosan Climate Observatory (GCO) site (black dots) in the westernmost part of Jeju Island, South Korea.

Figure 2.
Temporal variations of major constituents of PM10, PM2.5, and PM1 for the August 2007~February 2012 period (µg/m3). Spring (March to May) and winter (December to February) periods are shaded in orange and gray, respectively.
Figure 2.
Temporal variations of major constituents of PM10, PM2.5, and PM1 for the August 2007~February 2012 period (µg/m3). Spring (March to May) and winter (December to February) periods are shaded in orange and gray, respectively.

Figure 3.
The results of principal component analysis of all measured species including mass, water-soluble ions, OC, and EC for PM10, PM2.5, and PM1 during August 2007~February 2012.
Figure 3.
The results of principal component analysis of all measured species including mass, water-soluble ions, OC, and EC for PM10, PM2.5, and PM1 during August 2007~February 2012.

Figure 4.
Correlations between the three principal component loadings and major species concentrations (µg/m3) for PM10, PM2.5, and PM1 during August 2007~February 2012.
Figure 4.
Correlations between the three principal component loadings and major species concentrations (µg/m3) for PM10, PM2.5, and PM1 during August 2007~February 2012.

Figure 5.
Frequency distributions of PM10, PM2.5 and PM1 mass concentrations for the measurements during August 2007–February 2012. Mass concentrations are given as ln values in x-axis. The green lines stand for mean + SD. The individual samples collected during dust or haze events are marked as different symbols along the x-axis. Dust + Rain and Dust + Snow mean that the events happened together, where rain and snow were as recorded by the KMA.

Figure 6.
Frequency distributions of PM10 and PM2.5 mass concentrations for the measurements during January 2012–December 2020. Mass concentrations are given as ln values in x-axis. The green lines stand for mean + SD and the black line is marked mean value. The individual samples collected during dust are marked as square symbols along the x-axis. Dust + Rain means that dust event and rain happened together, where rain was as recorded by the KMA.


Table 1.
Measurement statistics * of mass and chemical constituents of PM10, PM2.5, and PM1 at GCO during total period of August 2007~February 2012, dust period, and haze period (unit: µg/m3).
Table 1.
Measurement statistics * of mass and chemical constituents of PM10, PM2.5, and PM1 at GCO during total period of August 2007~February 2012, dust period, and haze period (unit: µg/m3).
| PM10 | PM2.5 | PM1 | |||||||
|---|---|---|---|---|---|---|---|---|---|
| 10th/50th/90th | 10th/50th/90th | 10th/50th/90th | |||||||
| Total period | |||||||||
| Mass | 30 | 52 | 11/24/49 | 19 | 32 | 7/15/35 | 14 | 25 | 4/11/27 |
| Cl− | 0.8 | 1.7 | 0.09/0.48/2.02 | 0.1 | 0.3 | 0.03/0.08/0.28 | 0.1 | 0.2 | 0.03/0.08/0.16 |
| NO3− | 2.1 | 4.1 | 0.55/1.44/4.75 | 1.0 | 2.2 | 0.13/0.55/2.39 | 0.7 | 1.9 | 0.09/0.34/1.64 |
| SO42− | 5.5 | 9.5 | 1.32/4.72/11.14 | 4.4 | 7.5 | 1.04/3.49/8.43 | 4.3 | 7.5 | 0.84/3.6/8.05 |
| Na+ | 1.2 | 1.9 | 0.42/0.92/2.14 | 0.4 | 0.7 | 0.13/0.28/0.64 | 0.2 | 0.4 | 0.05/0.11/0.32 |
| NH4+ | 2.8 | 4.6 | 0.98/2.18/5.09 | 2.4 | 4.0 | 0.83/1.9/4.49 | 2.1 | 3.6 | 0.66/1.72/4.06 |
| K+ | 0.3 | 0.5 | 0.06/0.2/0.5 | 0.2 | 0.4 | 0.03/0.14/0.41 | 0.2 | 0.4 | 0.03/0.11/0.37 |
| Mg2+ | 0.2 | 0.3 | 0.05/0.15/0.31 | 0.1 | 0.1 | 0.01/0.05/0.12 | 0.02 | 0.04 | 0.01/0.01/0.04 |
| Ca2+ | 0.3 | 0.7 | 0.07/0.16/0.55 | 0.1 | 0.3 | 0.04/0.09/0.2 | 0.1 | 0.2 | 0.02/0.05/0.14 |
| OC | 4.0 | 6.6 | 1.04/2.98/7.48 | 3.4 | 5.7 | 1.22/2.47/6.07 | 2.6 | 4.3 | 0.83/2.09/4.81 |
| OC1 | 0.1 | 0.2 | 0/0.1/0.27 | 0.1 | 0.2 | 0/0.1/0.24 | 0.1 | 0.2 | 0/0.08/0.25 |
| OC2 | 0.8 | 1.3 | 0.28/0.71/1.45 | 0.8 | 1.3 | 0.32/0.65/1.44 | 0.7 | 1.1 | 0.27/0.63/1.22 |
| OC3 | 1.2 | 2.0 | 0.34/0.99/2.19 | 0.9 | 1.5 | 0.32/0.68/1.52 | 0.7 | 1.1 | 0.28/0.59/1.2 |
| OC4 | 0.9 | 1.7 | 0.12/0.64/1.83 | 0.7 | 1.3 | 0.12/0.45/1.34 | 0.4 | 0.8 | 0.09/0.34/1.06 |
| OP | 0.9 | 1.7 | 0.17/0.68/2.15 | 0.9 | 1.6 | 0.15/0.69/1.7 | 0.7 | 1.3 | 0.04/0.51/1.51 |
| EC | 1.5 | 2.9 | 0.38/1.01/3.22 | 1.5 | 2.7 | 0.37/1/2.9 | 1.2 | 2.0 | 0.34/0.98/2.2 |
| EC1 | 1.2 | 2.5 | 0.23/0.72/2.72 | 1.1 | 2.3 | 0.22/0.56/2.45 | 0.8 | 1.5 | 0.12/0.54/1.59 |
| EC2+3 | 0.3 | 0.5 | 0.04/0.28/0.53 | 0.4 | 0.6 | 0.13/0.37/0.59 | 0.4 | 0.6 | 0.16/0.38/0.59 |
| Dust period | |||||||||
| Mass | 78 | 146 | 38 | 62 | 21 | 30 | |||
| Cl− | 2.3 | 4.4 | 0.5 | 1.1 | 0.2 | 0.3 | |||
| NO3− | 4.5 | 6.6 | 2.5 | 3.7 | 0.9 | 1.7 | |||
| SO42− | 6.9 | 11.0 | 5.6 | 8.9 | 4.2 | 7.4 | |||
| Na+ | 2.1 | 3.6 | 0.8 | 1.4 | 0.3 | 0.5 | |||
| NH4+ | 3.6 | 6.9 | 3.3 | 6.1 | 2.3 | 4.8 | |||
| K+ | 0.3 | 0.5 | 0.2 | 0.4 | 0.2 | 0.3 | |||
| Mg2+ | 0.3 | 0.5 | 0.1 | 0.2 | 0.0 | 0.1 | |||
| Ca2+ | 0.9 | 2.3 | 0.4 | 1.0 | 0.1 | 0.2 | |||
| OC | 7.7 | 12.2 | 6.4 | 9.6 | 3.9 | 4.9 | |||
| OC1 | 0.2 | 0.4 | 0.2 | 0.3 | 0.2 | 0.2 | |||
| OC2 | 1.0 | 1.4 | 1.3 | 2.2 | 0.8 | 1.0 | |||
| OC3 | 2.4 | 3.7 | 1.9 | 3.2 | 1.0 | 1.3 | |||
| OC4 | 2.3 | 3.7 | 1.3 | 2.1 | 0.8 | 1.1 | |||
| OP | 1.8 | 3.2 | 1.6 | 2.3 | 1.1 | 1.5 | |||
| EC | 1.1 | 1.7 | 1.3 | 1.9 | 1.3 | 1.8 | |||
| EC1 | 0.8 | 1.5 | 1.0 | 1.4 | 1.0 | 1.4 | |||
| EC2 + 3 | 0.4 | 0.6 | 0.3 | 0.5 | 0.4 | 0.5 | |||
| Haze period | |||||||||
| Mass | 60 | 83 | 45 | 61 | 37 | 54 | |||
| Cl− | 0.6 | 1.2 | 0.1 | 0.2 | 0.1 | 0.1 | |||
| NO3− | 6.0 | 9.2 | 2.9 | 5.2 | 2.9 | 5.4 | |||
| SO42− | 13.7 | 18.8 | 9.7 | 11.5 | 9.4 | 12.1 | |||
| Na+ | 1.1 | 1.9 | 0.3 | 0.5 | 0.1 | 0.2 | |||
| NH4+ | 6.4 | 9.0 | 5.4 | 7.3 | 4.8 | 7.1 | |||
| K+ | 0.7 | 1.0 | 0.5 | 0.9 | 0.4 | 0.8 | |||
| Mg2+ | 0.2 | 0.3 | 0.1 | 0.1 | 0.0 | 0.0 | |||
| Ca2+ | 0.5 | 0.9 | 0.2 | 0.4 | 0.1 | 0.1 | |||
| OC | 8.4 | 11.3 | 8.0 | 11.1 | 4.9 | 6.7 | |||
| OC1 | 0.1 | 0.3 | 0.3 | 0.5 | 0.1 | 0.3 | |||
| OC2 | 1.9 | 2.6 | 2.0 | 2.7 | 1.3 | 1.7 | |||
| OC3 | 2.0 | 2.6 | 1.7 | 2.3 | 1.0 | 1.3 | |||
| OC4 | 2.2 | 3.3 | 2.1 | 3.1 | 1.0 | 1.4 | |||
| OP | 2.2 | 2.9 | 1.9 | 2.9 | 1.5 | 2.2 | |||
| EC | 4.6 | 7.0 | 4.5 | 6.4 | 2.6 | 3.7 | |||
| EC1 | 4.2 | 6.4 | 4.1 | 6.0 | 2.2 | 3.3 | |||
| EC2 + 3 | 0.5 | 0.6 | 0.4 | 0.5 | 0.4 | 0.5 | |||
* = mean, = mean + standard deviation, 10th/50th/90th percentiles.
Table 2.
Intercepts and coefficients for multi-linear regression of PM10, PM2.5, and PM1 mass concentrations during August 2007~February 2012 using the two principal components (PC1 and PC2).
Table 2.
Intercepts and coefficients for multi-linear regression of PM10, PM2.5, and PM1 mass concentrations during August 2007~February 2012 using the two principal components (PC1 and PC2).
| PM10 | PM2.5 | PM1 | |
|---|---|---|---|
| PC1 | 4.7 | 3.1 | 2.5 |
| PC2 | 3.7 | 0.4 | −0.7 |
| Intercept | 31.1 | 19.2 | 14.8 |
Table 3.
The statistical summary for mass concentrations of PM10, PM2.5, and PM1 for the experiment period of August 2007~February 2012 (µg/m3).
Table 3.
The statistical summary for mass concentrations of PM10, PM2.5, and PM1 for the experiment period of August 2007~February 2012 (µg/m3).
| Median | Mean | * S.D. | Main Mode | Mean + SD | |
|---|---|---|---|---|---|
| PM10 | 24 | 30 | 22 | 25 | 52 |
| PM2.5 | 15 | 19 | 13 | 16 | 32 |
| PM1 | 11 | 14 | 11 | 11 | 25 |
* S.D. = standard deviation.
Publisher’s Note: MDPI stays neutral with regard to jurisdictional claims in published maps and institutional affiliations. |
© 2021 by the authors. Licensee MDPI, Basel, Switzerland. This article is an open access article distributed under the terms and conditions of the Creative Commons Attribution (CC BY) license (https://creativecommons.org/licenses/by/4.0/).
Share and Cite
MDPI and ACS Style
Shang, X.; Lee, M.; Lim, S.; Gustafsson, Ö.; Lee, G.; Chang, L. Dust Criteria Derived from Long-Term Filter and Online Observations at Gosan in South Korea. Atmosphere 2021, 12, 1419. https://doi.org/10.3390/atmos12111419
AMA Style
Shang X, Lee M, Lim S, Gustafsson Ö, Lee G, Chang L. Dust Criteria Derived from Long-Term Filter and Online Observations at Gosan in South Korea. Atmosphere. 2021; 12(11):1419. https://doi.org/10.3390/atmos12111419
Chicago/Turabian StyleShang, Xiaona, Meehye Lee, Saehee Lim, Örjan Gustafsson, Gangwoong Lee, and Limseok Chang. 2021. "Dust Criteria Derived from Long-Term Filter and Online Observations at Gosan in South Korea" Atmosphere 12, no. 11: 1419. https://doi.org/10.3390/atmos12111419
Note that from the first issue of 2016, this journal uses article numbers instead of page numbers. See further details here.