
Spatio-Temporal Variations in the Temperature and Precipitation Extremes in Yangtze River Basin, China during 1961–2020

1
Changjiang River Scientific Research Institute, Changjiang Water Resources Commission of the Ministry of Water Resources of China, Wuhan 430010, China
2
Department of Geographical Sciences, Faculty of Resources and Environmental Science, Hubei University, Wuhan 430062, China
3
College of Water Conservancy and Hydropower Engineering, Hohai University, Nanjing 210098, China
4
General Institute of Water Resources and Hydropower Planning and Design, Ministry of Water Resources, Beijing 100004, China
*
Authors to whom correspondence should be addressed.
Atmosphere 2021, 12(11), 1423; https://doi.org/10.3390/atmos12111423
Submission received: 10 September 2021
/
Revised: 22 October 2021
/
Accepted: 24 October 2021
/
Published: 28 October 2021
(This article belongs to the Special Issue Hydrological Responses under Climate Changes)
Abstract
:Based on daily maximum temperature (Tmax), minimum temperature (Tmin), and precipitation of the Yangtze River Basin (YRB) from 1961 to 2020, we employed the trend analysis method and correlation analysis method to analyze spatiotemporal variations in 10 extreme indices and their associations with atmospheric and oceanic circulations. Results indicated that maximum Tmax (TXx), maximum Tmin (TNx), and minimum Tmin (TNn) all increased significantly, at rates of 0.19 °C, 0.19 °C, and 0.37 °C per decade, respectively, whereas minimum Tmax (TXn) did not show any significant trend. The diurnal temperature range (DTR) decreased by 0.09 °C per decade as minimum temperatures increased faster than maximum temperatures. TNx and TNn increased significantly in the majority of the YRB, but TXn showed no significant increases. TXn increased significantly in the upper reaches of the Yangtze River. The DTR increased significantly in the Jinsha River Basin and the lower reaches of the Yangtze River. Rx1day (maximum 1-day precipitation), SDII (Simple daily intensity index) and R99p (extremely wet-day precipitation) increased significantly, at rates of 1.12 mm, 0.09 mm, and 5.87 mm per decade, respectively, but the trends of Rx5day (maximum 5-day precipitation) and PRCPTOT (total wet-day precipitation) were not significant. However, the trends of precipitation extreme indices were not statistically significant in most of the YRB. In the future, maximum temperature and minimum temperature might increase while DTR might decrease. But, the trends of precipitation extremes in the future were ambiguous. Nearly all the extreme indices were related to the variability of Atlantic multidecadal oscillation (AMO) in the YRB. In addition, the correlations between extreme temperature indices and AMO are higher than that of extreme precipitation indices.
1. Introduction
Extreme events, such as floods, droughts, and heat/cold waves, are one of the most destructive natural disasters and have severe impacts on ecosystem services, agriculture productivity, and society [1,2,3]. Unlike mean climate, the spatio-temporal variations in extreme events are more sensitive to climate change [4]. It has been demonstrated that the frequency of extreme weather and climatic event increases in the context of warming climate [5,6]. For example, more extreme temperature events have been observed at global and regional scales since the 1990s [7,8,9]. As the temperature rises, the capacity of the atmosphere to hold water increases, resulting in more frequent and intense extreme precipitation events [10,11]. More storms, floods, droughts, and other weather-related events have been triggered by extreme temperature and precipitation events, potentially resulting in loss of life and economic damage [12,13]. Thus, it is necessary to investigate the changes in extreme temperature and precipitation, which is crucial for developing adaptation strategies to reduce climate risks. The World Meteorological Organization’s Expert Team on Climate Change Detection and Indices (ETCCDI) defined 40 climate change indices. A total of 27 indices were core indices. They are based on daily temperature values or daily precipitation amount, which can be used for assessing extreme climate change globally and regionally [14,15]. Numerous scientists have used these indices to assess the characteristics of different kinds of extreme events, such as frequency, intensity, and trends [16,17].
China has a complicated topography and diverse climatic conditions, making its economy and environment vulnerable to climate extremes. Recently, many scholars have been devoted to the extreme temperature and precipitation events in China [18,19,20,21]. However, different scholars came to various conclusions because the selected indices, data sources and length, and analysis methods were different. Overall, observational evidence indicated that extreme indices showed patterns consistent with a regional warming. The frequency and intensity of extreme precipitation in China have also increased since 1950, but the trends were not consistent or significant across many regions over China [22,23,24,25]. Meanwhile, researchers have found that oceanic and atmospheric circulations might have a relationship with these changes in extreme climate events. Therefore, many large-scale circulation indices were used to investigate these linkages [26,27,28].
Most of the YRB is dominated by a typical subtropical monsoon climate, except for some areas in the Tibetan Plateau. The annual precipitation concentrates mostly in the summer, and most of the water vapour in the YRB was provided by the Pacific and Indian oceans. As a region affected by monsoon climate, the spatial and temporal distribution of temperature and precipitation the Yangtze River Basin (YRB) vary significantly and are sensitive to global warming. The variation in temperature indicated that the YRB witnessed a general cooling trend before the mid-1980s, but a warming trend afterwards [29]. In addition, the variation in temperature was more complex in the middle YRB, owing to rugged topography [30]. Unlike extreme temperature, the variations in extreme precipitation had obvious regional characteristics, and consistent patterns were found in the YRB. It has been reported that extreme precipitation showed positive trends in mid-lower reaches of the YRB, while the trends in the upper basin were not consistent among different studies [31,32]. Literature studies have shown that, while the results of spatio-temporal variations in temperature and precipitation extremes are generally consistent in the whole YRB, there is a great deal of ambiguity at the regional scale [33]. Besides, previous research was limited to certain time zones and temporal scales, with just a few meteorological stations and a few extreme indices. Comprehensive analysis is lacking, and detailed investigation of spatiotemporal distributions must be improved [34]. Furthermore, few studies examined driving factors of temperature and precipitation extremes in the YRB. Regional temperature and precipitation are influenced significantly by large-scale atmospheric and oceanic circulation. It is necessary to find whether and how these phenomena affect temperature and precipitation extremes in the YRB [35]. Furthermore, during the twenty-first century, both temperature and precipitation would show a significant rising trend [36]. It might lead to an increase in the risk of extreme events, make the YRB vulnerable to flood and drought disasters, and have a negative effect on the implementation of the Yangtze River Economic Belt Strategy.
Therefore, the objective of this article is to analyze how the variations in temperature and precipitation extremes vary across the YRB, and to investigate if there is a link between them and oceanic and atmospheric circulations. It has great significance for reducing disasters and ensuring development in the YRB. The questions we are attempting to answer here are: (1) What are the characteristics of temporal variations in extremes in the whole YRB? (2) What is the spatial difference in the spatial distribution of change trends for extremes? (3) Which factors control the spatial and temporal variability of extremes? The rest of the paper is organized as follows: Materials and Methods are described in Section 2. The spatio-temporal variations in the extremes and the association with the oceanic and atmospheric circulations are presented in Section 3, followed by discussion and conclusions in Section 4 and Section 5.
2. Materials and Methods
2.1. Study Area
The Yangtze River, the longest river in China, is about 6300 km in length. It passes through a range of landscapes, originating in the Qinghai–Tibet Plateau, cutting through western mountains to eastern plains before joining the East China Sea at Shanghai [37] The main stream runs through 11 provinces and autonomous regions (namely Qinghai, Tibet, Sichuan, Yunnan, Chongqing, Hubei, Hunan, Jiangxi, Anhui, Jiangsu, and Shanghai). The Yangtze River Basin (YRB, 90°32′ to 121°54′ E and 24°28′ to 35°45′ N) is located in the south of China, covering approximately 1,800,000 km2. The entire YRB is usually divided into three sub-basins, namely upper reaches (above Yichang), middle reaches (from Yichang to Hukou), and lower reaches (downstream of Hukou), which correspond well with the decrease in altitude [38] (Figure 1). Apart from some areas located in the Tibetan Plateau, most parts of the YRB are characterized by a sub-tropical monsoon climate [39]. The average annual temperature varies from −4 °C to 18 °C, with an average of 13.0 °C, increasing from the lower reaches to the upper reaches [40]. The annual mean precipitation of YRB is about 1100 mm, with more than 60% of the annual totals falling between June and August. Additionally, the annual mean precipitation also shows an increasing tendency from lower reaches (about 300 mm) to upper reaches (about 2400 mm) [41].
2.2. Data
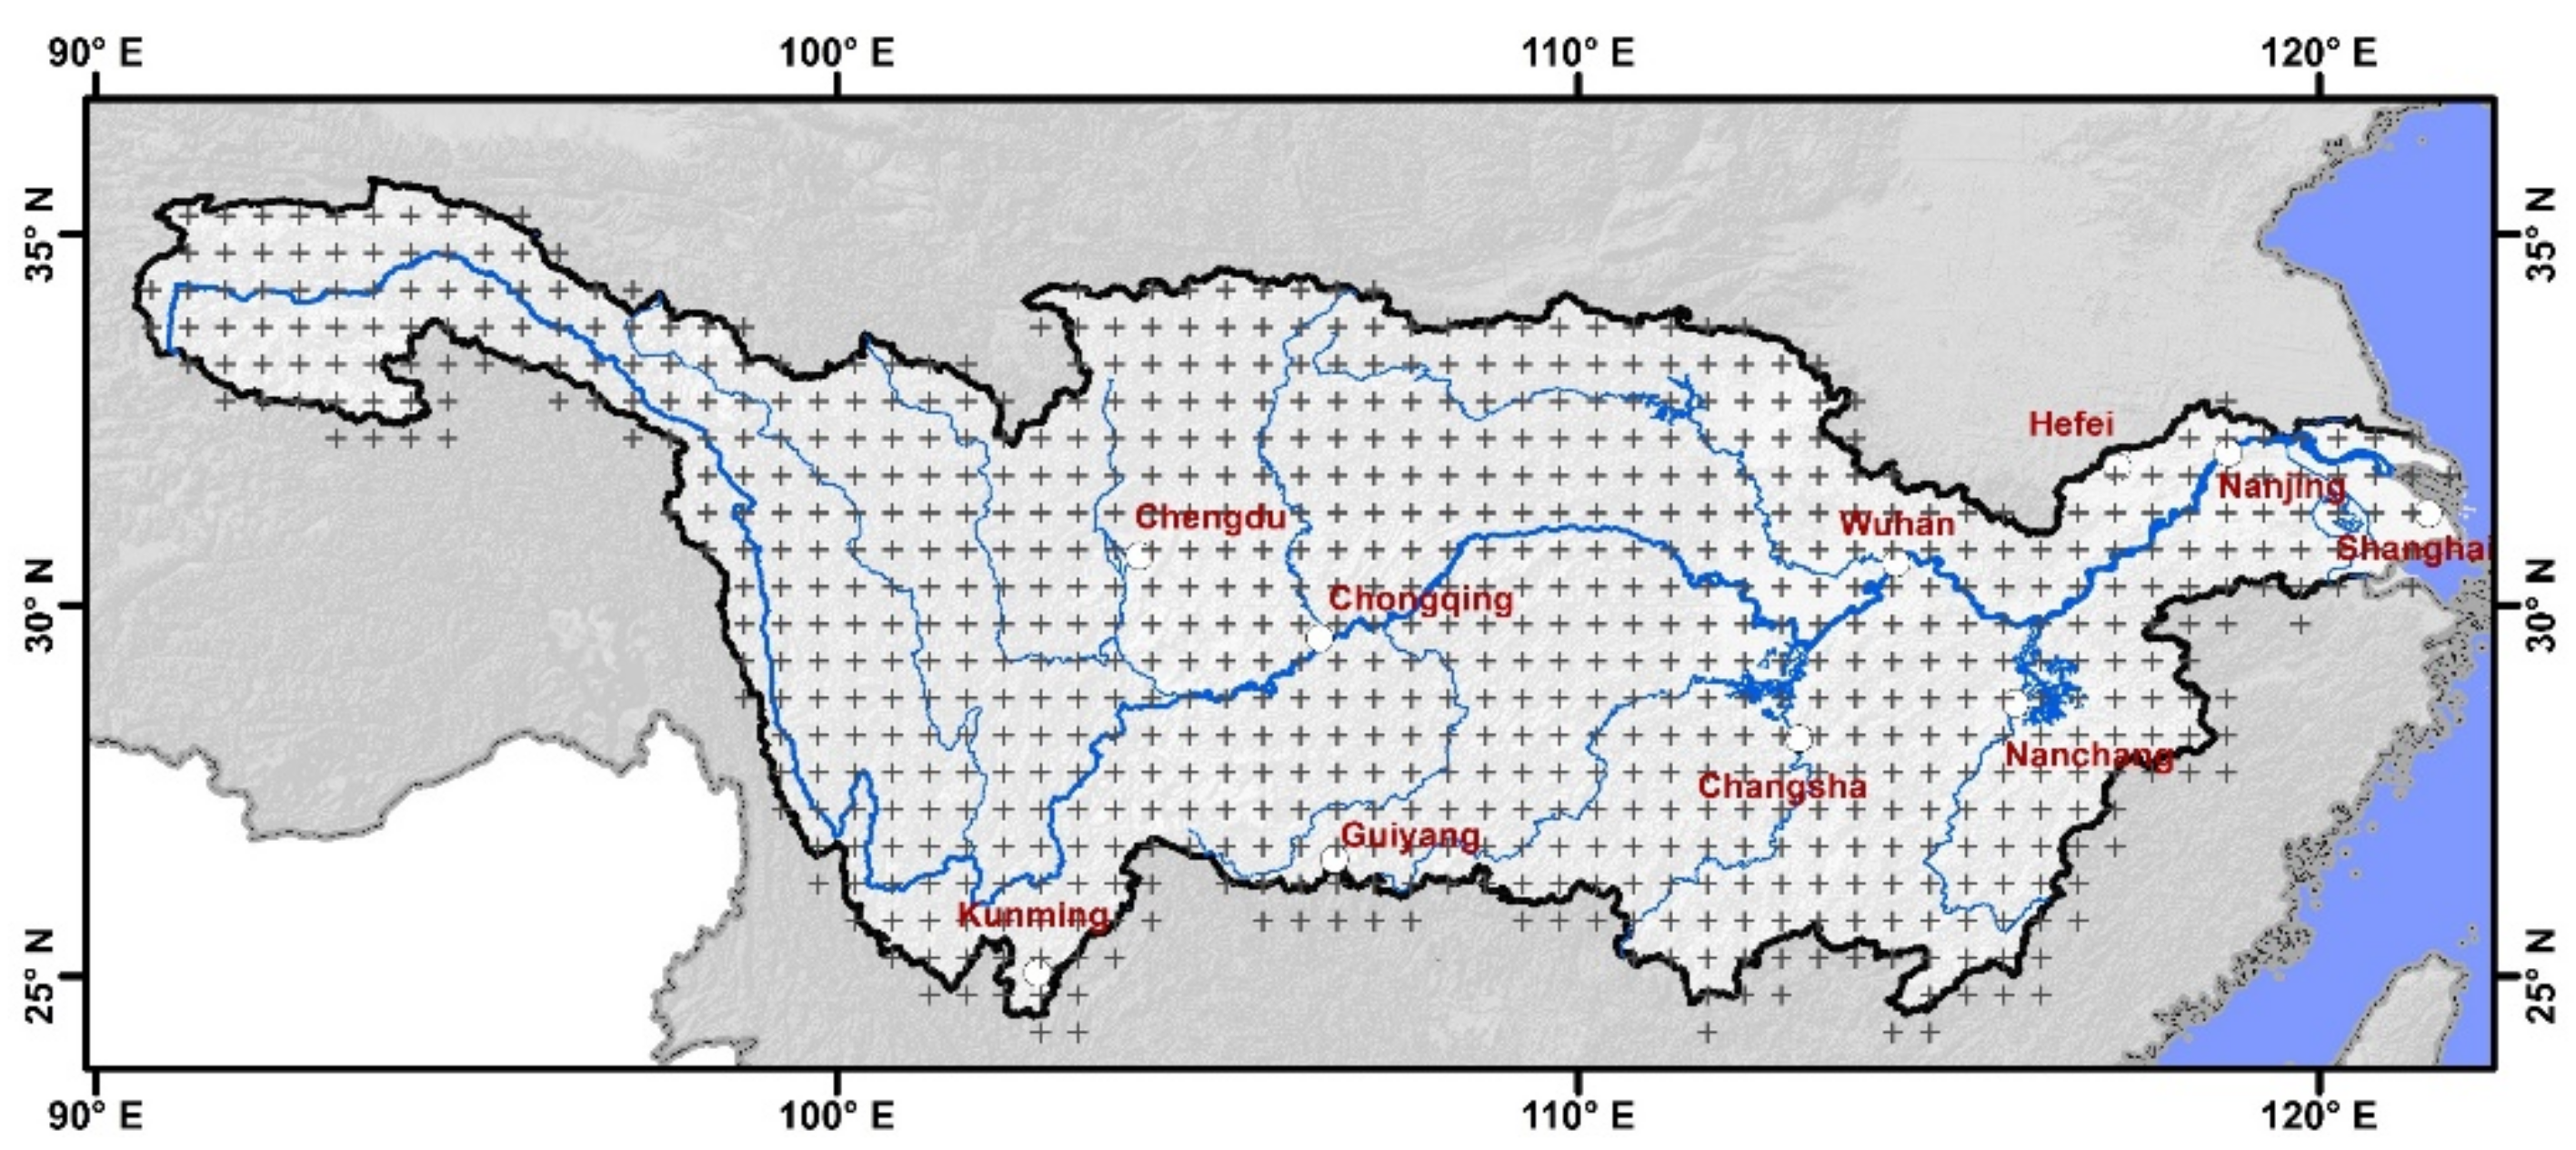
The National Climate Center of China Meteorological Administration (NCC/CMA) has established daily precipitation and temperature datasets covering the Chinese Mainland, namely China’s Ground Precipitation 0.5° × 0.5° Gridded Dataset (V2.0) and China’s Ground Temperature 0.5° × 0.5° Gridded Dataset (V2.0) (http://data.cma.cn/, accessed on 11 June 2021). These datasets are based on the observed daily precipitation and temperature at 2474 meteorological stations, the GTOPO30 (Global 30 arc-second elevation) DEM data, and Thin Plate Spline method. The data range from 1961 to 2020, with a spatial resolution of 0.5° × 0.5°. According to the boundary of the YRB, a total of 102 grids were selected to calculate the extreme temperature and precipitation indices (Figure 2).
In addition, time-series of annual Atlantic Multidecadal Oscillation (AMO), Pacific Decadal Oscillation (PDO), Southern Oscillation Index (SOI), North Atlantic Oscillation (NAO) and Arctic oscillation (AO) were used to analyze the relationship between extreme temperature (precipitation) indices and climate indices. These atmospheric and ocean time-series are obtained from the Physical Sciences Laboratory (https://psl.noaa.gov/, accessed on 15 June 2021).
2.3. Methods
2.3.1. Definition of Extreme Temperature and Precipitation Indices
In the early twenty-first century, the World Meteorological Organization (WMO) and the World Climate Research Program (WCRP) collaborated to form the Expert Team on Climate Change Detection and Indices (ETCCDI), which defined 27 representative climate indices to assess extreme climate change on a global and regional scale (http://cccma.seos.uvic.ca/ETCCDI, accessed on 20 May 2021). The ETCCDI’s extreme climate indices have advanced research into observed extreme climate events, as well as model simulation and attribution of such events. This study selected ten extreme temperature and precipitation indices to analyze the spatio-temporal variations in extreme events in the YRB. All these indices are recommended by the ETCCDI, which have been widely used in previous studies [42,43,44]. The definitions of these indices are listed in Table 1. The extreme temperature and temperature indices were calculated year by year at all boxes in the YRB.
2.3.2. Trend Analysis of Extreme Temperature and Precipitation Indices
Linear regression method was used to estimate the inter-annual trends of extreme temperature and precipitation indices characteristics [45], which can be calculated as follows:
where Slope is the trend value of the time series variable, which can be used to characterize the upward trend (Slope > 0) or downward trend (Slope < 0) during a given study period (here 1961 to 2020); n is the number of years (here n = 60); xi is the value of the variable for the ith year (i = 1, 2, …, n).
The statistical significance of a linear trend was evaluated using F-test at the 0.05 level [46]. The formula for F-value is:
where is the regression value of variable in i year and is the average value of variable for a given study period.
Abrupt change of the time series variable was detected by Moving t-test method, which tests a hypothesis based on a difference between two subsequence means [47]. For the time series (xi, i = 1, 2, …, n), the t statistic is given as:
where n1(n2), 1(2), and s1(s2) are the length, mean, and variance of the x1(x2) subsequences, respectively. In this research, n1 = n2 = 10. Given a significant level α (here α = 0.05), if |ti| > tα, the corresponding time (ith year) could be regarded as an abrupt change point.
The future trend of extreme temperature and precipitation was evaluated by Hurst index (H index for short, range from 0 to 1). This index is based on rescaled range (R/S) analysis method and can be used to describe the continuous state of precipitation or temperature events. The calculation principle is as follows [48]:
Consider the time series of extreme temperature or precipitation as:
Define the mean sequence as follows for any positive integer τ ≥ 1
The cumulative deviation is calculated by
The extreme deviation sequence is calculated by
The standard deviation sequence is calculated by
Define R(τ)/S(τ) ≅ R/S. If R/S∝τH, it indicates that the investigated time series data exhibit the Hurst phenomenon. If H = 0.5, it indicates that the time series of extreme temperature (precipitation) is random, that is, the future trend is independent of past trend. If 0 < H < 0.5, it indicates that the time series of extreme temperature (precipitation) has anti-continuity, that is, the future trend is opposite to the past. The closer H is to 0, the stronger the anti-continuity. If 0.5 < H < 1, it indicates that the time series of extreme temperature (precipitation) has continuity, that is, the future trend is consistent with the past. The closer H is to 1, the stronger the continuity. Hurst index classification is listed as Table 2.
2.3.3. Correlation Analysis of Climate Indices and Extreme Temperature/Precipitation
To identify the effects of climate indices on extreme indices, the Pearson correlation coefficient was employed to analyze the relationship between climate indices and extreme indices [49]. The coefficient (Rxy) can be calculated as:
where y denotes extreme temperature or precipitation (e.g., TXx, Rx1day) and x denotes climate indices (e.g., AMO, PDO); xi (yi) is the value of variable for the ith year (i = 1, 2, …, n); () is the average value of variable for a given study period. If Rxy > 0, it indicates that two variables are positively correlated; if Rxy < 0, it indicates that two variables are negatively correlated. The closer the absolute value of Rxy is to 0, the weaker the correlation. Whereas the closer H is to 1, the stronger the correlation.
3. Results
3.1. Temporal Variations in Extreme Temperature and Precipitation
3.1.1. Variations in Extreme Temperature Events
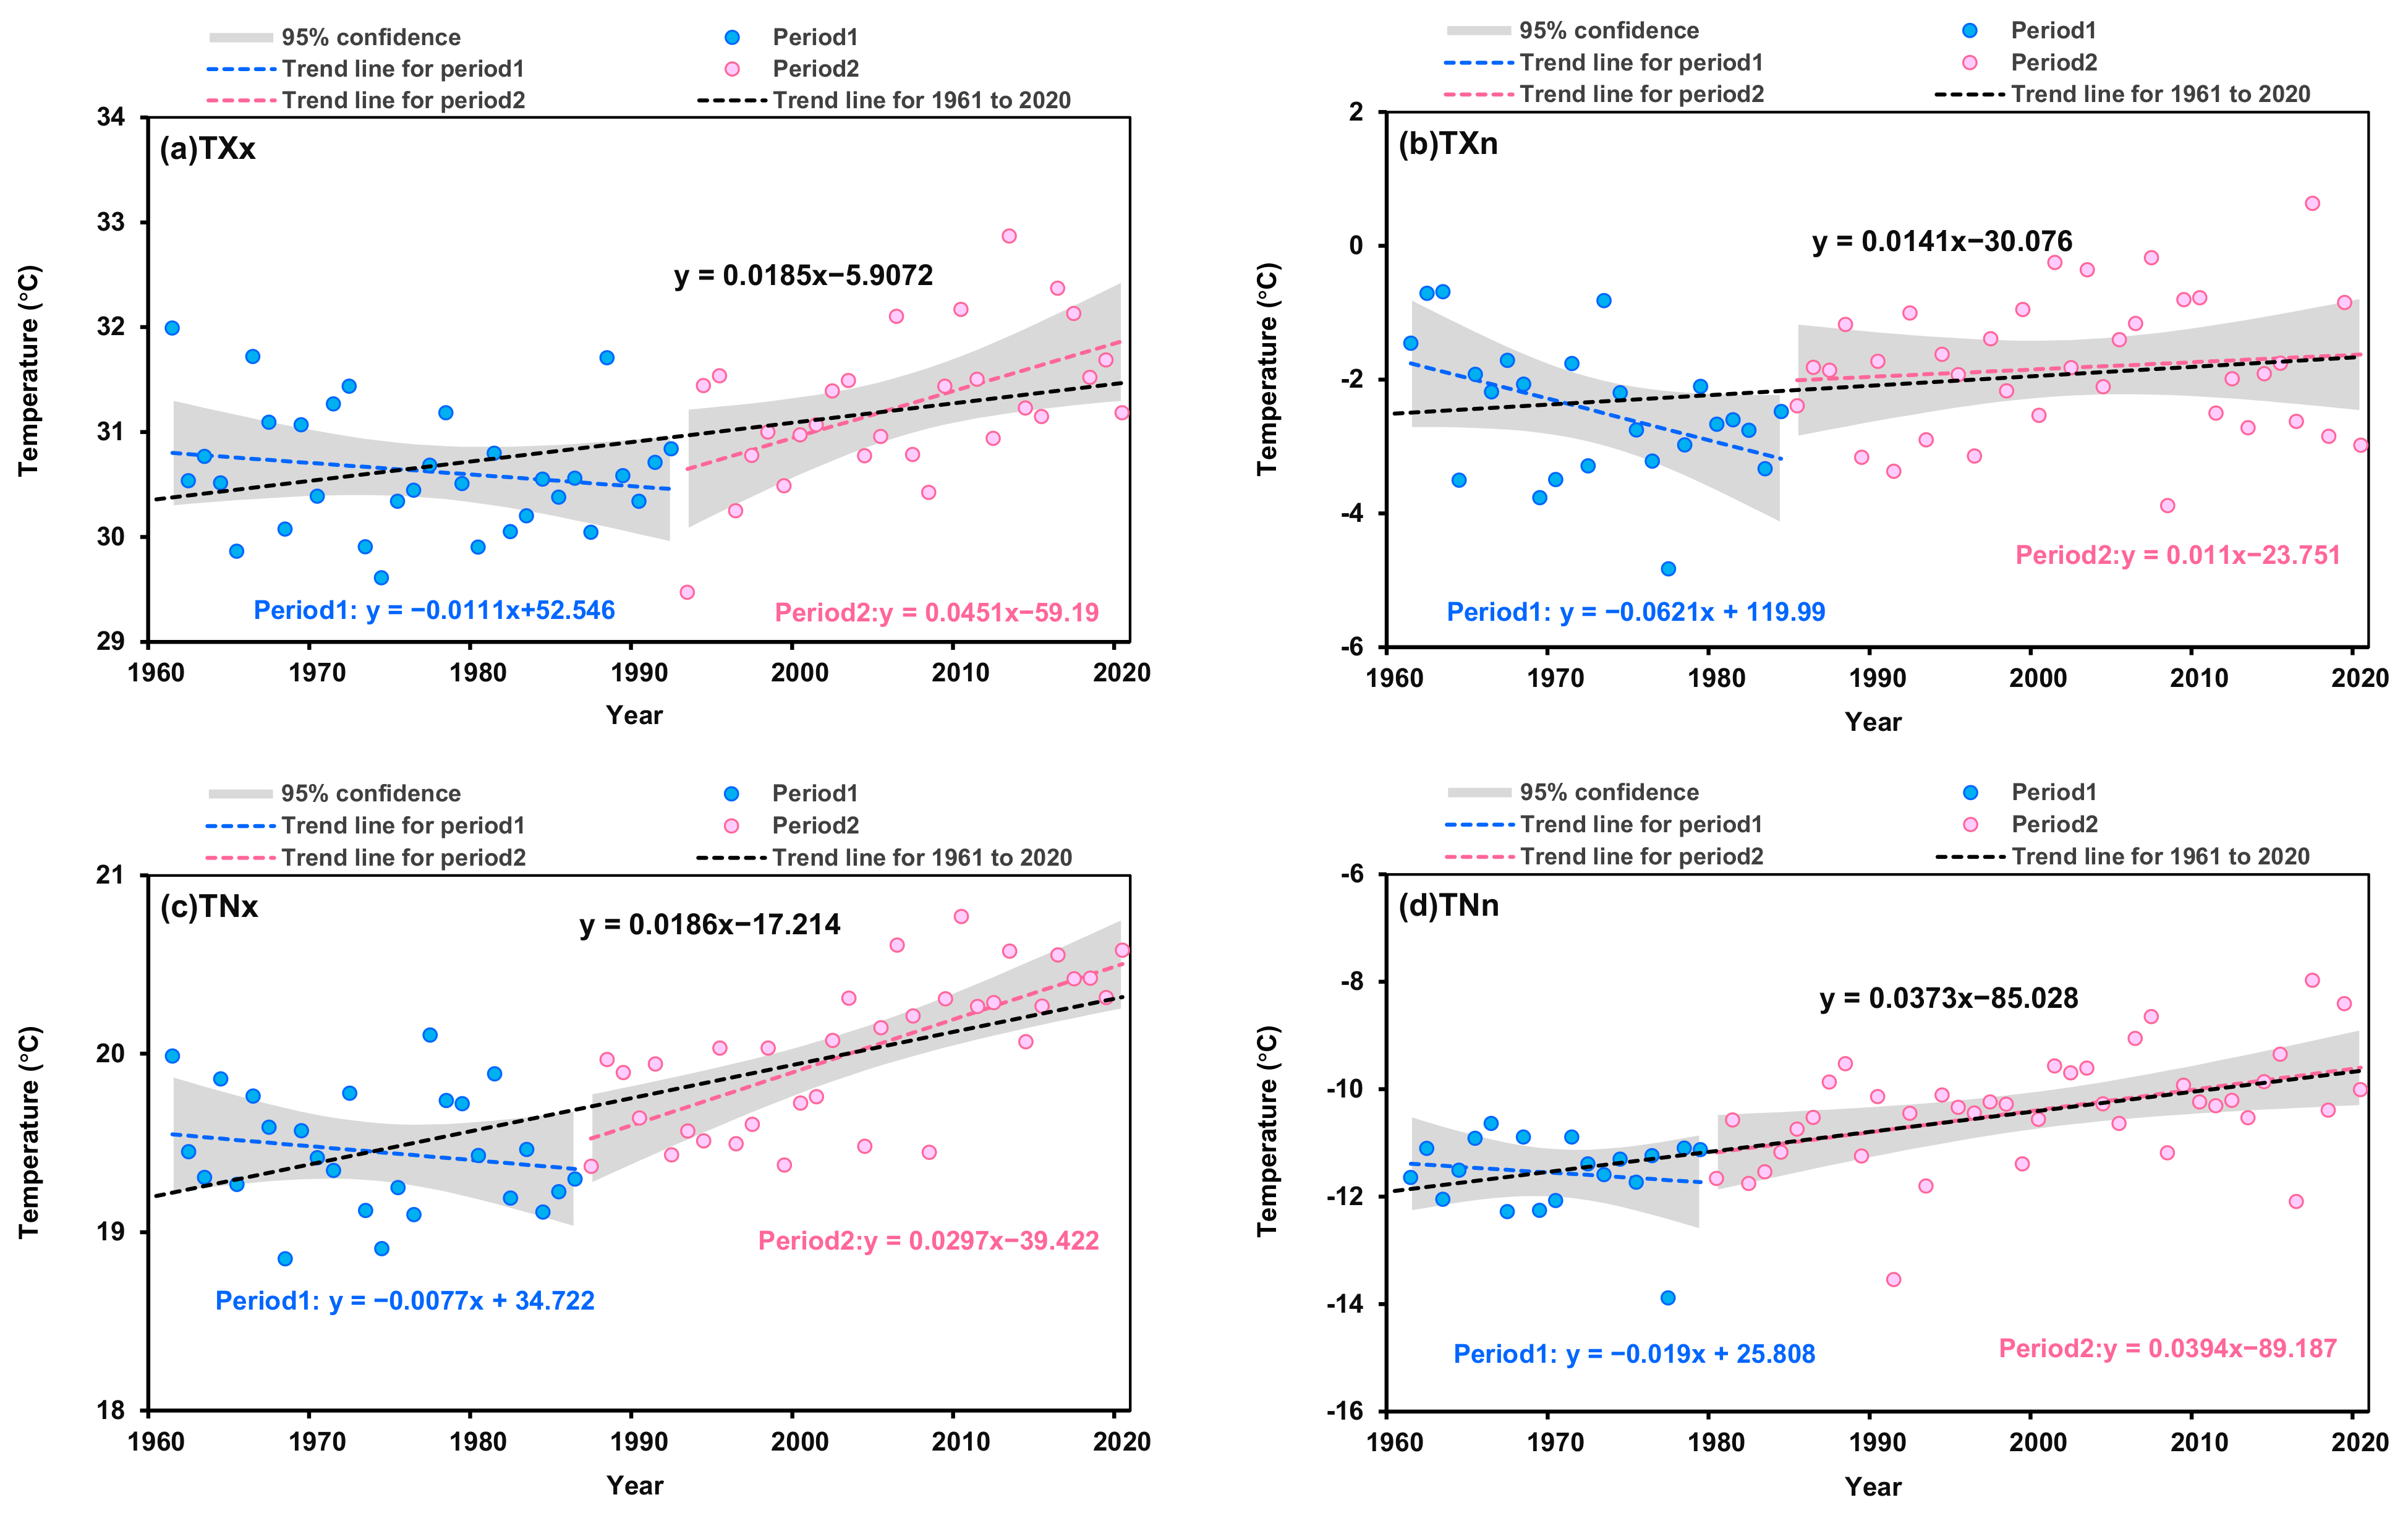
During 1961 to 2020, TXx, TNx, and TNn increased significantly (p < 0.01), at rates of 0.19 °C, 0.19 °C, and 0.37 °C per decade, while TXn had an insignificant slight increase, with a rate of 0.14 °C per decade. However, DTR decreased significantly (p < 0.01) at a rate of 0.09 °C per decade over the period of 1961 to 2020 (Figure 3a–e). It can be seen from figures that TXx, TXn, TNx, and TNn decreased first from the 1960s to the 1980s or mid-1990s and then increased. TXx, TXn, TNx, and TNn had obvious abrupt changes at 1993, 1985, 1987, and 1980, respectively. The annual average values of TXx, TXn, TNx, and TNn during the second period (after abrupt change, the same as below) were 31.26 °C, −1.82 °C, 20.01 °C, and −10.39 °C, respectively, which were 0.63 °C, 0.65 °C, 0.56 °C, and 1.17 °C higher than those during the first period (before abrupt change, the same as below). Annual DTR decreased at a rate of 0.19 °C per decade before 1996 (abrupt change year) and then rapidly decreased by 0.22 °C per decade from 1996 to 2020. The H values of TXx, TXn, TNx, TNn, and DTR were 0.765, 0.678, 0.878, 0.781, and 0.657, respectively. The findings showed that future trends in the selected extreme temperature indices were consistent with the current condition, with an increasing trend in TXx, TXn, TNx, and TNn and a decreasing trend in DTR (Table 3).
3.1.2. Variations in Extreme Precipitation Events
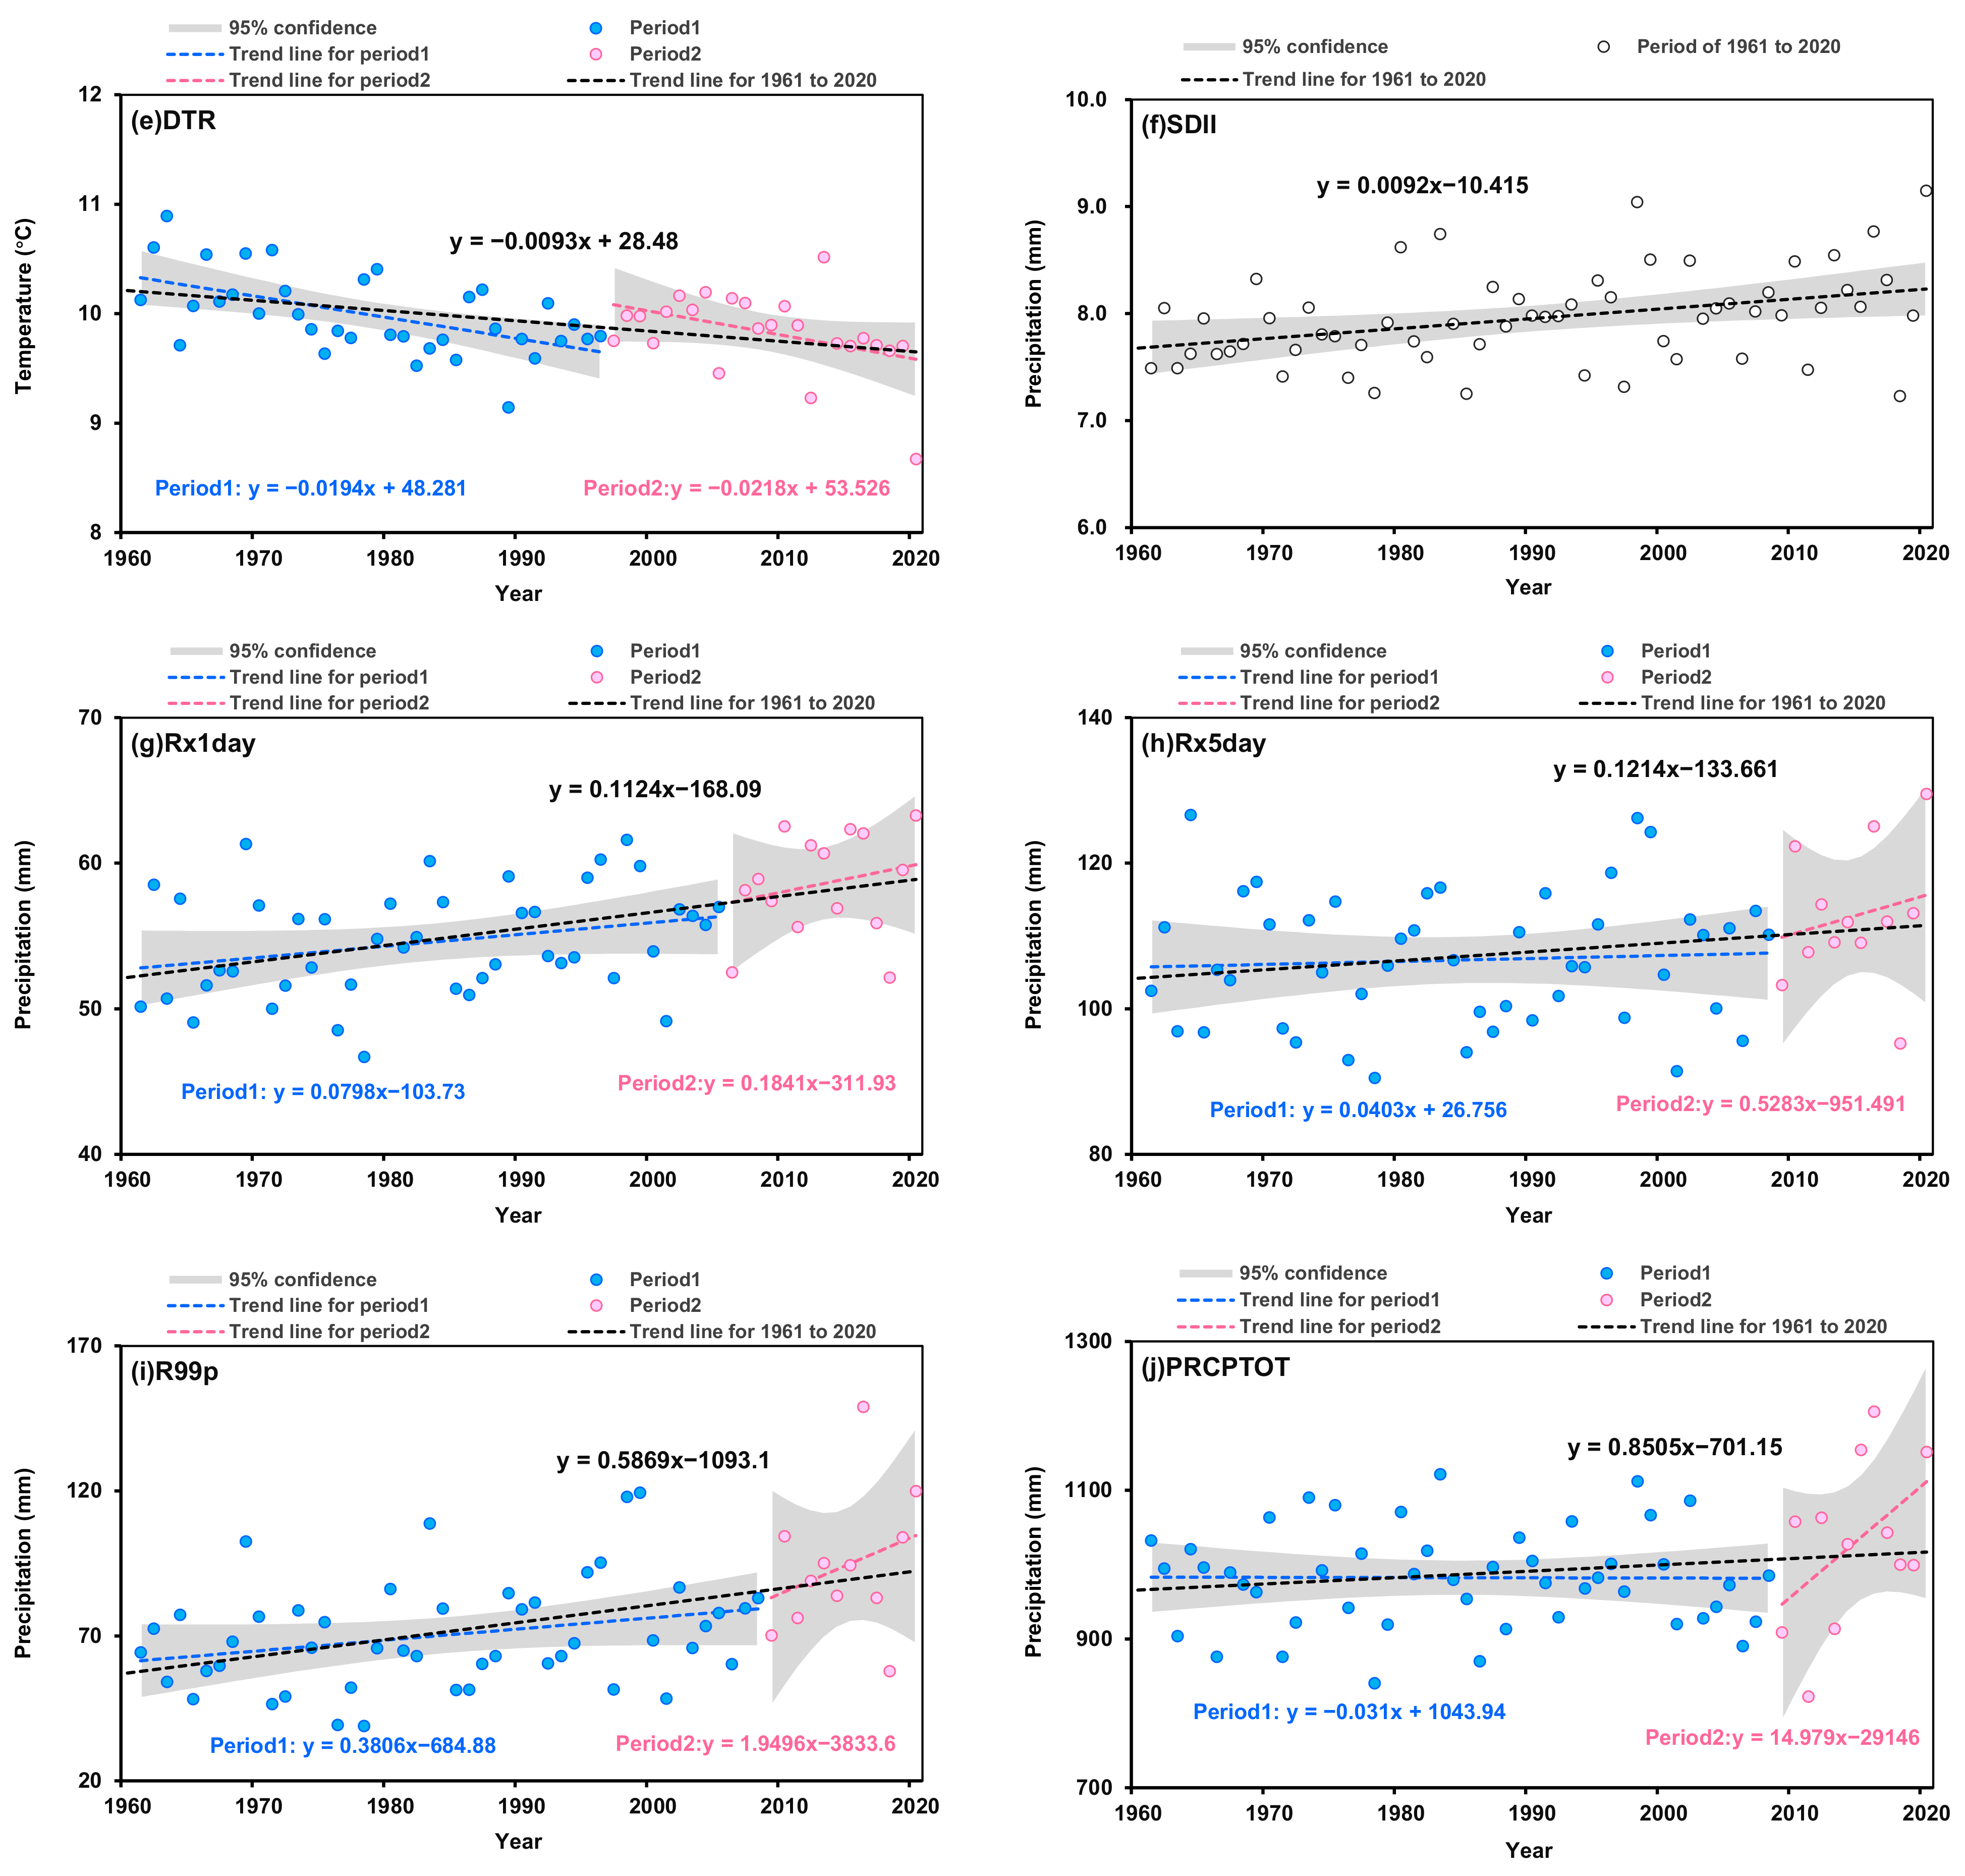
All the selected extreme precipitation indices showed a continuous increasing trend during the period 1961 to 2020. Changes of Rx1day, SDII, and R99p passed the significant trend test at the 0.01 significance level, with rates of 1.12 mm, 0.09 mm, and 5.87 mm per decade, respectively. The rates of change in Rx5day and PRCPTOT were 1.21 mm and 8.50 mm per decade, respectively, failing the significant trend test (Figure 3f–j). Annual Rx1day, Rx5day, R99p, and PRCPTOT had significant turning points in the later 2000s. From the late 2000s to the late 2010s, there was a large, fluctuating increasing trend in these four indices. Rx1day, Rx5day, R99p, and PRCPTOT were 58.61 mm/a, 112.73 mm/a, 93.91 mm/a, and 1029.10 mm/a after abrupt change years, which were 7.4%, 5.7%, 33.4%, and 4.8% higher than those before the abrupt year. Namely, the YRB showed an increasing trend in extreme precipitation indices after an abrupt change. The H values of Rx1day, Rx5day, SDII, R99p, and PRCPTOT were 0.718, 0.558, 0.527, 0.692, and 0.476, respectively. The results indicated that future trends of Rx1day, Rx5day, SDII, and R99p were consistent with that of the current status, namely an increasing trend in the future. But future trend of PRCPTOT will be opposite to past change, namely a decreasing trend in the future (Table 3). However, the H values were generally around 0.5, indicating that the future change trends were ambiguous.
3.2. Spatial Trends in Extreme Temperature and Precipitation
3.2.1. Trends in Extreme Temperature Events
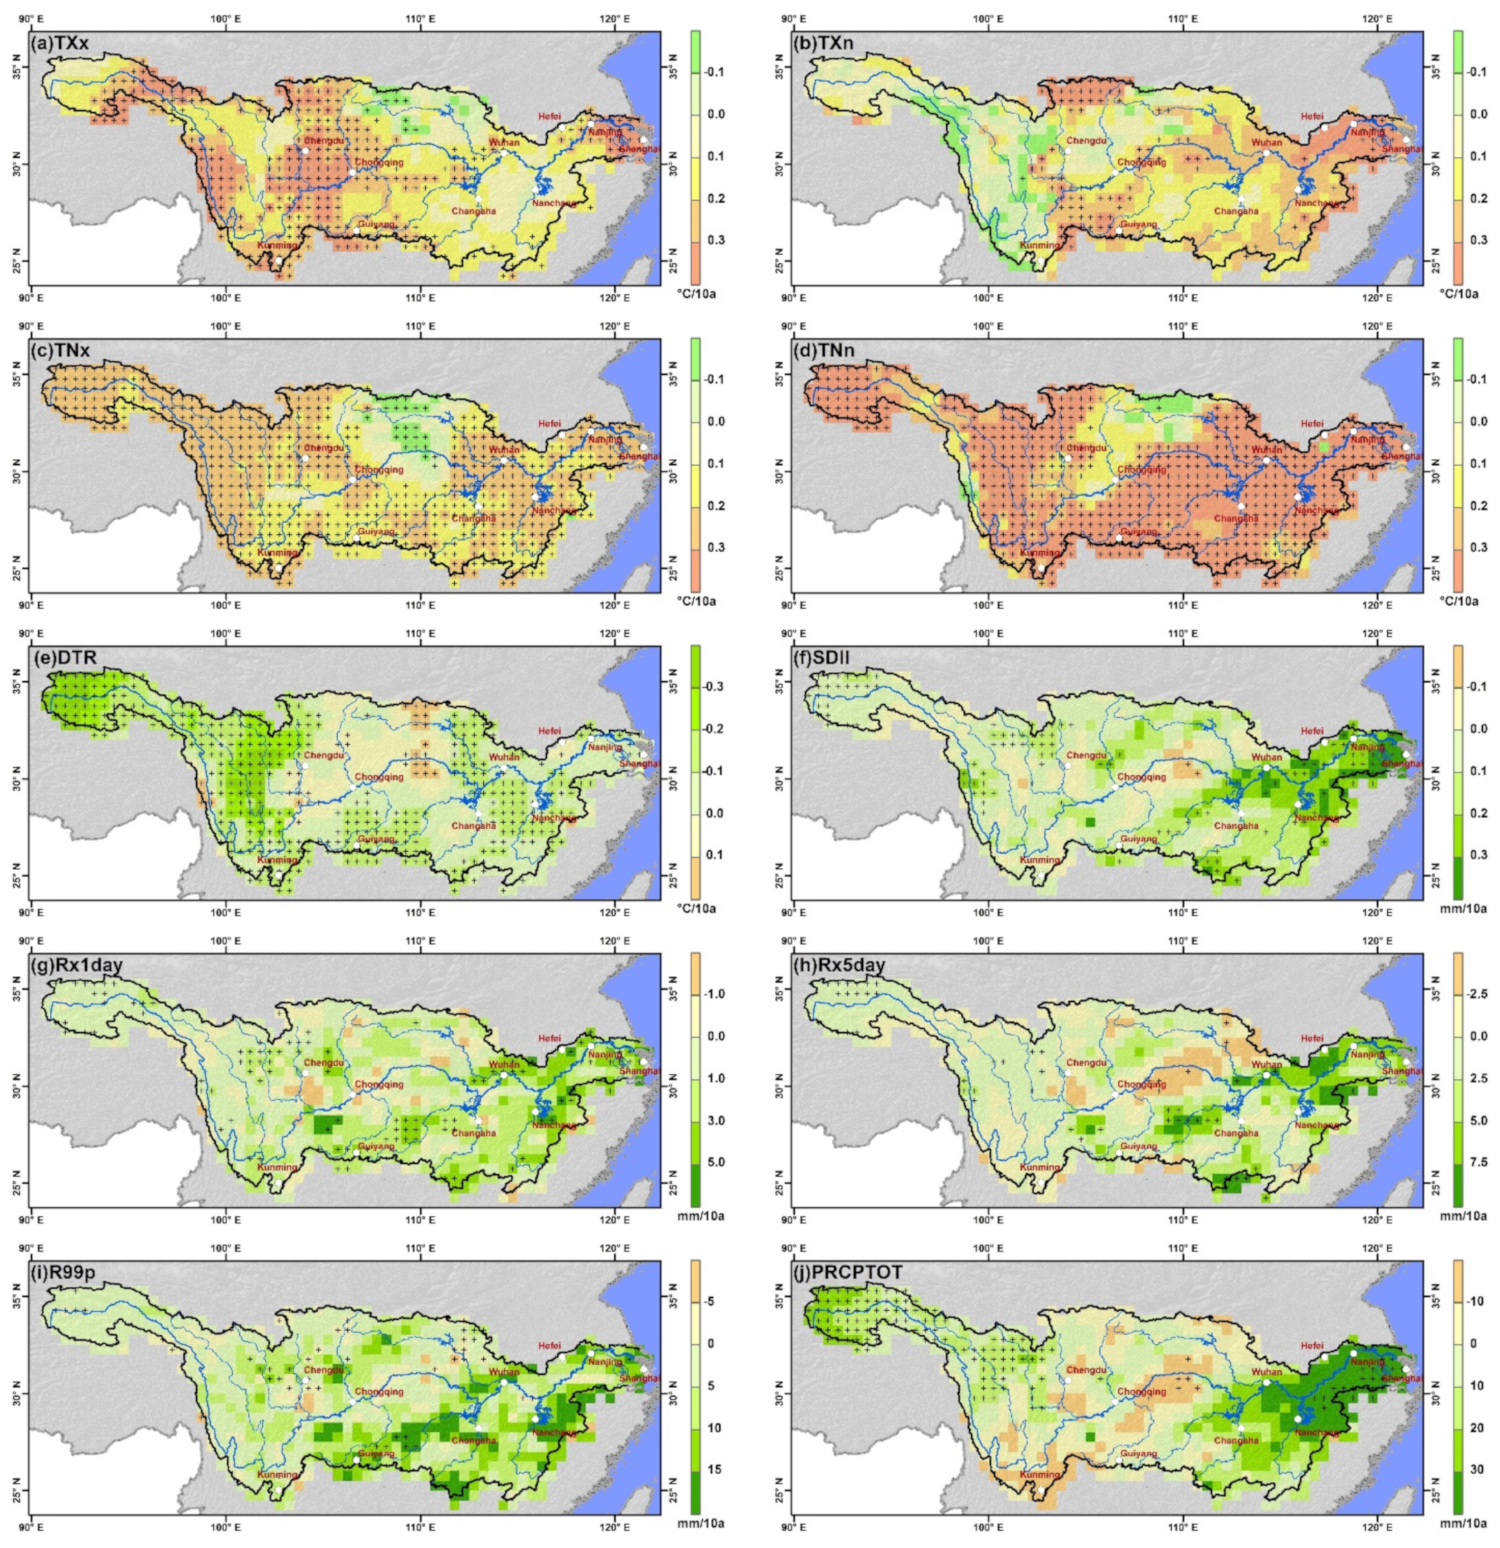
TXx, TXn, TNx, and TNn had positive trends, while DTR had a negative trend in most regions (Figure 4a–e). TXx, TXn, TNx, and TNn increased in 91.9%, 78.0%, 93.1%, and 96.1% of the total area of the YRB, and the significant positive trend (p < 0.05) accounted for 45.2%, 14.8%, 81.4%, and 75.5% of the study area. Thus, both the maximum and minimum values of Tmin had increased dramatically and widely in the YRB. DTR exhibited a decreasing trend around 80.1% of the YRB. The area with a significant decreasing trend (p < 0.05) in DTR accounted for 51.4% of the total area of YRB.
Spatially, annual TXx significantly increased in most areas of the upper reaches of the Yangtze River, with a rate of 0.1 to 0.5 °C per decade. Annual TXx decreased significantly in only 1.3% of the study area, which was mainly concentrated in the Han River Basin. Except for the Han River Basin, annual TXx increased slightly by 0 to 0.2 °C per decade in the Yangtze River’s middle and lower reaches, and this linear trend was mostly insignificant. However, annual TXx significantly increased at 0.3 to 0.5 °C per decade in the Yangtze River Delta (Figure 4a). About 22.0% of the area showed a decreasing trend in TXn and mainly concentrated in the Jinsha River Basin and Chendu Plain. But almost all decreasing trends were insignificant. Annual TXn also insignificantly increased in the middle and lower reaches of the Yangtze River, which is similar to the trends in TXx. However, the increasing rate of TXn was higher than that of TXx (Figure 4b). Both annual TNx and TNn increased significantly in most of the YRB, except the Han River Basin. In addition, the increasing rate of TNn (more than 0.3 °C per decade) was higher than that of TNx (range from 0.1 to 0.3 °C per decade). Only 4 to 7% of the area had a decreasing trend in TNx and TNn, which was mostly centered in the upper reaches of the Han River. In this area, annual TNx and TNn decreased by 0.1 to 0.2 °C per decade, and the decreasing trend in TNx was significant (Figure 4c,d). Annual DTR decreased at rates of 0 to 0.5 °C per decade in most YRB. But in some areas in the middle reach of the Yangtze River, it increased at rates of 0 to 0.2 °C per decade. The linear trend of DTR was significant in most areas of the Jinsha River Basin, Min River Basin, Wu River Basin, Gan River Basin, and middle and lower Han River (Figure 4e).
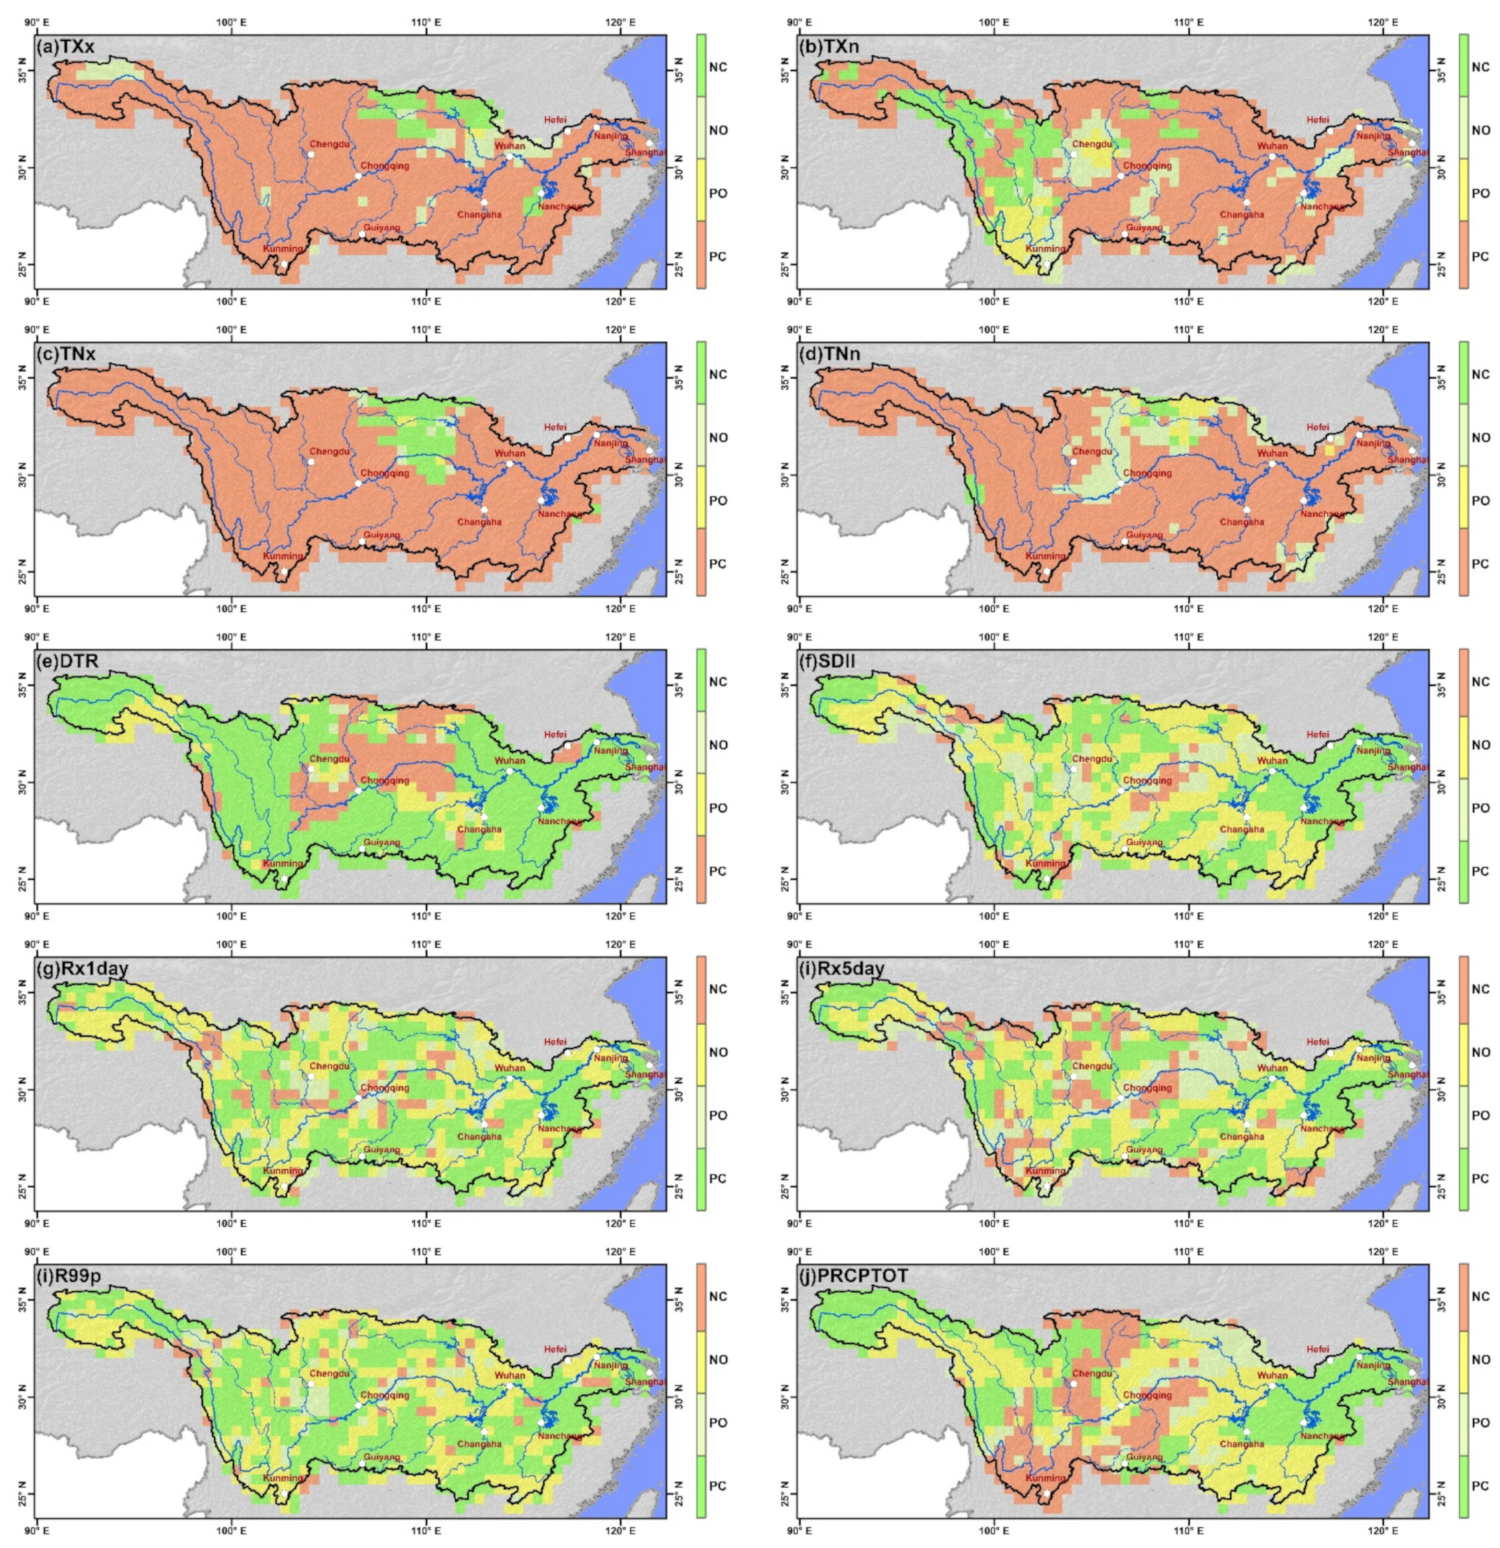
By combining the linear trend and the Hurst index, we can find that the “Positive–Consistent” trend accounted for 68.5 to 91.7% of the total area for TXx, TXn, TNx, and TNn (Figure 5a–d). In more than two-thirds of the YRB, it was predicted that these four extreme temperature indices would continue to increase. The “Negative–Consistent” trend accounted for 71.9% of the total area, namely, the DTR would continue to decrease in most of the YRB (Figure 5e). For TXx and TNx, “Negative–Consistent” area accounted for 5.6% to 6.5% of the total area, and was mostly found in the Han River Basin. (Figure 5a,c). The areas where TXn continued to decrease were mainly located in the Jinsha River Basin, accounting for 13.0% of the YRB (Figure 5b). The areas where DTR continued to increase were widely distributed in the Jialing River Basin, accounting for 17.1% of the YRB (Figure 5e).
3.2.2. Trends in Extreme Precipitation Events
There were more pixels with positive trends than negative trends for the selected five extreme precipitation indices, while the areas with significant trends were generally less. SDII, Rx1day, Rx5day, R99p, and PRCPTOT increased in 80.2%, 79.7%, 66.5%, 43.8%, and 70.3% of the total area of the YRB, and the significant positive trend (p < 0.05) accounted for 17.4%, 13.3%, 7.4%, 2.0%, and 18.8% of the study area (Figure 4f–j).
In most areas of the lower reaches of the Yangtze River, annual SDII, Rx1day, Rx5day, R99p, and PRCPTOT increased by more than 0.2 mm/10a, 3.0 mm/10a, 5.0 mm/10a, 10 mm/10a, and 20 mm/10a, accounting for 17.1%, 11.6%, 12.6 percent, 21.4%, and 22.7% of the area of the YRB, respectively. In some scattered areas in the middle reaches of the Yangtze, annual SDII, Rx1day, Rx5day, R99p, and PRCPTOT had decreased by more than 0.1 mm/10a, 1.0 mm/10a, 2.5 mm/10a, 5.0 mm/10a, and 10 mm/10a, accounting for 1.2%, 2.9%, 7.2%, 1.0%, and 11.7% of the total area of the YRB (Figure 4f–j). In addition, in the source region of Yangtze River, the linear trend of annual PRCPTOT was significant, showing that this alpine region in the YRB has experienced a wetter climate over the recent 60 years (Figure 4j).
The areas where SDII, Rx1day, Rx5day, R99p, and PRCPTOT would consistently increase accounted for 41.5%, 41.9%, 34.4%, 51.2%, and 36.2% of the YRB, respectively. The areas where extreme precipitation indices would consistently decrease were scattered, accounting for 5.5 to 22.7% of the YRB. The sum of the “Positive–Opposite” and “Negative–Opposite” areas were 41.1 to 51.7% of the YRB, indicating that the future trend of extreme precipitation indices was opposite to the past in almost half of the YRB (Figure 5f–j).
3.3. Relationships between Extreme Precipitation/Temperature and Climate Indices
3.3.1. Correlation between Regional Extreme Precipitation/Temperature and Climate Indices
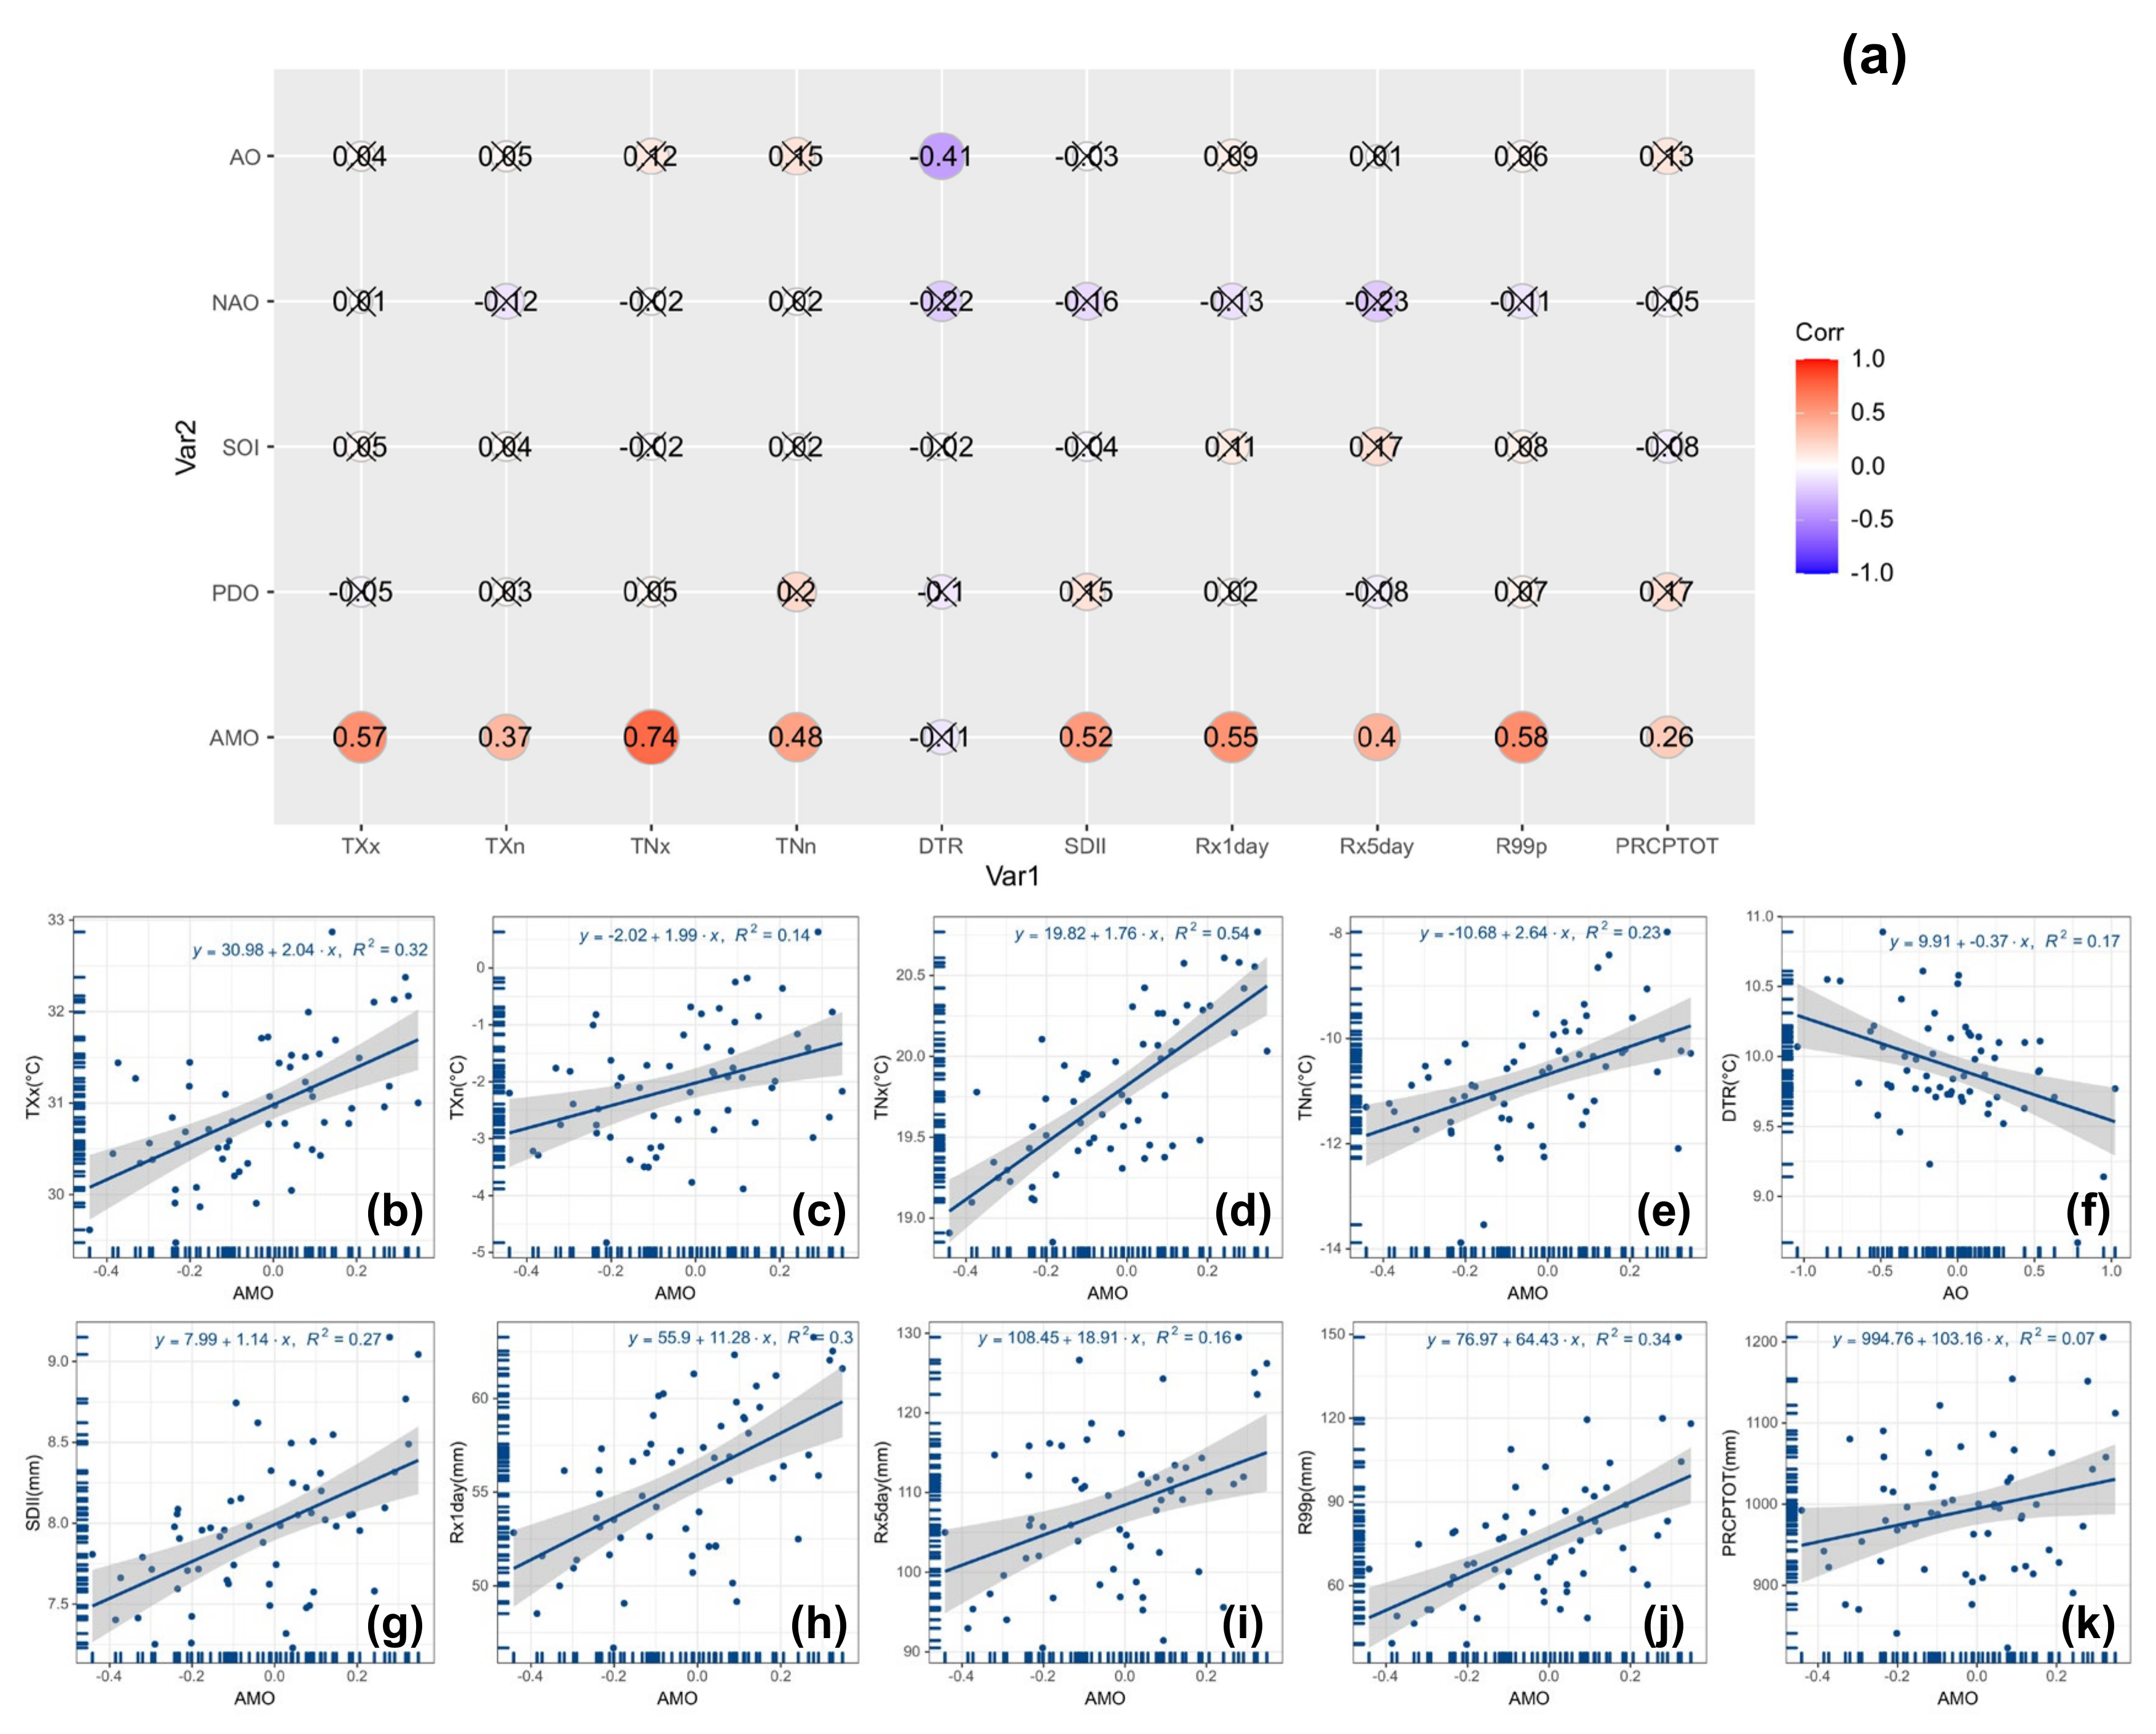
Overall, the most extreme indices used in this study (about 80% to 90%) were positively connected with AMO and AO, but negatively correlated with NAO (Figure 6a). For the temperature indices, TXx, TXn, TNx, and TNn were all positively and strongly connected with AMO. The Pearson correlation coefficients between these four temperature indices and AMO were 0.57, 0.37, 0.74, and 0.48, respectively (Figure 6a–f). DTR was negatively and significantly correlated with AO, with coefficient of −0.41. For precipitation indices, SDII, Rx1day, Rx5day, R99p, and PRCPTOT were all positively and significantly correlated with AMO. The Pearson correlation coefficients between these five precipitation indices and AMO were 0.52, 0.55, 0.40, 0.58, and 0.26, respectively (Figure 6a,g–k).
3.3.2. Spatial Distribution of Correlation between Extreme Precipitation/Temperature and Climate Indices
For the selected extreme temperature indices, areas with significant positive correlation between maximum values of temperature (TXx and TNx) and AMO accounted for 77.0 to 90.8% of the YRB, which were larger than those between the minimum values of temperature (TXn and TNn) and AMO (about 39.8 to 67.4%) (Figure 7a). In the majority of the YRB, TXx, TNx, and TNn were significantly and positively related to AMO, while areas with a nonsignificant correlation between these three indices and AMO were scarce and concentrated in the Han River Basin (Figure 8a,c,d). The variations in TXn were significantly and positively related to AMO mainly in the Wu River Basin, the region from Yibin to Yichang, upstream of Gan River, and upstream of Jialing River (Figure 8b). DTR variations were strongly and negatively connected to AO in many regions of the YRB, accounting for 63.9% (Figure 7a) and primarily distributed in middle and lower reaches of Jinsha River, Min River Basin, the Dongting Lake area, and the Poyang Lake area (Figure 8e).
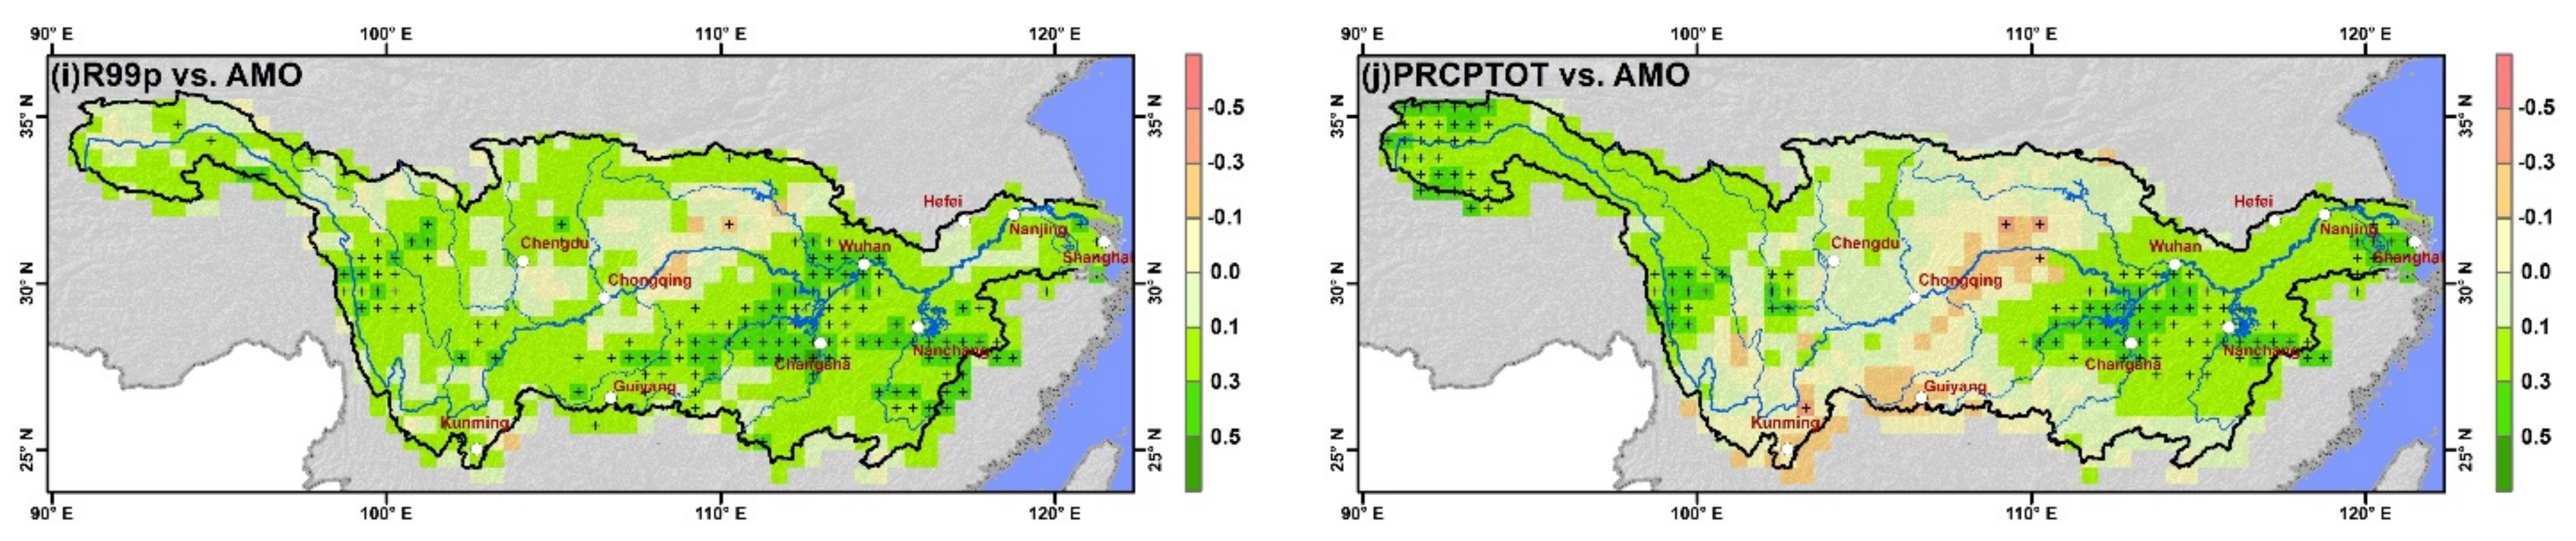
In the vast majority of the YRB, the variations in the selected extreme precipitation indices were not significantly related to the variability of climatic indices. Areas with significant correlation between extreme precipitation and climate indices accounted for less than 30% of the total YRB. The connection between the AMO and extreme precipitation was stronger than that of other climate indices and extreme precipitation. Areas with significant positive correlation between AMO and SDII, Rx1day, Rx5day, R99p, and PRCPTOT accounted for 28.8%, 10.9%, 11.1%, 20.1%, and 18.5% of the total YRB (Figure 7b), which was mainly distributed in the Dongting Lake area and the Poyang Lake area (Figure 8f–j).
4. Discussion
4.1. Changes in Extreme Temperature and Precipitation in the YRB during 1961 to 2020
The present results indicate that extreme temperature showed an increasing trend during 1961 to 2020, which was generally consistent with other studies [50,51,52]. However, the trends in maximum and minimum Tmin (TNx, TNn) were faster than those of maximum and minimum Tmax (TXx, TXn), consistent with a long-term decrease in DTR (Figure 3a–e). This finding agreed with the work carried out by You et al. [22]. In addition, the increase rate of TNn was 0.37 °C per decade, which was more than twice that of the warm extreme (TNx and TXn). It suggested that the YRB has witnessed more rapidly warming winter temperatures in the recent 60 years. Warmer temperature in winter is a double-edged sword for agriculture. It caused a northward expansion of the northern limits of winter crops, an increase in the planting area, and a reduction in the risk of freezing damage. But the warmer temperature in winter might hasten the maturity of winter crops, reducing the time required for seeds to grow and mature and resulting in lower yields [53,54]. All the selected extreme precipitation indices showed an increasing trend over the recent 60 years (Figure 3f–j), which is similar to the warm/cold extreme (TXx, TXn, TNx, TNn). But the areas with significant increases in extreme precipitation were much less than that of the increases in the warm/cold extreme (Figure 4). Previous studies also concluded that changes in the precipitation extreme showed lower levels of statistical significance compared with temperature extremes [25,52].
Our research revealed that abrupt changes in extreme temperatures were present in the 1980s or 1990s, while extreme precipitation altered suddenly in the 2000s (Figure 3). The changes in the warm/cold extremes were obviously different in the period prior to the abrupt change point and the period after the abrupt change point. Before the abrupt change point, the warm/cold extreme indicated a cooling trend, while it showed a warming trend after the abrupt change point (Figure 3a–d). Significantly, the warming trend in TXx from 1993 to 2020 (the period after the abrupt change point) was approximately twice that of the warming trend from 1961 to 2020 (Figure 3a). Time-series analysis revealed that most extreme precipitation indices showed a larger increase rate during the 2010s, indicating more frequency or higher intensity of extreme precipitation over the recent 10 years.
4.2. Impact of Oceanic and Atmospheric Circulations on Extreme Temperature and Precipitation in the YRB during 1961 to 2020
The mechanisms responsible for changes in extreme temperature and precipitation are complicated. Many factors, such as oceanic and atmospheric circulations [55,56], urbanization and economic growth [57,58], and topography and elevation [59] may affect the spatio-temporal variation in extreme temperature and precipitation. Considerable research has proven that large-scale oceanic and atmospheric patterns (such AMO, NAO, and AO) significantly affect regional average or extreme temperature and precipitation in China [55,56,60,61,62]. AMO represents the alternation of warm and cold sea surface temperatures in the North Atlantic. It has an important influence on multidecadal climate variability, such as the fluctuations of land surface temperature and precipitation [55,63]. For the East Asian climate, one viewpoint suggests that AMO causes sea–air feedback in the western Pacific [64], while the other believes that AMO influences atmospheric circulation, causing tropospheric temperature change in Eurasia [65]. According to the research carried by Wang et al., the AMO enhances the thermal contrasts between land and sea by heating the middle and upper troposphere over Eurasia, which ultimately affects the monsoon [66]. This is in line with the second point of view above. Although the mechanism of AMO’s influence on East Asian climate remains unknown, there are many studies that have proven that the AMO has a substantial interdecadal modulating effect on the east Asian monsoon climate. The East Asian summer monsoon is intensified by the warm phase AMO, but the winter monsoon is weakened, and vice versa [67,68,69]. In detail, the positive AMO phase corresponds to the warm winter in most parts of China, with less rain in the coastal areas of South China and more rain in the north [66]. The study of Li et al. showed that the significant winter warming in China has arisen from both anthropogenic creation of greenhouse gas and natural greenhouse gas creation dominated by the AMO [70]. Yan et al. found that the winter temperature in the south of the Hetao and the middle reaches of the Yangtze River in China, as well as precipitation in the Yangtze River basin in China and the East Asian summer monsoon, have a significant positive correlation with the Atlantic Ocean’s sea surface temperature [71]. In our study, we found that the AMO displayed significant correlations with warm/cold extremes in the YRB. It is noteworthy that areas with significant positive correlation between AMO and TNx (TNn) accounted for 90.8% (67.4%) of the total YRB (Figure 7a, Figure 8c,d). It indicated that the significant winter warming in the YRB was dominated by the AMO. In addition, areas with significant positive correlation between AMO and extreme precipitation were mainly concentrated in the middle and lower reaches of Yangtze River, especially in the Dongting Lake area and Poyang Lake area (Figure 8f–j). These findings were consistent with the above conclusions.
5. Conclusions
We investigated the spatio-temporal variations in temperature and precipitation extremes in YRB from 1961 to 2020 using gridded daily temperature and precipitation data, the linear regression method, the Moving t-Test method, and R/S analysis. We also studied the correlation between oceanic and atmospheric circulation with extreme indices. The conclusions are as follows:
During 1961 to 2020, the warm/cold extremes (TXx, TXn, TNx, TNn) showed an increasing trend. Minimum temperature (TNx and TNn) increased at a higher rate than maximum temperature (TXx and TXn), indicating a long-term decrease in DTR. TNx and TNn increased significantly in most of the YRB, excluding a few areas in the Han River Basin. TXx exhibited significant changes primarily in the upper reaches of Yangtze River, whereas TXn showed no significant trends in most YRB. TXx, TXn, TNx, and TNn might show an increasing trend in the future, whereas DTR might show a declining trend.
The extreme precipitation indices showed a consistent upward trend from 1961 to 2020, with greater increasing rates in most extreme precipitation indices primarily occurring in the middle and lower reaches of Yangtze River. In comparison to temperature extremes, trends in precipitation extremes are more ambiguous in the recent 60 years, and precipitation extreme indices are not statistically significant in most of the YRB. An increasing trend in Rx1day, Rx5day, SDII, and R99p along with a decreasing trend in PRCPTOT might occur in the future, but this trend was ambiguous.
There is a relationship between extreme indices and climate indices. The correlations between extreme temperature indices and climate indices are higher than that of extreme precipitation indices. In most of the YRB, especially for TNn, variations in warm/cold extreme (TXx, TXn, TNx, TNn) were more related to AMO variability. The variations in extreme precipitation indices were not significantly related to climate indices in the vast majority of the YRB.
This study focused on the long-term variation in the temperature and precipitation extremes in YRB, which might be crucial for forecasting meteorological disasters (such as floods and droughts) and water resource management. However, there is still room for improvement. First, we investigated the characteristics of variation on annual scales. However, in terms of seasonal scales, the variation characteristics may change. Second, certain statistical approaches were used to obtain the study’s results. We could arrive at different results if we apply other approaches. It is important to compare the consequences of different statistical approaches. Finally, the enhancements to the CMIP6 dataset have allowed scientists to investigate future changes in extremes. Identifying the spatial and temporal variability of extremes over the next several decades is beneficial for risk management.
Author Contributions
Conceptualization, Z.Y. and J.Y.; methodology, Z.Y.; validation, M.W. and Y.Y.; data curation, Z.Y.; writing—original draft preparation, Z.Y. and J.Y.; writing—review and editing, M.W.; supervision, J.Y. All authors have read and agreed to the published version of the manuscript.
Funding
[National Natural Science Foundation of China] grant number [41890821, 52079008]. [National Key Research and Development Project] grant number [2017YFC1502404].
Institutional Review Board Statement
Not applicable.
Informed Consent Statement
Not applicable.
Data Availability Statement
Not applicable.
Conflicts of Interest
The authors declare no conflict of interest.
References
- Easterling, D.R.; Evans, J.L.; Groisman, P.Y.; Karl, T.R.; Kunkel, K.E.; Ambenje, P. Observed variability and trends in extreme climate events: A brief review. Bull. Am. Meteorol. Soc. 2000, 81, 417–426. [Google Scholar] [CrossRef] [Green Version]
- Bandyopadhyay, S.; Kanji, S.; Wang, L. The impact of rainfall and temperature variation on diarrheal prevalence in Sub-Saharan Africa. Appl. Geogr. 2012, 33, 63–72. [Google Scholar] [CrossRef]
- Vogt, D.J.; Vogt, K.A.; Gmur, S.J.; Scullion, J.J.; Suntana, A.S.; Daryanto, S.; Sigurðardóttir, R. Vulnerability of tropical forest ecosystems and forest dependent communities to droughts. Environ. Res. 2016, 144, 27–38. [Google Scholar] [CrossRef] [Green Version]
- Katz, R.W.; Brown, B.G. Extreme events in a changing climate: Variability is more important than averages. Clim. Chang. 1992, 21, 289–302. [Google Scholar] [CrossRef]
- Gutowski, W.J.; Willis, S.S.; Patton, J.C.; Schwedler, B.R.J.; Arritt, R.W.; Takle, E.S. Changes in extreme, cold-season synoptic precipitation events under global warming. Geophys. Res. Lett. 2008, 35, L20710. [Google Scholar] [CrossRef] [Green Version]
- Li, W.; Jiang, Z.; Zhang, X.; Li, L.; Sun, Y. Additional risk in extreme precipitation in China from 1.5 °C to 2.0 °C global warming levels. Sci. Bull. 2018, 63, 228–234. [Google Scholar] [CrossRef] [Green Version]
- Mutiibwa, D.; Vavrus, S.J.; McAfee, S.A.; Albright, T.P. Recent spatiotemporal patterns in temperature extremes across conterminous United States. J. Geophys. Res. Atmos. 2015, 120, 7378–7392. [Google Scholar] [CrossRef]
- Horton, D.E.; Johnson, N.C.; Singh, D.; Swain, D.L.; Rajaratnam, B.; Diffenbaugh, N.S. Contribution of changes in atmospheric circulation patterns to extreme temper-ature trends. Nature 2015, 522, 465–469. [Google Scholar] [CrossRef] [PubMed] [Green Version]
- Wang, L.; Wu, Z.; Wang, F.; Du, H.; Zong, S. Comparative analysis of the extreme temperature event change over Northeast China and Hokkaido, Japan from 1951 to 2011. Theor. Appl. Climatol. 2016, 124, 375–384. [Google Scholar] [CrossRef]
- Kharin, V.V.; Zwiers, F.W.; Zhang, X.; Wehner, M. Changes in temperature and precipitation extremes in the CMIP5 ensemble. Clim. Chang. 2013, 119, 345–357. [Google Scholar] [CrossRef]
- Hong, W.; Sun, F.; Liu, W. The dependence of daily and hourly precipitation extremes on temperature and atmospheric hu-midity over China. J. Clim. 2018, 31, 8931–8944. [Google Scholar]
- Knapp, A.K.; Beier, C.; Briske, D.D.; Classen, A.; Luo, Y.; Reichstein, M.; Smith, M.D.; Smith, S.D.; Bell, J.E.; Fay, P.; et al. Consequences of More Extreme Precipitation Regimes for Terrestrial Ecosystems. BioScience 2008, 58, 811–821. [Google Scholar] [CrossRef]
- Xiong, J.; Ye, C.; Cheng, W.; Guo, L.; Zhou, C.; Zhang, X. The Spatiotemporal Distribution of Flash Floods and Analysis of Partition Driving Forces in Yunnan Province. Sustainability 2019, 11, 2926. [Google Scholar] [CrossRef] [Green Version]
- Alexander, L.V.; Zhang, X.; Peterson, T.C.; Caesar, J.; Gleason, B.; Klein Tank, A.M.G.; Haylock, M.; Collins, D.; Trewin, B.; Rahimzadeh, F.; et al. Global observed changes in daily climate extremes of temperature and pre-cipitation. J. Geophys. Res. 2006, 111, D05109. [Google Scholar]
- Kim, Y.-H.; Min, S.-K.; Zhang, X.; Zwiers, F.; Alexander, L.V.; Donat, M.; Tung, Y.-S. Attribution of extreme temperature changes during 1951–2010. Clim. Dynam. 2016, 46, 1769–1782. [Google Scholar] [CrossRef]
- García-Cueto, O.R.; Cavazos, M.T.; De Grau, P.; Santillán-Soto, N. Analysis and modeling of extreme temperatures in several cities in northwestern Mexico under climate change conditions. Theor. Appl. Climatol. 2014, 116, 211–225. [Google Scholar] [CrossRef]
- Wang, Q.X.; Wang, M.B.; Fan, X.H.; Zhang, F.; Zhu, S.Z.; Zhao, T.L. Trends of temperature and precipitation extremes in the Loess Plateau Region of China, 1961–2010. Theor. Appl. Climatol. 2017, 129, 949–963. [Google Scholar] [CrossRef]
- Pan, Y.-Z.; Wang, J.-A.; Gong, D.-Y. Changes in extreme daily mean temperatures in summer in eastern China during 1955–2000. Theor. Appl. Climatol. 2004, 77, 25–37. [Google Scholar] [CrossRef]
- Wu, X.; Hao, Z.; Hao, F.; Zhang, X. Variations of compound precipitation and temperature extremes in China during 1961–2014. Sci. Total Environ. 2019, 663, 731–737. [Google Scholar] [CrossRef] [PubMed]
- Zhou, Y.; Ren, G. Change in extreme temperature event frequency over mainland China, 1961−2008. Clim. Res. 2011, 50, 125–139. [Google Scholar] [CrossRef] [Green Version]
- Zhang, W.; Zhou, T. Increasing impacts from extreme precipitation on population over China with global warming. Sci. Bull. 2020, 65, 243–252. [Google Scholar] [CrossRef] [Green Version]
- You, Q.; Kang, S.; Aguilar, E.; Pepin, N.; Flügel, W.A.; Yan, Y.; Xu, Y.; Zhang, Y.; Huang, J. Changes in daily climate extremes in China and their connection to the large scale at-mospheric circulation during 1961–2003. Clim. Dynam. 2011, 36, 2399–2417. [Google Scholar] [CrossRef]
- Zhang, J.; Shen, X.; Wang, B. Changes in precipitation extremes in Southeastern Tibet, China. Quat. Int. 2015, 380–381, 49–59. [Google Scholar] [CrossRef]
- Wang, X.; Hou, X.; Wang, Y. Spatiotemporal variations and regional differences of extreme precipitation events in the Coastal area of China from 1961 to 2014. Atmos. Res. 2017, 197, 94–104. [Google Scholar] [CrossRef]
- Shi, J.; Cui, L.; Wang, J.; Du, H.; Wen, K. Changes in the temperature and precipitation extremes in China during 1961–2015. Quat. Int. 2019, 527, 64–78. [Google Scholar] [CrossRef]
- Gong, Z.Q.; Wang, X.J.; Zhi, R.; Feng, G.L. Regional characteristics of temperature changes in China during the past 58 years and its probable correlation with abrupt temperature change. Acta Phys. Sin. 2009, 58, 4342–4353. [Google Scholar]
- Wan, S.Q.; Gu, C.H.; Kang, J.P.; Zou, J.X.; Hu, Y.L.; Xu, S.S.; Wan, S.Q. Monthly extreme high temperature response to atmospheric oscillation in China. Acta Phys. Sin. 2010, 59, 676–682. [Google Scholar]
- Pascual, A.; Valero, F.; Martín, M.L.; García-Legaz, C. Spanish Extreme Winds and Their Relationships with Atlantic Large-Scale Atmospheric Patterns. Am. J. Clim. Chang. 2013, 2, 23–35. [Google Scholar] [CrossRef] [Green Version]
- Guan, Y.; Zhang, X.; Zheng, F.; Wang, B. Trends and variability of daily temperature extremes during 1960–2012 in the Yangtze River Basin, China. Glob. Planet. Chang. 2015, 124, 79–94. [Google Scholar] [CrossRef] [Green Version]
- Sang, Y.-F.; Wang, Z.; Liu, C. Spatial and temporal variability of daily temperature during 1961–2010 in the Yangtze River Basin, China. Quat. Int. 2012, 304, 33–42. [Google Scholar] [CrossRef]
- Zhai, P.; Zhang, X.; Wan, H.; Pan, X. Trends in Total Precipitation and Frequency of Daily Precipitation Extremes over China. J. Clim. 2005, 18, 1096–1108. [Google Scholar] [CrossRef]
- Zhang, Q.; Xu, C.-Y.; Zhang, Z.; Chen, Y.D.; Liu, C.-L.; Lin, H. Spatial and temporal variability of precipitation maxima during 1960–2005 in the Yangtze River basin and possible association with large-scale circulation. J. Hydrol. 2008, 353, 215–227. [Google Scholar] [CrossRef]
- Dong, Q.; Chen, X.; Chen, T. Characteristics and Changes of Extreme Precipitation in the Yellow–Huaihe and Yangtze–Huaihe Rivers Basins, China. J. Clim. 2011, 24, 3781–3795. [Google Scholar] [CrossRef]
- Su, B.; Gemmer, M.; Jiang, T. Spatial and temporal variation of extreme precipitation over the Yangtze River Basin. Quat. Int. 2008, 186, 22–31. [Google Scholar] [CrossRef]
- Guo, J.; Guo, S.; Li, Y.; Chen, H.; Li, T. Spatial and temporal variation of extreme precipitation indices in the Yangtze River basin, China. Stoch. Environ. Res. Risk Assess. 2013, 27, 459–475. [Google Scholar] [CrossRef]
- Yue, Y.; Yan, D.; Yue, Q.; Ji, G.; Wang, Z. Future changes in precipitation and temperature over the Yangtze River Basin in China based on CMIP6 GCMs. Atmos. Res. 2021, 264, 105828. [Google Scholar] [CrossRef]
- Zhang, Q.; Liu, C.; Xu, C.-Y.; Xu, Y.; Jiang, T. Observed trends of annual maximum water level and streamflow during past 130 years in the Yangtze River basin, China. J. Hydrol. 2006, 324, 255–265. [Google Scholar] [CrossRef]
- Guo, J.; Chen, H.; Xu, C.Y.; Guo, S.; Guo, J. Prediction of variability of precipitation in the Yangtze River Basin under the climate change conditions based on automated statistical downscaling. Stoch. Environ. Res. Risk Assess. 2012, 26, 157–176. [Google Scholar] [CrossRef]
- Zhao, G.; Mu, X.; Hörmann, G.; Fohrer, N.; Xiong, M.; Su, B.; Li, X. Spatial patterns and temporal variability of dryness/wetness in the Yangtze River Basin, China. Quat. Int. 2012, 282, 5–13. [Google Scholar] [CrossRef]
- Li, X.; Zhang, K.; Gu, P.; Feng, H.; Yin, Y.; Chen, W.; Cheng, B. Changes in precipitation extremes in the Yangtze River Basin during 1960-2019 and the asso-ciation with global warming, ENSO, and local effects. Sci. Total Environ. 2021, 760, 144244. [Google Scholar] [CrossRef] [PubMed]
- Xu, J.; Yang, D.; Yi, Y.; Lei, Z.; Chen, J.; Yang, W. Spatial and temporal variation of runoff in the Yangtze River basin during the past 40 years. Quat. Int. 2008, 186, 32–42. [Google Scholar] [CrossRef]
- Zhang, W.; Pan, S.; Cao, L.; Cai, X.; Zhang, K.; Xu, Y.; Xu, W. Changes in extreme climate events in eastern China during 1960–2013: A case study of the Huaihe River Basin. Quat. Int. 2015, 380–381, 22–34. [Google Scholar] [CrossRef]
- Sun, W.; Mu, X.; Song, X.; Wu, D.; Cheng, A.; Qiu, B. Changes in extreme temperature and precipitation events in the Loess Plateau (China) during 1960–2013 under global warming. Atmos. Res. 2016, 168, 33–48. [Google Scholar] [CrossRef]
- Wang, L.; Chen, S.; Zhu, W.; Ren, H.; Zhang, L.; Zhu, L. Spatiotemporal variations of extreme precipitation and its potential driving factors in China’s North-South Transition Zone during 1960–2017. Atmos. Res. 2021, 252, 105429. [Google Scholar] [CrossRef]
- Yin, J.; Yan, D.; Yang, Z.; Yuan, Z.; Wang, H.; Shi, X. Research on Historical and Future Spatial-Temporal Variability of Precipitation in China. Adv. Meteorol. 2016, 2016, 9137201. [Google Scholar] [CrossRef]
- Yuan, Z.; Xu, J.J.; Chen, J.; Wang, Y.Q.; Yin, J. EVI Indicated Spatial-Temporal Variations in Vegetation and Their Responses to Climatic and Anthropogenic Factors in the Chinese Mainland Since 2000s. J. Environ. Inform. 2021. [Google Scholar] [CrossRef]
- Sui, Y.; Jiang, D.; Tian, Z. Latest update of the climatology and changes in the seasonal distribution of precipitation over China. Theor. Appl. Climatol. 2013, 113, 599–610. [Google Scholar] [CrossRef]
- Granero, M.A.S.; Segovia, J.E.T.; Pérez, J.G. Some comments on Hurst exponent and the long memory processes on capital markets. Phys. A 2008, 387, 5543–5551. [Google Scholar] [CrossRef]
- Bhatia, N.; Singh, V.P.; Lee, K. Variability of extreme precipitation over Texas and its relation with climatic cycles. Theor. Appl. Climatol. 2019, 138, 449–467. [Google Scholar] [CrossRef]
- Sun, J.; Ao, J. Changes in precipitation and extreme precipitation in a warming environment in China. Chin. Sci. Bull. 2013, 58, 1395–1401. [Google Scholar] [CrossRef] [Green Version]
- Wen, X.; Fang, G.; Qi, H.; Zhou, L.; Gao, Y. Changes of temperature and precipitation extremes in China: Past and future. Theor. Appl. Climatol. 2016, 126, 369–383. [Google Scholar] [CrossRef]
- Zheng, J.; Fan, J.; Zhang, F. Spatiotemporal trends of temperature and precipitation extremes across contrasting climatic zones of China during 1956–2015. Theor. Appl. Climatol. 2019, 138, 1877–1897. [Google Scholar] [CrossRef]
- Liu, D.; Dong, A.X.; Deng, Z. Impact of climate warming on agriculture in Northwest China. J. Nat. Resour. 2005, 20, 119–125. [Google Scholar]
- Yang, X.-G.; Liu, Z.-J.; Chen, F. The Possible Effect of Climate Warming on Northern Limits of Cropping System and Crop Yield in China. Agric. Sci. China 2011, 10, 585–594. [Google Scholar] [CrossRef]
- Shi, S.; Li, J.; Shi, J.; Zhao, Y.; Huang, G. Three centuries of winter temperature change on the southeastern Tibetan Plateau and its relationship with the Atlantic Multidecadal Oscillation. Clim. Dyn. 2017, 49, 1305–1319. [Google Scholar] [CrossRef] [Green Version]
- Liu, X.; Xu, Z.; Peng, D.; Wu, G. Influences of the North Atlantic Oscillation on extreme temperature during the cold period in China. Int. J. Climatol. 2019, 39, 43–49. [Google Scholar] [CrossRef] [Green Version]
- Lu, C.; Sun, Y.; Wan, H.; Zhang, X.; Yin, H. Anthropogenic influence on the frequency of extreme temperatures in China. Geophys. Res. Lett. 2016, 43, 6511–6518. [Google Scholar] [CrossRef]
- Li, H.; Chen, H.; Wang, H. Effects of anthropogenic activity emerging as intensified extreme precipitation over China. J. Geophys. Res. Atmos. 2017, 122, 6899–6914. [Google Scholar] [CrossRef]
- Wu, S.; Hu, Z.; Wang, Z.; Cao, S.; Yang, Y.; Qu, X.; Zhao, W. Spatiotemporal variations in extreme precipitation on the middle and lower reaches of the Yangtze River Basin (1970–2018). Quat. Int. 2021, 592, 80–96. [Google Scholar] [CrossRef]
- Gong, D.; Wang, S.; Zhu, J. Arctic oscillation influence on daily temperature variance in winter over China. Chin. Sci. Bull. 2004, 49, 637–642. [Google Scholar] [CrossRef]
- Zhang, L.; Xu, H.; Shi, N. Influence of the spring Arctic oscillation on midsummer surface air temperature over the Yangtze River valley. Chin. J. Atmos. Sci. 2015, 39, 1049–1058. [Google Scholar]
- Zhong, Y.; Lei, L.; Liu, Y.; Hao, Y.; Zou, C.; Zhan, H. The influence of large-scale climate phenomena on precipitation in the Ordos Basin, China. Theor. Appl. Climatol. 2017, 130, 791–805. [Google Scholar] [CrossRef]
- Kerr, R.A. A North Atlantic Climate Pacemaker for the Centuries. Science 2000, 288, 1984–1985. [Google Scholar] [CrossRef] [Green Version]
- Lu, R.; Dong, B.; Ding, H. Impact of the Atlantic Multidecadal Oscillation on the Asian summer monsoon. Geophys. Res. Lett. 2006, 33, L24701. [Google Scholar] [CrossRef] [Green Version]
- Li, S.; Bates, G.T. Influence of the Atlantic Multidecadal Oscillation on the winter climate of East China. Adv. Atmos. Sci. 2007, 24, 126–135. [Google Scholar] [CrossRef]
- Wang, Y.; Li, S.; Luo, D. Seasonal response of Asian monsoonal climate to the Atlantic Multidecadal Oscillation. J. Geophys. Res. Atmos. 2009, 114, D02112. [Google Scholar] [CrossRef]
- Lu, R.; Dong, B. Response of the Asian summer monsoon to weakening of Atlantic thermohaline circulation. Adv. Atmos. Sci. 2008, 25, 723–736. [Google Scholar] [CrossRef]
- Yu, L.; Gao, Y.; Wang, H.; Guo, D.; Li, S. The responses of East Asian Summer monsoon to the North Atlantic Meridional Overturning Circulation in an enhanced freshwater input simulation. Chin. Sci. Bull. 2009, 54, 4724–4732. [Google Scholar] [CrossRef] [Green Version]
- Wang, Y.; Li, S.L.; Luo, D.; Fu, J. Nonlinearity in the Asian Monsoonal Climate Response to Atlantic Multidecadal Oscillation. Period. Ocean Univ. China 2010, 40, 19–26. [Google Scholar]
- Li, S.; Wang, Y.; Gao, Y. A review of the researches on the Atlantic multi-decadal oscillation (AMO) and its climate influence. Trans. Atmos. Sci. 2009, 32, 458–465. [Google Scholar]
- Yan, L.; Wang, P.; Guan, Z.; Yang, X. The teleconnection of sea surface temperature and its relation with China winter temperature. Sci. Meteorol. Sin. 2008, 28, 133–138. (In Chinese) [Google Scholar]
Figure 1.
Geographical location of the study area.

Figure 2.
Grid points over the YRB in China’s Ground Precipitation (temperature) 0.5° × 0.5° Gridded Dataset.
Figure 2.
Grid points over the YRB in China’s Ground Precipitation (temperature) 0.5° × 0.5° Gridded Dataset.

Figure 3.
Regional average of annual series in extreme precipitation and temperature indices during 1961 to 2020: (a) TXx; (b) TXn; (c) TNx; (d) TNn; (e) DTR; (f) SDII; (g) Rx1 day; (h) Rx5 day; (i) R99p; (j) PRCPTOT.
Figure 3.
Regional average of annual series in extreme precipitation and temperature indices during 1961 to 2020: (a) TXx; (b) TXn; (c) TNx; (d) TNn; (e) DTR; (f) SDII; (g) Rx1 day; (h) Rx5 day; (i) R99p; (j) PRCPTOT.


Figure 4.
Spatial trend distribution of extreme precipitation and temperature indices from 1961 to 2020: (a) TXx; (b) TXn; (c) TNx; (d) TNn; (e) DTR; (f) SDII; (g) Rx1day; (h) Rx5day; (i) R99p; (j) PRCPTOT. Significant positive trend or negative trend at the 0.01 significance level was indicated by dots.

Figure 5.
Spatial distribution of the extreme precipitation and temperature indices future trend: (a) TXx; (b) TXn; (c) TNx; (d) TNn; (e) DTR; (f) SDII; (g) Rx1day; (h) Rx5day; (i) R99p; (j) PRCPTOT. NC, NO, PO, PC are abbreviations for “Negative–Consistent“, “Negative–Opposite”, “Positive–Opposite”, “Positive–Consistent”, respectively.

Figure 6.
Correlation between extreme indices and climate indices in the YRB during 1961 to 2020. (a) The value of Pearson correlation coefficients and the “×” means that the correlation is not significant; (b–k) Scatter diagrams for significant correlation between extreme indices and climate indices.

Figure 7.
The percentage of areas with significant or non-significant correlation between extreme temperature (a) precipitation (b) and climate indices in the YRB during 1961 to 2020.
Figure 7.
The percentage of areas with significant or non-significant correlation between extreme temperature (a) precipitation (b) and climate indices in the YRB during 1961 to 2020.

Figure 8.
Spatial distribution of correlation coefficients between extreme temperature/precipitation and climate indices in the YRB during 1961 to 2020. (a) TXx vs. AMO; (b) TXn vs. AMO; (c) TNx vs. AMO; (d) TNn vs. AMO; (e) DTR vs. AO; (f) SDII vs. AMO; (g) Rx1day vs. AMO; (h) Rx5day vs. AMO; (i) R99p vs. AMO; (j) PRCPTOT vs. AMO. Significant correlation at the 0.01 significance level was indicated by dots.


Table 1.
Extreme temperature and temperature indices and their definition.
| Abbreviation | Definition | Units |
|---|---|---|
| TXx | Maximum value of daily maximum temperature | °C |
| TXn | Minimum value of daily maximum temperature | °C |
| TNx | Maximum value of daily minimum temperature | °C |
| TNn | Minimum value of daily minimum temperature | °C |
| DTR | Daily temperature range: mean difference between daily maximum temperature and daily minimum temperature | °C |
| SDII | Simple daily intensity index | mm |
| Rx1day | Annual maximum 1-day precipitation | mm |
| Rx5day | Annual maximum 5-day precipitation | mm |
| R99p | Annual total precipitation when daily precipitation > 99th percentile | mm |
| PRCPTOT | Annual total precipitation in wet days (RR ≥ 1 mm) | mm |
Table 2.
Future trend detected by Hurst index.
| H | Future Trend |
|---|---|
| 0.65 < H ≤ 1 | Strong continuity |
| 0.50 < H ≤ 0.65 | Weak continuity |
| 0.35 < H ≤ 0.50 | Weak anti-continuity |
| 0 < H ≤ 0.35 | Strong anti-continuity |
Table 3.
Hurst values for regional average of annual series in extreme temperature and precipitation indices.
Table 3.
Hurst values for regional average of annual series in extreme temperature and precipitation indices.
| Extreme Temperature Indices | H Values | Future Trend | Extreme Precipitation Indices | H Values | Future Trend |
|---|---|---|---|---|---|
| TXx | 0.765 | Strong continuity | SDII | 0.527 | Weak continuity |
| TXn | 0.678 | Strong continuity | Rx1day | 0.718 | Strong continuity |
| TNx | 0.878 | Strong continuity | Rx5day | 0.558 | Weak continuity |
| TNn | 0.781 | Strong continuity | R99p | 0.692 | Strong continuity |
| DTR | 0.657 | Strong continuity | PRCPTOT | 0.476 | Weak anti-continuity |
Publisher’s Note: MDPI stays neutral with regard to jurisdictional claims in published maps and institutional affiliations. |
© 2021 by the authors. Licensee MDPI, Basel, Switzerland. This article is an open access article distributed under the terms and conditions of the Creative Commons Attribution (CC BY) license (https://creativecommons.org/licenses/by/4.0/).
Share and Cite
MDPI and ACS Style
Yuan, Z.; Yin, J.; Wei, M.; Yuan, Y. Spatio-Temporal Variations in the Temperature and Precipitation Extremes in Yangtze River Basin, China during 1961–2020. Atmosphere 2021, 12, 1423. https://doi.org/10.3390/atmos12111423
AMA Style
Yuan Z, Yin J, Wei M, Yuan Y. Spatio-Temporal Variations in the Temperature and Precipitation Extremes in Yangtze River Basin, China during 1961–2020. Atmosphere. 2021; 12(11):1423. https://doi.org/10.3390/atmos12111423
Chicago/Turabian StyleYuan, Zhe, Jun Yin, Mengru Wei, and Yong Yuan. 2021. "Spatio-Temporal Variations in the Temperature and Precipitation Extremes in Yangtze River Basin, China during 1961–2020" Atmosphere 12, no. 11: 1423. https://doi.org/10.3390/atmos12111423
Note that from the first issue of 2016, this journal uses article numbers instead of page numbers. See further details here.