1. Introduction
Economic convergence within European countries is considered to be one of the basic conditions for strengthening the European Union (EU) external competitiveness and a crucial condition for reinforcing the cohesion within its territory. Achieving real convergence between the EU Member Countries is very important in the European integration process and it is a requirement for the new EU Member Countries that intend to adopt the single currency in the near future.
The macroeconomic theory of convergence is closely related to the long-term growth and development theory. The main objectives of this theory are to study the factors that influence economic growth and development in the specific countries, and to explain the variances between them and other countries in terms of real income per capita.
Currently, the world is in a process of fundamental transition, determined by certain extremely complex trends that manifest themselves globally, such as accelerated technological development (mostly ICT and digitalization), intensifying the connectivity of individuals through social platforms, demographic changes, the rapid increase in urbanization, the change of centers of economic power and climate security and natural resources. Given this, we consider that among the determining factors that influence sustainable economic growth and development, and thus the level of competitiveness of countries, are the capacity for innovation and intangible assets (mostly intellectual capital).
The paper had determined the degree of real economic convergence in the Euro Area using the Sigma convergence indicator (measuring the tendency to reduce income disparities existing between different countries in time) and, correspondingly, the Beta convergence indicator (illustrating the speed that different countries tend to manifest on the equilibrium level in terms of economic development). Thus, we consider the paper provides quite relevant clues, mostly regarding the economic development level and expected trends of evolution for innovation, and technological progress and smart development of the Member Countries, all these being important issues regarding the long term sustainability and competitive advantage. Given the importance of the chosen topic, the main objective set for this paper is to test the current situation of the countries that have joined the EU since 2004 (within three waves: 2004, 2007 and 2013) in terms of achieving real convergence with the Euro Area. We focus especially on the countries that have not yet adopted Euro as a single currency. In addition, based on our main results, we identified concrete measures considered to be of high importance in order to improve performance and long term sustainable competitive advantage in line with the requirements of the knowledge-based economy.
The above considerations allow us to consider that our paper is relevant and brings some contributions to the existing academic literature. In order to bring added value to the existing academic literature we had been able to identify during our research, we had examined current data (focusing on the situation of the newest EU Member Countries) using research methods presented in
Section 3 of this paper. In order to highlight the value added and the relevance of our paper, we compared some of our results with those illustrated in other similar scientific research that addresses the issues of sustainable economic development and convergence. Thus, we consider that our research results might be used by policy makers in order to identify proper optimal, effective and efficient solutions in order to increase the performance and long-term competitiveness of the countries in our analysis (especially in the case of those that are not yet part of the Euro Area). We consider that these possible alternatives, with a clear strategic and operational mission that might be implemented in practice by policy makers, are in line with the global trends regarding the knowledge- and innovative-based economy and society. The paper targets quite a large spectrum of audiences, addressing not only the academic environment but also the business environment, with a clear focus on policy makers involved in the complex process of designing long-term national development strategies dedicated to reach the main objectives of sustainability, competitiveness and convergence.
The paper is structured as follows: an introduction, designed as an argumentation of the relevance of the debated topic, and the next section is illustrating a synthesis of the scientific literature identified with respect to our chosen topic, the research methodology and the main empirical results of our study.
The paper concludes by presenting some general conclusions as well as some of the limits of the research we are aware of, intending to improve with further research.
We include in the last part of our paper some possible alternatives for further research we intend to develop in the future within our team. We mention that our team also includes young PhD candidates who are under the process of developing their PhD dissertations following different approaches dedicated to the topics of sustainability, competitiveness and convergence.
2. Synthesis of the Scientific Literature
The topics of sustainability, competitiveness and economic convergence have long been in the attention of economists who have focused on designing economic growth and development models. From a practical perspective, we had also taken into account the need to reduce income inequalities between the Member Countries, one of the major objectives for different levels of decision making in the EU for activation by policy makers.
One of the most important debates dedicated to the topic of real convergence began with the development of the neoclassical models of economic growth, based on econometric applications.
Such an econometric application is Sigma convergence, proposed by [
1], which, as with many other authors, we consider to have a significant utility as it provides a solid image in terms of periods of convergence or divergence between different economies within a certain period of time.
Testing convergence for the new EU Member Countries based on this indicator was made by authors such as [
2,
3], who reached the general conclusion that the dispersion of income and income inequalities between different economies is possible to be gradually reduced over time.
Contrary to these studies, there are other authors [
4] who show an increase in disparities between the economies of EU Member Countries, mostly between 1995 and 2006.
On the other hand, Beta convergence has been tested at the European level among other authors, by [
5,
6,
7], for example, who have shown that there are quite important gaps in terms of real income per capita in some European countries relative to the Euro Area. They illustrated that the speed to which these gaps are reduced is quite low.
Ref. [
8] tested the Sigma and Beta convergence at the level of the new EU Member Countries. This work concluded that these countries register a faster economic growth compared to the countries of northwestern Europe, taking important steps within the process of catching up and reducing economic and social disparities.
There are several studies that analyze the process of real convergence based on a recently published methodology, the Philips and Sul methodology ([
9,
10]). These studies include those of [
11,
12,
13].
Refs. [
11,
12] tested the convergence in terms of GDP/capita, using statistics from 14 EU Member Countries. The overall conclusion of the study was that the 14 countries do not form a homogeneous cluster of convergence.
Ref. [
13] analyzed the economic convergence of GDP/capita in the EU for a time horizon of 40 years. The study results showed that there was not a general convergence, but there are clear indications in terms of achieving a sort of convergence club.
Ref. [
14] determined the level of real convergence of Central and Eastern Europe (CEE) countries which were not members of the Euro Area using a methodology based on the Euclidean distance, the k-means and Ward methodologies. The authors demonstrated that Poland and the Czech Republic were the countries that recorded the highest real convergence within the Euro Area, while Romania was the country that registered the highest divergence.
Regarding the main sources of convergence, ref. [
15] showed that innovation and productivity are important sources of competitiveness and convergence, both for the countries that form the EU-15 and also for the CEE countries. On the other hand, [
16] states that technical knowledge transfer represents an important determinant of growth and development, mostly within the process of catching-up for the new EU Member and for the candidate countries.
On the other hand, ref. [
17] show that deviations from convergence targets can be largely associated with certain economic imbalances, especially private debt. The authors also show that belonging to the Euro Area makes the differences in convergence between countries less influenced by external shocks due to limited reversals of the current account and its main ingredients.
However, ref. [
18] highlights the fact that membership of the Euro Area is not a sufficient solution for real convergence. Thus, this author considers that first measures dedicated to increase productivity and technological development are mostly necessary.
Ref. [
19] analyzed the real convergence at the level of the European Union during the period 1995–2018 based on cross-sectional and panel data techniques. The general conclusion reached by these authors is that the convergence process that took place during this period differentiated, hampered by the global economic crisis of 2008, especially in the case of the new Member Countries. The authors recommend the implementation of measures, such as contributing to the increase in investments (including foreign direct investment looking for a broader vision regarding open the economy) and a consistent improvement of the institutional framework, as main sources of increasing the degree of real convergence at the EU level.
However, ref. [
20] demonstrates that not all types of foreign capital inflows are beneficial for supporting the economic growth of the countries in Central, Eastern and Southeastern Europe, remittances, for example, having a negative effect in this regard.
Ref. [
21] analyzed the main effects of the EUR on financial integration. Their results showed that the main advantages are considering the elimination of currency risk and the momentum of cross-border financial transactions.
Also related to financial integration, ref. [
22] argue that the welfare gains obtained from this process are substantial if the capital goods are not perfect substitutes. The authors say that for a country with a medium degree of development, financial integration generates, on average, a 9% increase in consumption.
Ref. [
23] analyzed the process of convergence and divergence in the Euro Area based on four variables: unemployment, inflation, relative prices and the current account. This research had also been designed to better test the role of Economic and Monetary Union as one of the convergence factors. Their research results showed that Economic and Monetary Union seem not to play a decisive role in the process of convergence in terms of unemployment and inflation rates.
Ref. [
24] point out that there are currently indications of a relaunch of the process of economic convergence at an EU level after the global crisis of 2008. They had also pointed out that this process could slow down again due to the negative effects of the global COVID-19 pandemic.
Based on our investigation of the international literature, as we briefly illustrated, it does not quite present homogeneous results in terms of achieving real convergence at the EU level, nor does it present the same types of measures for the sustainable fulfillment of this desideratum. This supports our motivation to choose this topic and to establish the main objective of our research. This kind of approach also illustrates our attempt to bring some potential added value to the existing literature.
3. Research Methodology
In order to successfully fulfill the objective established in this paper, we will apply a research methodology in three stages, based on econometric analysis.
The first stage in testing the real economic convergence consists of the Sigma convergence analysis. The usefulness of testing this type of convergence is that it provides a clear picture of the periods of convergence or divergence between different economies.
To analyze the Sigma convergence, we will use the σ indicator proposed by [
1]:
The convergence process is indicated by the decrease in time of the value of this indicator, .
This indicator was applied for three groups of countries: EU13—the countries that joined the European Union in 2004, 2007 and 2013 (Estonia, Cyprus, Latvia, Lithuania, Malta, Hungary, Czech Republic, Poland, Slovenia, Slovakia, Romania, Bulgaria, Croatia); EU7—the new Member Countries that have adopted the EUR (Cyprus, Estonia, Latvia, Lithuania, Malta, Slovenia, Slovakia); and EU6—the new Member Countries that intend to adopt the EUR in the near future (Bulgaria, Romania, Poland, Czech Republic, Hungary, Croatia).
Sigma convergence will be tested both within the three established groups of countries and also in the relationship between the countries that have not joined the Euro Area and its average.
The data series include the period 2000–2019. The data have annual values, and their source is represented by [
25]. Sigma convergence is calculated based on the GDP/capita indicator (Purchasing Power Parity (PPP)-dollar and Local Currency Unit (LCU)).
The second step we will take to test real economic convergence is to determine the absolute and group Beta convergence.
is the growth rate of GDP for the economy between and
is the logarithm of real GDP per capita of the economy at moment
—constant
—the slope parameter
—standard error
When there is a negative annual rate of Beta, we can say that there is a downward trend in income gaps between countries.
Absolute Beta convergence is tested at the level of the 13 selected countries (EU13), while group Beta convergence is tested at the level of EU7 and EU6, and the indicator used is GDP/capita (PPP-dollar).
Also in this case, the data series refer to the period 2000–2019 and are extracted from [
25].
According to the neoclassical model, the decreasing trend of the marginal efficiency of capital is the basis point of the convergence of two categories of countries. The reverse relationship between the level of development and the economic return on physical capital reflects the convergence of the countries. The convergence is determined by reducing the production and savings rate for a monetary unit of investments. This process is reflected in reducing the annual growth rate of developed countries. Thus, to strengthen the hypothesis of Beta convergence, we will examine the veracity of decreasing returns on capital. Moreover, we will analyze if there is any connection between the level of development and the returns on capital for the mentioned countries.
In this respect, the first step is to calculate the total return on investment:
—total investments yield
(the growth of in 2019 compared to 2018 in USD–PPP)
in 2018
The second step is to determine the correlation between GDP/capita and the total return on investment. The correlation is determined based on a simple linear regression where the total investment return is the independent variable and GDP/capita is the dependent variable. Total investment yield is the ratio between the growth GDP/capita in 2019 compared to 2018 and total investments per capita in 2018 (in the case of Croatia, the Czech Republic, Slovenia, Slovakia and Malta the total investment value is forecasted by the World Bank). The value of GDP/capita is that of 2018.
In the third stage we will test the robustness of the results obtained after determining the Sigma and Beta convergence through cluster analysis.
This method aims to identify more homogeneous groups by grouping the elements so as to maximize the variation between groups and minimize variation within the group. Cluster analysis involves the following steps: the identification and registration of the important variables to group the factors, the calculation of the distance between factors, the creation of a proximity matrix, choosing the cluster algorithm for generating the groups and dendrogram interpretation.
To accomplish the first step of cluster analysis, the economic and statistics data should be organized in a matrix in which variables are in the columns and the cases are in the line. The object of classification are the cases, therefore the selection and how to deal with them is very important, with a direct impact on cluster analysis.
Next, to assess the distance between elements, in this study we used Euclidean distance method, based on the following equation:
To determine this equation, we will use the Real Convergence Index (RCI), developed by [
26]:
The variables were rescaled with values between 0 and 1, using the following formula:
Based on Euclidean distances, the proximity matrix is performed.
The next step is to select the clustering algorithm that involves the identification of some evaluation rules for distances between the obtained clusters, and the one chosen for this study is the k-means method.
The cluster analysis is determined for the EU Member Countries that joined in 2004, 2007 and 2013.
The data cover the period 2000–2019 and are taken from [
27].
To validate the results obtained from the cluster analysis, we use the log-t methodology proposed by [
9,
10]:
—relatively transitional behavior
A group of countries converge to a common level of productivity if , .
Using Equation (8), the authors say that in the case of a degree of convergence between countries, for any α > 0, the t-statistic value of the estimated parameter b tends to +∞, and for α = 0, the value of t -statistic tends to a normal distribution N (0, 1). If there is a process of divergence, for any α < 0, the t-statistic value of the estimated parameter b tends to −∞. The regression of the convergence test involves three steps.
In the first step the H1/Ht ratio is constructed, while in the second step the value of the t-statistic, tb, for the b coefficient is calculated using Equation (8). In the third step an autocorrelation and heteroskedasticity robust one-side t test of the inequality null hypothesis using the estimated b coefficient and HAC standard errors is applied. The null convergence hypothesis ( and ) is validated if t-statistic value is greater than −1.65.
The log-t methodology is applied based on the GDP/capita indicator (expressed in PPP-dollar).
Further, we present the results obtained after applying the research methodology described in this section.
4. Main Empirical Results
The main results of the research will be presented individually, according to the three stages presented in the research methodology.
4.1. Sigma Convergence
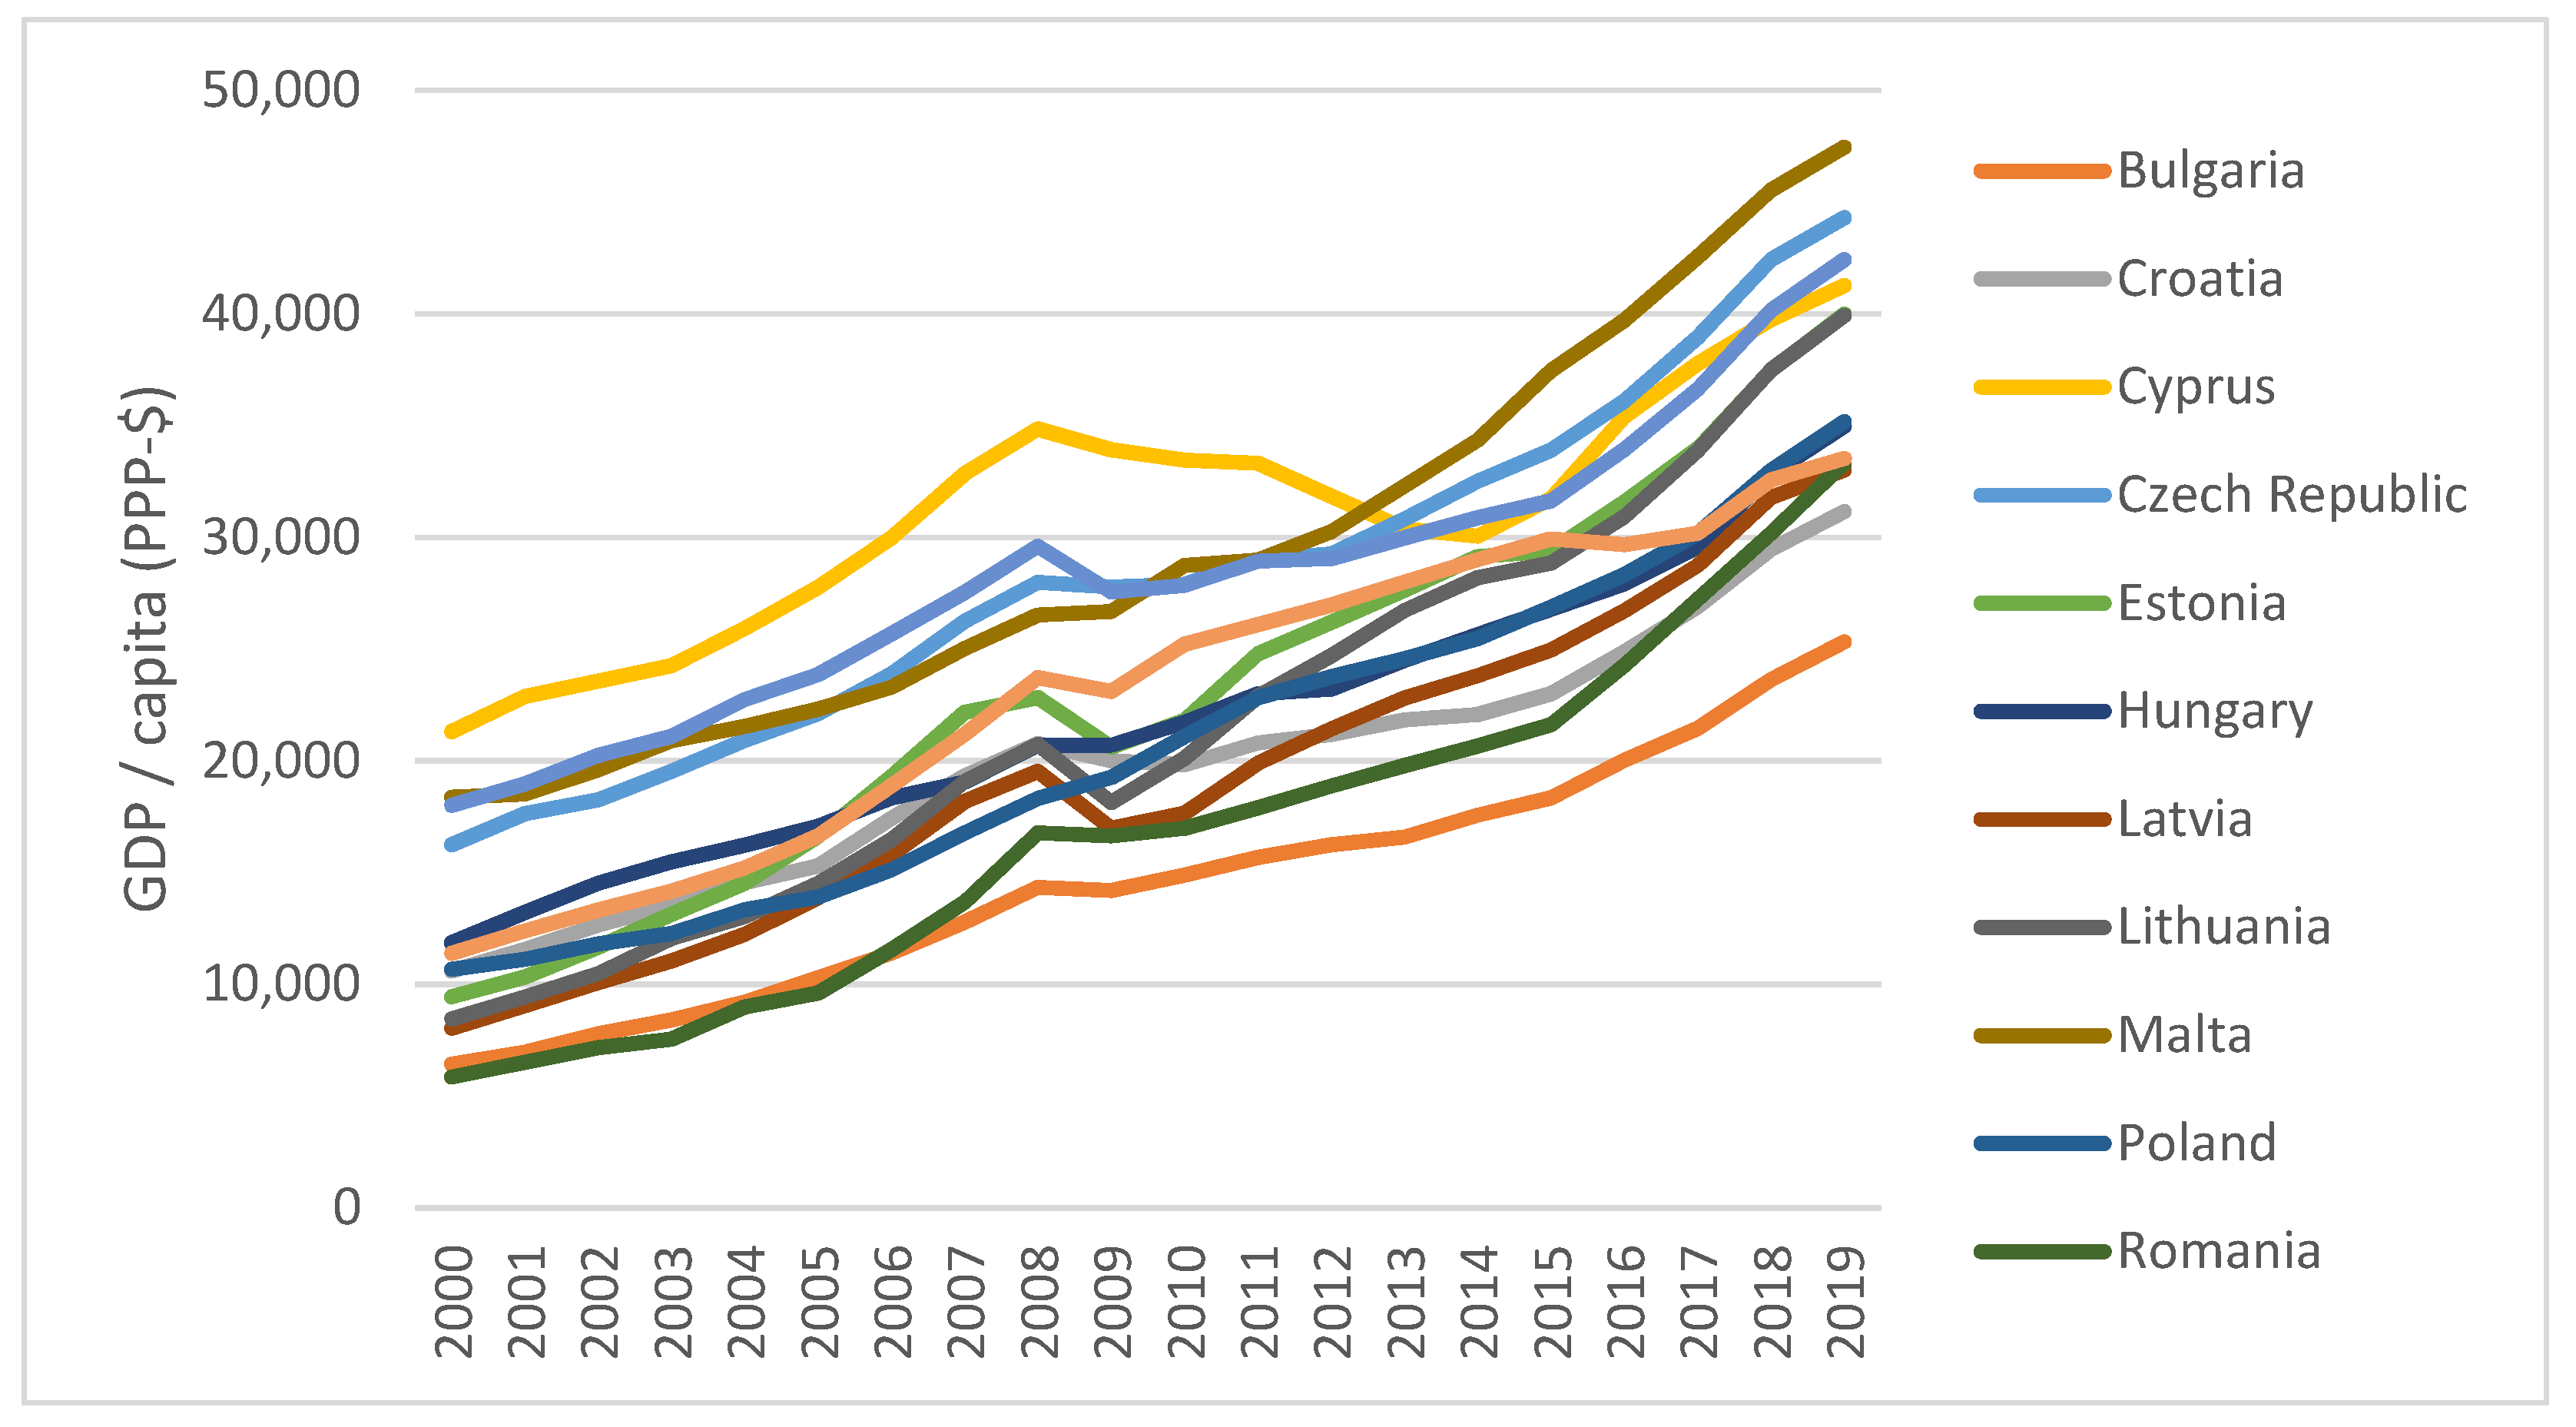
In the period 2000–2019 there is an increasing trend of the GDP/capita indicator for all the 13 European Union countries included in the analysis (
Figure 1).
In 2019, the highest value of this indicator was registered by Malta, and from the EU6 group the best performing country is the Czech Republic. At the opposite pole are Bulgaria and Croatia, two of the countries that have not yet adopted the EUR, with the lowest level of GDP/capita of all analyzed countries.
Next,
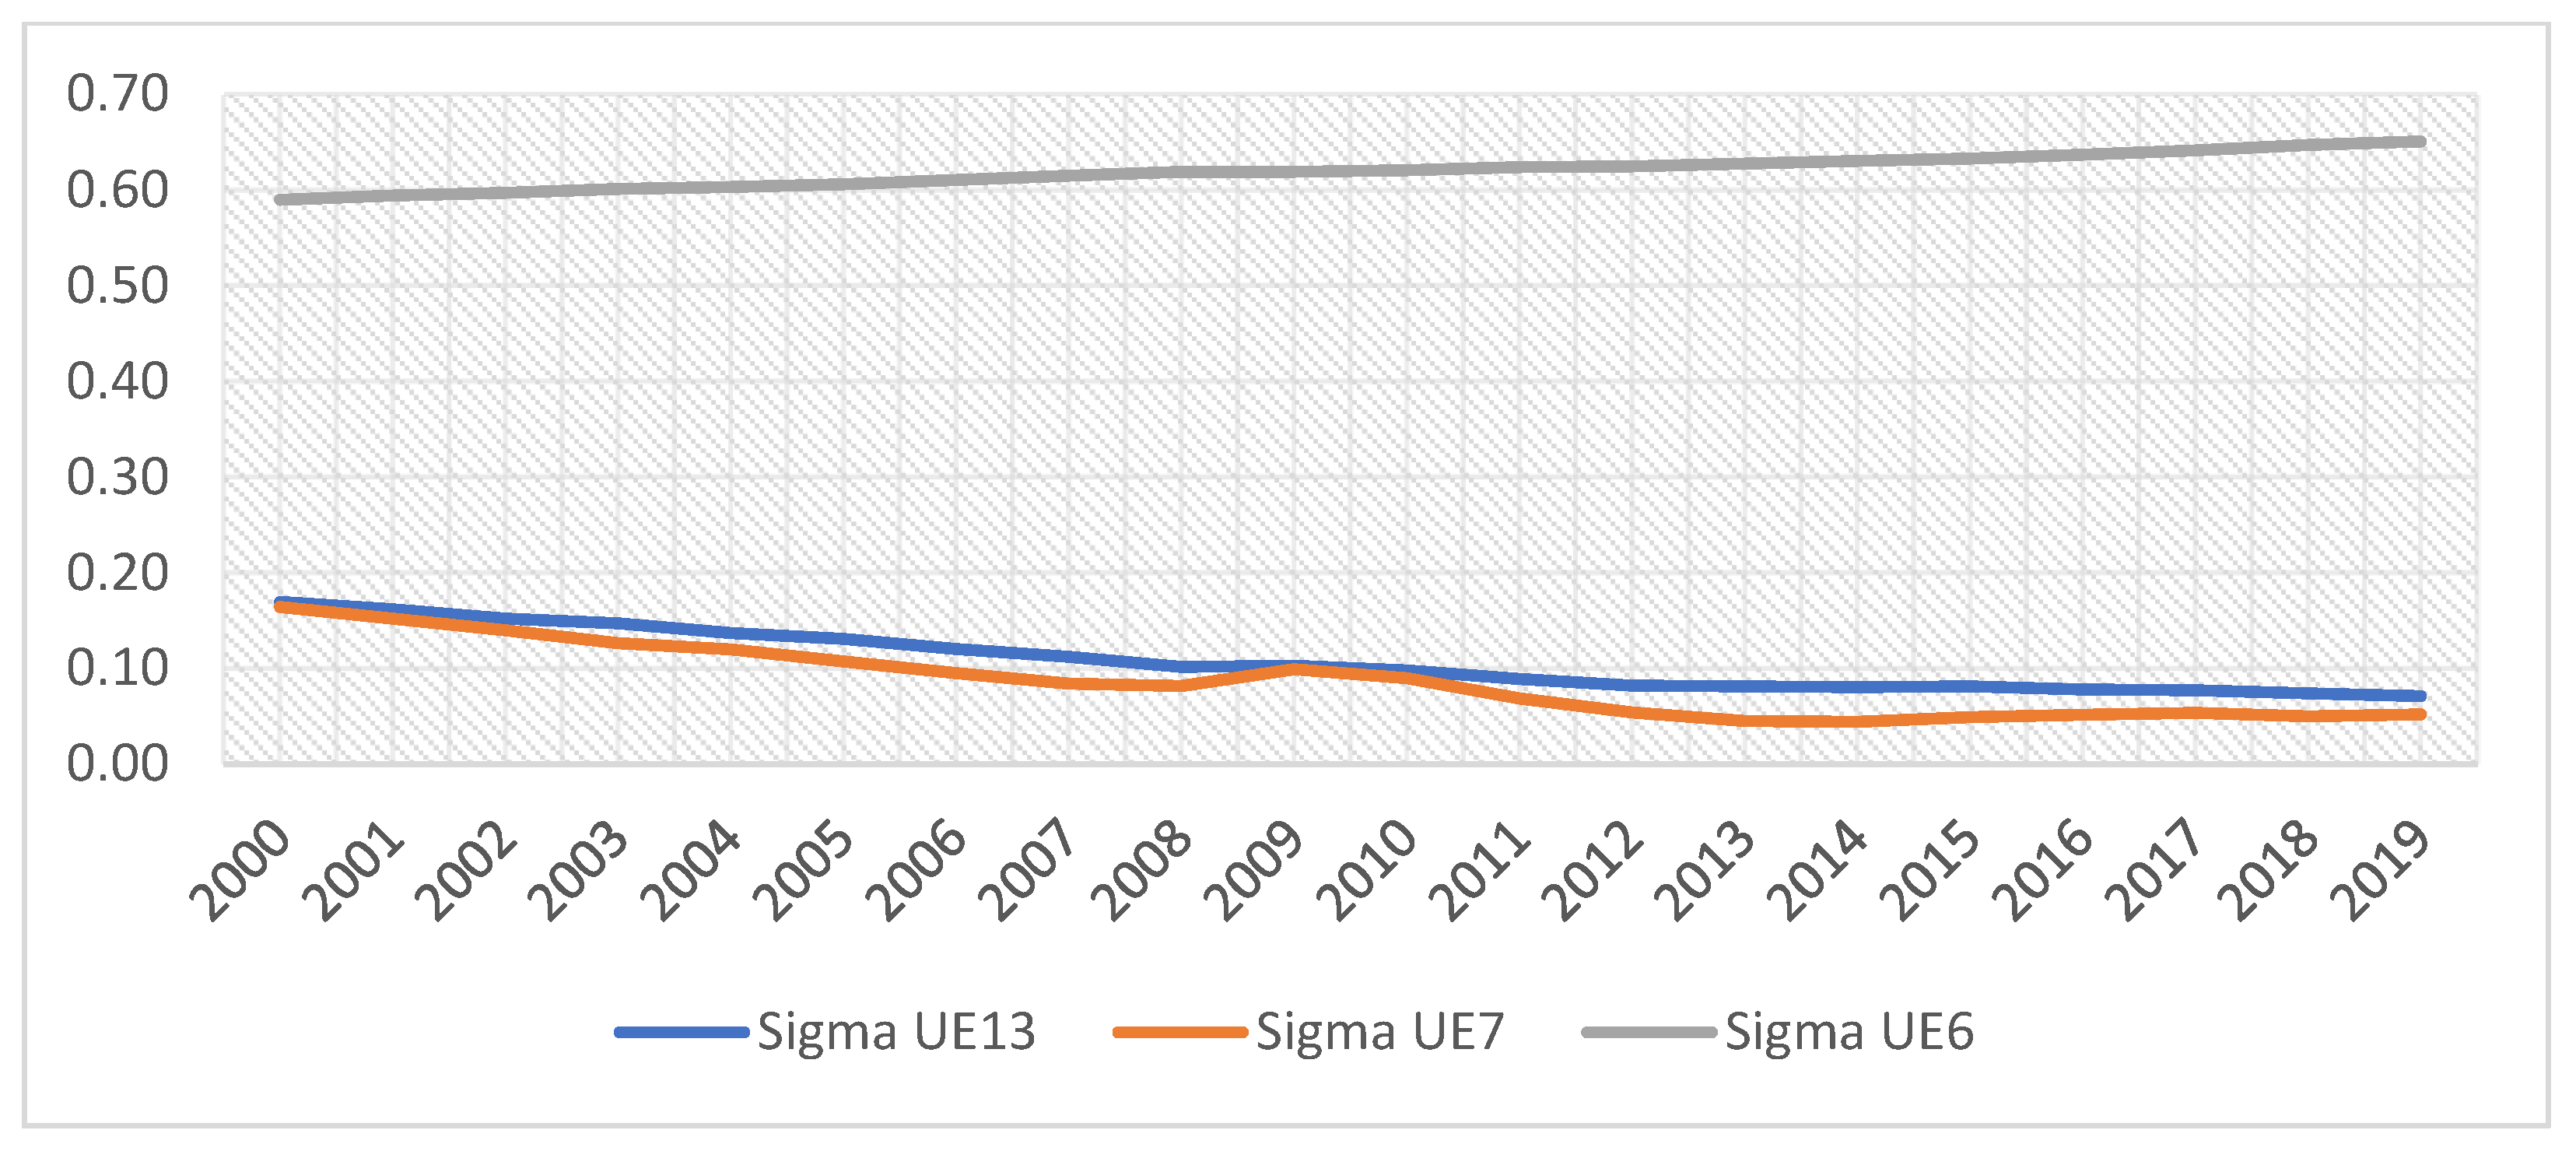
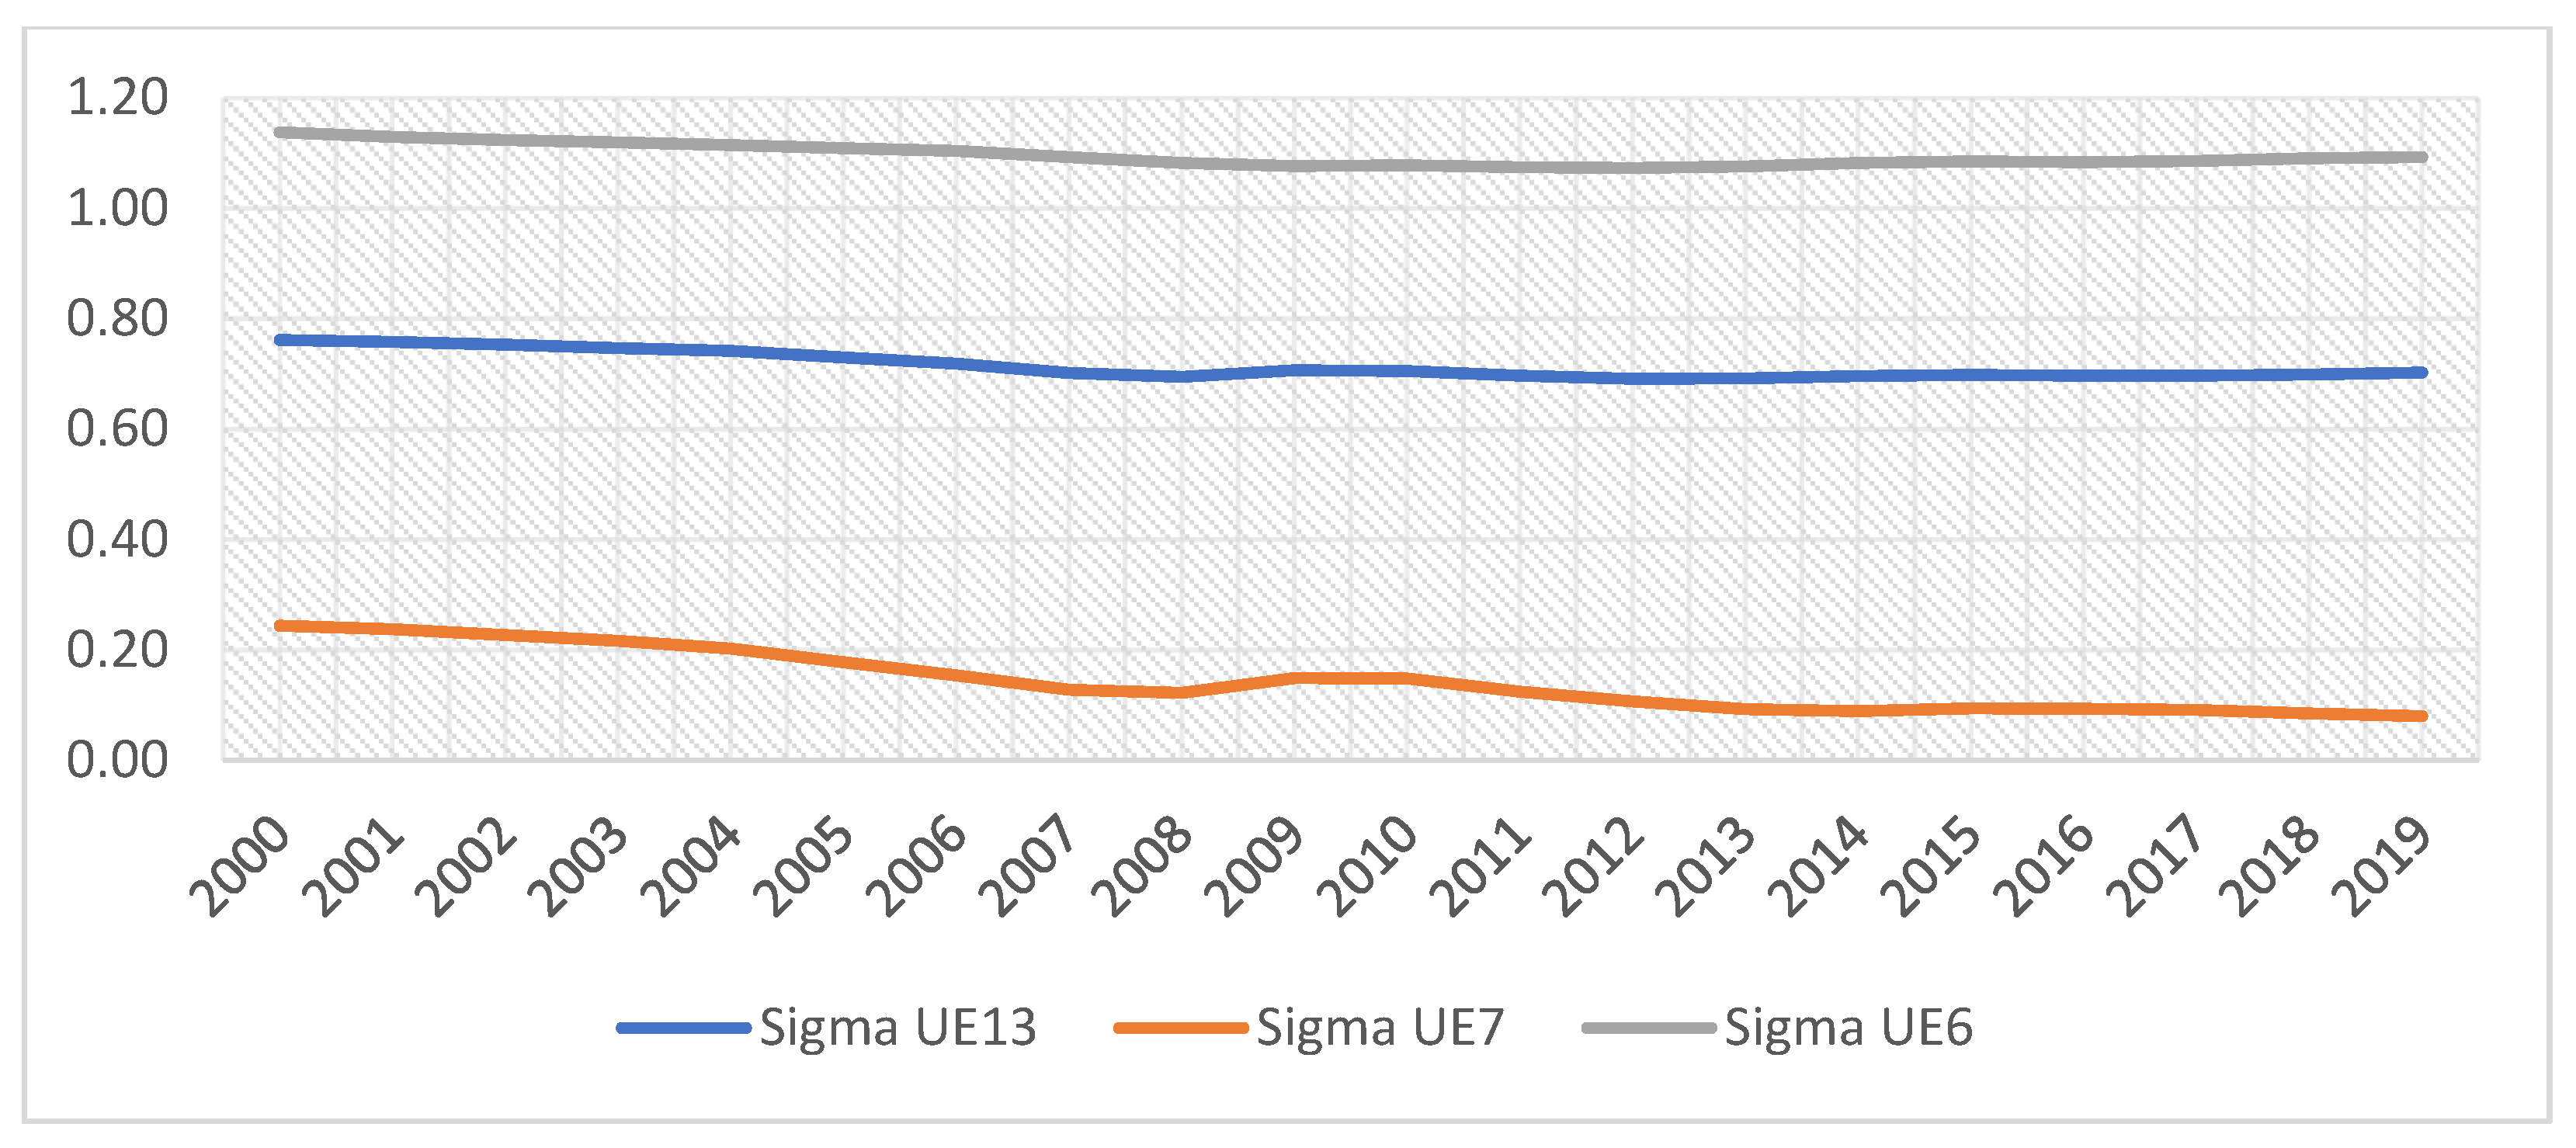
Table 1 presents the results of the Sigma convergence calculation for the three groups of countries: EU13, EU7 and EU6. For a clearer picture, the evolution of the Sigma convergence is also represented graphically in
Figure 2 and
Figure 3.
The results highlighted in
Figure 2 and
Figure 3 show that for both calculation variants there is a downward trend of the Sigma indicator in the case of countries that have adopted the EUR, which indicates that within this group of countries the reduction of income gaps is greater.
This is valid for the entire period, which shows that Euro membership also leads to income convergence. Regarding the situation of the countries that have not adopted the EUR, the Sigma indicator is on an upward trend, which shows that between these economies there is rather an increase in income disparities over time.
At the EU13 aggregate level, the trend towards real convergence is growing, but it is supported by the group of countries that form the EU7.
The Sigma coefficients calculated based on national currency are higher than those calculated based on PPP (especially in the case of EU6), which shows that the degree of convergence between the respective countries, expressed in nominal terms, is lower than that expressed in real terms.
The difference between the values of the Sigma coefficient calculated based on GDP/capita-PPP dollar and the Sigma coefficient calculated based on GDP/capita-LCU also shows that the countries with a lower level of development have undervalued national currencies.
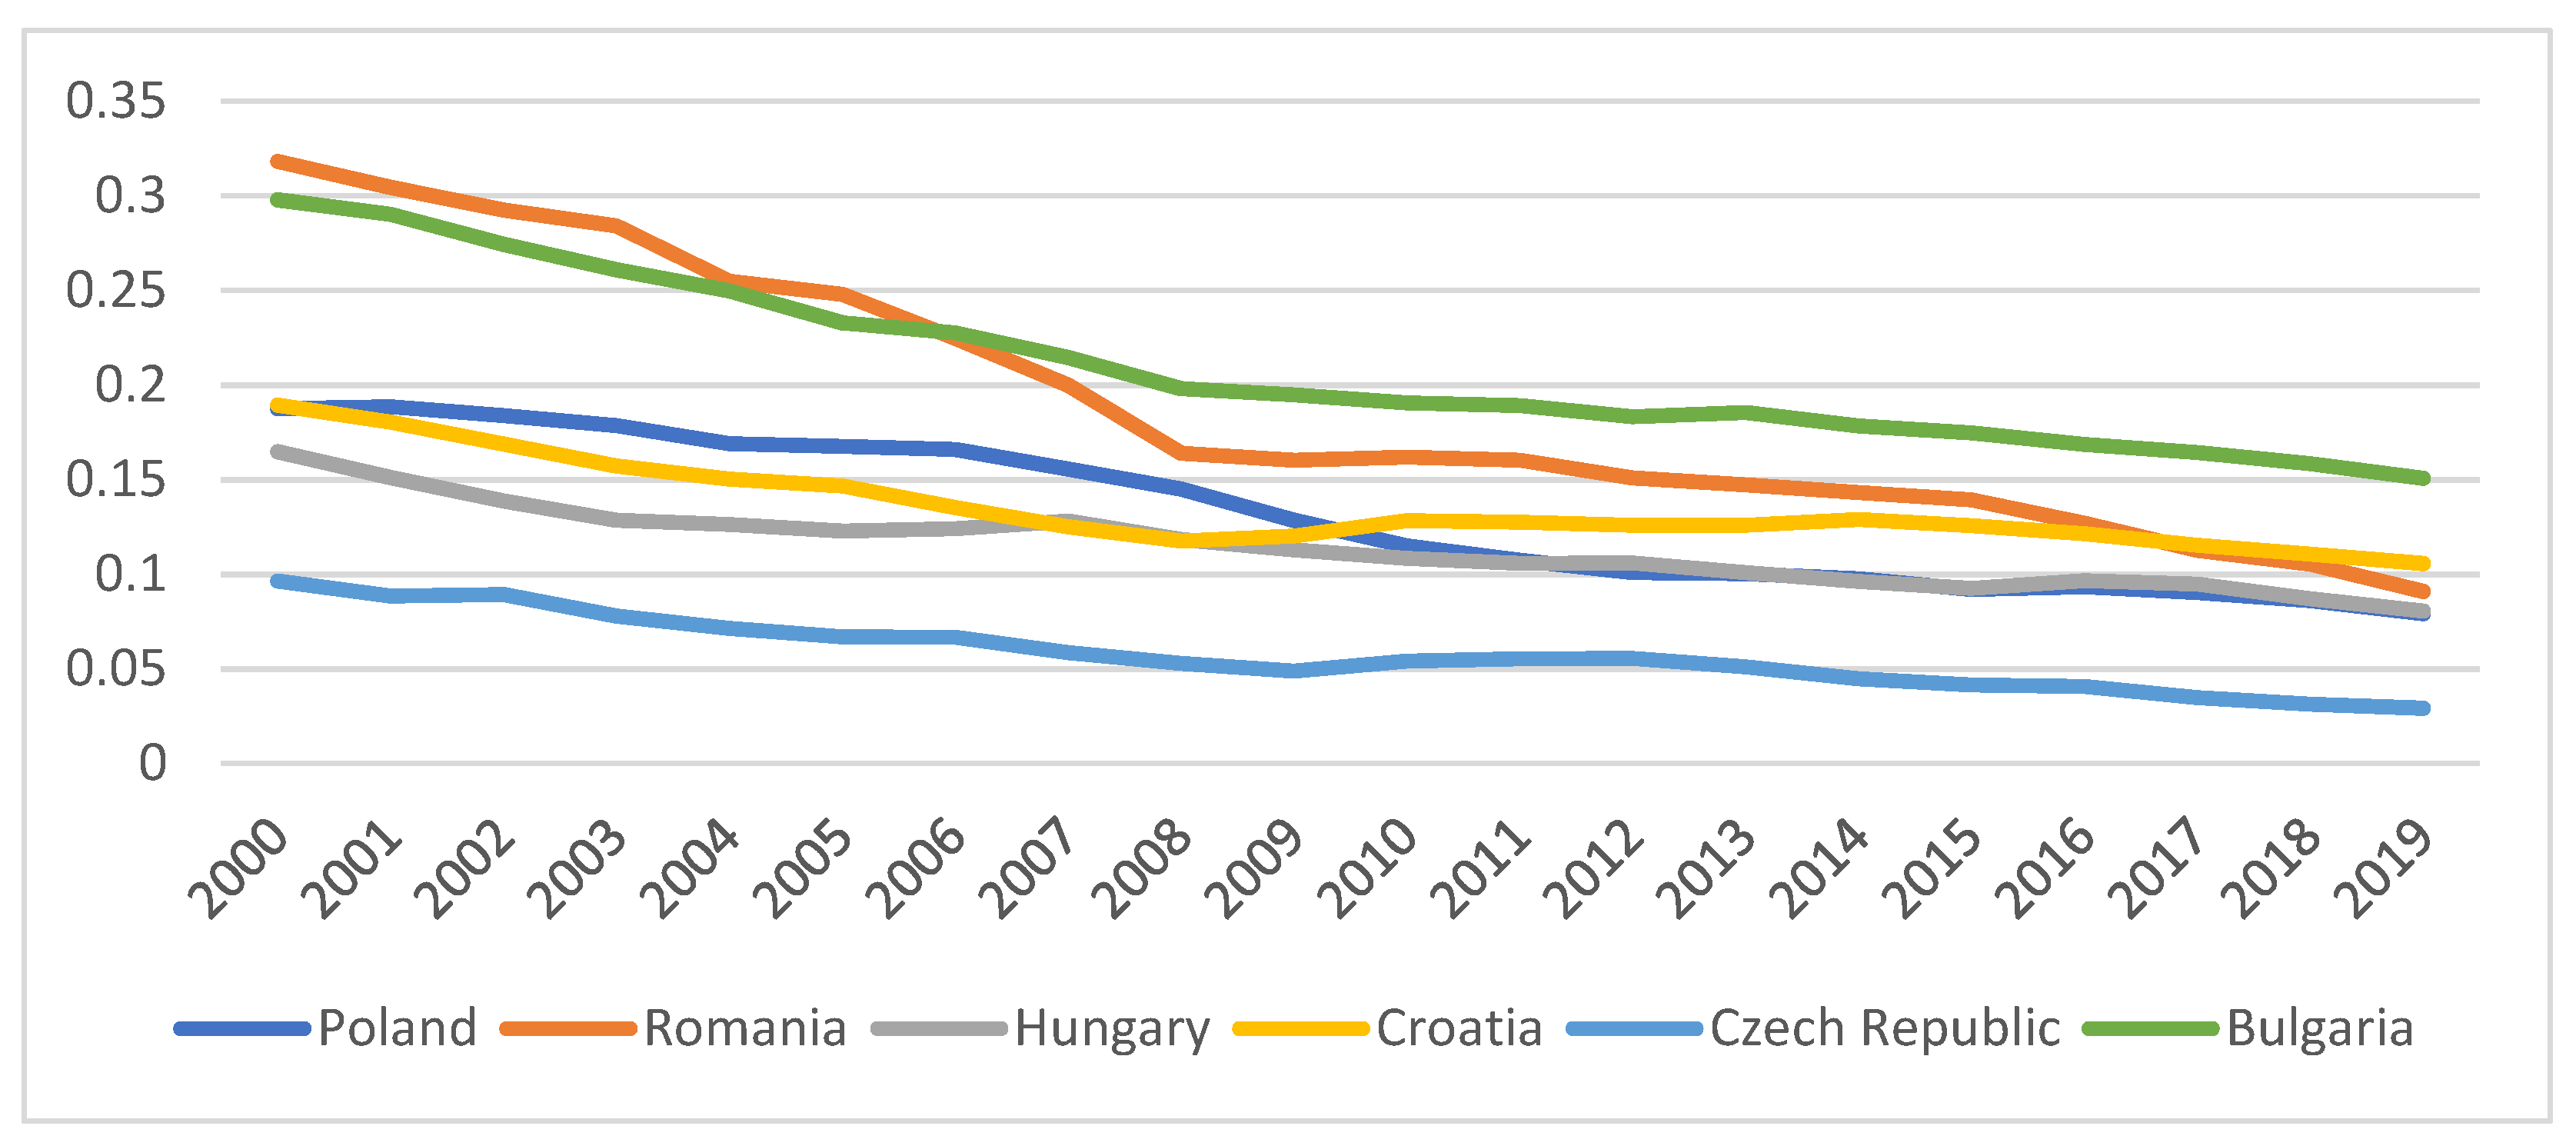
Next, in order to obtain more detailed results on Sigma convergence in the case of the EU6 group, we will analyze the degree of Sigma convergence between each non-Euro Area country and the Euro Area average (
Figure 4).
The results presented in
Figure 4 show that the highest performance in terms of Sigma convergence to the Euro Area is obtained by the Czech Republic, while the country most divergent from the reference area is Bulgaria.
Another important conclusion that can be drawn from this analysis is that all countries that intend to adopt the EUR have a steady reduction in income disparities with the Euro Area, the increasing degree of Sigma convergence suggesting that these countries align their policies to the macroeconomic requirements of the European Union as a pre-accession condition.
Although we have observed a declining Sigma convergence in the EU6 group, the data in
Figure 4 show that these countries are making significant individual progress on Sigma convergence with the Euro Area average. This can be explained by the rather large differences in economic results obtained by the Czech Republic and those obtained by Bulgaria, as well as related to the other countries that have a similar level of income.
From the moment of accession to the European Union and until 2019, Romania, Poland, Hungary and Croatia, the Czech Republic and Bulgaria have constantly reduced their income gaps compared to the Euro Area average, registering a convergent economic growth. The deviations (and therefore the increase in income disparities within the EU6) are being caused by the Czech Republic (higher performance) and Bulgaria (lower performance).
4.2. Beta Convergence
The results obtained after determining the absolute and group Beta convergence are presented in
Table 2.
Negative Beta coefficient for the three groups of countries demonstrates that the newest EU Member Countries recorded absolute and group Beta convergence, most pronounced being in the case of the EU6 group. This shows that within this group there are countries with a faster growth rate of GDP/capita compared to EU7 Member Countries.
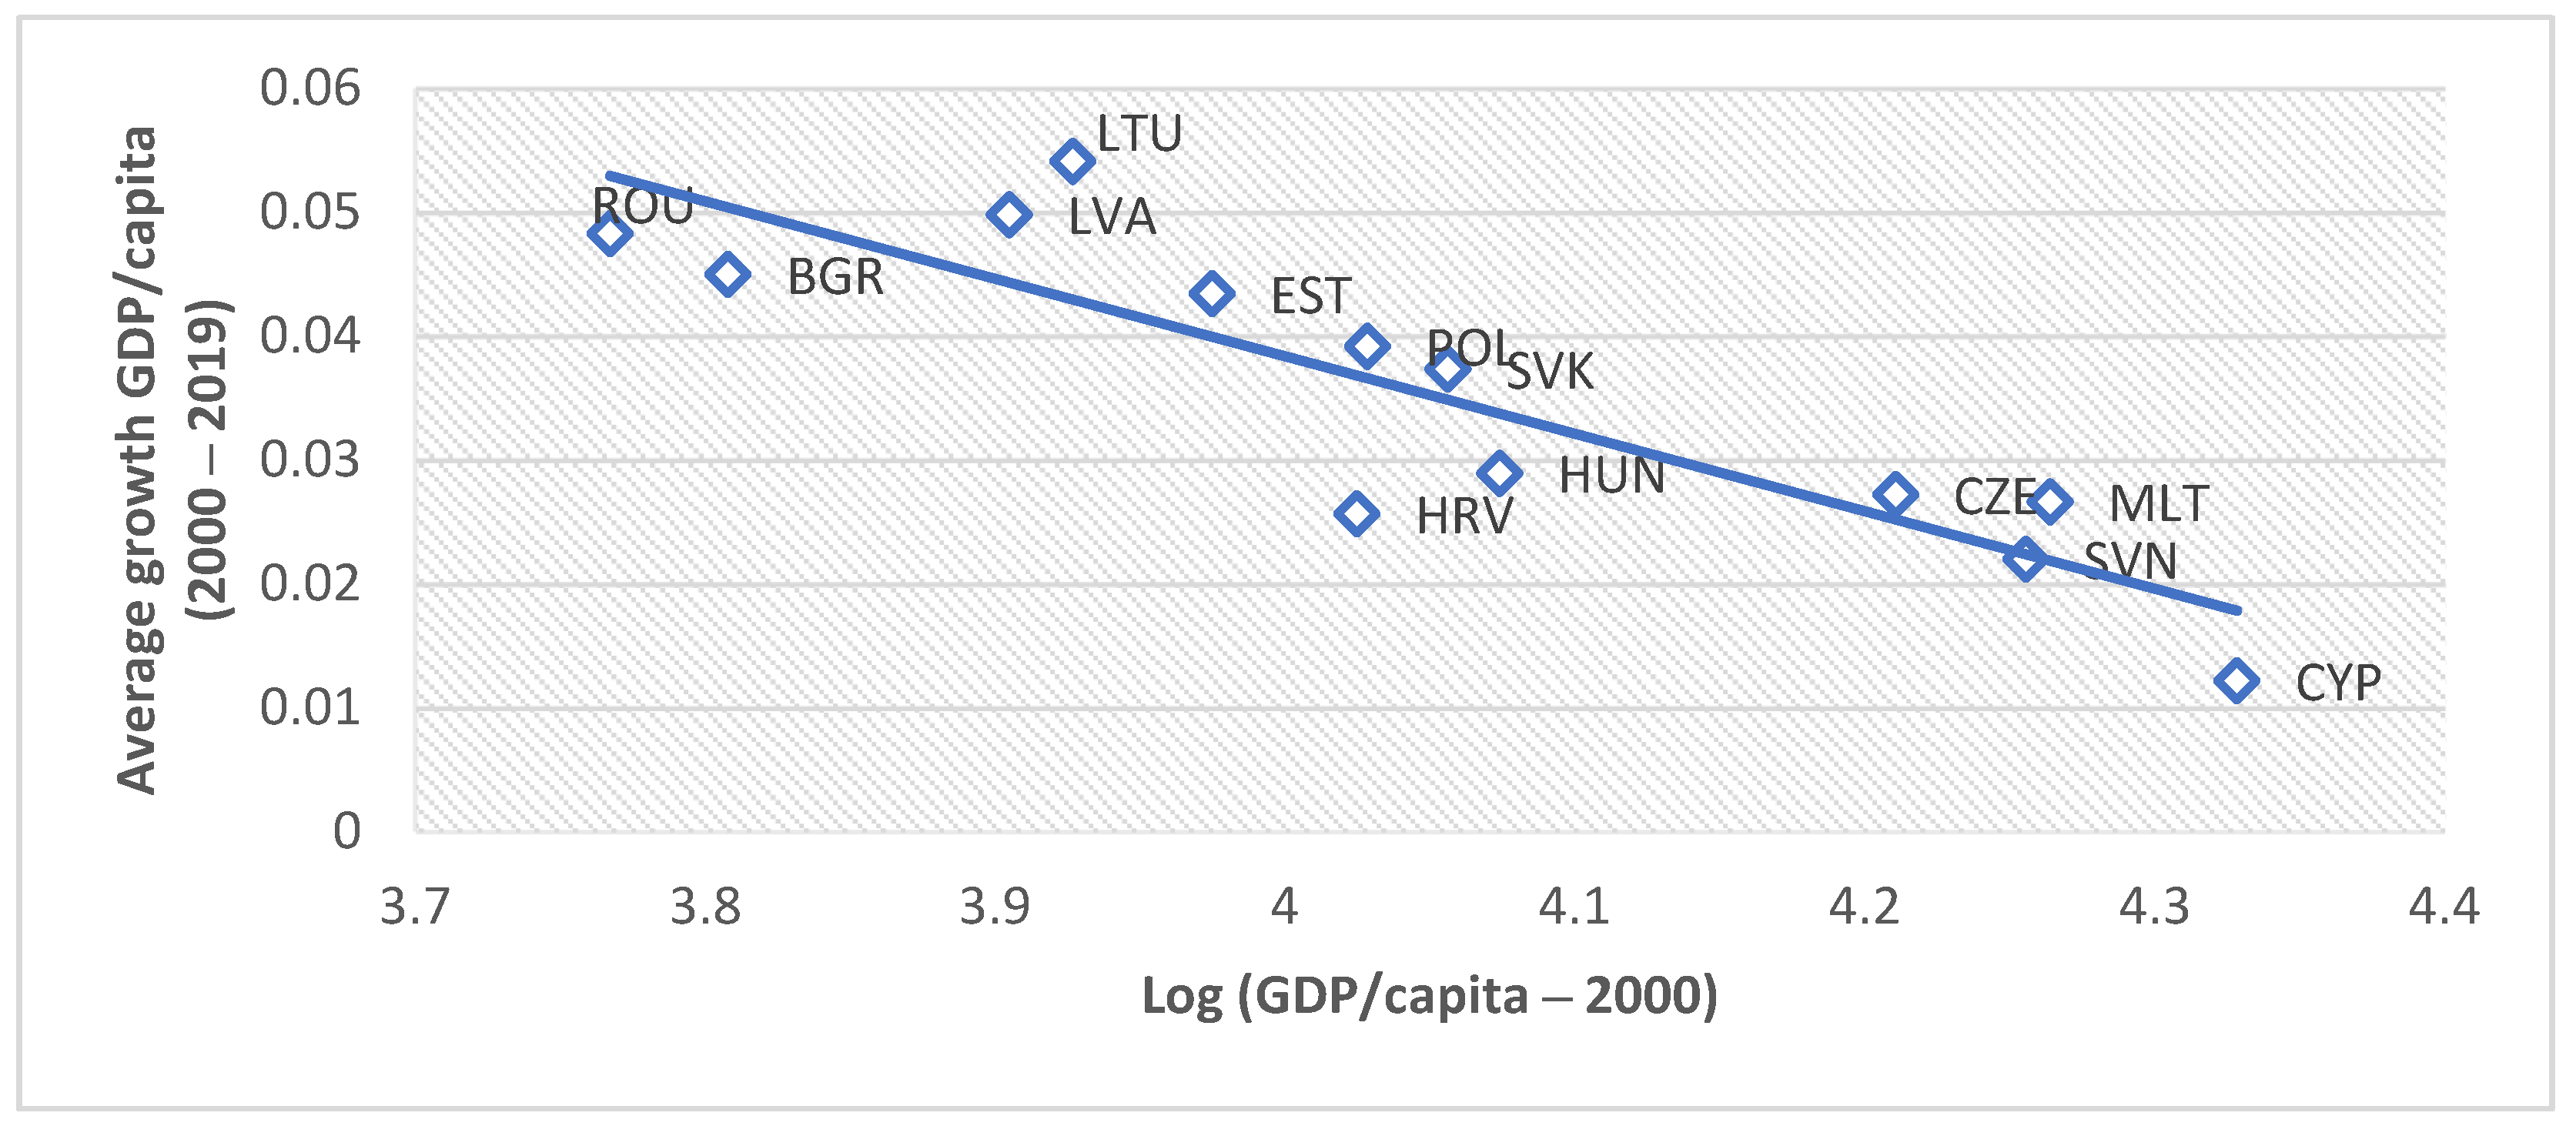
For better visibility of the information, we generated a graph with real values observed in the reference economies (
Figure 5).
As we can see in
Figure 5, the slope of the regression line is negative and therefore we could deduce that between the countries included in the analysis there is Beta convergence in the period 2000–2019.
The positions of certain countries confirm the neoclassical theory, which stands the Beta convergence, meaning that some countries with weak economies at first (baseline year 2000) tend to grow faster than those with more advanced economies. In the reference period, we can observe an increasing growth rate in countries such as Romania and Bulgaria. On the other hand, countries that record a higher economic level in the reference year (2000), such as Cyprus, Slovenia, Malta and the Czech Republic, have a lower rate of economic growth in the period 2000–2019.
These results also confirm the conclusions reached by [
28], which showed that the new EU Member Countries reduce their gaps in terms of income per capita, and the speed with which initially low-income countries develop it is higher compared to initially high-income countries.
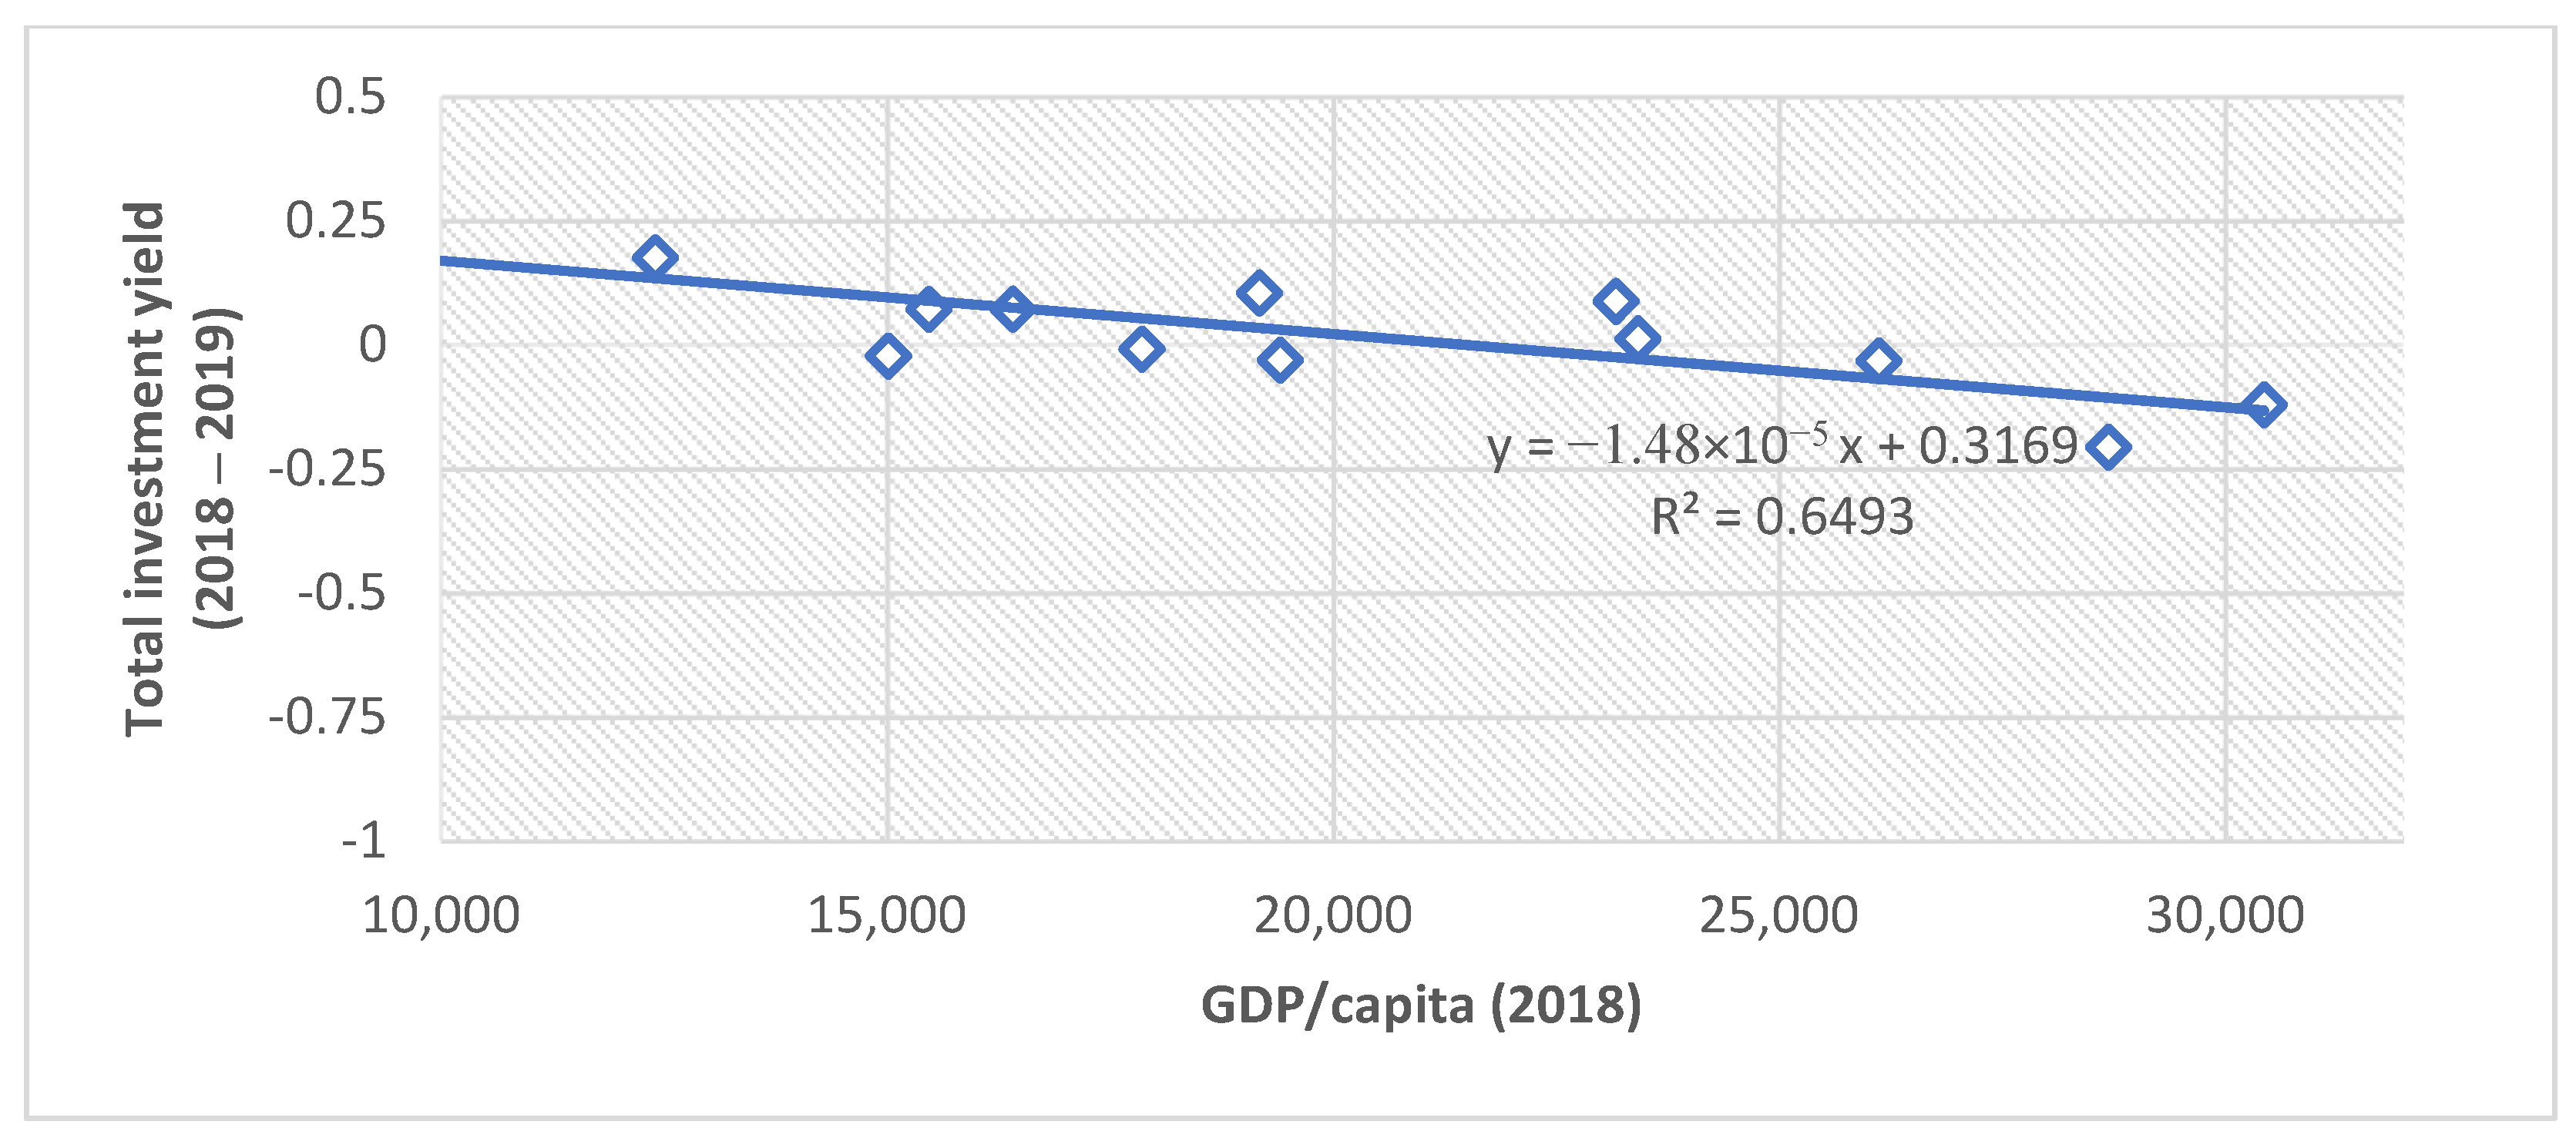
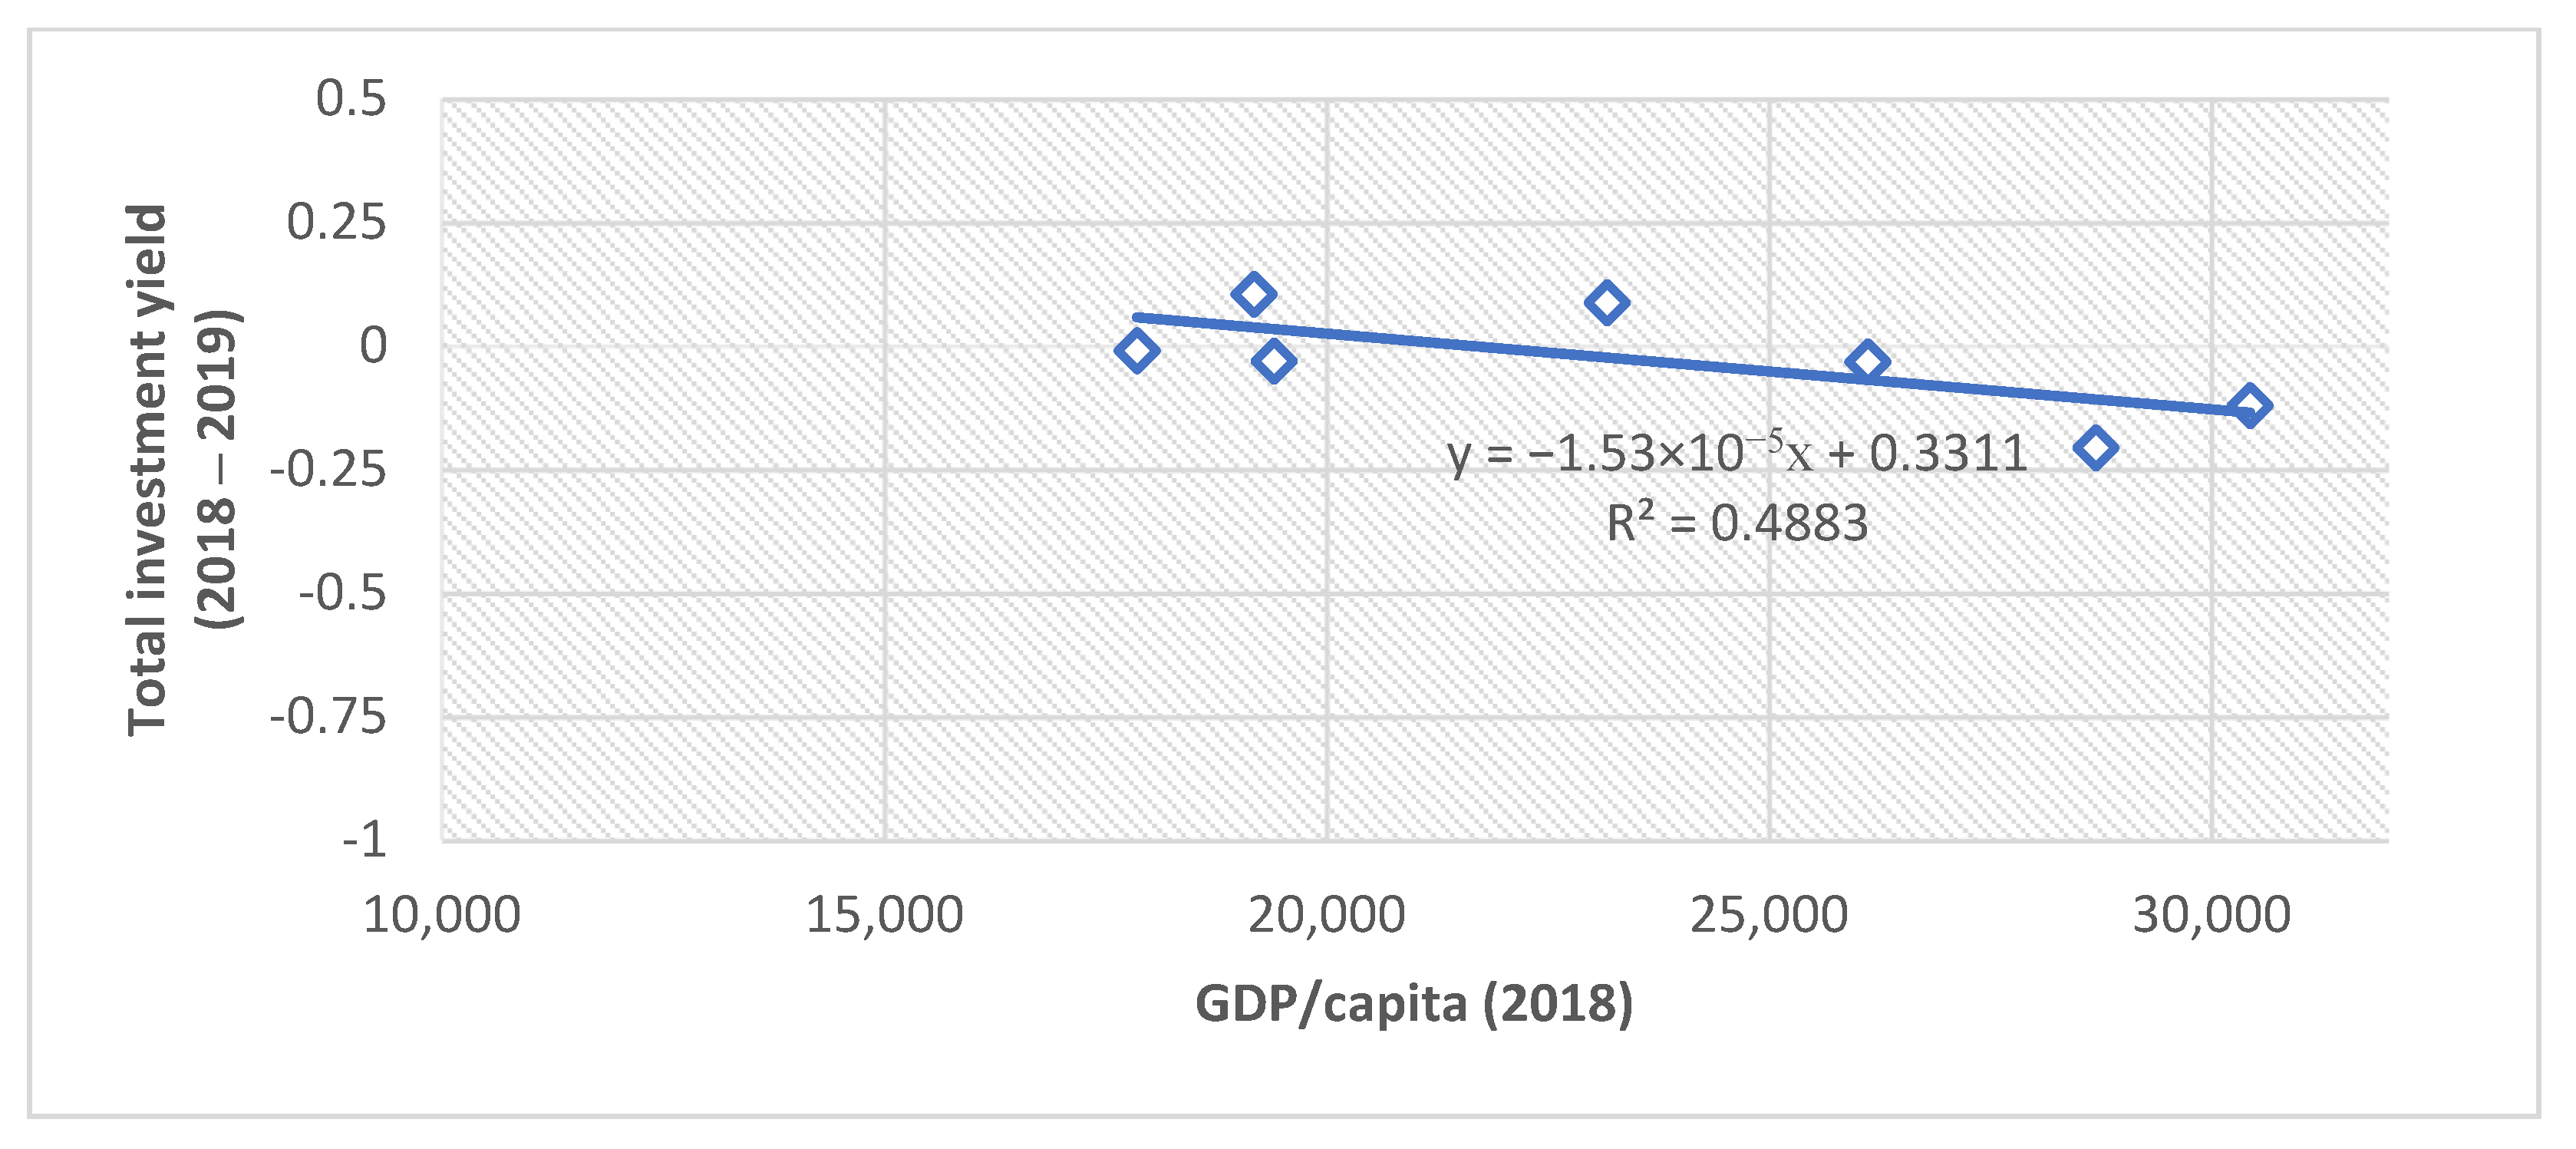
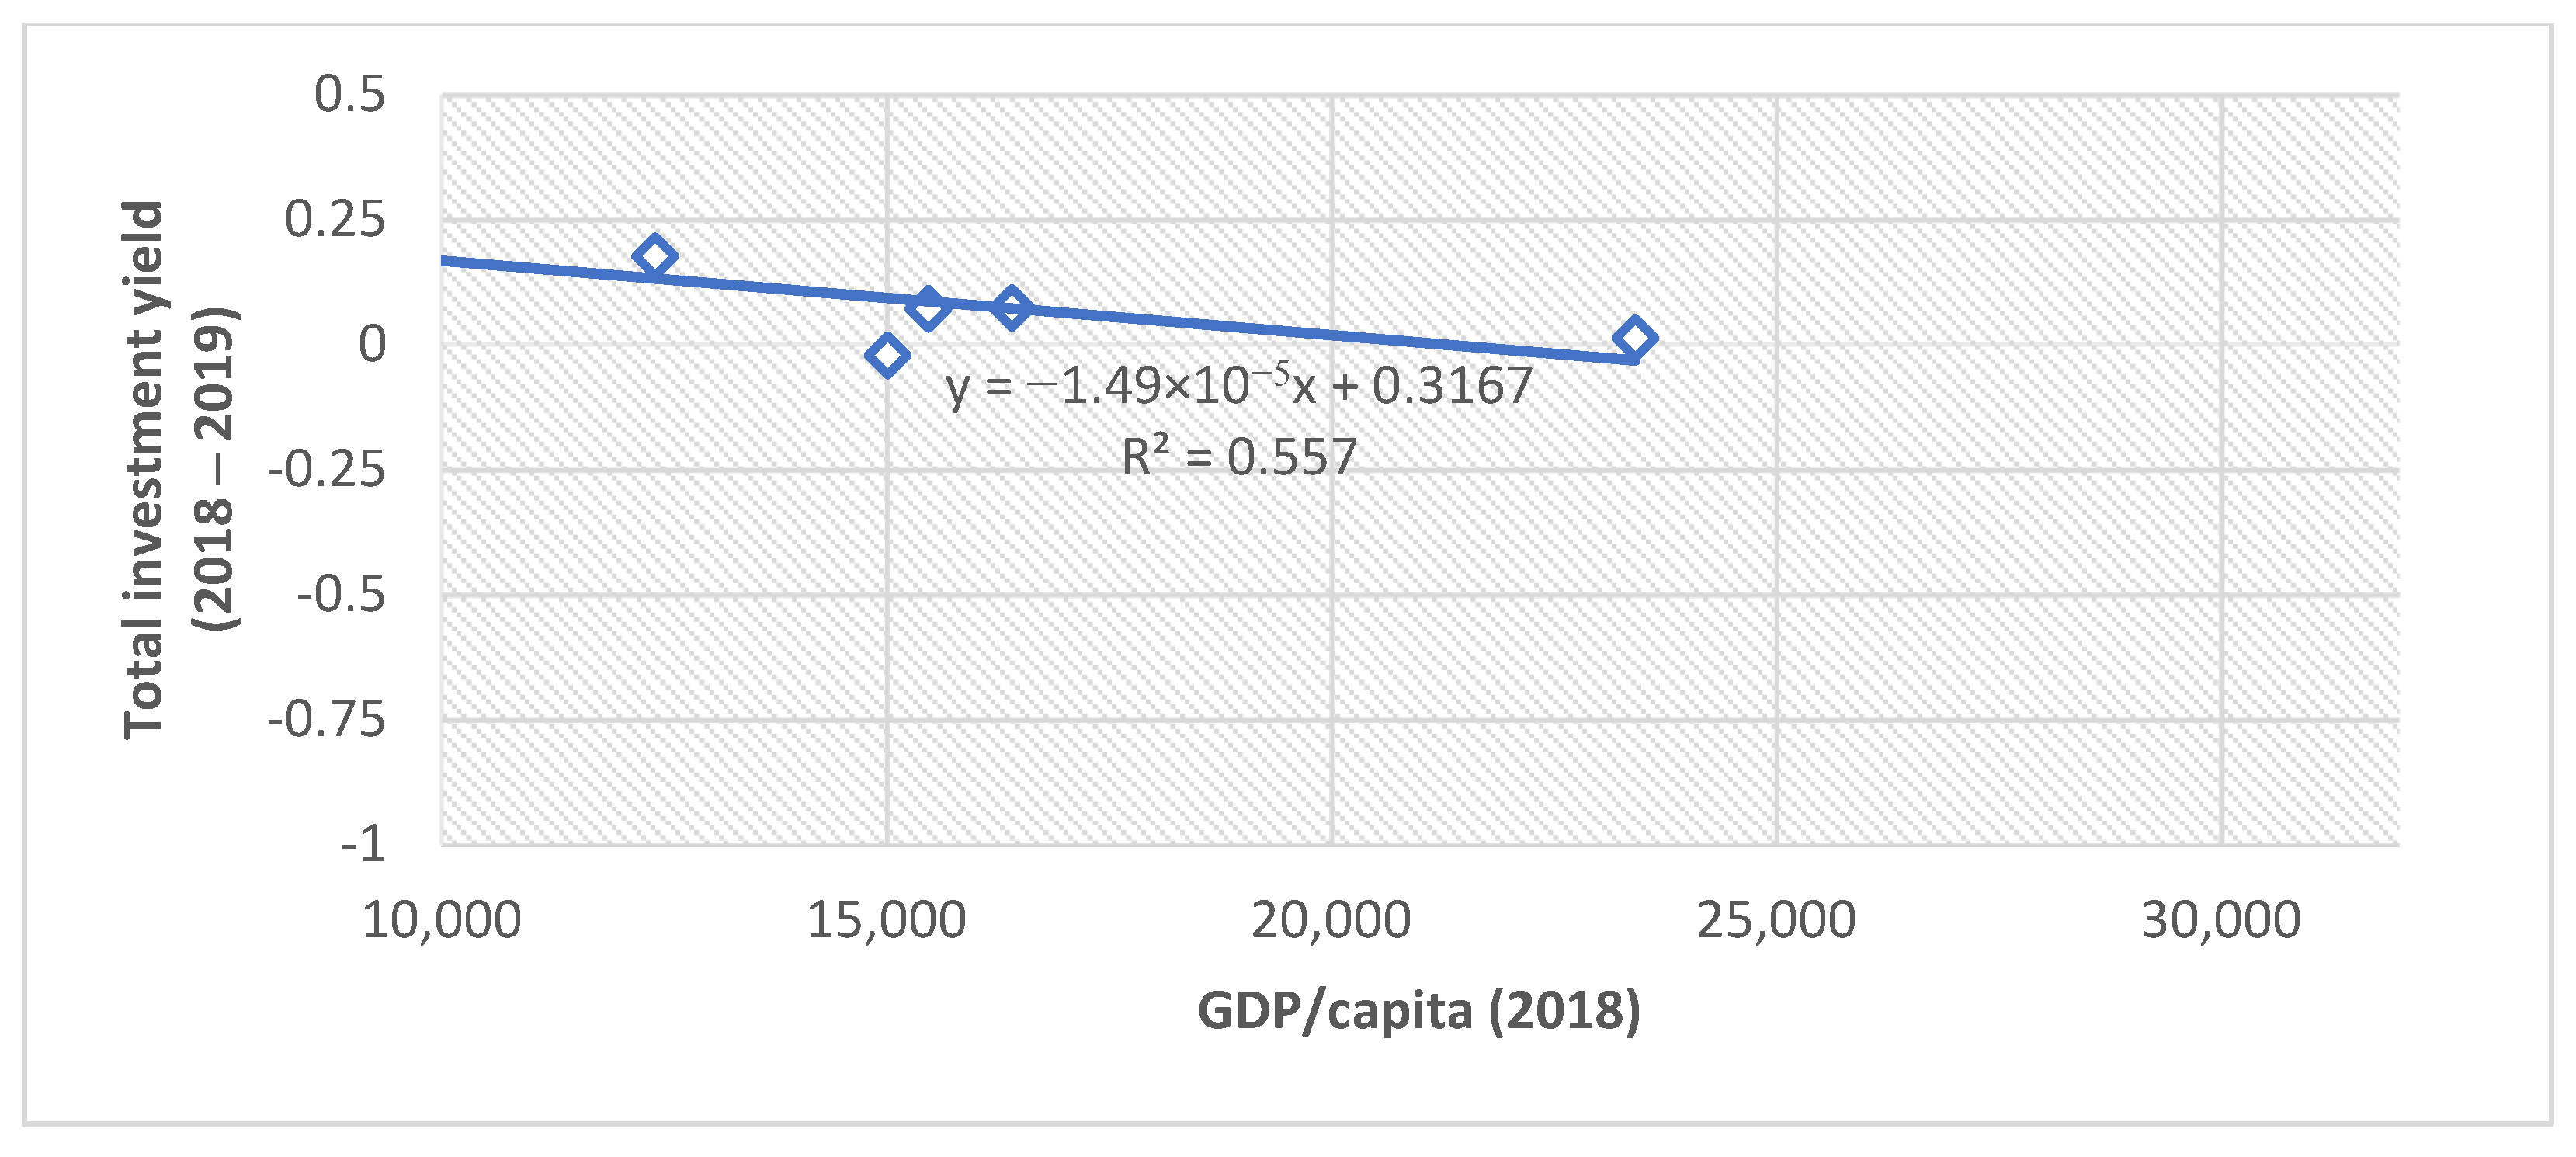
Next, in order to verify the robustness of the results obtained in the case of Beta convergence, we will test the decreasing return on capital hypothesis, based on Equation (4).
The results shown in
Figure 6,
Figure 7 and
Figure 8 show that the hypothesis of decreasing returns on capital is validated in the case of all three groups of countries, which confirms the trend of Beta convergence between the countries included in the analysis.
4.3. Convergence Clusters
Table 3 presents the results obtained after determining the Euclidean distance between the EU countries included in the analysis and the Euro Area average, based on Equations (5)–(7).
In 2019, the largest distance from the Euro Area in terms of real convergence index was recorded by Bulgaria, while the highest performances were obtained by the Czech Republic. We note that the Czech Republic, although not a member of the Euro Area, has managed since 2015 to achieve the strongest real convergence relative to the Euro Area, far surpassing countries that have already adopted the single currency, such as Latvia, Slovakia or Estonia.
Among the non-Euro Area countries, the Czech Republic, Hungary, Poland and Romania follow a downward trend of the Euclidean distance against Euro Area average, which shows us that these countries are making significant progress towards joining the single currency.
The results obtained based on Euclidean distances confirm, on the one hand, the previous results from the Sigma convergence test, and on the other hand show us that in the case of Bulgaria and Croatia, even if there is a constant reduction of income gaps against the Euro Area, the distance from the average of this group of countries is high. This can be explained, at least from the point of view of our analysis, by the low level of GDP/capita of these countries.
Further, in order to identify certain similar characteristics between the EU Member Countries included in the analysis, we will generate the cluster analysis, based on Euclidian distances values, using non-hierarchical clustering algorithms.
Countries are grouped into three clusters in ascending order of performance in terms of real convergence with the Euro Area. Clustering analysis results are presented in
Table 4.
By the division of the EU Member Countries into convergence clusters, as presented in
Table 4, we see that among new EU Member Countries that are not part of the Euro Area, only the Czech Republic has managed to be located in Cluster 3, the best performing countries in almost the entire analyzed period.
The downgrade of many countries in 2010 is explained by the fact that in the period 2008–2013 the economies were affected by the negative consequences of the financial and economic crisis, and the centers moved away from the Euro Area average.
During the entire period, Bulgaria and Romania were ranked in Cluster 1, the lowest performing countries in terms of real convergence index, except for in 2019 when Romania managed to advance to Cluster 2.
Poor performance was also recorded by Croatia, which fluctuated between Cluster 2 and Cluster 1, while Hungary and Poland were permanently ranked in Cluster 2.
Next, to test the representativeness of the cluster analysis results, we applied the log-t methodology. The results of the log-t test are summarized in
Table 5.
The results obtained after applying the log-t test show that the convergence hypothesis is not validated for this group of countries, resulting in that the new EU Member Countries that are not part of the Euro Area do not form a convergence cluster. The log-t test results confirm the other results previously obtained based on Euclidean distances, the Sigma indicator and the k-means method.
Also, these results partially validate the results obtained by [
11,
12] or [
13], which have shown that there is no general convergence at EU level but are clear indications of the future shaping of a convergence cluster.
5. Discussion
The study presents a detailed analysis of the current state of real convergence in the Euro Area of the countries that joined the European Union in 2004, 2007 and 2013.
Our research validates a large part of the results obtained within other similar studies (presented in
Section 2 where we presented a synthesis of the scientific literature). We consider that this part might be a basis for similar research in the future, at least within our team including six PhD candidates.
Our analysis showed, on the one hand, that belonging to the Euro Area is a prerequisite for convergence, competitiveness and sustainability of economic growth and development. Thus we consider that our paper is confirming the fact that once the real convergence is fulfilled by a country or a group (cluster/club) of countries, the countries later register long-term sustainability. On the other hand, we showed the countries that intend to adopt the single currency register a relatively constant rate of reduction income disparities compared to the average rate register within the Euro Area.
As special dedicated research highlighted, the highest performance in this regard is obtained by the Czech Republic, being currently the most prepared to sustainably join the Euro Area, while the lowest performing country is Bulgaria, which, although is making some progress, is not quite well integrated in the convergence processes with the Euro Area. This reality shows that this country joined the EU before creating a truly functional economy and does not even have the necessary resources to face external competitors.
Thus, we consider that Bulgaria, but also the other countries such as Romania, have to adopt efficient and effective economic measures in order to assure the proper prerequisite for a sustainable, competitive economic growth, adapted to the context of a knowledge and innovation-based economy. Some of these measures include increasing labor productivity through local and foreign investments in knowledge, innovation and intangible assets (mostly intellectual capital, the orientation of the production to those European market segments with high quality products, that have high added value).
In this respect, we consider it is important for each EU country to adopt a specific strategy for gradual digitization by involving researchers within interdisciplinary and transdisciplinary teams competent in designing complex projects for the development of innovative solutions. Supporting cooperation and partnership, we consider it is important to create and develop digital platforms that facilitate constructive dialogue in order to implement advanced technologies in most industries. In addition, we consider that there are other important measures such as: fiscal facilities for institutions that invest in new technologies and in the development of employees’ digital skills; progressive expansion of technology hubs; and the involvement of universities in preparing students in accordance with market requirements in line with the transition to Industry 4.0 manifesting as a global trend on the level of social and economic systems. As already specified, such measures have been tested by [
15,
16], authors who showed that innovation, technical knowledge transfer and productivity represent important sources of convergence, competitiveness and sustainability in the process of catching-up for the new EU Member Countries and for the candidate countries.
Also, as [
3] demonstrated, special attention has to be paid to the fact that although there are some reductions in disparities between income levels between countries, there are still large development gaps within countries, and between the level of development of regions and cities, which hinders the process of real sustainable convergence. In this regard, we consider that it is imperative to meet primarily intermediate objectives, such as regional convergence, i.e., measures such as those proposed by us to be oriented towards sustainable and convergent local development of smart cities and regions, economic sectors and cultural-creative communities.
Once these intermediate objectives are met they will be one of the main sources of sustainable, inclusive and long-term competitive economic growth and, ultimately, for fulfilling the goal of real convergence within the Euro Area.
Given the intention of EU countries to catch up to the Euro Area as soon as possible, we can expect that measures and policies supporting innovation, digital and technical progress and intellectual capital development will be intensified and implemented nationally on a larger scale.
6. Conclusions
Through this paper we consider that we have successfully met the set objective by the fact that we have demonstrated the current state of real convergence of the new EU Member Countries. Our research and analysis also provided some solutions we consider to be relevant and important in order to improve performance in terms of competitiveness, sustainability and convergence. The global economy is constantly changing during these turbulent, dynamic and challenging times, primarily characterized by continuous innovation and by the implementation of advanced digital technologies in most economic sectors.
We consider that in order for the countries that intend to adopt the EUR to achieve a sustainable convergence and to really benefit from the advantages of this integration, it is necessary to first create a real functional economy, adapted to the new global trends.
Achieving real convergence today, when we are witnessing a massive 4.0 and 5.0 revolution, is more difficult to reach than in the past, but by gradually adopting measures and strategies such as those proposed by us within this paper, the goal of joining the Euro Area is not impossible.
Sustainability and competitiveness are thus key conditions for both creating benefits for Member Countries and for the stability of the Euro Area as a whole. As we highlighted, even by the chosen title of our paper, real convergence is indeed a precondition for long-term sustainability and competitiveness.


 ,
, 


