

Abstract
In cases of severe injuries or burns, skin grafts (scaffold) are often necessary skin substitutes. To not harm the patient or the donor, research is necessary to search for heterografts, that are formed by biomaterials and are also biodegradable and bioabsorbable to the human body, as is the case with poly (L-lactic acid) - PLA. However, the natural polymers placed on the skin suffer great degradation in media with large amounts of carbon and water, have little durability due to their low ductility. For the proposal, the graphene oxide (GO) nanocharge and pseudoboehmite (PB) were obtained. It is believed that the nanofillers dispersed in the polymer matrix can improve mechanical properties regarding ductility and tenacity, without losing thermal properties. Subsequently, the hybrid nanocharge dispersion methods were employed to obtain in the poly (L-Lactic Acid) (PLA) matrix, forming the material for the desired scaffold. For this research, injectable specimens of pure PLA, PLA structured with GO nanoparticles, and PLA structured with PB nanoparticles, were manufactured. The microstructural and mechanical characterizations were performed on the specimens, to compare the effect generated by the nanocharges on the bulk material. The results showed that the increase in the concentrations of PB and GO nanofillers showed an increase in tenacity and ductility compared to pure PLA, a property that is desired in the scaffold structure.
Export citation and abstract BibTeX RIS

Original content from this work may be used under the terms of the Creative Commons Attribution 4.0 licence. Any further distribution of this work must maintain attribution to the author(s) and the title of the work, journal citation and DOI.
Introduction
About 1 million people suffer burns every year in Brazil (Vasconcelos 2017), and at least 10 to 15% seek medical or hospital assistance due to the severity of the lesion. The solutions to this type of problem can be debridement, washing, and application of dressings, and for most cases that arrive at the hospital, surgeries to insert grafts.
Skin grafts are skin substitutes that can be applied to people who suffer burns and severe skin injuries. Scaffold is a tissue or bone graft ideal for hosting biological components, ensuring its permanence at the site of the lesion, and helping its medicinal action (Santana 2016).
Pseudoboehmite (PB) (AlOOH.xH2O) is an aluminum oxide-hydroxide. Its direct precursor is alumina Al2O3. Its production is conducted with the sol-gel method, which consists of a transition of the solution system, obtained by hydrolysis, and then condensed to a gel system. which is very effective method when dealing with metal oxides, like aluminum chloride or nitrate (Munhoz et al 2007).
Using aged PB provides materials with greater homogeneity in dimensions of the pores and with high reactivity and high specific area (Munhoz et al 2006). Furthermore, PB can be recrystallized in this ceramic format, that is, it can be aged by changing its specific area (Munhoz JR et al 2012). PB has also been used for controlled drug release (Souza 2013).
Biocompatible material is defined as any material or combination of materials, synthetic or natural, that can be applied as part of a human system and that simultaneously treats or replaces any tissue or organ in the body. Bioabsorbable material does not need to be removed after grafting, because the body itself can absorb and dissociate it in the reaction region, avoiding future surgical procedures (Brito et al 2009).
Among non-toxic bioactive materials, biodegradable polymers constitute a family of thermoplastics that present some instability in environments where carbon dioxide, water, and biomass (such as in human tissue) are found, suffering degradation, and showing low tenacity.
The natural polymer poly (L-Lactic Acid) (PLA) can be obtained by fermenting a series of microorganisms and is widely used in scale to synthesize a series of polymers (Ohara, Yakata 1996).
Lactic acid is a chiral molecule with 2 stereoisomers, L- and D- lactic acid (Lasprilla 2011). Due to its carbon chain, it should be a great binder for mixtures with graphene and derivatives. In addition, PLA is classified as non-toxic, bioactive, and biodegradable; therefore, it can be considered an excellent material for scaffold (Lasprilla 2011).
Biocompatible scaffolds, also called artificial skin, artificial bone, or material deposition receptacle, which will be in contact with the skin or bone, can be formed by ceramic materials for example, hydroxyapatite, metallic, such as titanium bone graft (Gonçalves 2012), or by biodegradable polymers, such as chitosan or fibrin (Bhardwaj; Kundu 2011).
In this work, scaffold precursor materials were obtained from composites formed by biodegradable polymers structured with both GO nanoparticles and PB particles.
The main intention is to improve the current scaffolds in terms of mechanical properties, preserving the thermal properties so as not to affect degradation.
The main problems encountered are tissue acceptance by the patient, film breakage due to low ductility, weakness in the placement and extraction technique, among others.
As the evolution of medicine is directly linked to the evolution of engineering, especially materials engineering, it is credible to conceive, develop, process, and characterize technological biomaterials that can serve as scaffolds, as an alternative for some cases of injury.
Resources and methods
Independent syntheses of each of the precursors were carried out, both from PB and GO. In the following items, the specific processes of their syntheses are described, as well as their characterizations to identify and measure their properties. After the description of the precursors, the present research provides the methodology to obtain and characterize the hybrid nanocharge of PB and GO.
Subsequently, the hybrid nanocharge dispersion methods obtained the PLA matrix, forming the material for the desired scaffold. Microstructural and mechanical characterizations complete the methodology used.
A. Materials and process to obtain pseudoboehmite
PB was obtained by the sol-gel process according to Munhoz et al (2006). The first stage of PB synthesis consists in obtaining two precursors, the first being an aqueous solution of aluminum nitrate Al(NO3)3.9H2O and the second an aqueous solution of polyvinyl alcohol (PVAL).
Al(NO3)3.9H2O was solubilized in deionized water in the proportion of 412.5 g of solute to 500 g of solvent. PVAL was also solubilized in deionized water, at a ratio of 21.7 g of solute to 250 g of solvent, forming a viscous gel before reaching its full homogenization.
As the solubilization of both components is not immediate, they were obtained by means of a magnetic stirrer. Each of the flasks, containing their respective reagents and a magnetic bar, were suspended 0.5 cm from a magnetic stirrer, where rotation with a constant angular velocity of 240 rpm was maintained, mixing the components for 30 min
When both processes are completed, the aqueous solution of PVAL is added, pouring it over the aqueous solution of hydrated aluminum nitrate.
The mixture obtained was then dropped (each drop with 0.05 ml) into a beaker previously containing an aqueous solution of ammonia hydroxide (NH4OH) with a concentration of 25–30 m%, obtained with 450 g of ammonia hydroxide in deionized water, kept in a thermostatic bath between −10.0 °C and −7.0 °C. At the end of the addition, with the aid of a pH meter, NH4OH must be added until pH = 9 is reached.
For the second stage, which consists of aging the PB, the solution obtained is placed in a volumetric flask wrapped in a heating mantle, keeping the temperature at 80 °C for approximately 7 days. After aging, recrystallization and fibril formation occur in PB, making the structure more oriented.
B. GO materials and procurement process
Graphene oxide was obtained by two different routes based on the modified Hummers method (1958; apud Ávila et al 2017 and SILVA 2017).
After chemical oxidation of graphite, modifying the hybridization of carbon with oxygenated functional groups. At this stage, there is a reduction in Van der Waals forces between the graphite layers, due to a process of intercalation of molecules and ions between these graphite layers (sp2 carbon planes), causing them to expand, thus making them more susceptible the breakup. After obtaining the graphite oxide, the material uses ultrasound, as the frequency of vibration at powers equal to or greater than 580 W is an efficient sonic agent in the separation of layers already weakened by exfoliation.
In the first route (Route 1), the process of synthesizing GrO-I was based on the Hummers method (Hummers, Ofeman 1958) modified from what is frequently found in the literature, as it is highly successful.
Figure 1 illustrates the synthesis of graphite oxide, a process prior to obtaining Graphene oxide.

Figure 1. Graphite oxide synthesis.
Download figure:
Standard image High-resolution imageFigure 2 shows the synthesis of graphene oxide, from graphite oxide.
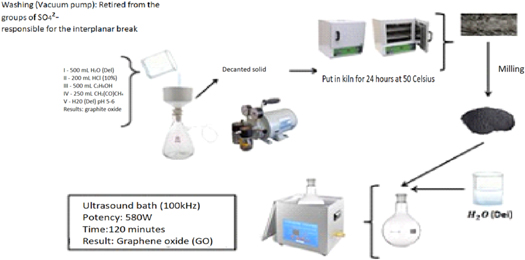
Figure 2. Graphene oxide synthesis, from Graphite oxide.
Download figure:
Standard image High-resolution imageThe process in the second route (Route 2) follows the same procedures as Route 1, except for the synthesis time which was increased to 48 h before the addition of hydrogen peroxide H2O2, in the ratio of 1 ml every 5 s.
Through Route 2, the material exhibited less roughness after drying, more exfoliation with a smoother appearance, and more adherence to the surface of the container.
After obtaining the different synthesized GrO, they were placed in a glass container (watch glass) and dried in an oven at 50 °C for 24 h.
After drying, the materials obtained (GrO-I and GrO-II) were broken up into small flakes with a maximum size of 2 mm and thickness less than or equal to 0.01 mm (flakes with two-dimensional aspects), with the aid of a blender.
Subsequently, dispersions of graphene oxide in water were prepared from the graphite oxides obtained (GrO-I and GrO-II) at a concentration of 1 mg ml−1, with the aid of an ultrasound bath at approximately 100 kHz, at a nominal power of 580 W, for 120 min
The dispersions obtained were brown in color, completely homogeneous and dispersed in deionized water. For further characterization, these were then deposited in drops of 10 μl each on silicon substrates, which were previously cleaned with sulfuric acid/hydrogen peroxide solution (3HSO4:1H2O2 [30%]). From the dispersion at concentration of 1 mg ml−1 of each of the synthesized GOs, new solutions in concentrations of 0.05 were obtained, by dilution, with the aid of volumetric flasks; 0.3; 0.5, 1.0 and 1.5 mg ml−1 GO.
Due to these processes, the GOs dispersed in deionized water: GO-I for dispersion in 24 h and GO-II in a smooth and fine layer for dispersion in 48 h.
C. Obtaining PLA nanocomposites structured with GO or PB
Initially, the PLA in the form of granules was cooled in liquid nitrogen and then ground in a SEIBT® knife mill to make a powder with a maximum diameter of 1.19 mm (granulometry 70 mesh). The powder was kept in sealed polypropylene packages until use.
The nanocomposites were made by pre-mixing the powdered PLA with the respective nanocharge (GO or PB) by employing the rotovaporization process. The process aims to ensure complete homogenization of the PLA polymer matrix and the desired nanocharge.
Subsequently, the mixture obtained was processed by injection, in a Demag Ergotech injector (thread diameter of 25 mm and L/D 20) with heating profile T1 = 160 °C, T2 = 165 °C, T3 = 170 °C, and T4 (injection nozzle) = 180 °C. The other injection parameters are provided in table 1, to obtain the different bodies and test accordance with the respective standards.
Table 1. Parameters of the injection molding process for the tensile, bending, and impact resistance specimens.
| Parameters | Configuration |
|---|---|
| Dosage (mm) | 60 (traction and flexion); 20 (impact) |
| Dosage time (s) | 5 |
| Shear Speed (rpm) | 130 |
| 1st pressure (bar) | 80 |
| Injection Speed (%) | 50 |
| 2nd Pressure—Boost (bar) | 70 |
| Settling Time (s) | 6 |
| Mold cooling time (s) | 16 |
| Mold Temperature ( °C) | 32 |
The specimens used were ASTM type IV. Table 1 indicates the parameters of the injection molding process for the tensile, bending, and impact resistance specimens.
All compositions were previously dehumidified for 24 h at 40 °C in a vacuum oven, before forming by injection. To perform the tests, the specimens were stored for 48 h at an ambient temperature of (23 ± 2 °C) in a desiccator.
D. Injection process to obtain proof test bodies
Mechanical tests are important to analyze properties and compare between pure and structured material with dopants or additives. However, mechanical testing requires a specific specimen standard from the sample that conforms to the specifications of the testing machines.
Each of the bodies (PLA, PLA/GO, PLA/PB) went through the injection process to form the traction and impact bodies.
The specimens for mechanical tests (Izod impact, flexion, and traction) were injection molded, using the Demag Ergotech injection machine (25 mm thread diameter and L/D 20) with heating profile T1 = 160 °C, T2 = 165 °C, T3 = 170 °C, and T4 (injection nozzle) = 180 °C. The other injection parameters are provided in table 2.
Table 2. Compositions of the samples of the PLA/PB/GO nanocomposites obtained.
| Identification | Mass of PLA (g) | Mass of PB (g) | Proportion PB/PLA |
|---|---|---|---|
| 1 | 100.00 | 0 | 0 |
| 2 | 95.70 | 0.30 | 1/299 |
| 3 | 99.50 | 0.50 | 1/199 |
| 4 | 99.00 | 1.00 | 1/99 |
| 5 | 98.50 | 1.50 | 1/66 |
| Identification | Mass of PLA (g) | Mass of GO (g) | Proportion GO/PLA |
| 1 | 100.00 | 0 | 0 |
| 2 | 99.70 | 0.30 | 1/300 |
| 3 | 99.50 | 0.50 | 1/200 |
| 4 | 99.00 | 1.00 | 1/100 |
| 5 | 98.50 | 1.50 | 1/75 |
Source: Author's.
Results and discussion
A. XRD
X-ray diffraction tests were performed for all samples. Figure 3 shows the diffractogram of the graphite sample.
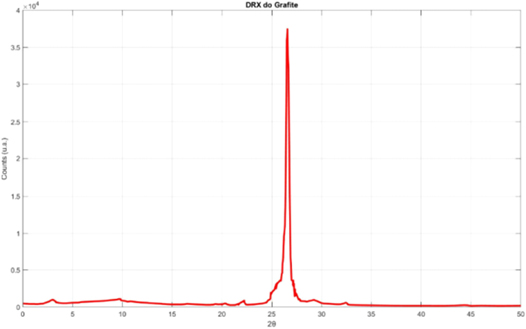
Figure 3. X-ray diffraction curve of the graphite sample used.
Download figure:
Standard image High-resolution imageThe diffractogram of graphite has a characteristic peak at 2θ = 26°, which is in accordance with the literature (Miranda et al 2019; Camargos; Semmer; Silva; 2017).
Figure 4 shows a comparison between the three diffractograms, highlighting the secondary and the GO-II peaks, and indicate the characteristics closest to the commercial GO and the most used GO in academic research (Gascho et al 2019).

Figure 4. Comparative XRD between GO-I and GO-II.
Download figure:
Standard image High-resolution imageWatching the figure 4, the GO-I, which was obtained by oxidation for 24 h, presented identifiable crystalline phases (1, 1, 0) in 2θ = 20° (beyond the expected phase at 2θ = 11°, register too phase), (0, 0, 1) in 2θ = 39°, as prevalent as the phase (0,0,2) at 2θ = 11°, with a relative emphasis on the lower peaks. For the GO-II obtained by oxidation for 48 h, although these phases are present, they are not as accentuated as the phase (0, 0, 2) in the 2θ = 11° section, which characterizes the GO.
Comparing the two XRD, it is observed the presence of some impurity at 2θ = 20°, which presents relative intensity in GO-I, which is not seen in GO-II, which is why this sample was discarded, as no impurities are desired in the scaffold polymer matrix.
GO-II was the chosen route, as it presented the most reliable diffractogram for assembling the final scaffold, and each GO-II sample used for assembling the final nanocomposite, and each GO-II sample used, was characterized by XRD and the average of the samples is present in figure 5.
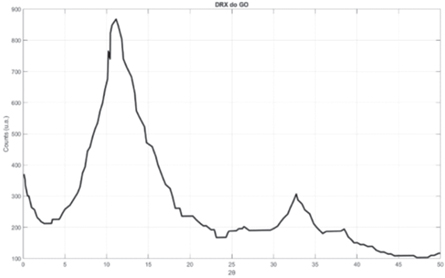
Figure 5. Average XRD of GO-II samples.
Download figure:
Standard image High-resolution imageFigure 5 proposes the average graphic adjustment of all GO-II samples, normalizing the other peaks to show the behavior of the XRD with sampling reliability of γ = 95%.
In figure 6, the red curve which is the graphite diffraction curve has its characteristic peak around 2θ = 26°, (red curve), GO with highlighted intensity 2θ = 11° (black curve) and reduced graphene oxide (rGO) in blue, according to several published works in the literature (Karthikeyan et al 2013, Miranda et al 2019; Some et al Camargos; Semmer; Silva 2017; Mehl et al 2014). An rGO XRD was used only to compare intensities in relation to the GO peaks.
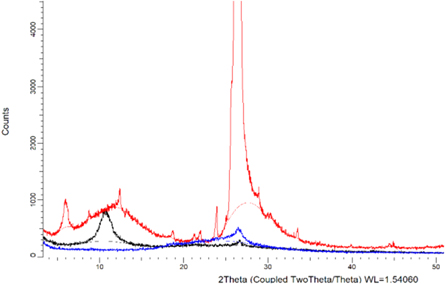
Figure 6. Average diffraction curve of graphite samples in red, GO in black, and rGO in blue.
Download figure:
Standard image High-resolution imageThe results in figure 7 are in accordance with the literature, with the relative intensities of the peaks belonging to the pseudoboehmite (Andrades et al 2015).
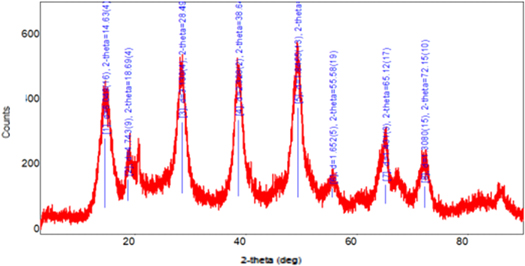
Figure 7. X-ray diffraction curve of PB.
Download figure:
Standard image High-resolution imageThe different peaks of PB give the material a structure with a more ceramic character, which allows it to adhere to the PLA polymer in different ways. The ceramic character must not affect the thermal properties of the polymer.
B. SEM
Scanning electron microscopy was performed on both the GO nanocharge and the PB compound.
All samples visualized by SEM were previously metallized with a thin gold film on the surface of their materials, to aid in the electrical conduction of the electron beam on the sample.
Figure 8 presents an SEM of PB, increased by 2500 × magnification.
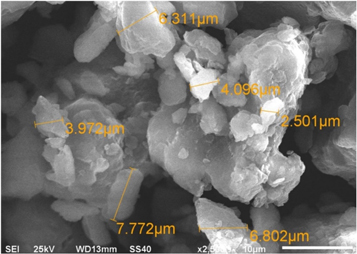
Figure 8. Micrograph obtained for the PB compound with a 2500 × magnification.
Download figure:
Standard image High-resolution imageNote that the average grain contour is approximately sized of 3 μm. However, the ceramic character and the excess of PB phases indicate good reactivity, a fundamental characteristic to bind to PLA polymer.
Figure 9 presents an SEM of GO, increased by 10000× magnification.
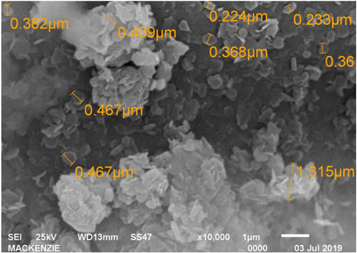
Figure 9. Micrograph obtained for the GO-II nanocharge with an increase of 10000×.
Download figure:
Standard image High-resolution imageIn figure 9, the structure of GO is completely taken up by hexagons. Almost in the entire image, it is possible to observe hexagons formed by of carbon, with an average size of 350 nm.
Although images with greater magnifications were needed, the images with a magnification of 10000×, were the sharpest and, therefore, the most adequate to measure the hexagons (which are carbon structures - GO).
With such small structures, it is assumed that graphene oxide will coat the PLA polymer structure.
Considering that the measurement error is high, in the order of 10−1, the measurement of the edge to the opposite edge in some places reaches 100 nm and may be even smaller.
C. Nanocomposites of PLA/PB and PLA/GO
C1. Impact tests
Table 3 and figure 10 provide the results for the Izod impact test (notched) of the samples in mass percentages obtained with PLA/PB (100.0% PLA/0.0% PB; 99.7% PLA/0.30% PB; 99.5% PLA/0.5% PB; 99.0% PLA/1.0% PB; and 98.5% PLA/1.5% PB).
Table 3. IZOD impact resistance for PLA/PB nanocomposites.
| Sample | Impact resistance (J/m2) | Impact resistance (J/m) |
|---|---|---|
| I (100.0% PLA − 0.0% PB) | 3.73 ± 0.21 | 26.1 ± 1.3 |
| II (99.5% PLA − 0.5% PB) | 3.61 ± 0.22 | 24.1 ± 1.4 |
| III (99.0% PLA − 1.0% PB) | 3.23 ± 0.19 | 21.6 ± 1.1 |
| IV (98.5% PLA − 1.5% PB) | 4.14 ± 0.20 | 28.4 ± 1.4 |
Source: Author's.
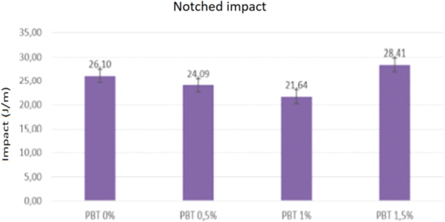
Figure 10. IZOD impact resistance for PLA/PB nanocomposites.
Download figure:
Standard image High-resolution imageThe results obtained evidence that:
The presence of pseudoboehmite in the PLA matrix at concentrations of 0.5 and 1 m% decreases the impact resistance by 7.7 and 17.1%. In these concentrations, the presence of pseudoboehmite may act as a discontinuity of the matrix, decreasing its crystallization. There is no nanostructured PLA with PB particles in the literature.
The presence of pseudoboehmite in the PLA matrix at a concentration of 1.5 m% increases the impact resistance by 8.8%. In this concentration, the pseudoboehmite probably interacts with the polymeric matrix, increasing its crystallization, and these effects overlap with the effects caused by the decrease in molar mass caused by the shear during the processing of the matrix with the load, observed in the other compositions.
New homogenization will be carried out, using ethanol as a solvent, aiming to minimize the hydrolysis of the matrix.
Table 4 and figure 11 present the results for the Izod impact test (without notch) to 15 proof bodies of each samples in mass percentages obtained with PLA/GO (100.0% PLA/0.0% GO; 99.7% PLA-0.3% GO; 99.5% PLA/0.5% GO; 99.0% PLA/1.0% GO and 98.5% PLA/1.5% GO.
Table 4. IZOD impact resistance for PLA/GO nanocomposites.
| Sample | Impact resistance (J/m2) | Impact resistance (J/m) |
|---|---|---|
| I (100.00% PLA − 0.00% GO) | 20.3 ± 1.2 | 205 ± 13 |
| II (99.95% PLA − 0.05% GO) | 35.8 ± 2.2 | 366 ± 23 |
| III (99.90% PLA − 0.10% GO) | 28.0 ± 1.8 | 288 ± 18 |
| IV (99.70% PLA − 0.30% GO) | 21.5 ± 1.5 | 220 ± 18 |
| V (99.50% PLA − 0.50% GO) | 29.1 ± 2.0 | 299 ± 22 |
| VI (99.00% PLA − 1.00% GO) | 20.7 ± 1.2 | 206 ± 14 |
Source: Author's.

Figure 11. IZOD impact resistance for PLA/GO nanocomposites.
Download figure:
Standard image High-resolution imageThe results obtained suggest that the presence of GO in the PLA matrix increases the impact resistance in all studied concentrations.
C2. Tensile tests
Figure 12 shows the average of 25 specimens of each composition, for the tensile test of the PLA/PB nanocomposites. The other compositions did not have enough numbers for statistical comparison. The compositions used in the process were: 100.0% PLA/0.0% PB; 99.5% PLA/0.5% PB; 99.0% PLA/1.0% PB and 98.5% PLA/1.5% PB.
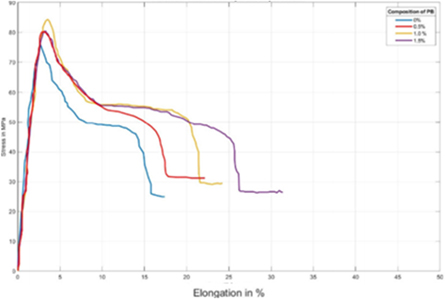
Figure 12. Average results for the tensile test of the PLA/PB nanocomposites obtained.
Download figure:
Standard image High-resolution imageThe tensile strength and the modulus of elasticity under tension increased with increasing concentration of PB in the nanocomposites obtained until the concentration of 1.0% of PB and then decreases.
The presence of PB in nanocomposites increases toughness and ductility as the concentration of PB increases.
Figure 13 provides results for the maximum modulus under traction of the PLA/PB nanocomposites obtained.
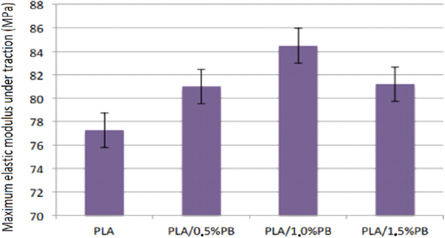
Figure 13. Results for the maximum modulus under traction of the PLA/PB nanocomposites obtained.
Download figure:
Standard image High-resolution imageThe results for the maximum tensile strength of the obtained PLA/PB nanocomposites are in figure 14.
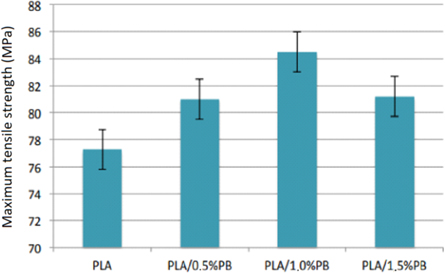
Figure 14. Results for maximum tensile strength of PLA/PB nanocomposites obtained.
Download figure:
Standard image High-resolution imageFigure 15 shows Elongation at the maximum tensile stress of the PLA/PB nanocomposites obtained.
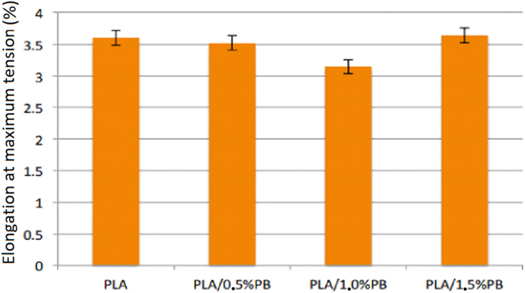
Figure 15. Elongation at maximum tension under traction of the PLA/PB nanocomposites obtained.
Download figure:
Standard image High-resolution imageThe results provide evidence that PB presence in the obtained nanocomposites increases the tensile strength. These increases are from 4.8% to 0.5% of PB, 9.35% to 1.0% of PB, and 5.09% to 1.5% of PB. The tensile strength and the modulus of elasticity under tension increase with increasing concentration of CP in the nanocomposites up to the concentration of 1.0% of CP and then decrease. The presence of PB in nanocomposites increases toughness and ductility as the concentration of PB increases. Elongation at maximum tension decreases with the presence of PB, that is, it deformed less until the flow point.
Figure 16 shows the average of 25 specimens of each composition, for tensile testing of PLA/GO nanocomposites. The other compositions didn't have enough numbers for statistical comparison. The compositions used in the process were: 100.0% PLA/0.0% GO; 99.7% PLA/0.3% GO; 99.5% PLA/0.5% GO and 99.0% PLA/1.0% GO.
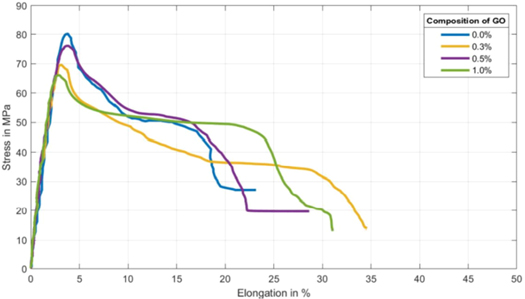
Figure 16. Average results for the tensile test of the PLA/GO nanocomposites obtained.
Download figure:
Standard image High-resolution imageThe presence of GO in the nanocomposites obtained reduces the modulus of elasticity under traction at concentrations of 0.3 and 0.5% of GO. At the concentration of 1.0% of GO, the presence of the nanocharge, practically, does not interfere in the elastic modulus under tension.
Results for the maximum modulus under traction of the PLA/GO nanocomposites obtained are in figure 17.

Figure 17. Results for the maximum modulus under traction of the PLA/GO nanocomposites obtained.
Download figure:
Standard image High-resolution imageFigure 18 provides the results for the maximum tensile strength of the PLA/GO nanocomposites.
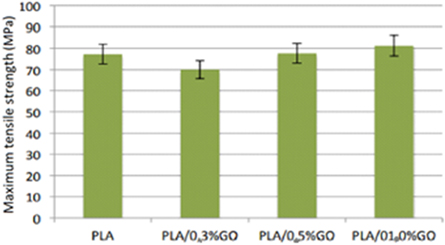
Figure 18. Results for maximum tensile strength of PLA/GO nanocomposites obtained.
Download figure:
Standard image High-resolution imageFigure 19 illustrates Elongation at maximum tension under traction of the synthesized PLA/GO nanocomposites.

Figure 19. Elongation at maximum tension under traction of the obtained PLA/GO nanocomposites.
Download figure:
Standard image High-resolution image
The results of GO indicate that the GO presence in the obtained nanocomposites reduces the modulus of elasticity under traction at concentrations of 0.3 and 0.5% GO. At the concentration of 1.0% GO, the presence of the nanocharge, practically, does not interfere in the modulus of elasticity under traction. The tensile strength increases with increased GO concentration in the nanocomposites. The presence of GO in the nanocomposites reduces the tensile strength at the concentration of 0.3% GO by 9.42%, when compared to the tensile strength of pure PLA. The GO in this concentration may act as a discontinuity in the polymeric matrix. For concentrations of 0.5 and 1.0% GO in the nanocomposites, an increase in tensile strength of 0.47% and 5.08% occurs, respectively. When comparing the elongation at the maximum tension of pure PLA with the nanocomposites containing GO, the presence of GO decreases the elongation. The higher the concentration of GO in the nanocomposites, the greater the elongation at maximum tension. Therefore, the presence of GO in the nanocomposites increases the ductility of the obtained nanocomposites, as the presence of GO causes the greatest elongation (21.6%) before rupture under tension.
The tensile strength increases with the increased GO concentration in the synthesized nanocomposites. Probably, the presence of GO increases the crystallinity of the PLA.
The presence of GO in the obtained nanocomposites decreases the tensile strength in the concentration of 0.3% of GO by 9.42%, when compared to the tensile strength of pure PLA. The GO in this concentration may act as a discontinuity in the polymeric matrix.
For concentrations with 1.0% GO in the nanocomposites, an increase in tensile strength of 5.08% occurs.
When comparing the elongation at maximum tension of pure PLA with the nanocomposites obtained containing GO, the presence of GO decreases the elongation.
Finally, the higher the concentration of GO in the nanocomposites, the greater the elongation at maximum tension. Therefore, the presence of GO in the nanocomposites increases the ductility of the obtained nanocomposites, in that the presence of GO causes the greatest elongation (21.6%) before rupture under tension.
In view of the relevance of the theme, additional research is necessary, for better advances.
Both nanocharges significantly improved the mechanical properties when structured in the PLA, increasing their levels of ductility, with GO providing a little more tenacity. Therefore, graphene oxide is indicated, not only for the result mentioned, but also due to its more accessible cost than PB.
Conclusions
Both charges significantly increased the mechanical properties of ductility and tenacity in relation to pure PLA, as shown in the stress-strain diagram observed in figures 12 and 16, important characteristics in making a scaffold.
As for the impact resistance test, a higher concentration of PB (1.5% mass) indicates an increase of approximately 10% in impact resistance, differently of GO, which in much lower concentrations already provides 79% increases for bodies with 0.05% GO mass and 41% for bodies with 0.1% GO mass in impact strength. However, as the concentration of GO increases, the impact resistance decreases and tends to the resistance of pure PLA, as the excess of GO loses its structuring function in the chiral molecule and weakens the polymer chain.
PB, when dosed at 1% of mass, increases the maximum tensile strength and the maximum modulus under tension by 10%, and maintains the elongation at the maximum tension under tension. The GO at the same dosage did not show significant increase or decrease in maximum tensile strength and maximum modulus under tensile and positively reduced the elongation at maximum tensile stress, which is of great value for scaffolding.
In comparison, the structuring GO ends up being superior to PB in impact resistance, because in smaller quantities, it causes a good increase in strength and reduces the elongation to submitted stresses, in addition to the manufacturing cost being lower than that of BP. In terms of ductility, tenacity, and tensile strength, both were more efficient than pure PLA, but with similar results.
Data availability statement
The data that support the findings of this study are available upon reasonable request from the authors.
Novelty statement
A scaffold is a preliminary structure for the composition of the tissue graft, hosting biological components, ensuring its permanence at the site of the lesion, helping its medicinal action, and as an alternative for some injury cases. Search to obtaining scaffolds from nanocomposites of PLA biodegradable polymers containing graphene oxide nanoparticles or pseudoboehmite compound aiming at increasing the mechanical properties, such as ductility and tenacity.