Development of Framework for Estimating Fatality-Related Losses in the Korean Construction Industry


Abstract
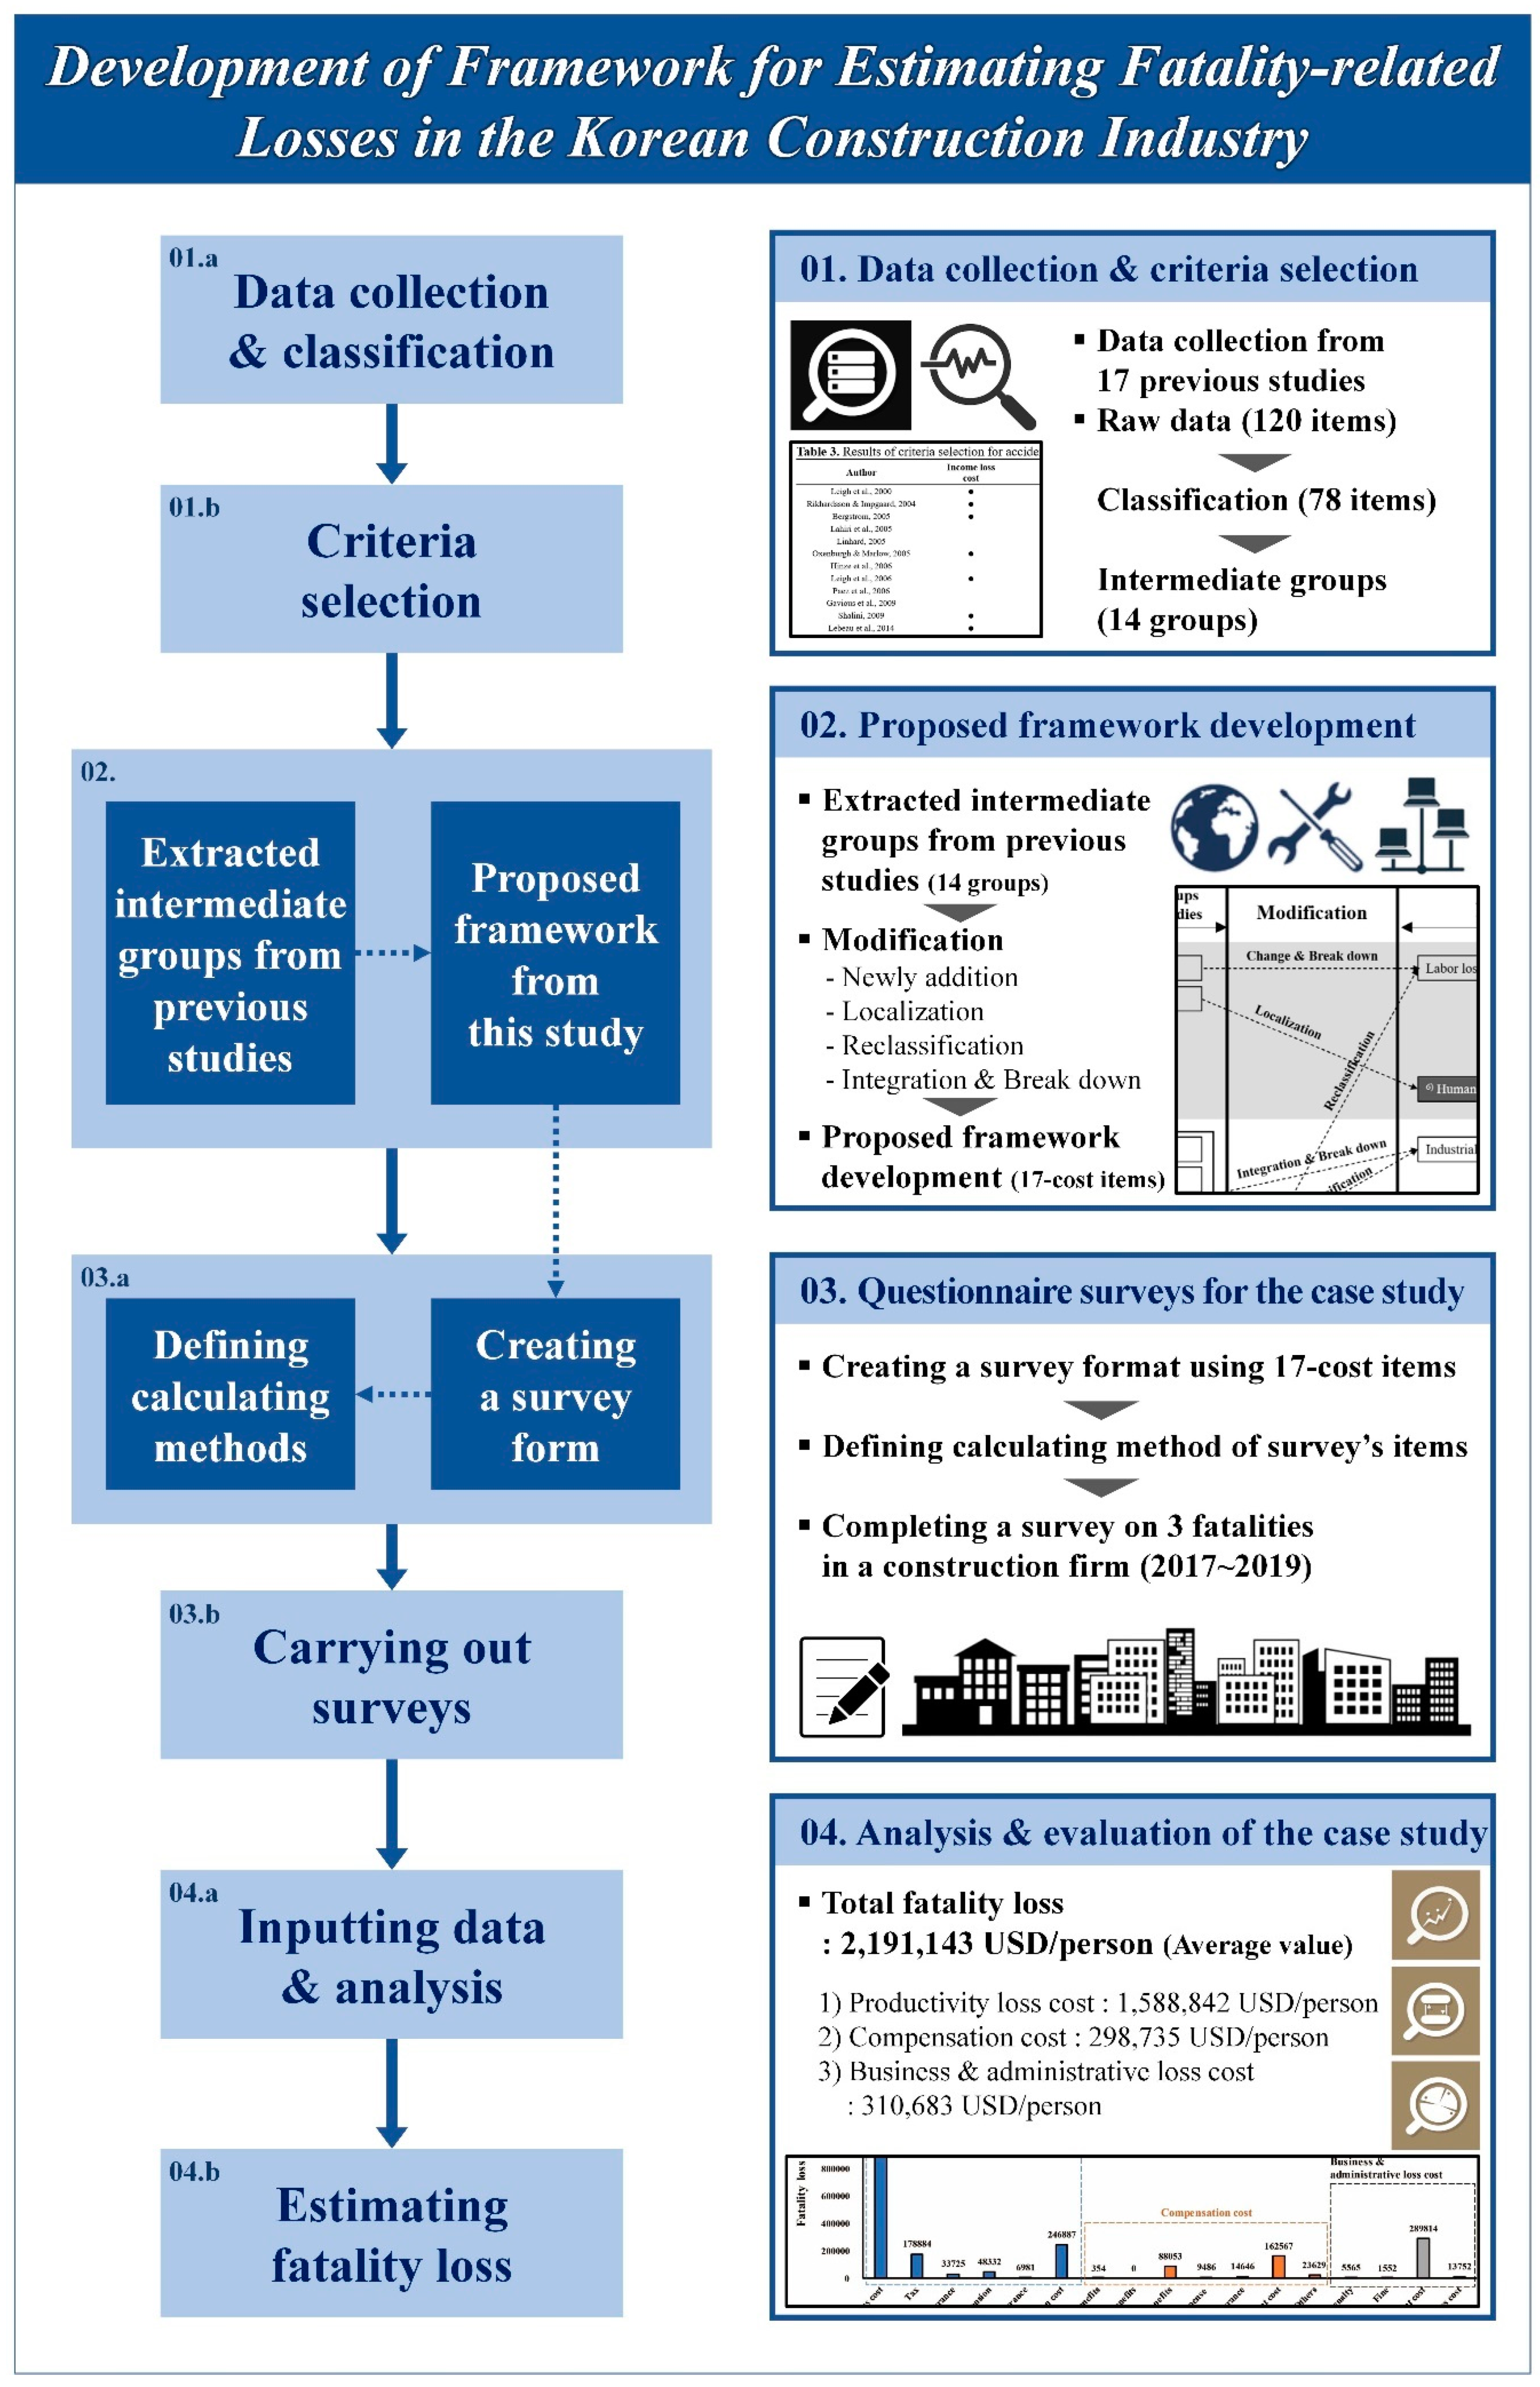
:1. Introduction
- (i)
- Data collection and criteria selection;
- (ii)
- Proposed framework development;
- (iii)
- Conduct of questionnaire surveys for the case study; and
- (iv)
- Analysis and evaluation of the case study.
- Framework optimization by applying the characteristics of the construction industry;
- Selecting reliable items that can be obtained from construction companies;
- Discovering and applying new items related to loss costs (delay reimbursement cost, etc.); and
- Developing a framework for calculating comprehensive loss costs.
2. Literature Review
3. Materials and Methods
3.1. Data Collection and Criteria Selection
3.2. Proposed Framework Development
- Added: Social insurance (health insurance, national insurance, employment insurance), workers’ compensation insurance, delay reimbursement costs;
- Change and break down: labor loss cost (income loss cost, tax, social insurance);
- Localization: human cost, administrative loss cost;
- Reclassification: labor loss cost, industrial accident insurance; and
- Integration and breakdown: industrial accident insurance (medical care benefits, temporary disability compensation benefits, survivor benefits, funeral service expenses), others (e.g., time loss, material loss), legal fees (penalties, fines).
3.3. Conduct of Questionnaire Surveys for the Case Study
3.4. Analysis and Evaluation of the Case Study
4. Results and Discussion
4.1. Results of Criteria Selection from Previous Studies
4.2. Results of Proposed Framework Development
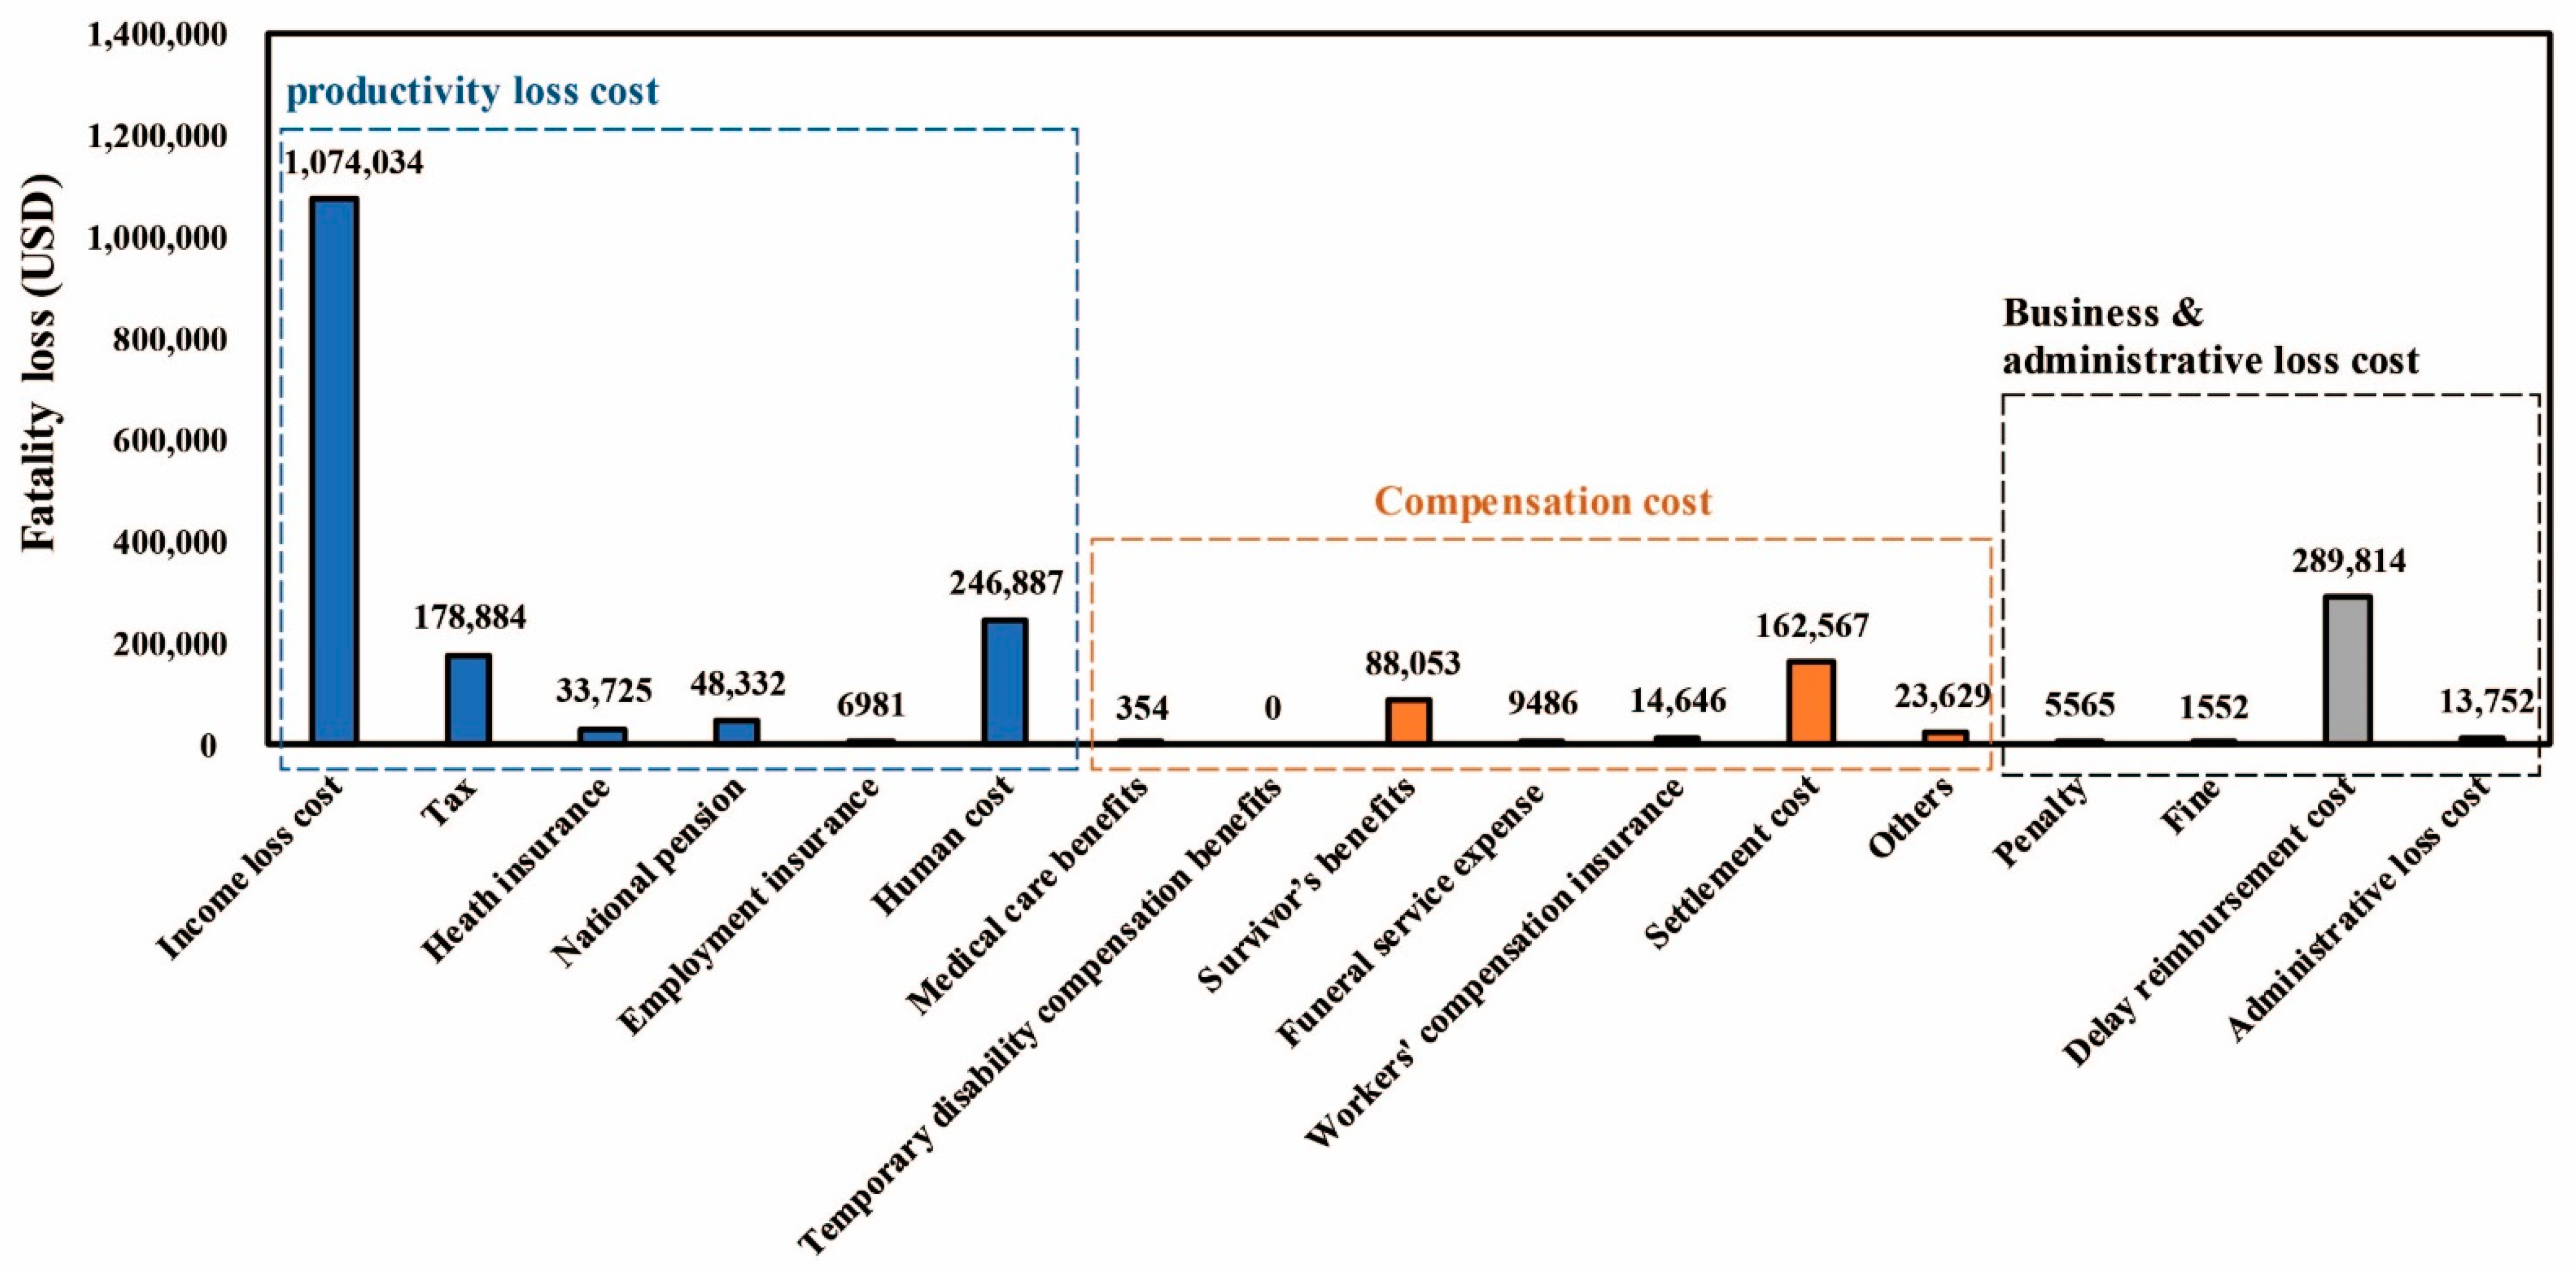
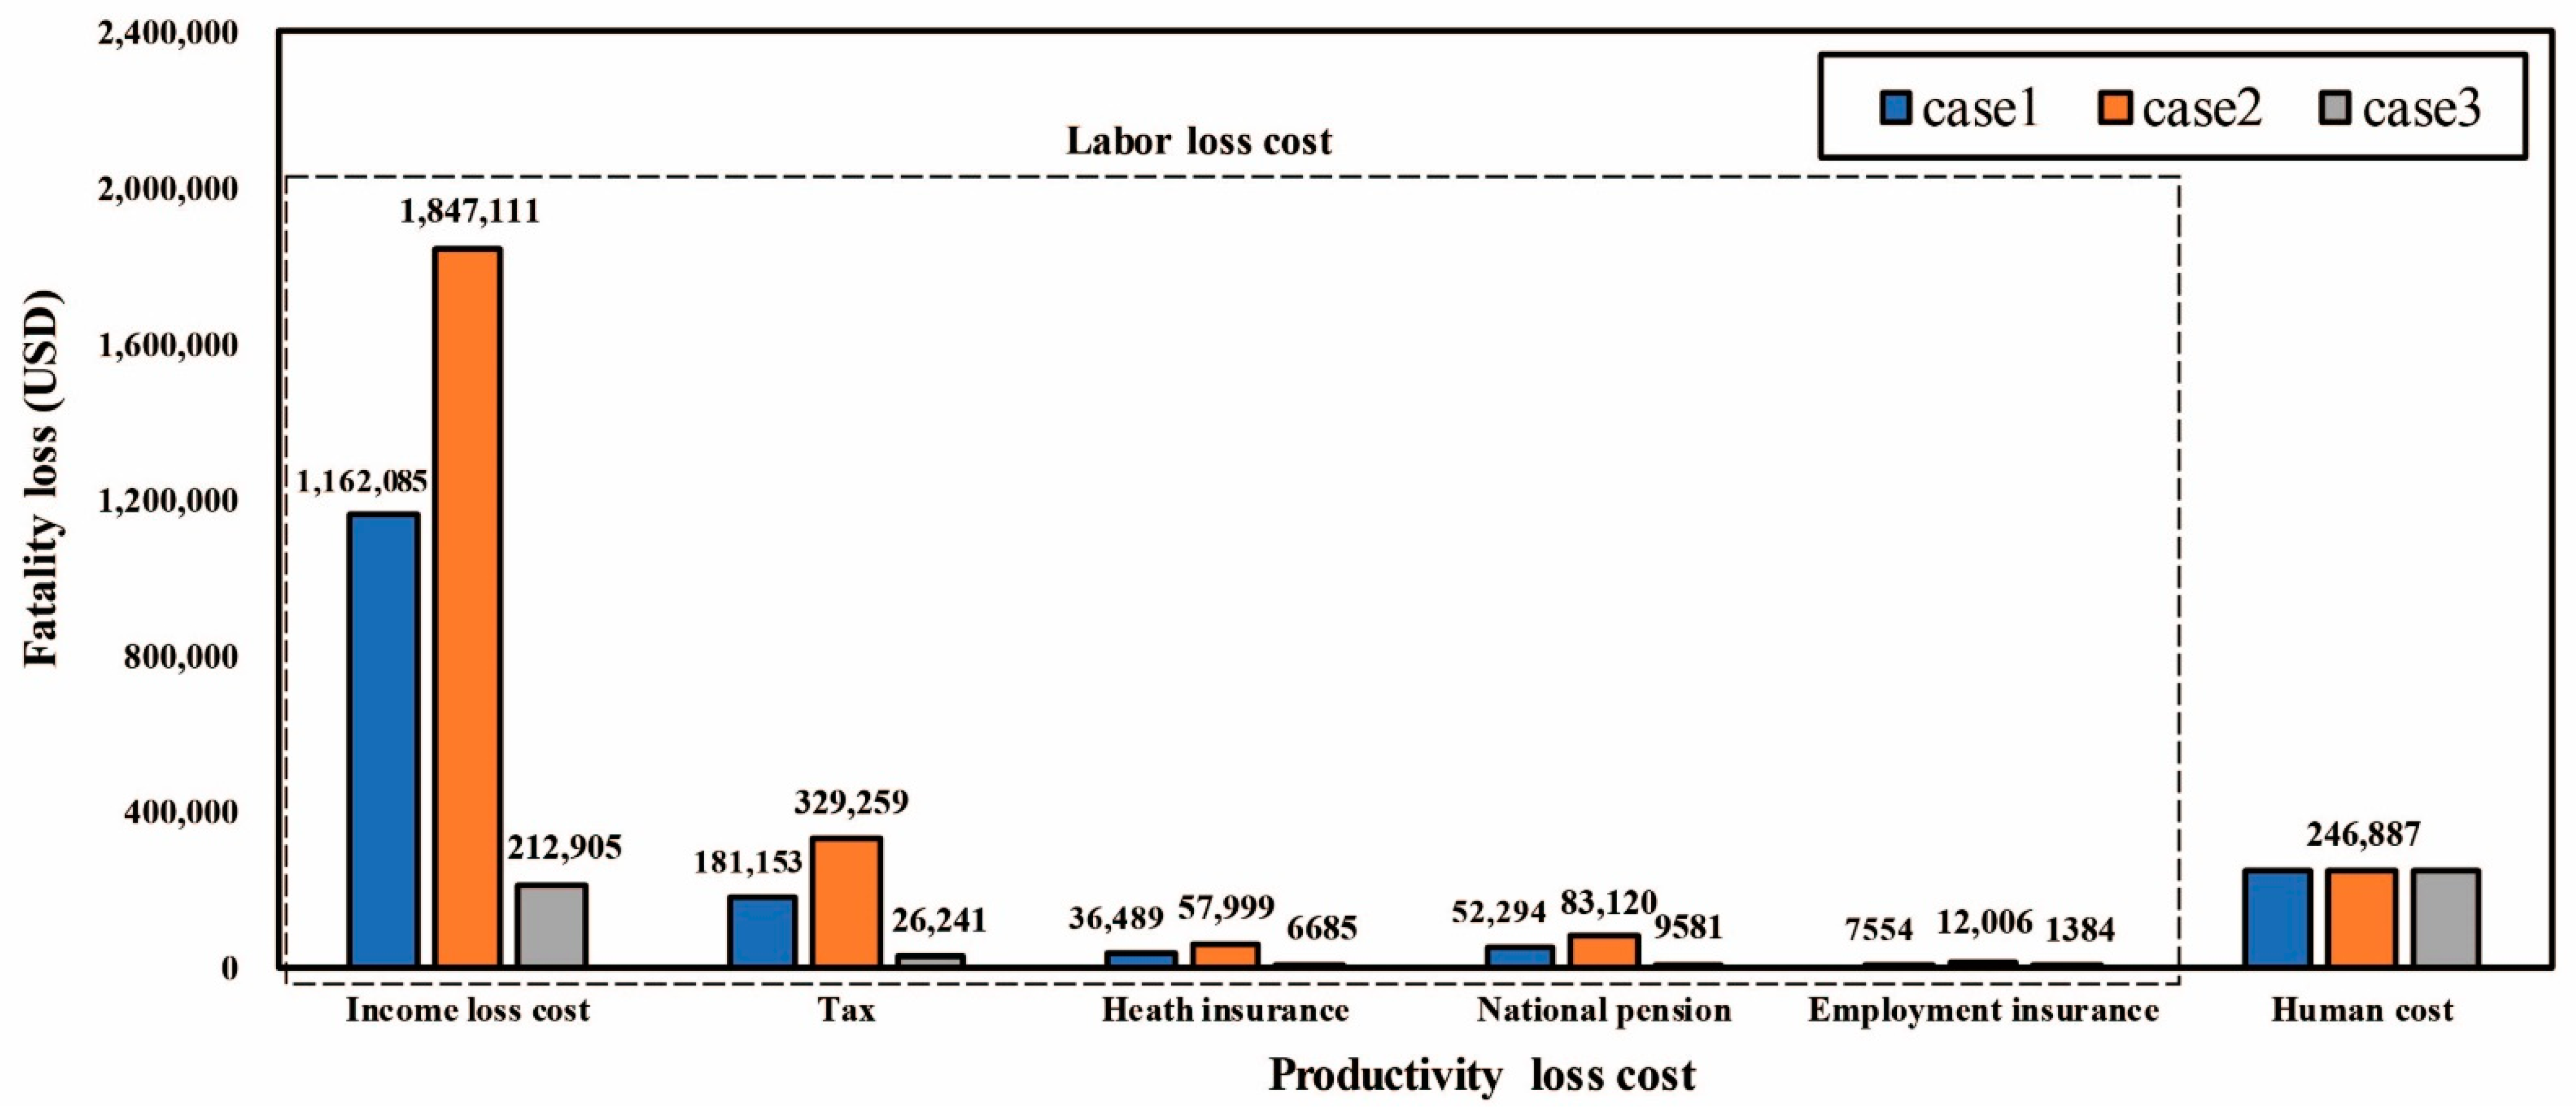
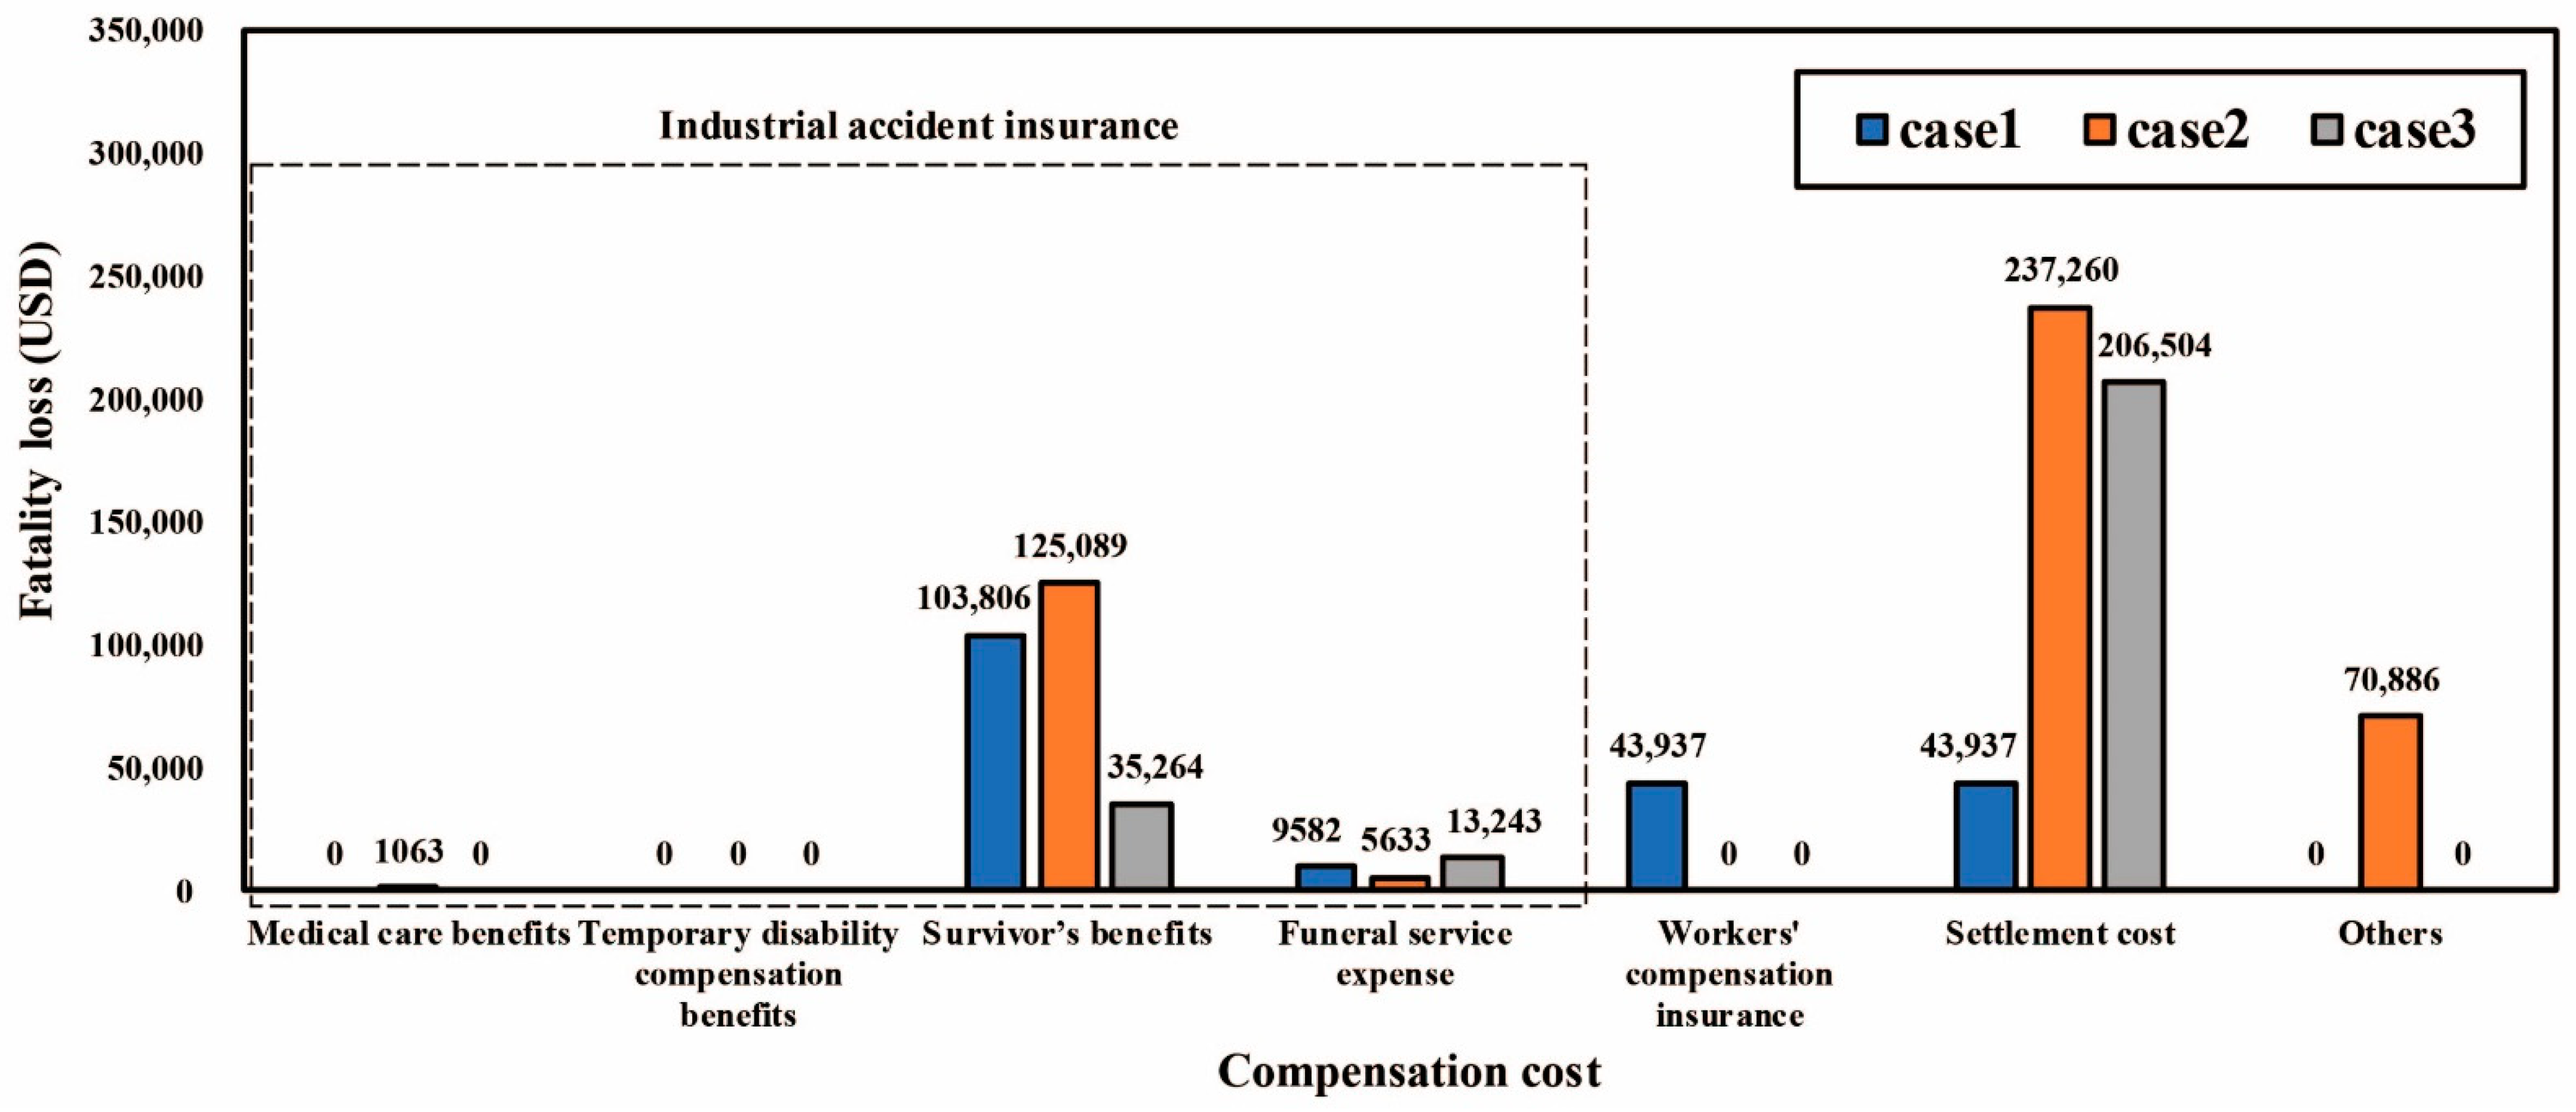
4.3. Results of the Estimated Fatality Loss by Case Study
5. Conclusions
Author Contributions
Funding
Institutional Review Board Statement
Informed Consent Statement
Data Availability Statement
Conflicts of Interest
References
- Hughes, P.; Ferrett, E. Introduction to Health and Safety in Construction; Routledge: London, UK, 2012. [Google Scholar]
- Lee, M.; Jeong, J.; Jeong, J.; Lee, J. Exploring fatalities and injuries in construction by considering thermal comfort using uncertainty and relative importance analysis. Int. J. Environ. Res. Public Health 2021, 18, 5573. [Google Scholar] [CrossRef] [PubMed]
- van Gelder, P.; Klaassen, P.; Taebi, B.; Walhout, B.; van Ommen, R.; van de Poel, I.; Robaey, Z.; Asveld, L.; Balkenende, R.; Hollmann, F.; et al. Safe-by-design in engineering: An overview and comparative analysis of engineering disciplines. Int. J. Environ. Res. Public Health 2021, 18, 6329. [Google Scholar] [CrossRef]
- Nnaji, C.; Karakhan, A.A. Technologies for safety and health management in construction: Current use, implementation benefits and limitations, and adoption barriers. J. Build. Eng. 2020, 29, 101212. [Google Scholar] [CrossRef]
- Bureau of Labor Statistics (BLS). National Census of Fatal Occupational Injuries in 2019; BLS: Washington, DC, USA, 2020. Available online: https://www.bls.gov/news.release/pdf/cfoi.pdf (accessed on 19 March 2021).
- Shohet, I.M.; Wei, H.H.; Skibniewski, M.J.; Tak, B.; Revivi, M. Integrated communication, control, and command of construction safety and quality. J. Construct. Eng. Manag. 2019, 145, 04019051. [Google Scholar] [CrossRef]
- International labour Organization (ILO). World Day for Safety and Health at Work. 2019. Available online: https://www.ilo.org/safework/events/safeday/lang--en/index.htm (accessed on 19 March 2021).
- Abdul Nabi, M.; El-adaway, I.H. Modular construction: Determining decision-making factors and future research needs. J. Manage. Eng. 2020, 36, 04020085. [Google Scholar] [CrossRef]
- Ammad, S.; Alaloul, W.S.; Saad, S.; Qureshi, A.H. Personal protective equipment (PPE) usage in construction projects: A scientometric approach. J. Build. Eng. 2020, 102086. [Google Scholar] [CrossRef]
- Assaad, R.; El-adaway, I.H. Impact of dynamic workforce and workplace variables on the productivity of the construction industry: New gross construction productivity indicator. J. Manag. Eng. 2021, 37, 04020092. [Google Scholar] [CrossRef]
- Sunindijo, R.Y.; Zou, P.X. Political skill for developing construction safety climate. J. Construct. Eng. Manag. 2012, 138, 605–661. [Google Scholar] [CrossRef]
- Gholizadeh, P.; Onuchukwu, I.S.; Esmaeili, B. Trends in catastrophic occupational incidents among electrical contractors, 2007–2013. Int. J. Environ. Res. Public Health 2021, 18, 5126. [Google Scholar] [CrossRef]
- Jeong, J.; Jeong, J. Novel approach of the integrated work & risk breakdown structure for identifying the hierarchy of fatal incident in construction industry. J. Build. Eng. 2021, 41, 102406. [Google Scholar] [CrossRef]
- Lingard, H.; Rowlinson, S. Occupational Health and Safety in Construction Management; Routledge: London, UK, 2005. [Google Scholar]
- Lee, W.; Lin, K.Y.; Seto, E.; Migliaccio, G.C. Wearable sensors for monitoring on-duty and off-duty worker physiological status and activities in construction. Automat. Constr. 2017, 83, 341–353. [Google Scholar] [CrossRef]
- Ho, D.C.P.; Ahmed, S.M.; Kwan, J.C.; Ming, F.Y.W. Site safety management in Hong Kong. J. Manag. Eng. 2000, 16, 34–42. [Google Scholar] [CrossRef]
- Choi, S.D.; Guo, L.; Kim, J.; Xiong, S. Comparison of fatal occupational injuries in construction industry in the United States, South Korea, and China. Int. J. Ind. Ergon. 2019, 71, 64–74. [Google Scholar] [CrossRef]
- Han, M.J.N.; Kim, M.J.; Kim, I.H. Exploring the user performance of Korean women in smart homes with a focus on user adoption. J. Build. Eng. 2021, 39, 102303. [Google Scholar] [CrossRef]
- Yang, K.; Kim, K.; Go, S. Towards effective safety cost budgeting for apartment construction: A case study of occupational safety and health expenses in South Korea. Sustainability 2021, 13, 1335. [Google Scholar] [CrossRef]
- Fang, D.; Wu, H. Development of a safety culture interaction (SCI) model for construction projects. Saf. Sci. 2013, 57, 138–149. [Google Scholar] [CrossRef]
- Wanberg, J.; Harper, C.; Hallowell, M.R.; Rajendran, S. Relationship between construction safety and quality performance. J. Construct. Eng. Manag. 2013, 139, 04013003. [Google Scholar] [CrossRef] [Green Version]
- Construction & Economy Research Institute of Korea (CERIK). A Comparative Analysis of Industrial Accident in Construction Industry in OECD Countries. 2020. Available online: http://www.cerik.re.kr/report/research/detail/2421 (accessed on 19 March 2021).
- Jallon, R.; Imbeau, D.; de Marcellis-Warin, N. Development of an indirect-cost calculation model suitable for workplace use. J. Saf. Res. 2011, 42, 149–164. [Google Scholar] [CrossRef]
- Heinrich, H.W. Industrial Accident Prevention. A Scientific Approach; McGraw Hill: New York, NY, USA, 1941. [Google Scholar]
- Ajayi, S.O.; Adegbenro, O.O.; Alaka, H.A.; Oyegoke, A.S.; Manu, P.A. Addressing behavioural safety concerns on qatari mega projects. J. Build. Eng. 2021, 41, 102398. [Google Scholar] [CrossRef]
- Riel, P.F.; Imbeau, D. Justifying investments in industrial ergonomics. Int. J. Ind. Ergon. 1996, 18, 349–361. [Google Scholar] [CrossRef]
- Rikhardsson, P.M.; Impgaard, M. Corporate cost of occupational accidents: An activity-based analysis. Accid. Anal. Prev. 2004, 36, 173–182. [Google Scholar] [CrossRef]
- Linhard, J.B. Understanding the return on health, safety and environmental investments. J. Saf. Res. 2005, 36, 257–260. [Google Scholar] [CrossRef]
- Kim, D.Y. A basic study on investigation of current craftmen status in construction site. Archit. Inst. Korea 2014, 30, 81–88. [Google Scholar]
- Lee, M.; Jeong, M.; Kim, K.; Choi, E.; Park, S. Review the possibility of replacing the converted accident ratio with the industrial accident compensation insurance balance ratio. J. Korean Soc. Saf. 2010, 25, 137–145. [Google Scholar]
- Gavious, A.; Mizrahi, S.; Shani, Y.; Minchuk, Y. The costs of industrial accidents for the organization: Developing methods and tools for evaluation and cost–benefit analysis of investment in safety. J. Loss Prev. Process. Ind. 2009, 22, 434–438. [Google Scholar] [CrossRef]
- Brody, B.; Létourneau, Y.; Poirier, A. Les Coûts Indirects des Accidents du Travail; Research report presented to IRSST: Montréal, QC, Canada, 1990. [Google Scholar]
- Lebeau, M.; Duguay, P.; Boucher, A. Costs of occupational injuries and diseases in Québec. J. Saf. Res. 2014, 50, 89–98. [Google Scholar] [CrossRef]
- Leigh, J.P.; Waehrer, G.; Miller, T.R.; Keenan, C. Costs of occupational injury and illness across industries. Scand. J. Work Environ. Health 2004, 30, 199–205. [Google Scholar] [CrossRef] [Green Version]
- Mroz, T.M.; Carlini, A.R.; Archer, K.R.; Wegener, S.T.; Hoolachan, J.I.; Stiers, W.; Shore, R.A.; Castillo, R.C. Frequency and cost of claims by injury type from a state workers’ compensation fund from 1998 through 2008. Arch. Phys. Med. Rehabil. 2014, 95, 1048–1054. [Google Scholar] [CrossRef]
- Sears, J.M.; Edmonds, A.T.; Coe, N.B. Coverage gaps and cost-shifting for work-related injury and illness: Who bears the financial burden? Med. Care Res. Rev. 2020, 77, 223–235. [Google Scholar] [CrossRef]
- Shalini, R.T. Economic cost of occupational accidents: Evidence from a small island economy. Saf. Sci. 2009, 47, 973–979. [Google Scholar] [CrossRef]
- Xiang, H.; Shi, J.; Lu, B.; Wheeler, K.; Zhao, W.; Wilkins, J.R.; Smith, G.A. Medical expenditures associated with nonfatal occupational injuries among immigrant and US-born workers. BMC. Public Health 2012, 12, 678. [Google Scholar] [CrossRef] [PubMed]
- Allison, R.W.; Hon, C.K.; Xia, B. Construction accidents in Australia: Evaluating the true costs. Saf. Sci. 2019, 120, 886–896. [Google Scholar] [CrossRef]
- Cressler, T.E.; Moore, J.R. Tracking safety performance in construction: A focused approach to the measurement of fatal and non-fatal injuries, 2003–2012. Saf. Sci. 2016, 88, 44–53. [Google Scholar] [CrossRef] [Green Version]
- Feng, Y.; Zhang, S.; Wu, P. Factors influencing workplace accident costs of building projects. Saf. Sci. 2015, 72, 97–104. [Google Scholar] [CrossRef]
- Feng, Y. Mathematical models for determining the minimum level of voluntary safety investments for building projects. J. Construct. Eng. Manag. 2015, 141, 04015015. [Google Scholar] [CrossRef]
- Gholizadeh, P.; Esmaeili, B. Cost of occupational incidents for electrical contractors: Comparison using robust-factorial analysis of variance. J. Construct. Eng. Manag. 2020, 146, 04020073. [Google Scholar] [CrossRef]
- Ibarrondo-Dávila, M.P.; López-Alonso, M.; Rubio-Gámez, M.C. Managerial accounting for safety management. The case of a Spanish construction company. Saf. Sci. 2015, 79, 116–125. [Google Scholar] [CrossRef]
- Larsson, T.J.; Field, B. The distribution of occupational injury risks in the Victorian construction industry. Saf. Sci. 2002, 40, 439–456. [Google Scholar] [CrossRef]
- Liao, C.W.; Chiang, T.L. The examination of workers’ compensation for occupational fatalities in the construction industry. Saf. Sci. 2015, 72, 363–370. [Google Scholar] [CrossRef]
- Schoonover, T.; Bonauto, D.; Silverstein, B.; Adams, D.; Clark, R. Prioritizing prevention opportunities in the Washington state construction industry, 2003–2007. J. Saf. Res. 2010, 41, 197–202. [Google Scholar] [CrossRef]
- Shohet, I.M.; Luzi, M.; Tarshish, M. Optimal allocation of resources in construction safety: Analytical-empirical model. Saf. Sci. 2018, 104, 231–238. [Google Scholar] [CrossRef]
- Leigh, J.P.; Waehrer, G.; Miller, T.R.; McCurdy, S.A. Costs differences across demographic groups and types of occupational injuries and illnesses. Am. J. Ind. Med. 2006, 49, 845–853. [Google Scholar] [CrossRef] [PubMed]
- Waehrer, G.M.; Dong, X.S.; Miller, T.; Haile, E.; Men, Y. Costs of occupational injuries in construction in the United States. Accid. Anal. Prev. 2007, 39, 1258–1266. [Google Scholar] [CrossRef] [Green Version]
- Costs to Britain of Workplace Fatalities and Self-Reported Injuries and Ill Health, 2018/19 Contents. Available online: https://www.hse.gov.uk (accessed on 19 March 2021).
- Estimation of Transport Accident Costs in 2013. Available online: https://www.koti.re.kr (accessed on 19 March 2021).
- Lee, J.C.; Lee, C.S. Accident characteristics of aged construction workers. J. Archit. Inst. Korea Struct. Constr. 2008, 24, 201–208. [Google Scholar]
- National Tax Service (NTS). Available online: https://www.nts.go.kr/nts/main.do (accessed on 7 August 2021).
- National Pension Service (NPS). Available online: https://www.nps.or.kr/jsppage/main.jsp (accessed on 7 August 2021).
- Estimating Standards 2021. Available online: https://www.kict.re.kr (accessed on 19 March 2021).
- Leigh, J.P.; Markowitz, S.; Fahs, M.; Landrigan, P.J. Costs of Occupational Injuries and Illnesses; University of Michigan Press: Ann Arbor, MI, USA, 2000. [Google Scholar]
- Bergström, M. The potential-method—An economic evaluation tool. J. Saf. Res. 2005, 36, 237–240. [Google Scholar] [CrossRef] [PubMed]
- Lahiri, S.; Gold, J.; Levenstein, C. Net-cost model for workplace interventions. J. Saf. Res. 2005, 36, 241–255. [Google Scholar] [CrossRef]
- Oxenburgh, M.; Marlow, P. The productivity assessment tool: Computer-based cost benefit analysis model for the economic assessment of occupational health and safety interventions in the workplace. J. Saf. Res. 2005, 36, 209–214. [Google Scholar] [CrossRef] [PubMed]
- Hinze, J.; Devenport, J.N.; Giang, G. Analysis of construction worker injuries that do not result in lost time. J. Construct. Eng. Manag. 2006, 132, 321–326. [Google Scholar] [CrossRef]
- Paez, O.; Uahinui, T.; Genaidy, A.; Karwowski, W.; Sun, L.; Daraiseh, N. Estimating uninsured costs of work-related accidents, part II: An incidence-based model. Theor. Issues Ergon. Sci. 2006, 7, 247–260. [Google Scholar] [CrossRef]


| Number | Authors | Industrial Type | Cost Items | Results |
|---|---|---|---|---|
| 1 | Rikhardsson and Impgaard, 2004 [27] | Service industry Construction industry Production industry |
|
|
| 2 | Lebeau and Boucher, 2014 [33] | All industry |
|
|
| 3 | Leigh et al., 2004 [34] | All industry |
|
|
| 4 | Shalini, 2009 [37] | All industries |
|
|
| 5 | Xiang et al., 2012 [38] | Construction industry |
|
|
| 6 | Aliison et al., 2019 [39] | Construction industry |
|
|
| 7 | Feng and Wu, 2015 [41] | Construction industry |
|
|
| 8 | Gholizadeh and Esmaeili, 2020 [43] | Construction industry |
|
|
| 9 | Schoonover et al., 2010 [47] | Construction industry |
|
|
| 10 | Waehrer et al., 2007 [50] | Construction industry |
|
|
| Tier | Required Information | Unit | Input Data | Purpose | |
|---|---|---|---|---|---|
| Company information | Company name | - | Nominal scale | Company identification | |
| Revenue of company | Mil. USD | Ratio scale | Refer to accident loss rate | ||
| Project name | - | Nominal scale | Project identification | ||
| Type of building | - | Nominal scale | Project identification | ||
| Construction cost | USD | Ratio scale | Project identification | ||
| Construction period | Days | Interval scale | Project identification | ||
| Gender | - | Nominal scale | Worker identification | ||
| Age | Year | Interval scale | Refer to labor loss cost | ||
| Career | Years | Interval scale | Worker identification | ||
| Accident information | Accident date | - | Nominal scale | Refer to delay reimbursement cost | |
| Accident construction type | - | Nominal scale | Refer to delay reimbursement cost | ||
| Construction progress rate | % | Ratio value | Refer to delay reimbursement cost | ||
| Accident work construction cost | USD | Ratio scale | Refer to delay reimbursement cost | ||
| Accident location | - | Nominal scale | Accident identification | ||
| Original cause materials | - | Nominal scale | Accident identification | ||
| Assailing materials | - | Nominal scale | Accident identification | ||
| Cause of accident | - | Nominal scale | Accident identification | ||
| Raw data on accident | Industrial accident insurance | Medical care benefits | USD | Ratio scale | Refer to compensation cost |
| Temporary disability Compensation benefits | USD | Ratio scale | Refer to compensation cost | ||
| Survivor benefits | USD | Ratio scale | Refer to compensation cost | ||
| Funeral service expense | USD | Ratio scale | Refer to compensation cost | ||
| Workers’ compensation insurance | USD | Ratio scale | Refer to compensation cost | ||
| Settlement costs | USD | Ratio scale | Refer to compensation cost | ||
| Other costs | USD | Ratio scale | Refer to compensation cost | ||
| Penalty | USD | Ratio scale | Refer to business & administrative loss cost | ||
| Fine | USD | Ratio scale | Refer to business & administrative loss cost | ||
| Number of days to stop working | Days | Interval scale | Refer to business & administrative loss cost | ||
| Type of accident work | - | Nominal scale | Refer to business & administrative loss cost | ||
| Cost of rush work | USD | Ratio scale | Refer to business & administrative loss cost | ||
| Accident investigation | Number of participants | Person | Nominal scale | Refer to business & administrative loss cost | |
| Number of days | Days | Interval scale | Refer to business & administrative loss cost | ||
| Cost Items | Type | Proposed Calculation Method |
|---|---|---|
| Income loss cost | A a | |
| Tax | A | |
| Heath insurance | A | |
| National pension | A | |
| Employment insurance | A | |
| Human cost | C c | Human cost calculated by the Korea Transport Institute |
| Medical care benefits | B b | ‘Medical care benefits’ item on the survey |
| Temporary disability Compensation benefits | B | ‘Temporary disability compensation benefits’ item on the survey |
| Survivor’s benefits | B | ‘Survivor’s benefits’ item on the survey |
| Funeral service expense | B | ‘Funeral service expense’ item on the survey |
| Workers’ compensation insurance | B | ‘Workers’ compensation insurance’ item in survey |
| Settlement cost | B | ‘Settlement cost’ item on the survey |
| Others | B | ‘Other costs’ item on the survey |
| Penalty | B | ‘Penalty’ item on the survey |
| Fine | B | ‘Fine’ item in survey |
| Delay reimbursement cost | A | (Accident work construction cost of stop working period) (0.3 d × 0.875 e + 0.7) |
| Administrative loss cost | A |
| Group | Income Loss Cost | Human Cost | Medical Cost | Medical Leave Wages | Survivor’s Benefits | Funeral Cost | Compensation Cost |
| Cases |
|
|
|
|
|
|
|
| Group | Time & Productivity Loss | Material Loss | Financial Loss | Intervention Cost | Penalty | Fine | Administrative Loss Cost |
| Cases |
|
|
|
|
|
|
|
| Author | Income Loss Cost | Human Cost | Medical Cost | Medical Leave Wages | Survivor’s Benefits | Funeral Cost | Compensation Cost |
| Rikhardsson and Impgaard, 2004 [27] | ● | ● | |||||
| Linhard, 2005 [28] | ● | ● | |||||
| Gavious et al., 2009 [31] | ● | ||||||
| Lebeau et al., 2014 [33] | ● | ● | ● | ● | ● | ||
| Shalini, 2009 [37] | ● | ● | |||||
| Allison et al., 2019 [39] | ● | ||||||
| Cressler et al., 2016 [40] | ● | ||||||
| Feng, 2015 [41] | ● | ● | ● | ● | |||
| Ibarrondo-Dávila et al., 2015 [44] | ● | ||||||
| Shohet et al., 2018 [48] | ● | ||||||
| Leigh et al., 2006 [49] | ● | ● | ● | ● | |||
| Leigh et al., 2000 [57] | ● | ● | |||||
| Bergstrom, 2005 [58] | ● | ● | |||||
| Lahiri et al., 2005 [59] | ● | ||||||
| Oxenburgh and Marlow, 2005 [60] | ● | ● | |||||
| Hinze et al., 2006 [61] | ● | ||||||
| Paez et al., 2006 [62] | ● | ||||||
| Author | Time & Productivity loss | Material loss | Financial loss | Intervention cost | Penalty | Fine | Administrative loss cost |
| Rikhardsson and Impgaard, 2004 [27] | ● | ● | ● | ● | |||
| Linhard, 2005 [28] | ● | ● | ● | ● | ● | ● | |
| Gavious et al., 2009 [31] | ● | ● | ● | ● | ● | ||
| Lebeau et al., 2014 [33] | ● | ● | |||||
| Shalini, 2009 [37] | ● | ||||||
| Allison et al., 2019 [39] | ● | ● | |||||
| Cressler et al., 2016 [40] | ● | ||||||
| Feng, 2015 [41] | ● | ● | ● | ● | ● | ● | |
| Ibarrondo-Dávila et al., 2015 [44] | ● | ● | ● | ● | ● | ● | |
| Shohet et al., 2018 [48] | ● | ● | ● | ● | |||
| Leigh et al., 2006 [49] | ● | ● | ● | ||||
| Leigh et al., 2000 [57] | ● | ||||||
| Bergstrom, 2005 [58] | ● | ● | |||||
| Lahiri et al., 2005 [59] | ● | ||||||
| Oxenburgh and Marlow, 2005 [60] | ● | ● | ● | ● | |||
| Paez et al., 2006 [62] | ● | ● |
| Cost Items | Concept and Details | |||
|---|---|---|---|---|
| Productivity loss cost | Labor loss cost | Income loss cost | • Loss of income for retirement (age of 65) due to a worker’s death | |
| Tax | • Loss on taxes payable until retirement incurred due to a worker’s death | |||
| Social insurance | Heath insurance | • Loss of health insurance payable until retirement incurred due to the death of a worker | ||
| National pension | • Loss expenses for the national pension that can be paid until retirement incurred due to the death of a worker | |||
| Employment insurance | • Loss of employment insurance payable until retirement incurred due to the death of a worker | |||
| Human cost | • Mental pain, sadness, or pressure felt by the bereaved family members of a worker who died in an accident are converted into the cost. | |||
| Compensation cost | Industrial accident insurance | Medical care benefits | • Insurance benefits that are paid until a worker is healed when a worker is injured or sick and needs more than four days of medical care | |
| Temporary disability compensation benefits | • Insurance benefits paid for the period when industrial workers involved in an accident are unable to work due to medical treatment | |||
| Survivor benefits | • Insurance benefits paid to compensate the dependents for their losses due to the death of a worker and to ensure the livelihood of the survivors | |||
| Funeral service expense | • Insurance benefit that pays expenses for funeral services when a worker dies from a work-related accident | |||
| Workers’ compensation insurance | • Insurance costs paid by the employer under civil law when the employee’s accident compensation amount exceeds the Labor Standards Act | |||
| Settlement cost | • Expenses that the business owner incurs to deal with the accident related to the victim or survivors | |||
| Others | • The sum of the cost of the time losses and material losses other than by the injured person | |||
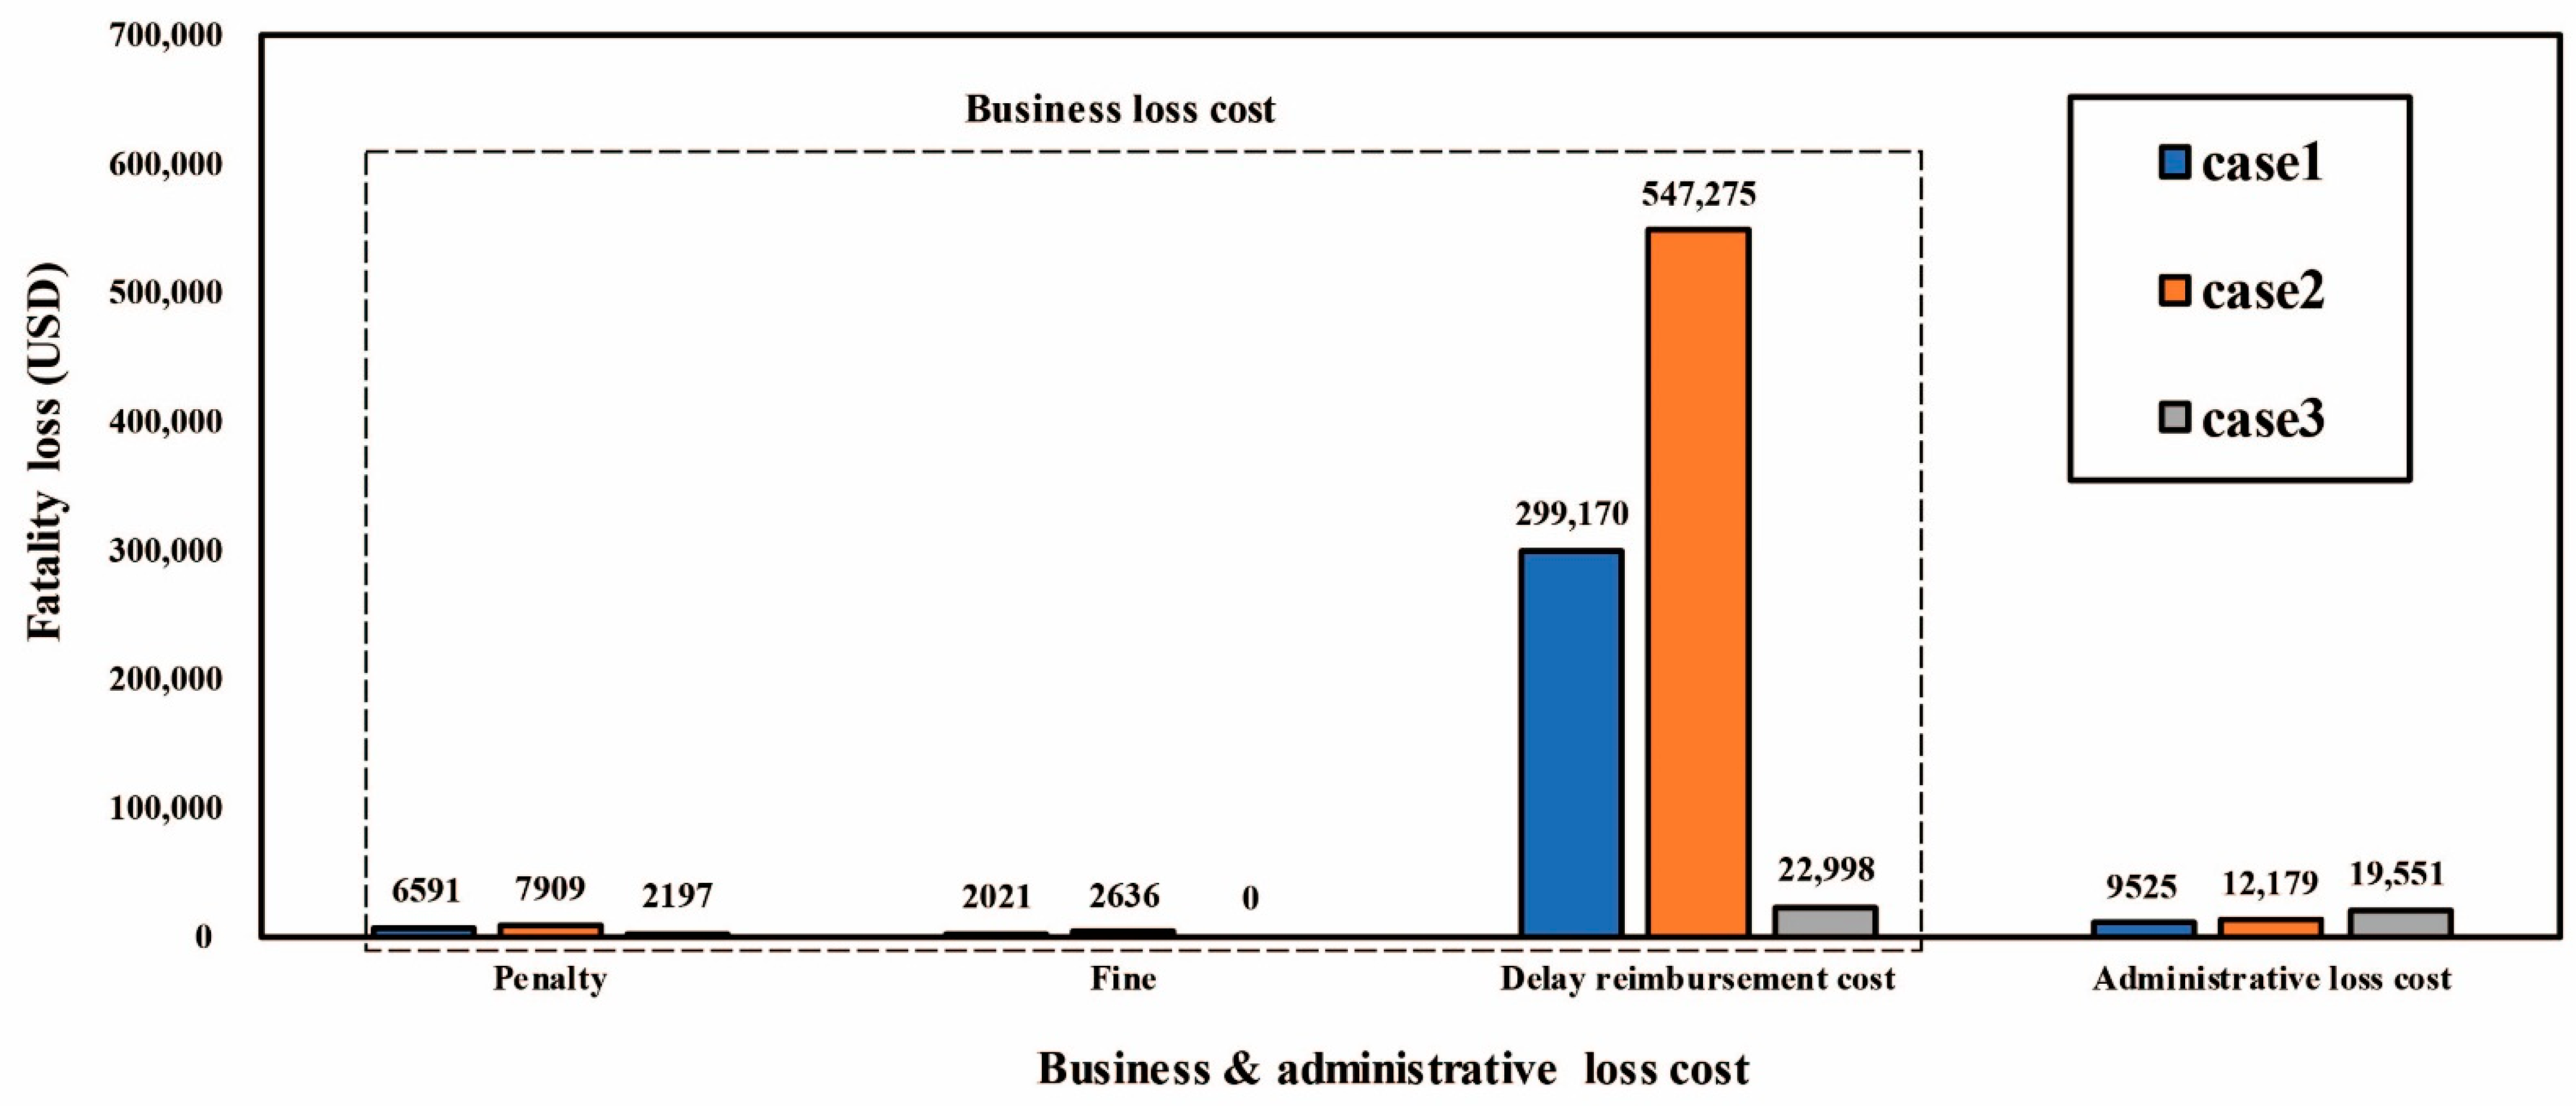
| Business & administrative loss cost | Business loss cost | Legal fees | Penalty | • Punishment costs imposed on someone for doing something against a law or rule |
| Fine | • Punishment costs in which a person is ordered to pay a sum of money because they have done something illegal or broken a rule | |||
| Delay reimbursement cost | • Additional cost to supplement work interrupted by an accident | |||
| Administrative loss cost | • Time cost for an industrial accident investigation by the employer and the government due to the occurrence of an accident | |||
| Cost Items | Fatality Loss (USD/Person) | ||||||
|---|---|---|---|---|---|---|---|
| Case 1 | Case 2 | Case 3 | Average | ||||
| Productivity loss cost | Labor loss cost | Income loss cost | 1,162,085 | 1,847,111 | 212,905 | 1,074,034 | |
| Tax | 181,153 | 329,259 | 26,241 | 178,884 | |||
| Social insurance | Heath insurance | 36,489 | 57,999 | 6685 | 33,725 | ||
| National pension | 52,294 | 83,120 | 9581 | 48,332 | |||
| Employment insurance | 7554 | 12,006 | 1384 | 6981 | |||
| Human cost | 246,887 | 246,887 | 246,887 | 246,887 | |||
| Compensation cost | Industrial accident insurance | Medical care benefits | 0 | 1063 | 0 | 354 | |
| Temporary disability compensation benefits | 0 | 0 | 0 | 0 | |||
| Survivor benefits | 103,806 | 125,089 | 35,264 | 88,053 | |||
| Funeral service expense | 9582 | 5633 | 13,243 | 9486 | |||
| Workers’ compensation insurance | 43,937 | 0 | 0 | 14,646 | |||
| Settlement cost | 43,937 | 237,260 | 206,504 | 162,567 | |||
| Others | 0 | 70,886 | 0 | 23,629 | |||
| Business & administrative loss cost | Business loss cost | Legal fees | Penalty | 6591 | 7909 | 2197 | 5565 |
| Fine | 2021 | 2636 | 0 | 1552 | |||
| Delay reimbursement cost | 299,170 | 547,275 | 22,998 | 289,814 | |||
| Administrative loss cost | 9525 | 12,179 | 19,551 | 13,752 | |||
| Total cost | 2,205,031 | 3,586,313 | 803,440 | 2,198,261 | |||
Publisher’s Note: MDPI stays neutral with regard to jurisdictional claims in published maps and institutional affiliations. |
© 2021 by the authors. Licensee MDPI, Basel, Switzerland. This article is an open access article distributed under the terms and conditions of the Creative Commons Attribution (CC BY) license (https://creativecommons.org/licenses/by/4.0/).
Share and Cite
Lee, J.; Jeong, J.; Soh, J.; Jeong, J. Development of Framework for Estimating Fatality-Related Losses in the Korean Construction Industry. Int. J. Environ. Res. Public Health 2021, 18, 8787. https://doi.org/10.3390/ijerph18168787
Lee J, Jeong J, Soh J, Jeong J. Development of Framework for Estimating Fatality-Related Losses in the Korean Construction Industry. International Journal of Environmental Research and Public Health. 2021; 18(16):8787. https://doi.org/10.3390/ijerph18168787
Chicago/Turabian StyleLee, Jaehyun, Jaewook Jeong, Jayho Soh, and Jaemin Jeong. 2021. "Development of Framework for Estimating Fatality-Related Losses in the Korean Construction Industry" International Journal of Environmental Research and Public Health 18, no. 16: 8787. https://doi.org/10.3390/ijerph18168787