Visual Performance Assessment of Videos—A Case Study of the Game “Spot the Difference”


1
Department of Industrial Engineering and Management, National Kaohsiung University of Science and Technology, Kaohsiung 807618, Taiwan
2
Department of Data Science, Soochow University, Taipei 111002, Taiwan
3
Yong Cheng Steel Company Limited, Taichung 429002, Taiwan
*
Author to whom correspondence should be addressed.
Appl. Sci. 2021, 11(16), 7628; https://doi.org/10.3390/app11167628
Submission received: 6 May 2021
/
Revised: 12 August 2021
/
Accepted: 17 August 2021
/
Published: 19 August 2021
(This article belongs to the Section Applied Industrial Technologies)
Abstract
:“Spot the Difference” is a well-known game where players must find subtle differences between two almost identical pictures. If “Spot the Difference” is designed for videos, what is the difference between videos and pictures? If the performance of videos is measured by an eye tracker, what scan paths will be conducted? In this study, we explored this game using a video to conduct a visual performance evaluation. Twenty-five subjects were recruited in a full-factorial experiment to investigate the effect of background (with background, without background), video type (animation, text), and arrangement (left-to-right, top-to-bottom) on searching, eye tracking performance, and visual fatigue. The results showed that the video type had a significant effect on the accuracy and subjective visual fatigue, with the accuracy and subjective visual fatigue for animation being better than for text. The results also indicated that the arrangement had a significant effect on the number of fixations, where top-to-bottom arrangement brought a higher number of fixations. The background had a significant effect on accuracy and subjective visual fatigue, where the accuracy and subjective visual fatigue without a background was better than with a background. For the analysis of the scan path, a denser scan path was found in text than in animation, in top-to-bottom arrangement than in left-to-right arrangement, and without a background than with a background. In the future, game manufacturers should use the results of this research to design different “Spot the Difference” videos. When designing a simple game, an animation without a background and involving a left-to-right arrangement was recommended. When designing a difficult game, the opposite settings should be used.
1. Introduction
Visual searching is a daily task that is conducted in various environments. As a classic visual search game, “Spot the Difference” is usually played in the form of finding differences in pictures. Players must find subtle differences in two almost identical pictures. This game is designed to test the player’s concentration and ability to search. Past studies have investigated the functions of “Spot the Difference” pictures, such as improvements in learners’ interaction [1], the visual distractor in memory retention [2], the vernacular-oriented methodology for investigating dialect lexis [3], and the detection of visual deficits for readers [4]. However, if “Spot the Difference” is designed for videos, what is the difference between videos and pictures? If the performance of videos is measured by an eye tracker, what scan paths will be conducted? How will the complexity of the background affect the players’ performance when searching for targets? The above questions were the main motivation for carrying out this study. According to the literature, the more complex the external image information is, the longer the gaze duration is [5,6,7]. Caroux et al. [8] showed that, when the background is more complex, it will have more negative influences on the performance of the visual searching tasks. Huang and Pashler [9] also pointed out that the difficulty of the visual search test affects the search efficiency. According to Marlen et al. [10], the background complexity and the clear or fuzzy description of the target affect the search speed and accuracy. It is concluded that the higher the complexity and description ambiguity are, the slower and harder it is to find the target. The current research uses videos to present the game “Spot the Difference”, yet it is difficult to divide the videos into simple and complex groups based on the background colors during the design process. In this study, to test the absence of a background, the background picture is presented in a monochromatic system; meanwhile, when there is a background, the background picture is presented in a multi-color system. The videos are divided into two types: videos without a background (one color) and videos with a background (multiple colors).
In addition, when people watch videos, different types of videos may have different impacts. Text represents the information in a verbal code, such as prose, expository text, or verbal instruction in written or spoken formats [11]. Lin and Chin [12] investigated three kinds of reading contents: science-, literary-, and magazine-related. In contrast, pictures are defined as being associated with the represented object by similarity or common structural properties. When testing performance, Lin and Hsieh [13] found that readers paid more attention to texts than pictures, and few fixations fell on pictures for English as a foreign language (EFL) beginners. Levie and Lentz [14] concluded that pictures increased readers’ interest. Peeck [15] indicated that pictures improve readers’ processing of difficult text. However, Sanchez and Wiley [16] found that pictures may cause the seductive details effect, and they showed how pictures can easily affect people’s reading performance. For videos, Giacaman et al. [17] indicated that visual analogy videos helped students improve their learning. Mubarak et al. [18] showed that the interaction with videos for students improves the quality and outcomes of online courses. Dashtipour et al. [19] concluded that videos include text, audio, and visual features, resulting in a better performance in sentiment analysis. Based on these comparisons of texts and pictures, this study uses videos as the reading medium, and investigated two video types: text and animation.
Layout style can also affect a subject’s search direction. According to the literature, people subjectively prefer to choose the editing method in which an image is placed on the left side of the text [20]. In addition, significant differences in eyeball movements and attention shifts occur when viewing images versus reading text. When reading text messages, the eyeball moves up and down or left and right along the line of text, with alternate saccades and fixations. The saccade amplitude and average time of fixation for reading text is smaller and shorter than when viewing images, and the eye movement for reading text follows a left-to-right and top-to-bottom pattern. No such pattern occurs when viewing images [21]. Previous similar studies have investigated the difference between vertical and horizontal arrangements of text on PDAs and computer screens [22,23], concluding that performance when reading vertical text is not always inferior to that when reading a horizontal format. Lin [24] investigated two types of phonetic symbols, including both vertical and horizontal arrangements, and found that the use of a vertical arrangement saves more time when sending Chinese text messages. Based on these factors, we aim to examine the differences between vertical and horizontal arrangements in this study.
In summary, background, video type, and arrangement are three critical factors affecting people when watching “Spot the Difference” videos. The purpose of this study is to assess the effects of these three factors on searching, eye tracking performance, and visual fatigue.
2. Method
2.1. Participants
Twenty-five college students (mean age = 20.75 years; standard deviation = 0.52 years) took part in this experiment. All of the participants had a corrected visual acuity better than 0.8 [25] after examination with a TOPCON AGP7 vision tester.
2.2. Apparatus and Materials
A Panasonic 50 inch 3D plasma TV (TH-P50ST60W, Panasonic Corporation, Osaka, Japan) was selected as the visual display unit. A Mangold Vision eye tracker with a sampling rate of 60 Hz was used to record each participant’s visual performance while watching the videos. Windows Movie Maker was the software used to edit the videos. In order to understand the impact of background on search performance, we used Animaker to design an animation video and a text video. We then inserted landscape photos into the videos with a background, while the original videos had no background. In addition, we inserted five targets that needed to be searched for in each video. To investigate the effect of the difference in arrangement on visual performance, the Open Shot software was used to construct two different arrangements—namely, top-to-bottom and left-to-right arrangements. For the videos arranged top-to-bottom, the video with targets was put on the top; with regard to the videos arranged left-to-right, the video with targets was put on the right. At the same time, in order to reduce the learning effect, the sequence of video presentation was randomized. In this study, the participants watched a 1 min video in each experiment combination, meaning they watched the videos for 8 min (combinations) in total.
2.3. Experimental Design
Three independent variables were evaluated in this study: background, video type, and arrangement. The two background levers were with a background versus without a background. The two video types were animation and text (see Figure 1 and Figure 2). The arrangement was classified as either left-to-right or top-to-bottom (see Figure 1 and Figure 2). A full factorial design was used, where all independent variables were set as within-subject factors. This study comprised 25 participants, and each participant randomly completed eight experimental combinations.
2.4. Tasks and Procedure
The experiment procedure was as follows:
- The experimental process and steps were explained to the participants prior to the experiment.
- The experiment began as the eye tracker finished the calibration from the six points.
- The participants were asked to watch the video and fill out the subjective visual fatigue questionnaire for each treatment.
- The participants were asked to complete eight treatment combinations.
- The participants took a 5 min break.
- Steps 2–5 were repeated until all experimental combinations were completed. The experimental duration was about 60 min for each participant.
2.5. Dependent Variables and Data Analysis
Three dependent variables were analyzed: accuracy, number of fixations, and subjective visual fatigue. Accuracy was a quotient of the number of differences found by the number of total differences (five). The number of fixations, in the act of fixating, is the number of points between any two saccades, during which the eyes are relatively stationary and virtually all visual input occurs [26]. Subjective visual fatigue was determined using Heuer et al.’s [27] questionnaire, which contained six items, and the participants answered the items on a 10-point scale. In addition, another eye tracker index was the scan path, which is the visual path followed by participants’ eyes while observing the videos.
Analyses of variance (ANOVAs) were conducted with repeated measures of accuracy, number of fixations, and subjective visual fatigue. The least significant difference (LSD) test was used to find the significances among the levels of independent variables. All statistical analyses were calculated using the Statistical Products Services Solution (SPSS).
3. Results and Discussion
The ANOVA results for each dependent variable are shown in Table 1.
3.1. Accuracy
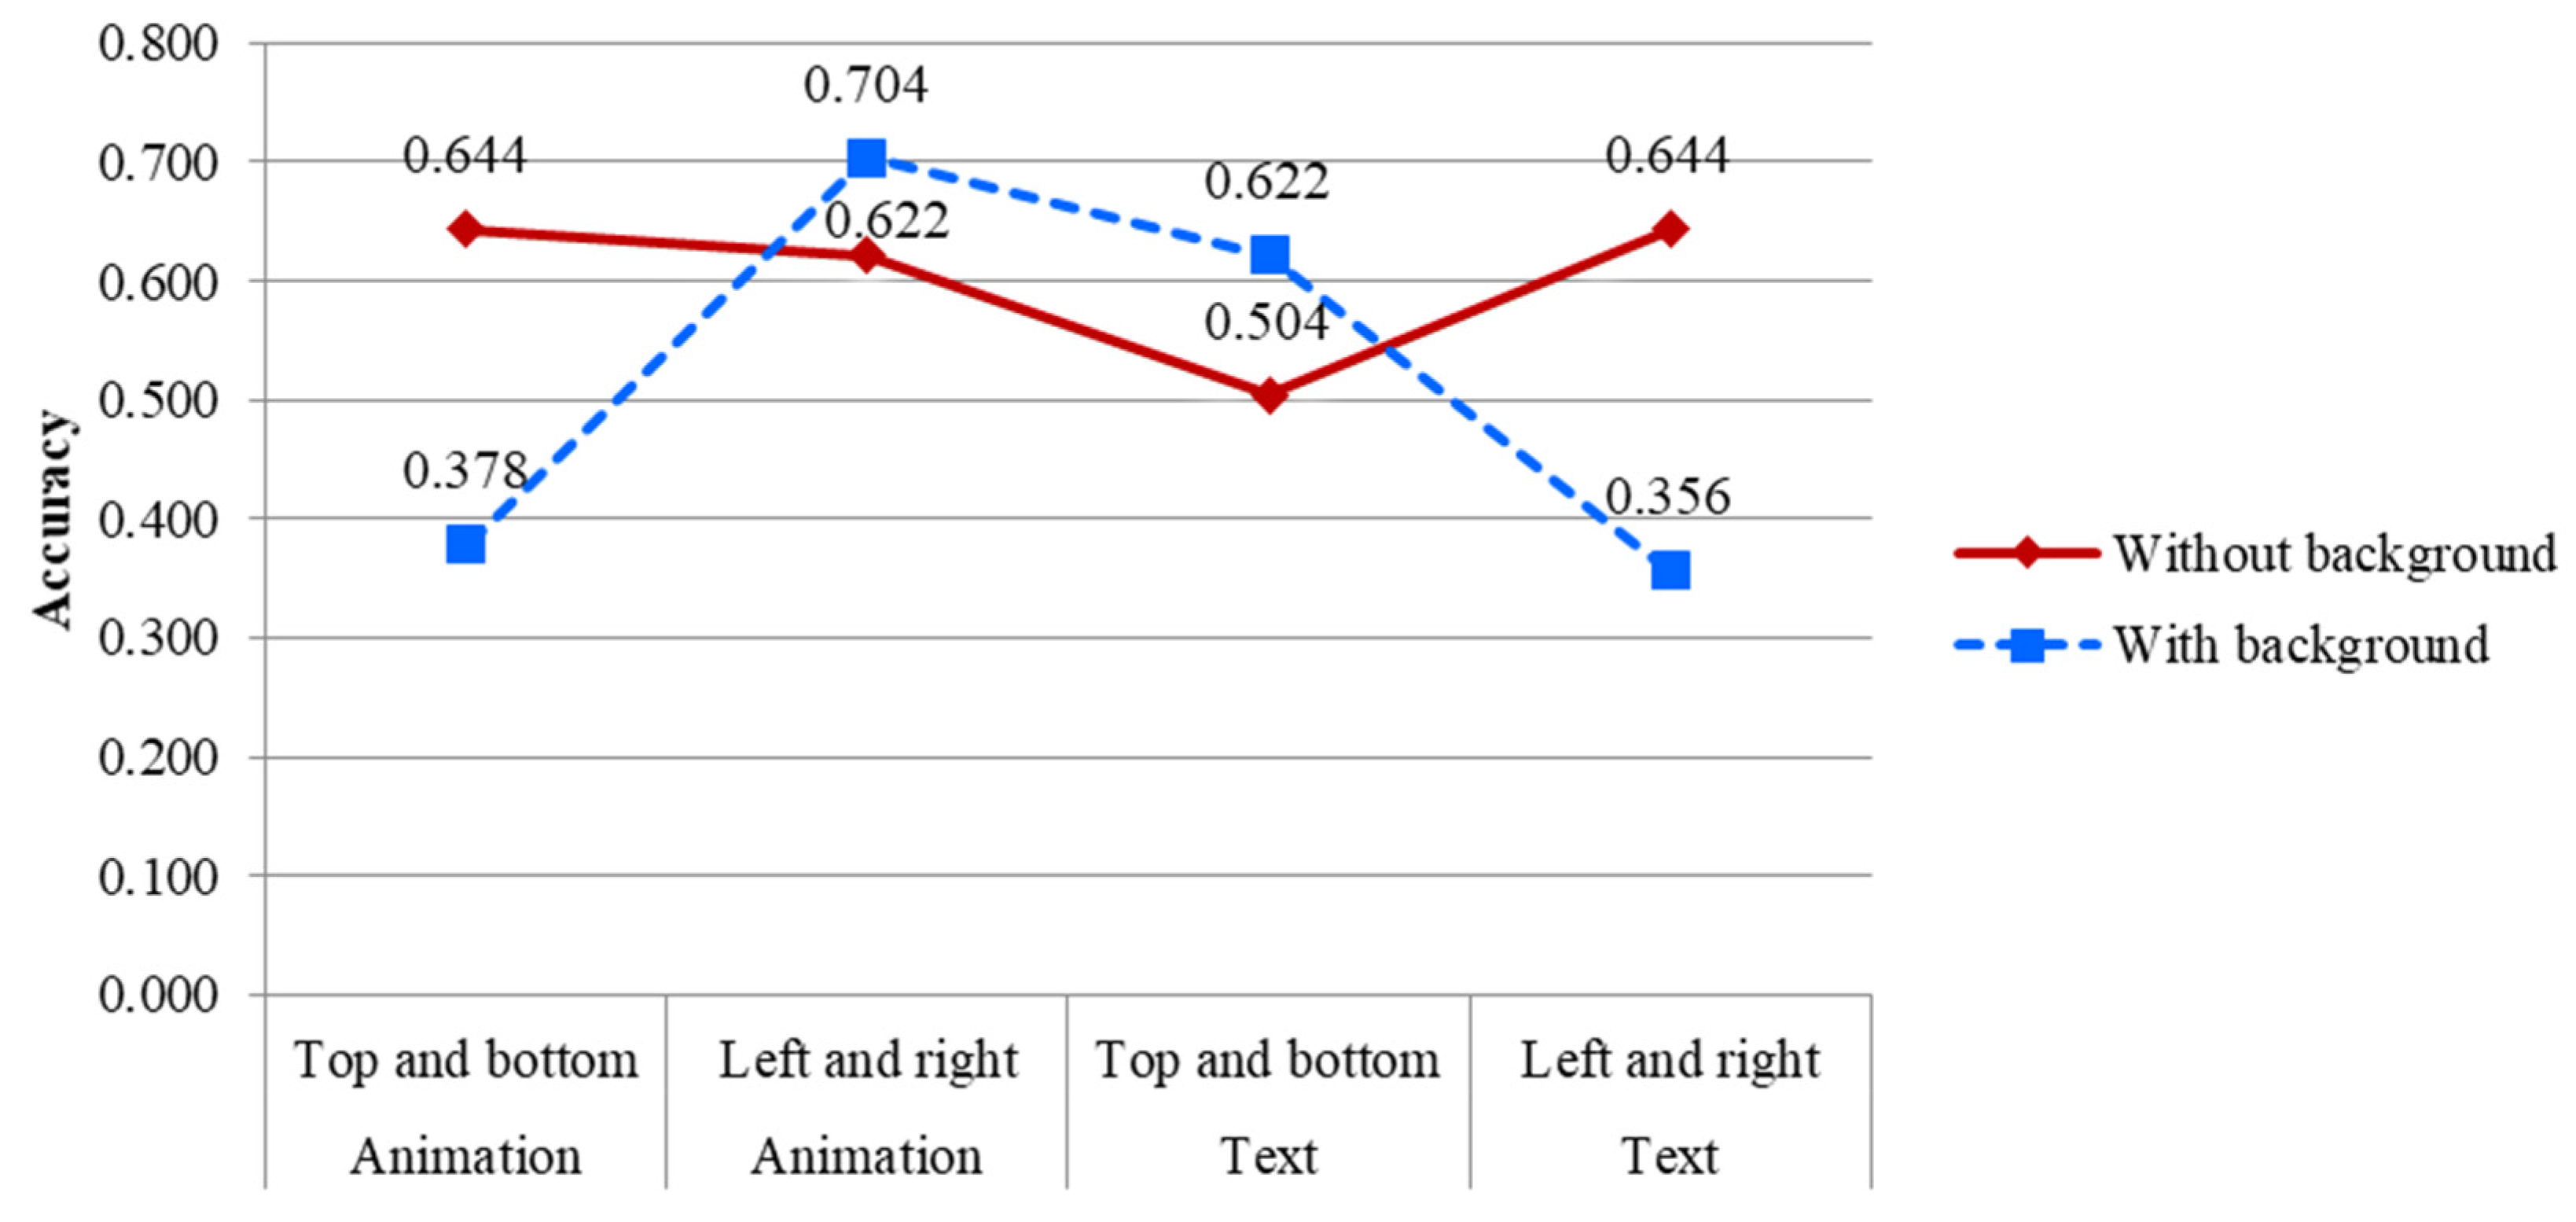
The ANOVA results for accuracy indicated that background (F = 11.599, p < 0.05), video type (F = 10.101, p < 0.05); the interaction between video type and arrangement (F = 11.300, p < 0.05); and the three-way interaction among background, video type, and arrangement (F = 63.325, p < 0.01) were the significant factors. As shown in Figure 3, the performance of accuracy without a background was better in the top-to-bottom animation and the left-to-right text, while the accuracy with a background was superior in the left-to-right animation and the top-to-bottom text. In addition, text with a background in the left-to-right arrangement showed the lowest accuracy. Caroux et al. [8] found that a complex background produced an inferior performance in visual searching. Lin [24] also showed that the horizontal arrangement of phonetic symbols brought about an inferior performance in sending Chinese text messages. A possible reason for this outcome may be that the average scanning distance from left to right is longer than that from top to bottom in a video, especially one with a background, resulting in a low accuracy. In order to see the characters in text clearly, a top-to-bottom arrangement generated a short scanning distance and resulted in a high accuracy. For the interaction between video type and arrangement, as shown in Figure 4, the animation with a left-to-right arrangement and text with a top-to-bottom arrangement had a better accuracy. It can be inferred that a left-to-right arrangement is suitable for animations while a top-to-bottom arrangement is appropriate for texts. Participants may be used to scanning objects on screens from the left to the right in their daily lives, resulting in a high accuracy for left-to-right animation. As previously mentioned, a short scanning distance was found for top-to-bottom text and also resulted in high accuracy. Finally, similar to the results in the three-way interaction, the left-to-right text in Figure 2 showed the lowest accuracy.
The results also indicated that the background was a significant factor. The accuracy of the video without a background (M = 0.604) was significantly lower than that in the video with a background (M = 0.518). Huang and Pashler [9] indicated that the difficulty of a visual search affected efficiency. Marlen et al. [10] also found that high visual complexity and high verbal ambiguity resulted in a low accuracy and slow response time on visual search tasks. In this study, the white color was set for the without background context and scenery was set for the with background context. Compared to the monochromatic color, scenery with multiple colors could produce more visual stimuli and result in a low accuracy.
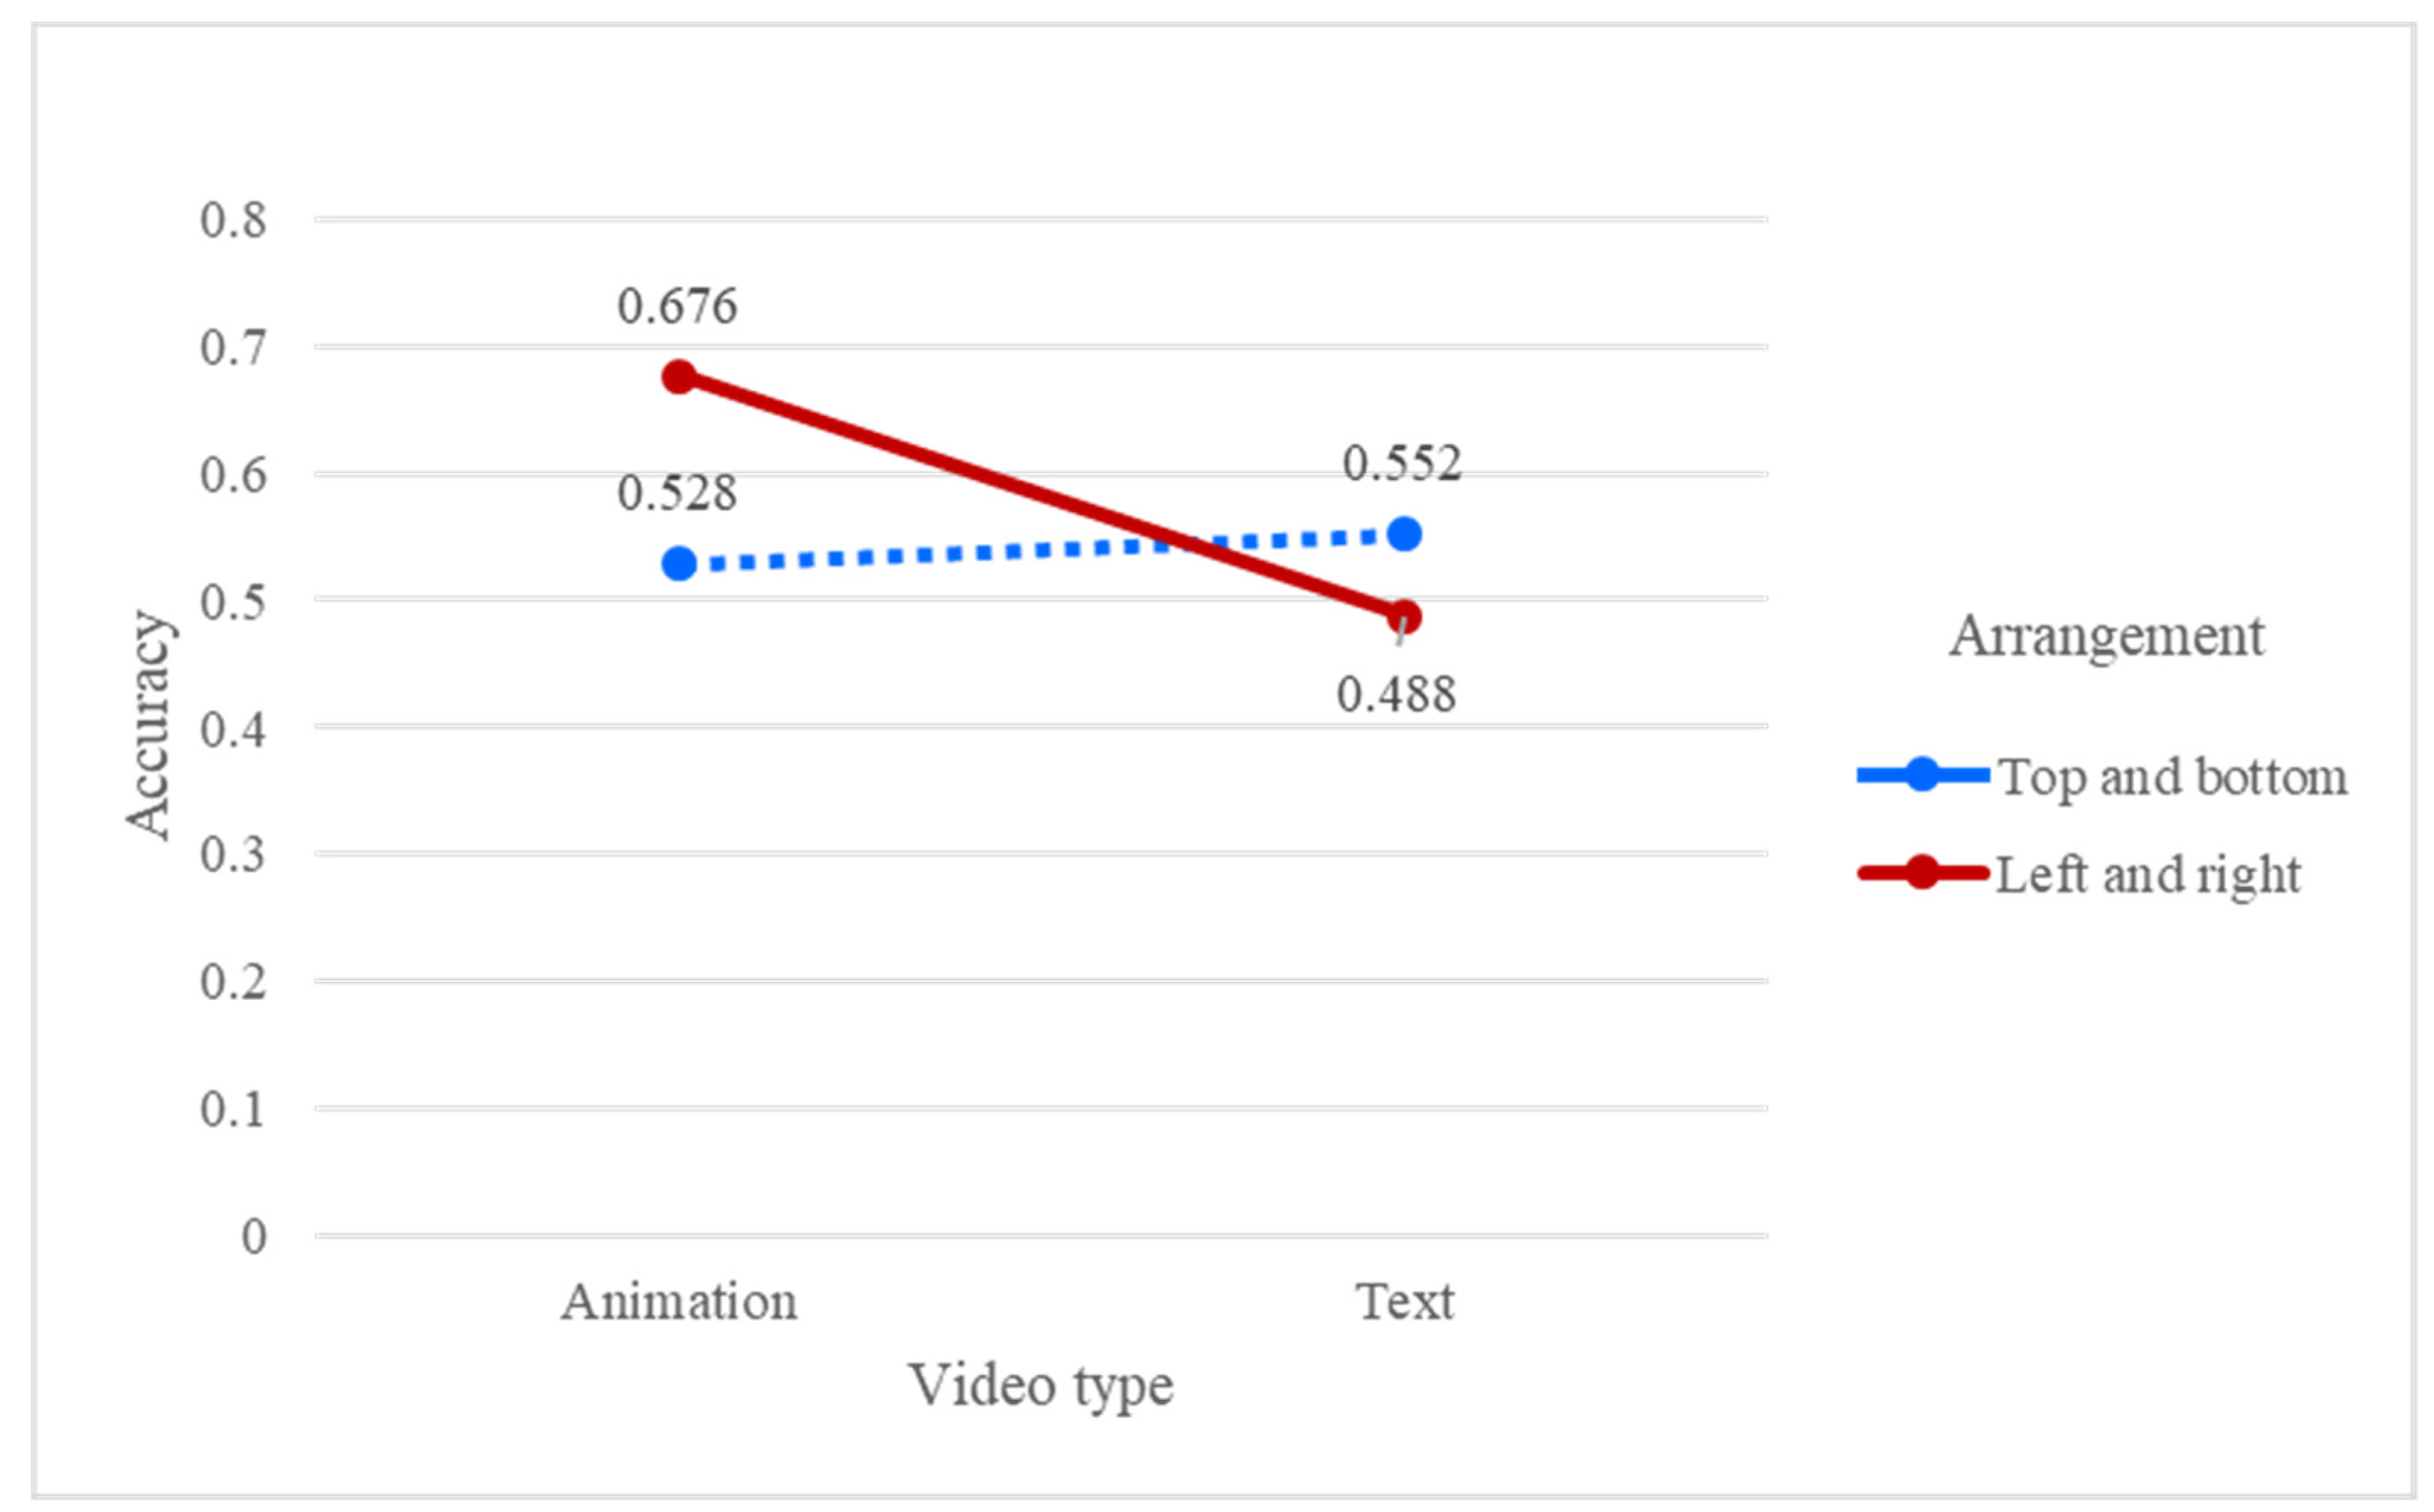
The results further indicated that video type was significant, with the accuracy of the text (M = 0.520) being significantly lower than that of the animation (M = 0.602). As participants have to spend more time in watching and understanding the meaning of texts, it makes sense that the accuracy of texts is lower than that of animation. The results from the interaction between video type and arrangement also showed that watching animation (M = 0.676) produced a higher accuracy than watching text (M = 0.488) in the left-to-right arrangement.
3.2. Number of Fixations
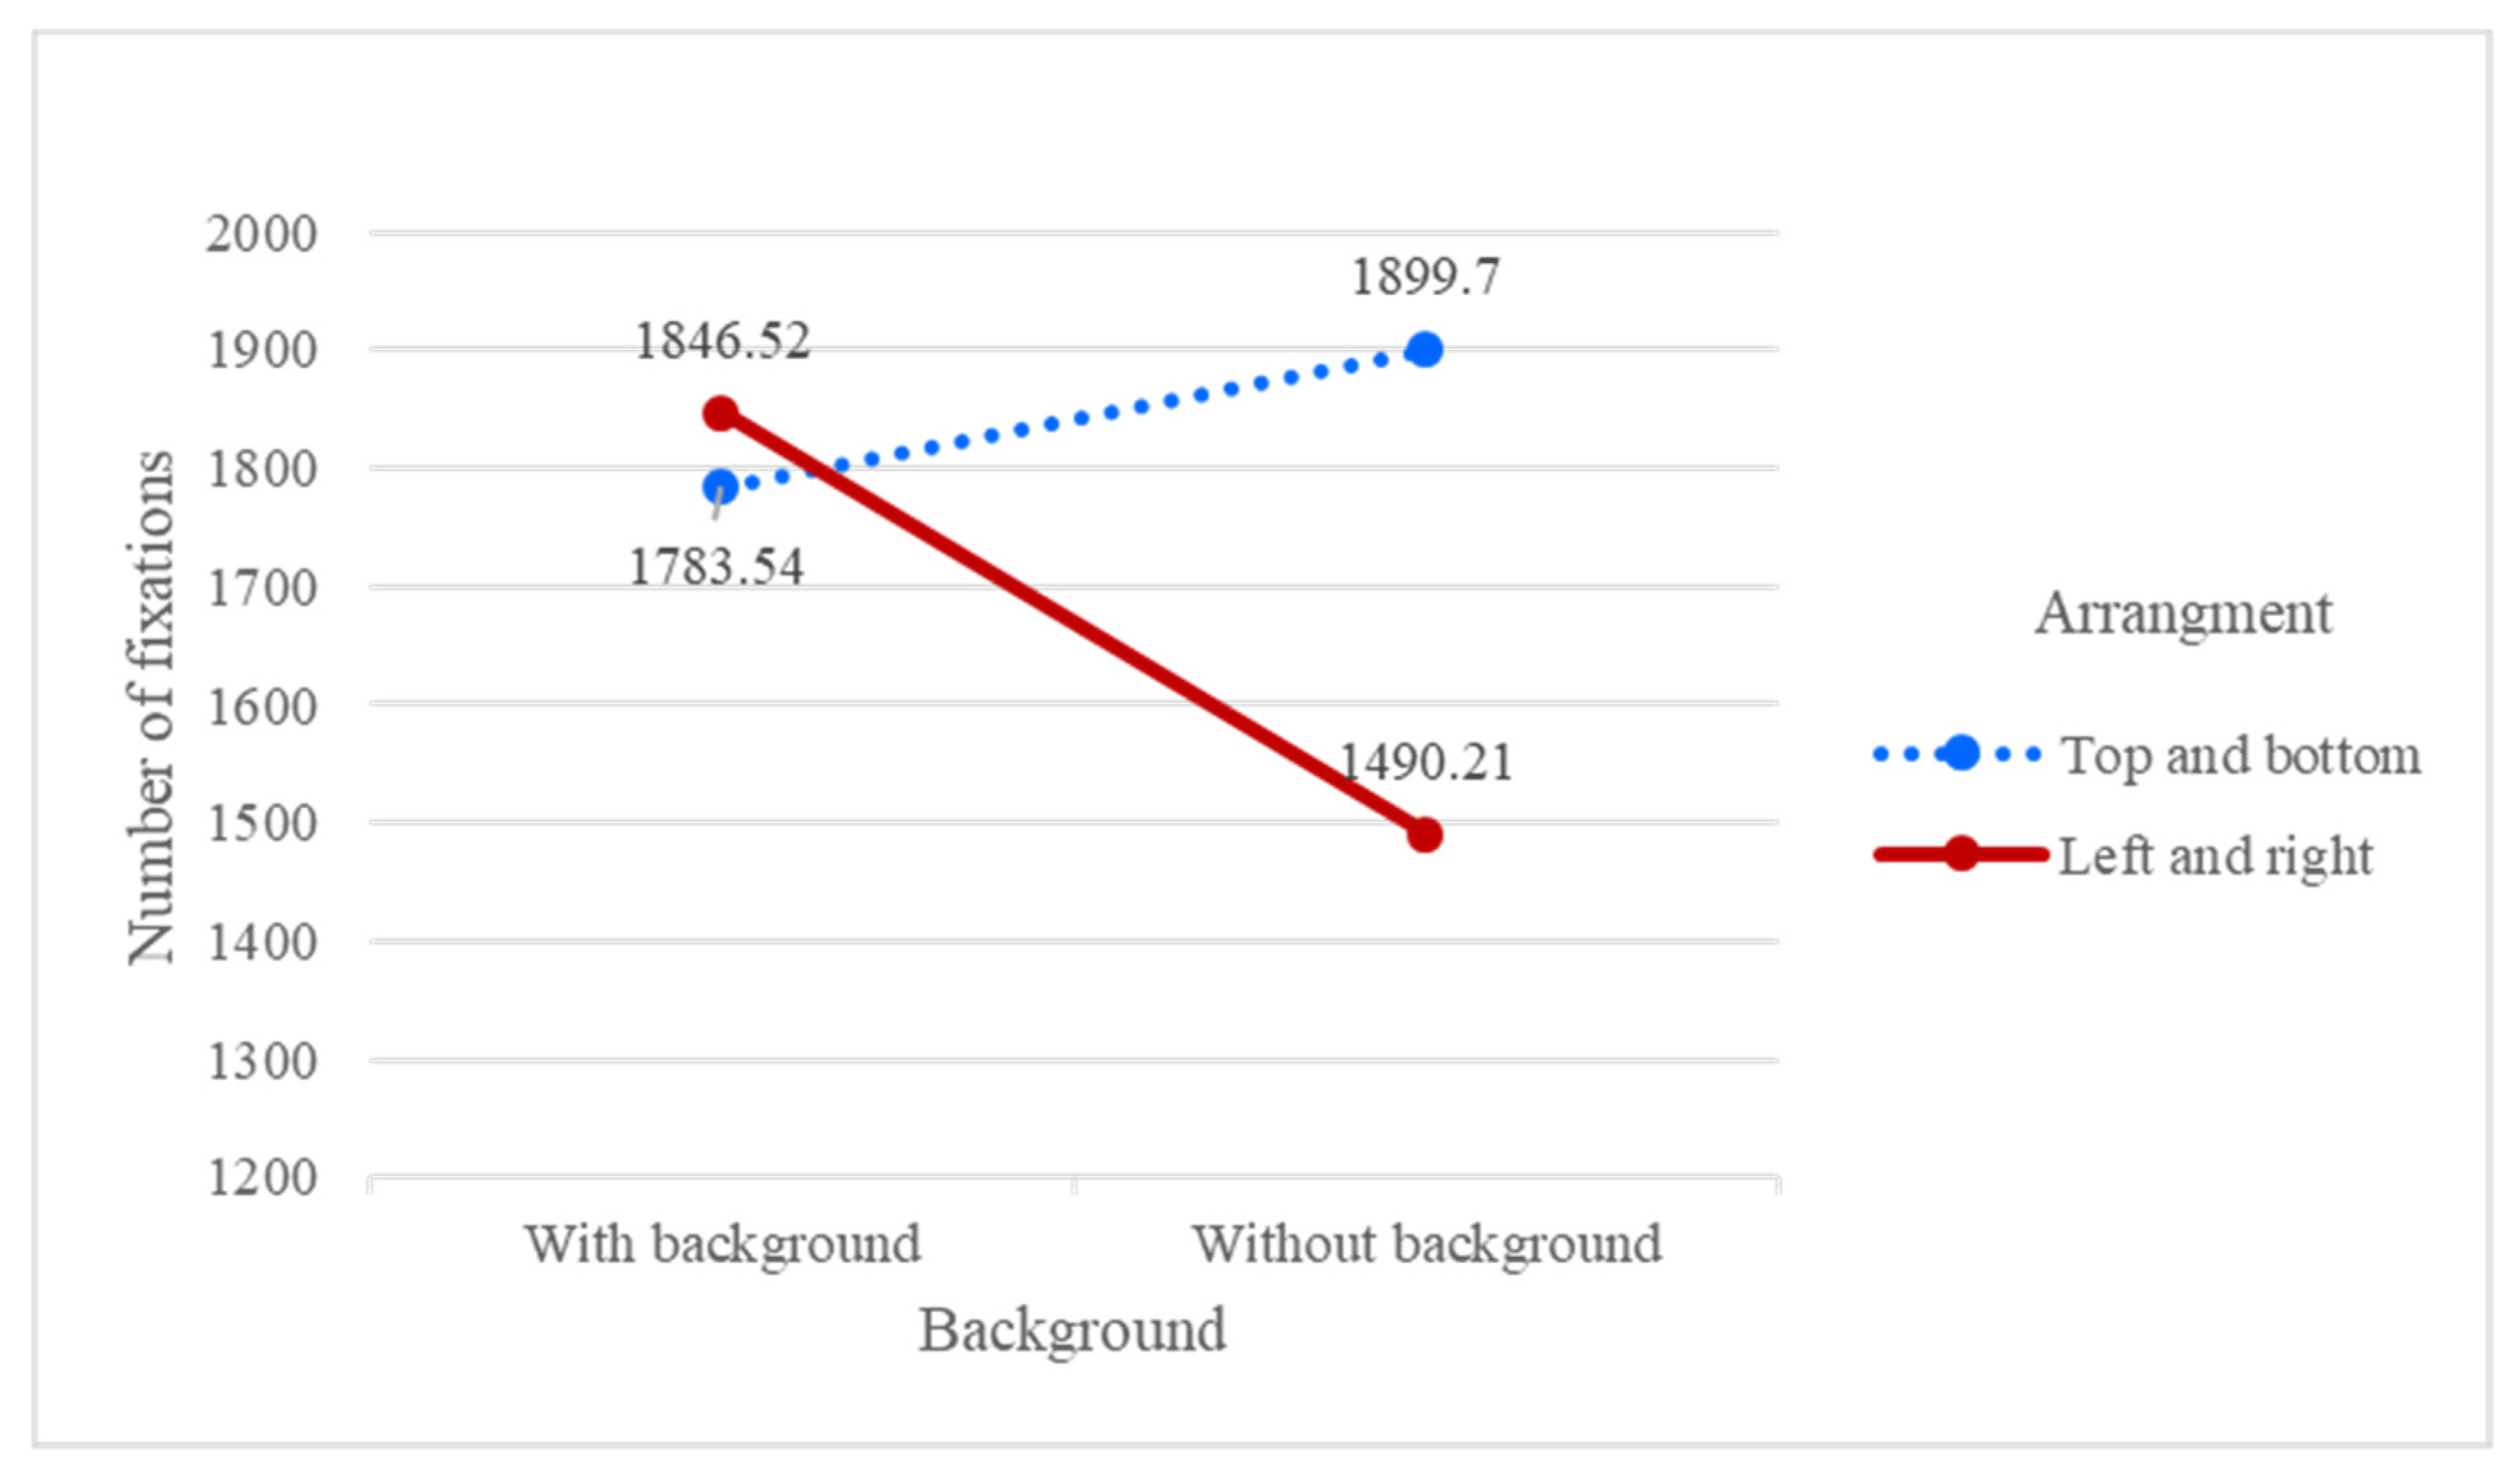
As shown in Table 1, the ANOVA results for the number of fixations indicated that background (F = 4.160, p < 0.05), video type (F = 4.391, p < 0.05), arrangement (F = 6.823, p < 0.05), and the interaction between background and arrangement (F = 5.832, p < 0.05) were the significant factors. For the interaction between background and arrangement, as shown in Figure 5, no significant difference was found with a background in the two arrangements. However, a significant difference (p < 0.05) was found for the two arrangements without a background, where left-to-right arrangement without a background had a small number of fixations. One possible reason for this may be that the participants are used watching left-to-right screens when watching less complex backgrounds, resulting in a lower number of fixations. On the other hand, the top-to-bottom arrangement generated a short scanning distance due to its convenient search from the top down. Although inducing more fixations, participants gave positive comments on it.
The results also indicated that the background was a significant factor. The number of fixations of the video without a background (M = 1694.954) was significantly lower than that with a background (M = 1815.030). Caroux et al. [8] showed that the structure of the background (lateral or radial) had an impact on the duration of fixations. The participants also reported that they had to concentrate on complex images, which resulted in more fixations. Lin and Chen [28] also concluded that the use of more visual cues (such as 3D images) induces a greater number of fixations than the use of less visual cues (such as 2D images).
The results also indicated that the video type was a significant factor. The number of fixations of the animation (M = 1676.024) was significantly lower than that of the text (M = 1833.960). Lin and Hsieh [13] indicated that the total fixation counts and average fixation duration of texts were more than those of pictures, whether for EFL beginners or intermediate level readers. In this study, the participants also reported that reading texts required more concentration and resulted in more fixations.
The results further demonstrated that the arrangement was a significant factor. The number of fixations of the left-to-right arrangement (M = 1668.364) was significantly lower than that of the top-to-bottom arrangement (M = 1841.620). The reason for this may be that participants are used to watching left-to-right screens, which results in fewer fixations. In addition, participants also considered the top-to-bottom arrangement convenient to scan. Although it induced more fixations, the participants made positive comments about it. Lin [24] showed that vertical phonetic arrangement has better operation performance than a vertical one in sending Chinese text messages.
3.3. Subjective Visual Fatigue
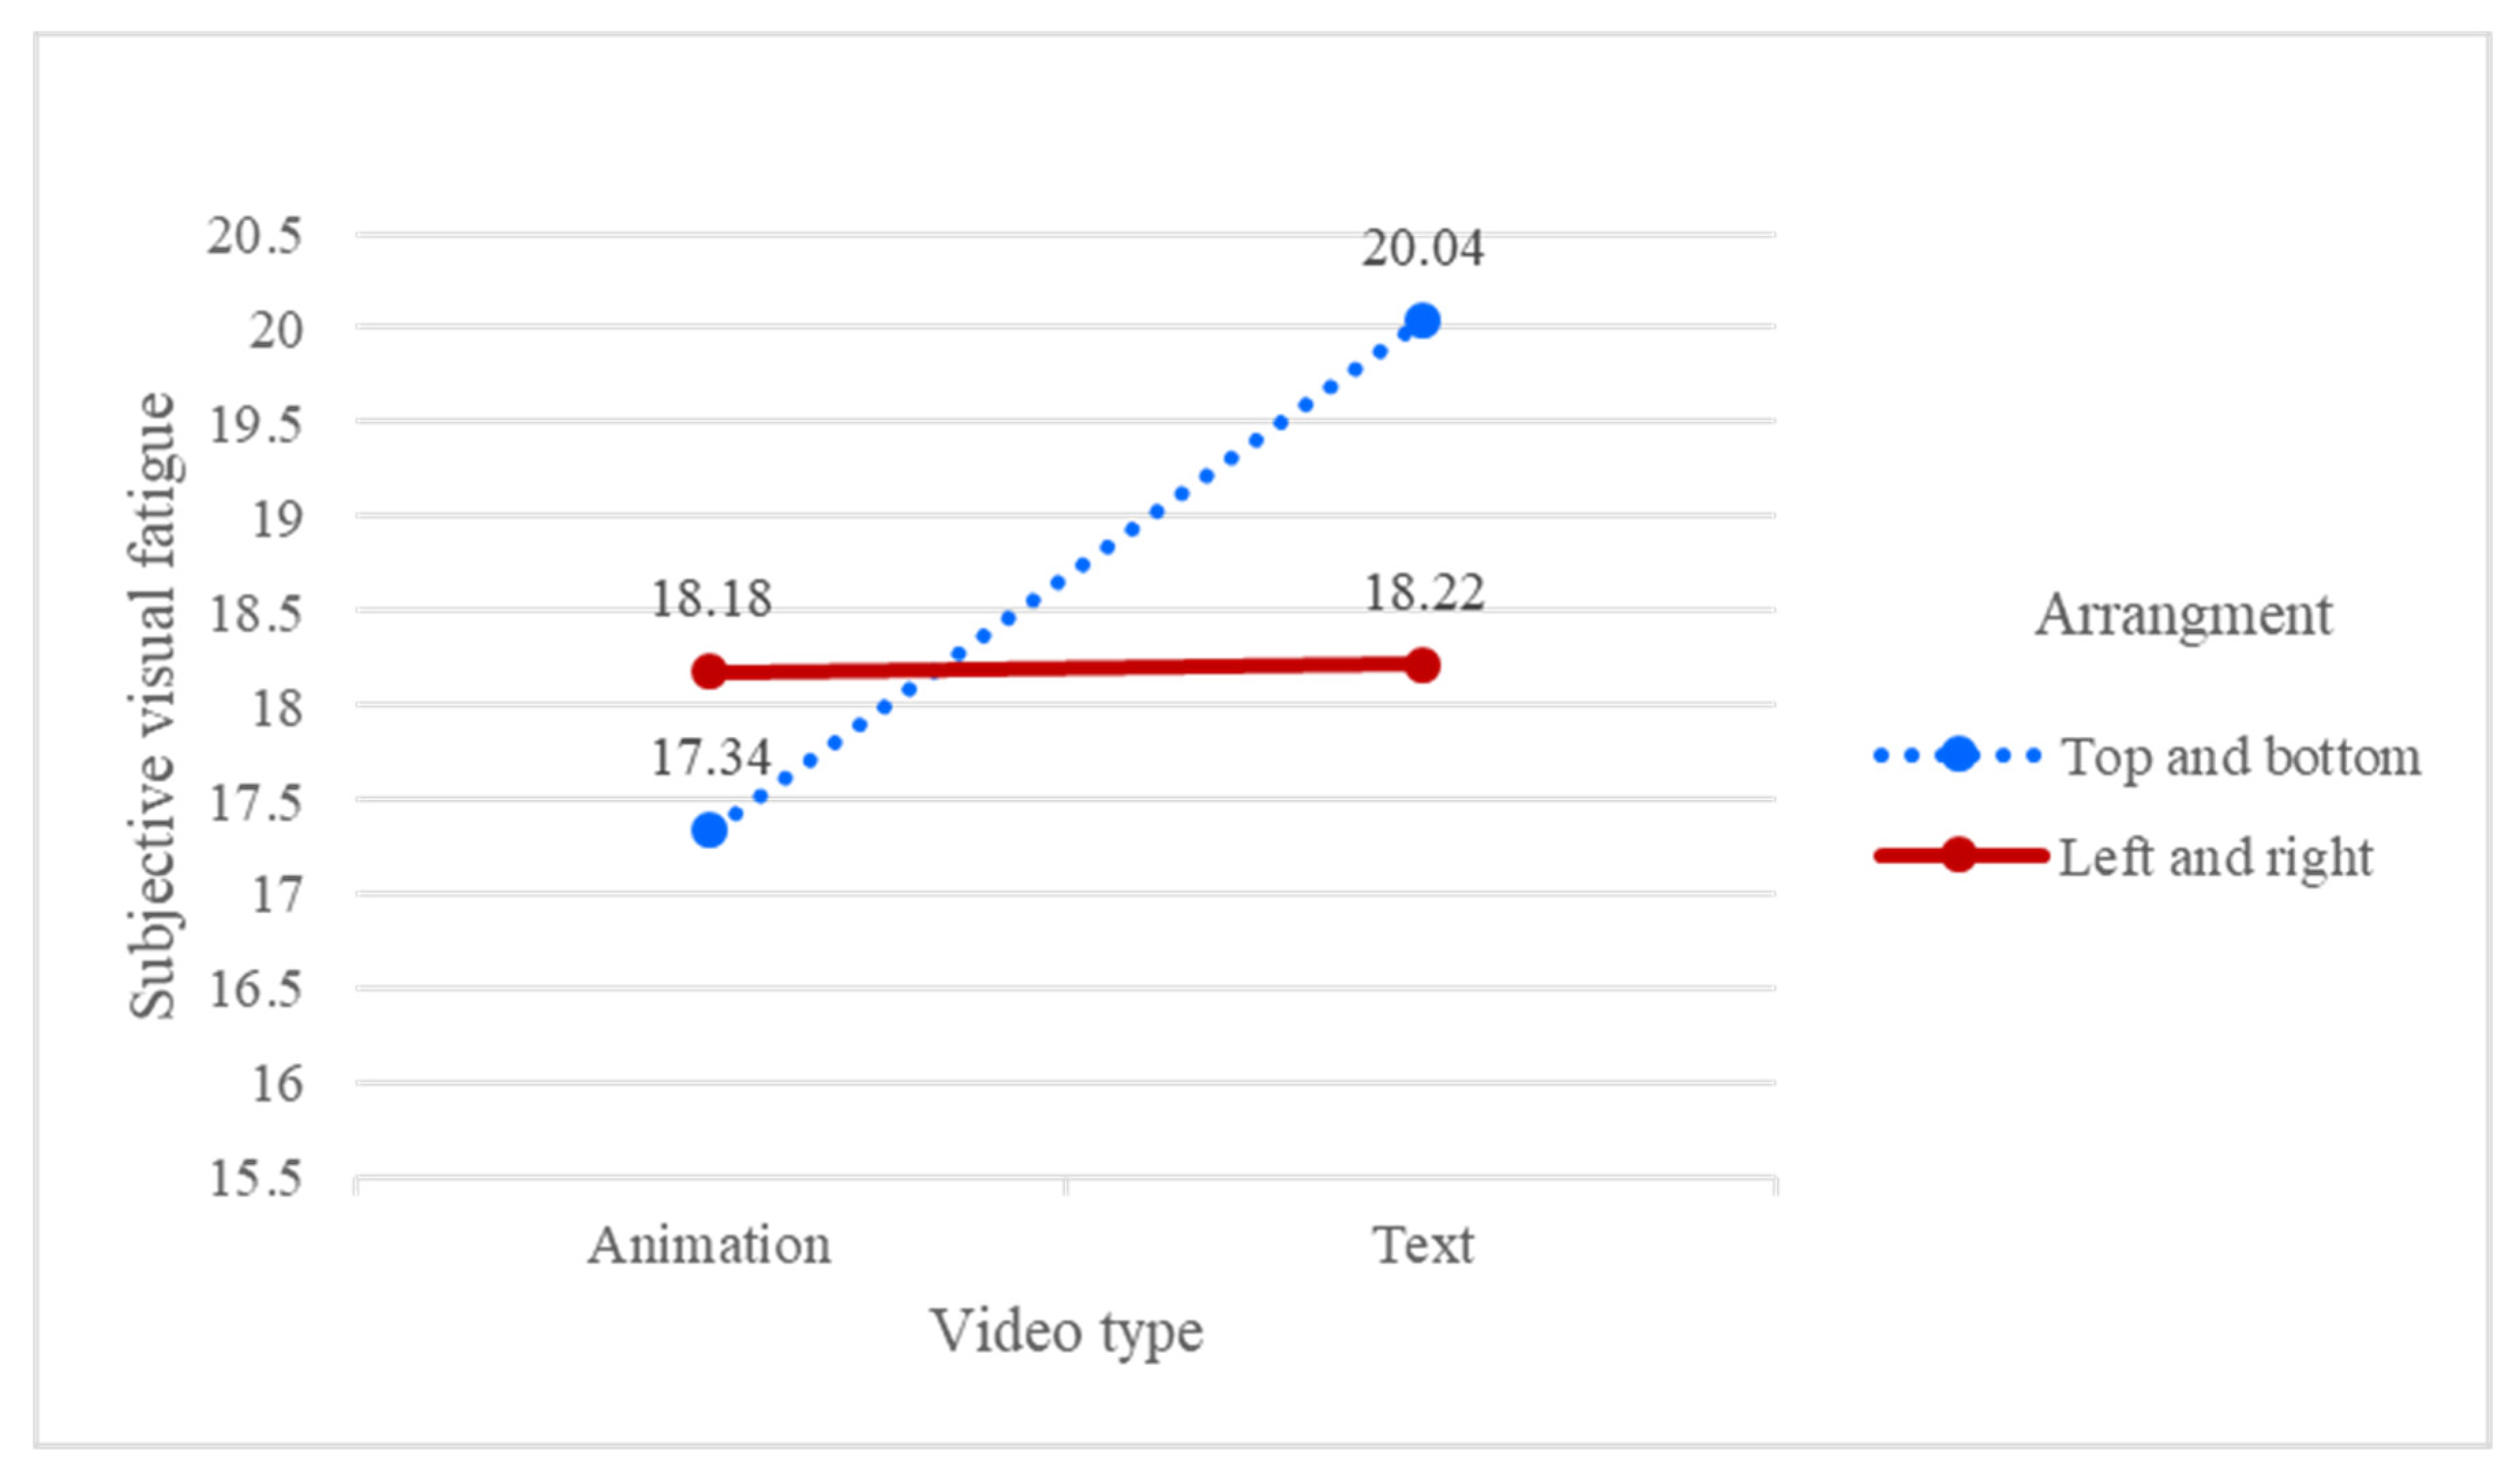
Table 1 shows that background (F = 7.664, p < 0.05), video type (F = 5.827, p < 0.05), and the interaction between video type and arrangement (F = 5.486, p < 0.05) were the significant factors. For the interaction between video type and arrangement, as shown in Figure 6, the subjective visual fatigue for the top-to-bottom arrangement was higher in texts than in animations. The reason for this may be that participants are used to reading from left to right; therefore, not much difference was found compared to the top-to-bottom arrangement. In addition, the top-to-bottom text induced more visual fatigue than the animation. As the participants had to watch texts more closely to distinguish differences, it is reasonable to conclude that watching texts induces more visual fatigue than watching animation.
The results also indicated that background was a significant factor. The subjective visual fatigue of the without background context (M = 17.03) was significantly lower than the with background context (M = 19.75). Antes [7] demonstrated that more difficult search tasks produced higher visual fatigue. Lin and Chen [28] also found that more visual cues (3D images) induce more visual fatigue (the scores of simulator sickness questionnaire) than fewer visual cues (2D images). The participants also reported that they had to concentrate on complex images, which resulted in a high visual fatigue.
The results also indicated that the video type was a significant factor. The subjective visual fatigue of animation (M = 17.76) was significantly lower than that of the text (M = 19.13). In general, reading texts produces more visual fatigue than reading animation. In this study, the participants also reported that reading texts required more concentration and resulted in a high visual fatigue.
3.4. Scan Path
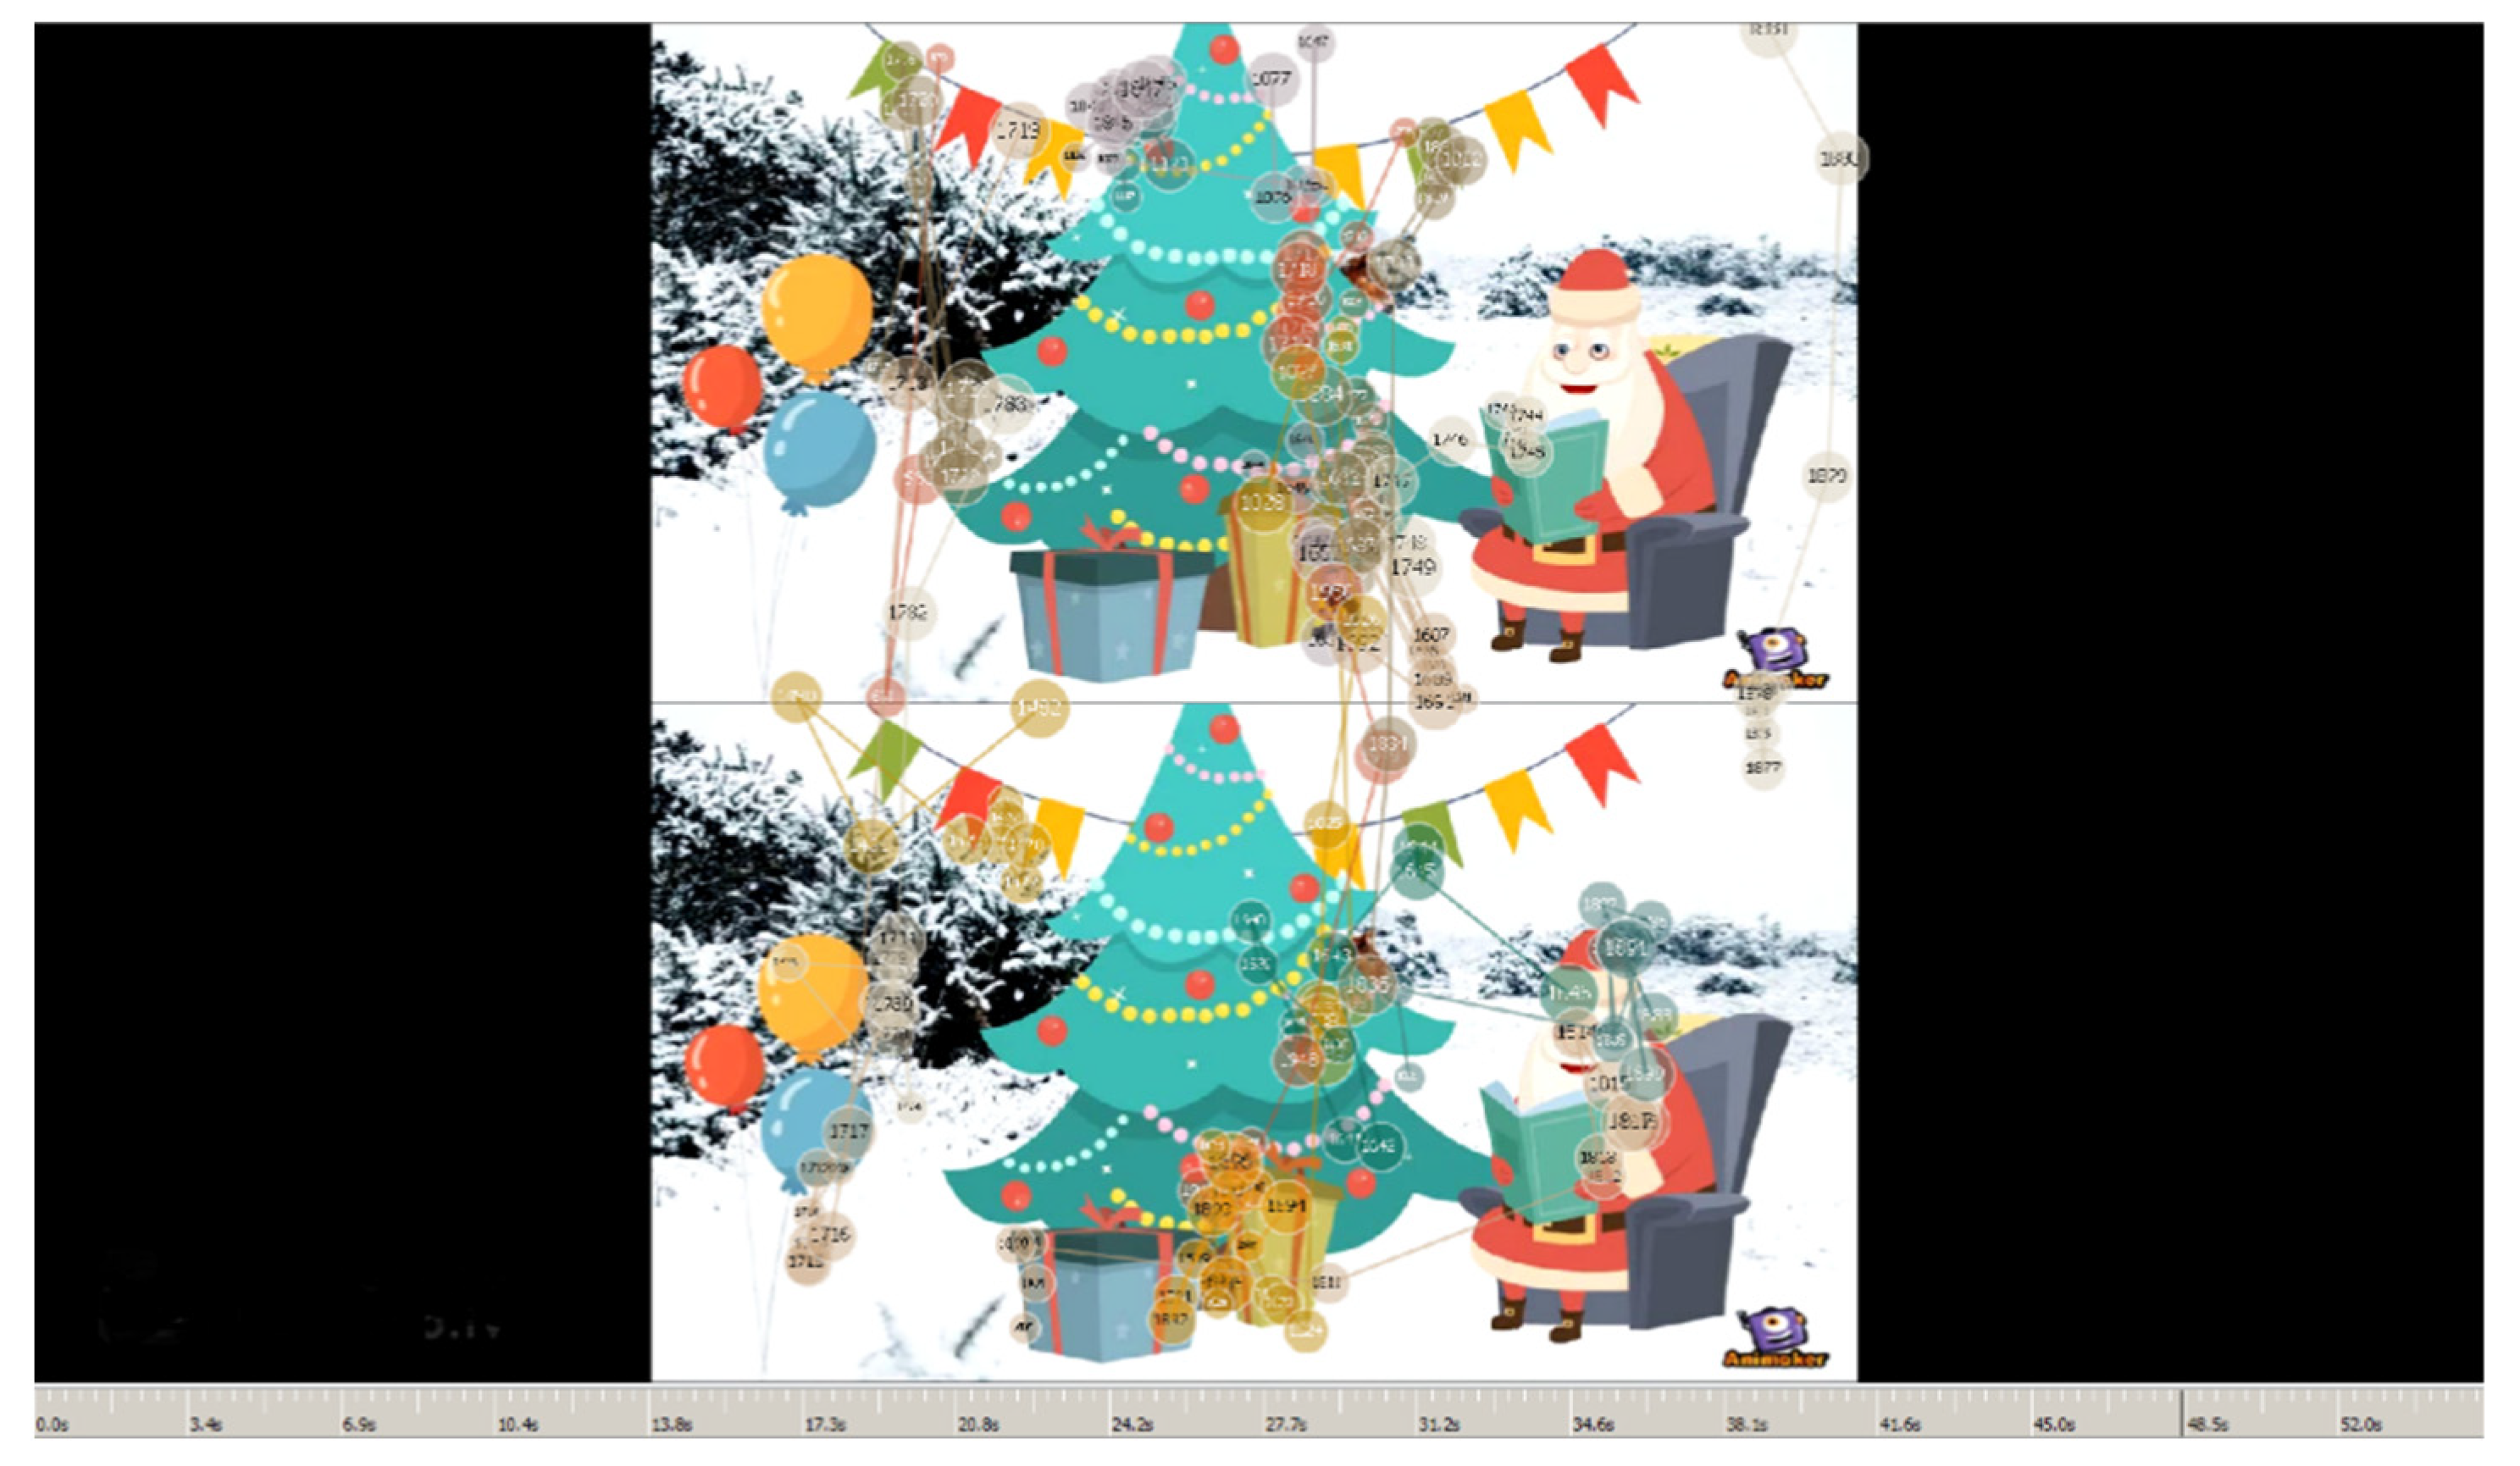
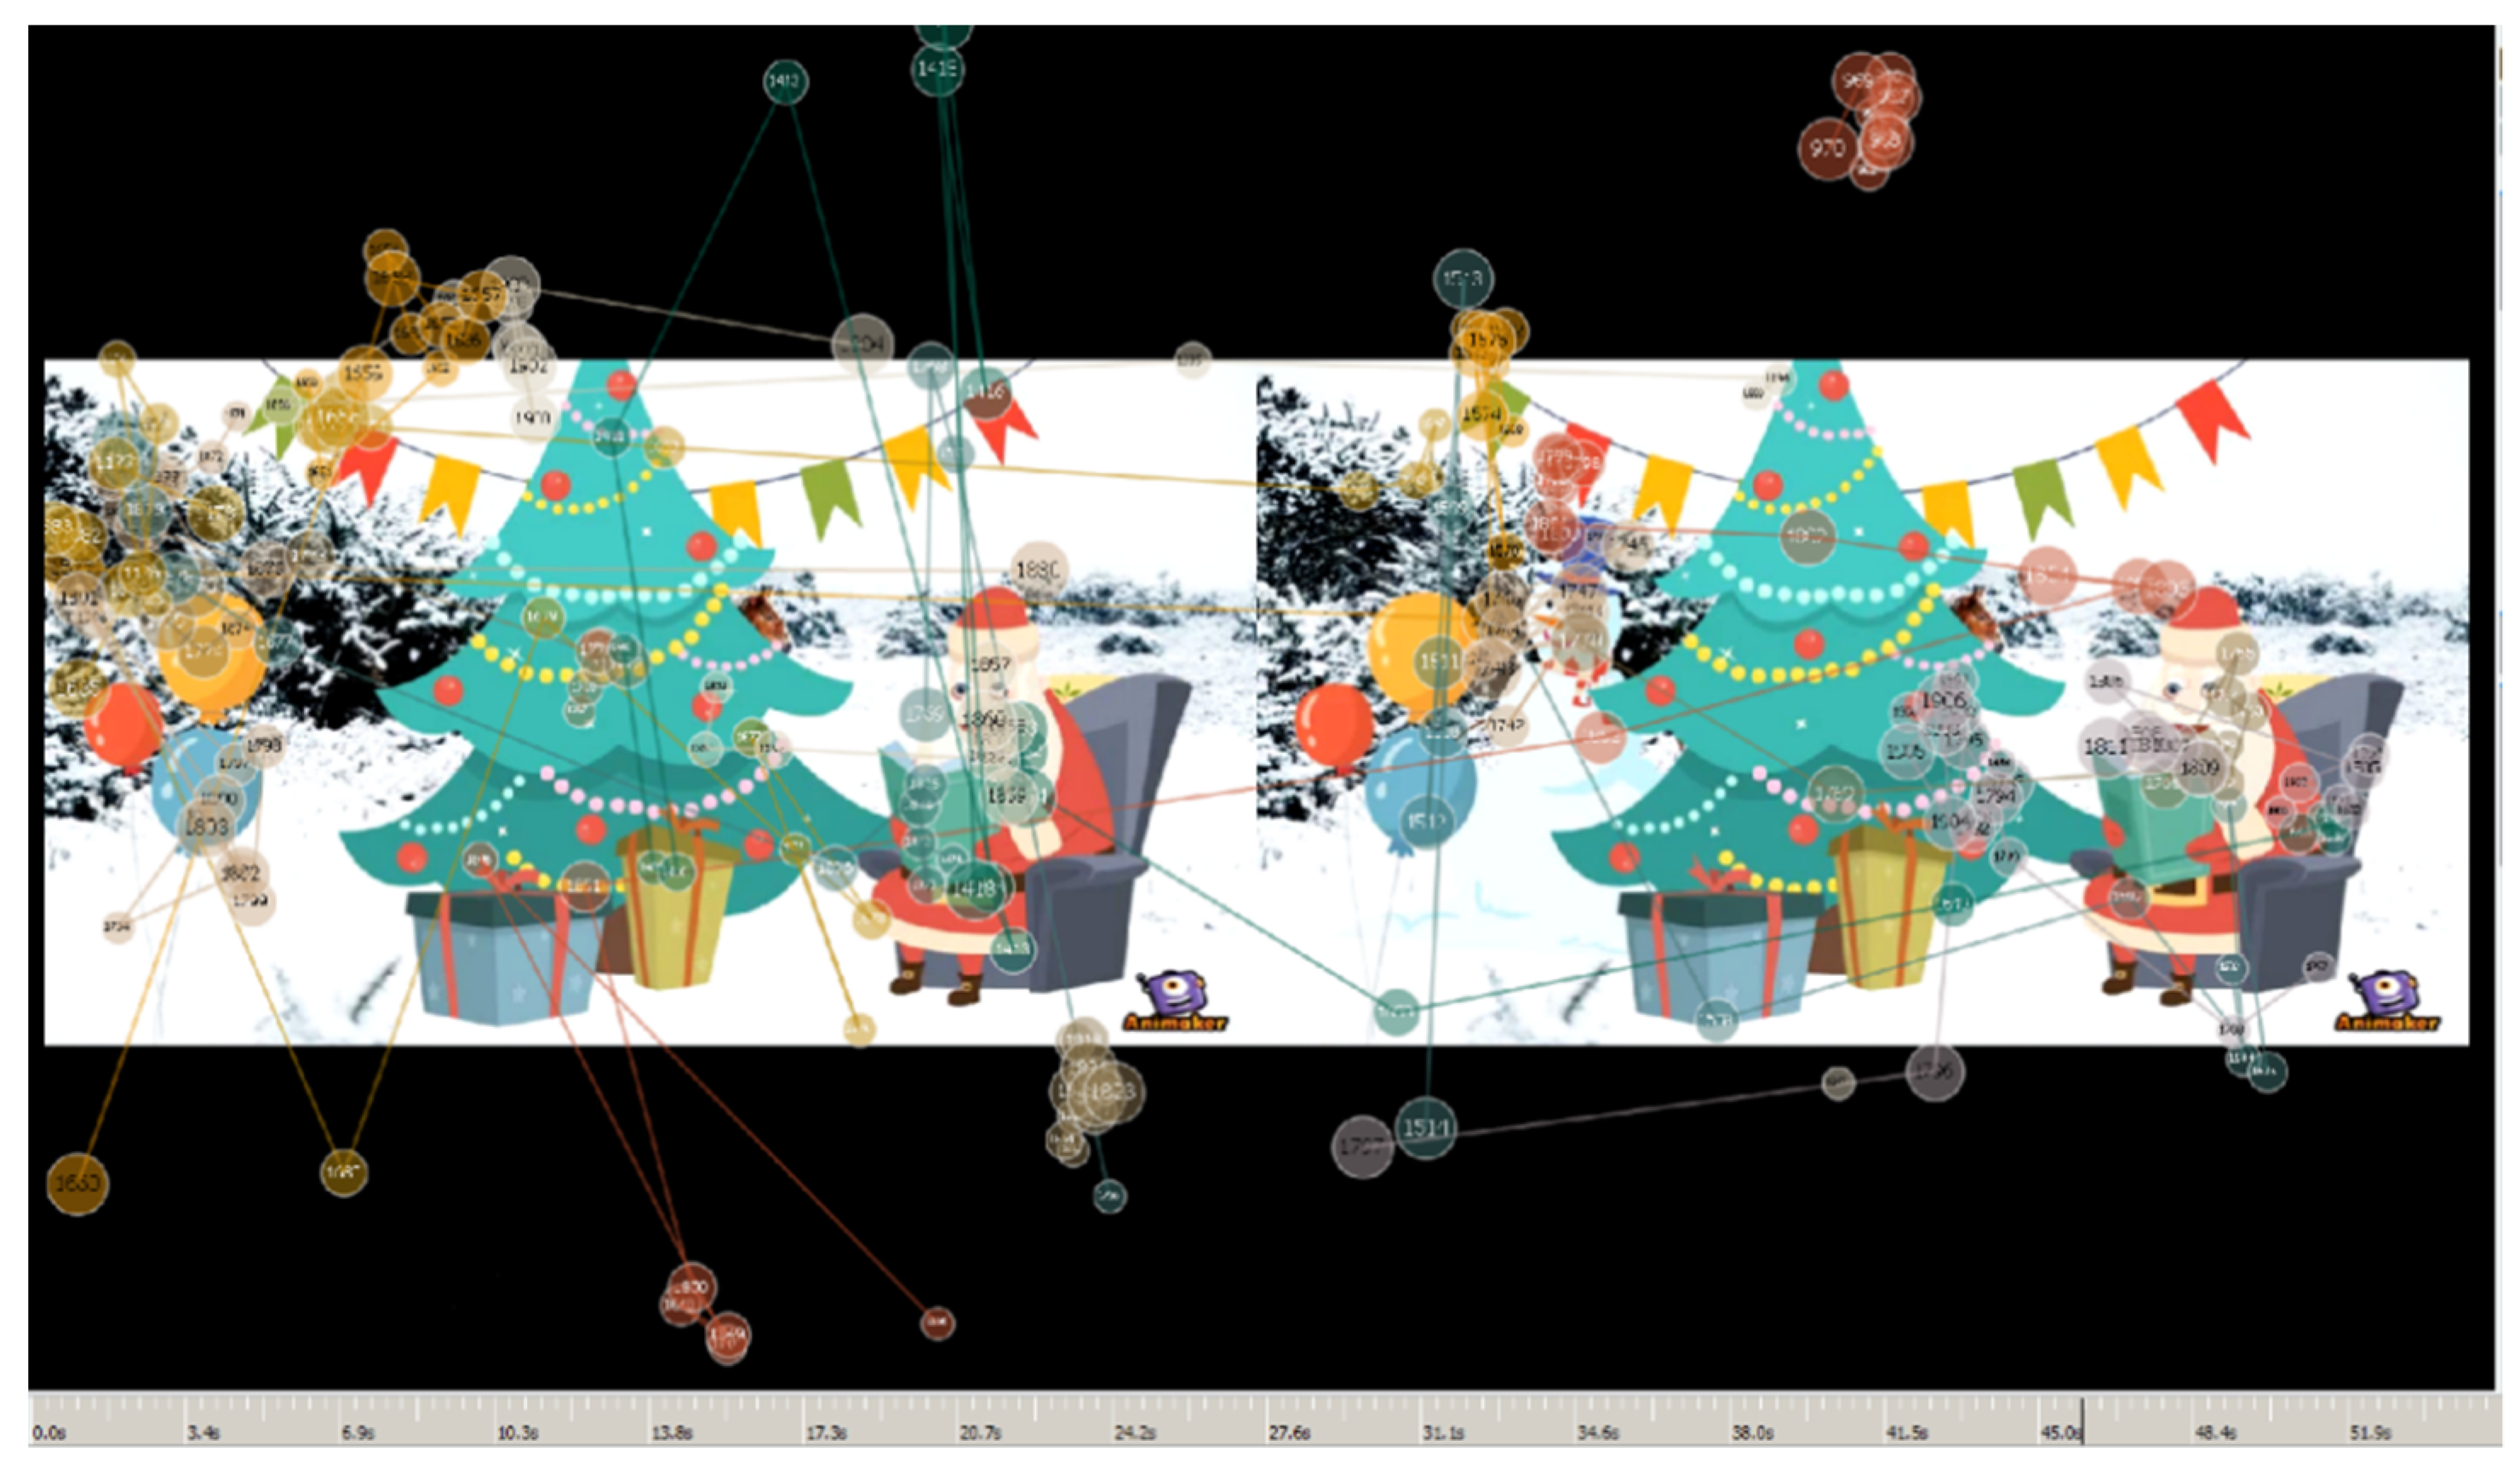
As the scan paths of the two arrangements were differential, we conducted a comparison, which we discuss in this section. As shown in Figure 7, participants mainly conducted the search from the top down, and the scan paths were more concentrated compared to the left-to-right arrangement. As mentioned in Section 3.2, the top-to-bottom arrangement was convenient to scan due to the short scanning distance, which may be the reason the scan paths were more concentrated. On the other hand, participants mainly conducted the search from left to right in Figure 8, and the scan paths were more scattered, with some of them being outside the frame. The reason for this may be that the scanning distance of the left-to-right arrangement is longer than that of the top-to-bottom arrangement, resulting in easier sight deviation and leading to fixation points appearing outside the frame.
4. Conclusions
This study investigated the effect of background (with background, without background), video type (animation, text), and arrangement (left-to-right, top-to-bottom) on accuracy, number of fixations, and subjective visual fatigue. The results showed that background had significant effects on accuracy and subjective visual fatigue, where the accuracy and subjective visual fatigue without a background were better than those with a background. The results also indicated that video type had significant effects on accuracy and subjective visual fatigue, where the accuracy and subjective visual fatigue for animation were better than for text. Finally, arrangement had a significant effect on number of fixations, where the top-to-bottom arrangement produced a greater number of fixations.
The main contribution of this study is to provide suggestions for game manufacturers when designing a “Spot the Difference” game. First, using left-to-right animations without a background produces a better search performance. In the top-to-bottom arrangement, the hot zones of the gaze are concentrated (not out of the search range) and produce more fixations. This information can be used as a reference when designing games in the future. To design an easier game, it is essential to avoid adopting text videos (especially the left-to-right arrangement) so as not to reduce players’ accuracy.
The limitation of the current study is that participants were asked to watch the videos for only 1 min due to large amount of eye tracking data produced. In addition, we could adjust the background colors to create color differences to understand the impacts of different color combinations on search performance. Furthermore, the animation and text could be integrated into a video to investigate its impact on search performance. Finally, the length of the video, the number of target objects, and more types of games could be considered in future studies.
Author Contributions
Conceptualization, P.-H.L.; methodology, P.-H.L. and H.-J.C.; software, Z.-Q.W.; validation, P.-H.L. and H.-J.C.; formal analysis, P.-H.L. and Z.-Q.W.; investigation, P.-H.L. and H.-J.C.; resources, P.-H.L.; data curation, Z.-Q.W., writing—original draft preparation, P.-H.L.; writing—review and editing, P.-H.L. and H.-J.C.; visualization, Z.-Q.W.; supervision, P.-H.L.; project administration, P.-H.L.; funding acquisition, P.-H.L. All authors have read and agreed to the published version of the manuscript.
Funding
This research was funded by the Ministry of Science and Technology, Taiwan, grant number MOST-105-2221-E-131-038-MY2.
Institutional Review Board Statement
The study was conducted according to the guidelines of the Declaration of Helsinki, and approved by the Institutional Review Board of National Cheng Kung University Hospital (protocol code B-ER-105-208 and date of approval: 16 September 2016).
Informed Consent Statement
Informed consent was obtained from all subjects involved in the study.
Data Availability Statement
Data is contained within the article.
Conflicts of Interest
The authors declare no conflict of interest.
References
- Azkarai, A.; García Mayo, M.; Oliver, R. The effect of task repetition on the patterns of interaction of ESL children. ITL Int. J. Appl. Linguistics 2020, 171, 90–112. [Google Scholar] [CrossRef]
- Martini, M.; Riedlsperger, B.; Maran, T.; Sachse, P. The Effect of Post-Learning Wakeful Rest on the Retention of Second Language Learning Material over the Long Term. Curr. Psychol. 2020, 39, 299–306. [Google Scholar] [CrossRef] [Green Version]
- Sandow, R.; Robinson, J. ‘Doing Cornishness’ in the English Periphery: Embodying Ideology Through Anglo-Cornish Dialect Lexis. In Sociolinguistics in England; Braber, N., Jansen, S., Eds.; Macmillan Publishers Ltd: London, UK, 2018; pp. 333–362. [Google Scholar]
- Tulloch, K.; Pammer, K. Tablet computer games to measure dorsal stream performance in good and poor readers. Neuropsychologia 2019, 130, 92–99. [Google Scholar] [CrossRef] [PubMed]
- MackWorth, N.H.; Morandi, A.J. The gaze selects informative details within pictures. Percept. Psychophys. 1967, 2, 547–552. [Google Scholar] [CrossRef]
- Baker, M.A.; Loeb, M. Implications of measurement of eye fixations for a psychophysics of form perception. Percept. Psychophys. 1973, 13, 185–192. [Google Scholar] [CrossRef] [Green Version]
- Antes, J.R. The time course of picture viewing. J. Exp. Psychol. 1974, 103, 62–70. [Google Scholar] [CrossRef]
- Caroux, L.; Bigot, L.; Vibert, N. Impact of the motion and visual complexity of the background on players’ performance in video game-like displays. Ergonomics 2013, 56, 1863–1876. [Google Scholar] [CrossRef]
- Huang, L.; Pashler, H. Attention capacity and task difficulty in visual search. Cognition 2005, 94, 101–111. [Google Scholar] [CrossRef] [Green Version]
- Marlen, T.; Wermeskerken, M.; Gog, T. Effects of visual complexity and ambiguity of verbal instructions on target identification. J. Cogn. Psychol. 2019, 31, 206–214. [Google Scholar] [CrossRef] [Green Version]
- Eital, A.; Scheiter, K.P. Picture or Text First? Explaining Sequence Effects when Learning with Pictures and Text. Educ. Psychol. Rev. 2015, 27, 153–180. [Google Scholar] [CrossRef]
- Lin, P.-H.; Chin, C.-W. Investigation of Chinese reading comprehension performance on mass rapid transit. Int. J. Ind. Ergon. 2021, 82, 103099. [Google Scholar] [CrossRef]
- Lin, S.S.J.; Hsieh, M.Y. Differences between EFL Beginners and Intermediate Level Readers When Reading Onscreen Narrative Text with Pictures: A Study of Eye Movements as a Guide to Personalization. Int. J. Hum. Comput. Interact. 2019, 35, 299–312. [Google Scholar] [CrossRef]
- Levie, W.H.; Lentz, R. Effects of text illustrations: A review of research. Ectj 1982, 30, 195–232. [Google Scholar] [CrossRef]
- Peeck, J. Increasing picture effects in learning from illustrated text. Learn. Instr. 1993, 3, 227–238. [Google Scholar] [CrossRef]
- Sanchez, C.; Wiley, J. An examination of the seductive details effect in terms of working memory capacity. Mem. Cogn. 2010, 34, 344–355. [Google Scholar] [CrossRef] [PubMed] [Green Version]
- Giacaman, N.; Sinnen, O.; Adams, J. Visual analogy videos for understanding fundamental parallel scheduling policies. J. Parallel Distrib. Comput. 2021, 153, 64–74. [Google Scholar] [CrossRef]
- Mubarak, A.A.; Ahmed, S.A.; Cao, H. MOOC-ASV: Analytical statistical visual model of learners’ interaction in videos of MOOC courses. Interact. Learn. Environ. 2021, 1–16. [Google Scholar] [CrossRef]
- Dashtipour, K.; Gogate, M.; Cambria, E.; Hussain, A. A novel context-aware multimodal framework for persian sentiment analysis. Neurocomputing 2021. [Google Scholar] [CrossRef]
- Ellis, A.W.; Miller, D. Left and wrong in adverts: Neuropsychological correlates of aesthetic preference. Br. J. Psychol. 1981, 72, 225–229. [Google Scholar] [CrossRef]
- Henderson, J.M.; Hollingworth, A. High-level scene perception. Annu. Rev. Psychol. 1999, 50, 243–271. [Google Scholar] [CrossRef] [Green Version]
- Laarni, J. Searching for Optimal Methods of Presenting Dynamic Text on Different Types of Screens. In The Second Nordic Conference on Human-Computer Interaction; Bertelsen, O.W., Bodker, S., Kuutti, K., Eds.; ACM Press: New York, NY, USA, 2002; pp. 217–220. [Google Scholar]
- Laarni, J.; Simola, J.; Kojo, I.; Risto, N. Reading Vertical Text from a Computer Screen. Behav. Inf. Technol. 2004, 23, 75–82. [Google Scholar] [CrossRef]
- Lin, P.H. Investigation of Chinese text entry performance for mobile display interfaces. Ergonomics 2015, 58, 107–117. [Google Scholar] [CrossRef] [PubMed]
- Colenbrander, A. Visual standards: Aspects and ranges of vision loss with emphasis on population surveys. Rep. Int. Counc. Ophthalmol. 2002, 2, 1–33. [Google Scholar]
- Wikipedia. Available online: https://en.wikipedia.org/wiki/Fixation_(visual) (accessed on 26 April 2021).
- Heuer, H.; Hollendiek, G.; Kröger, H.; Römer, T. Die Ruhelage der Augen and ihr EinfluB auf Beobachtungsabatand und visuelle Ermudung bei Bildschirmarbeit [Rest position of the eyes and its effect on viewing distance and visual fatigue in computer display work]. Z. Exp. Angew. Psychol. 1989, 36, 538–566. [Google Scholar] [PubMed]
- Lin, P.H.; Chen, J.H. Effects of video type, display technique, and ambient illumination on visual and physiological performance. J. Ambient. Intell. Humaniz. Comput. 2020, 1–8. [Google Scholar] [CrossRef]
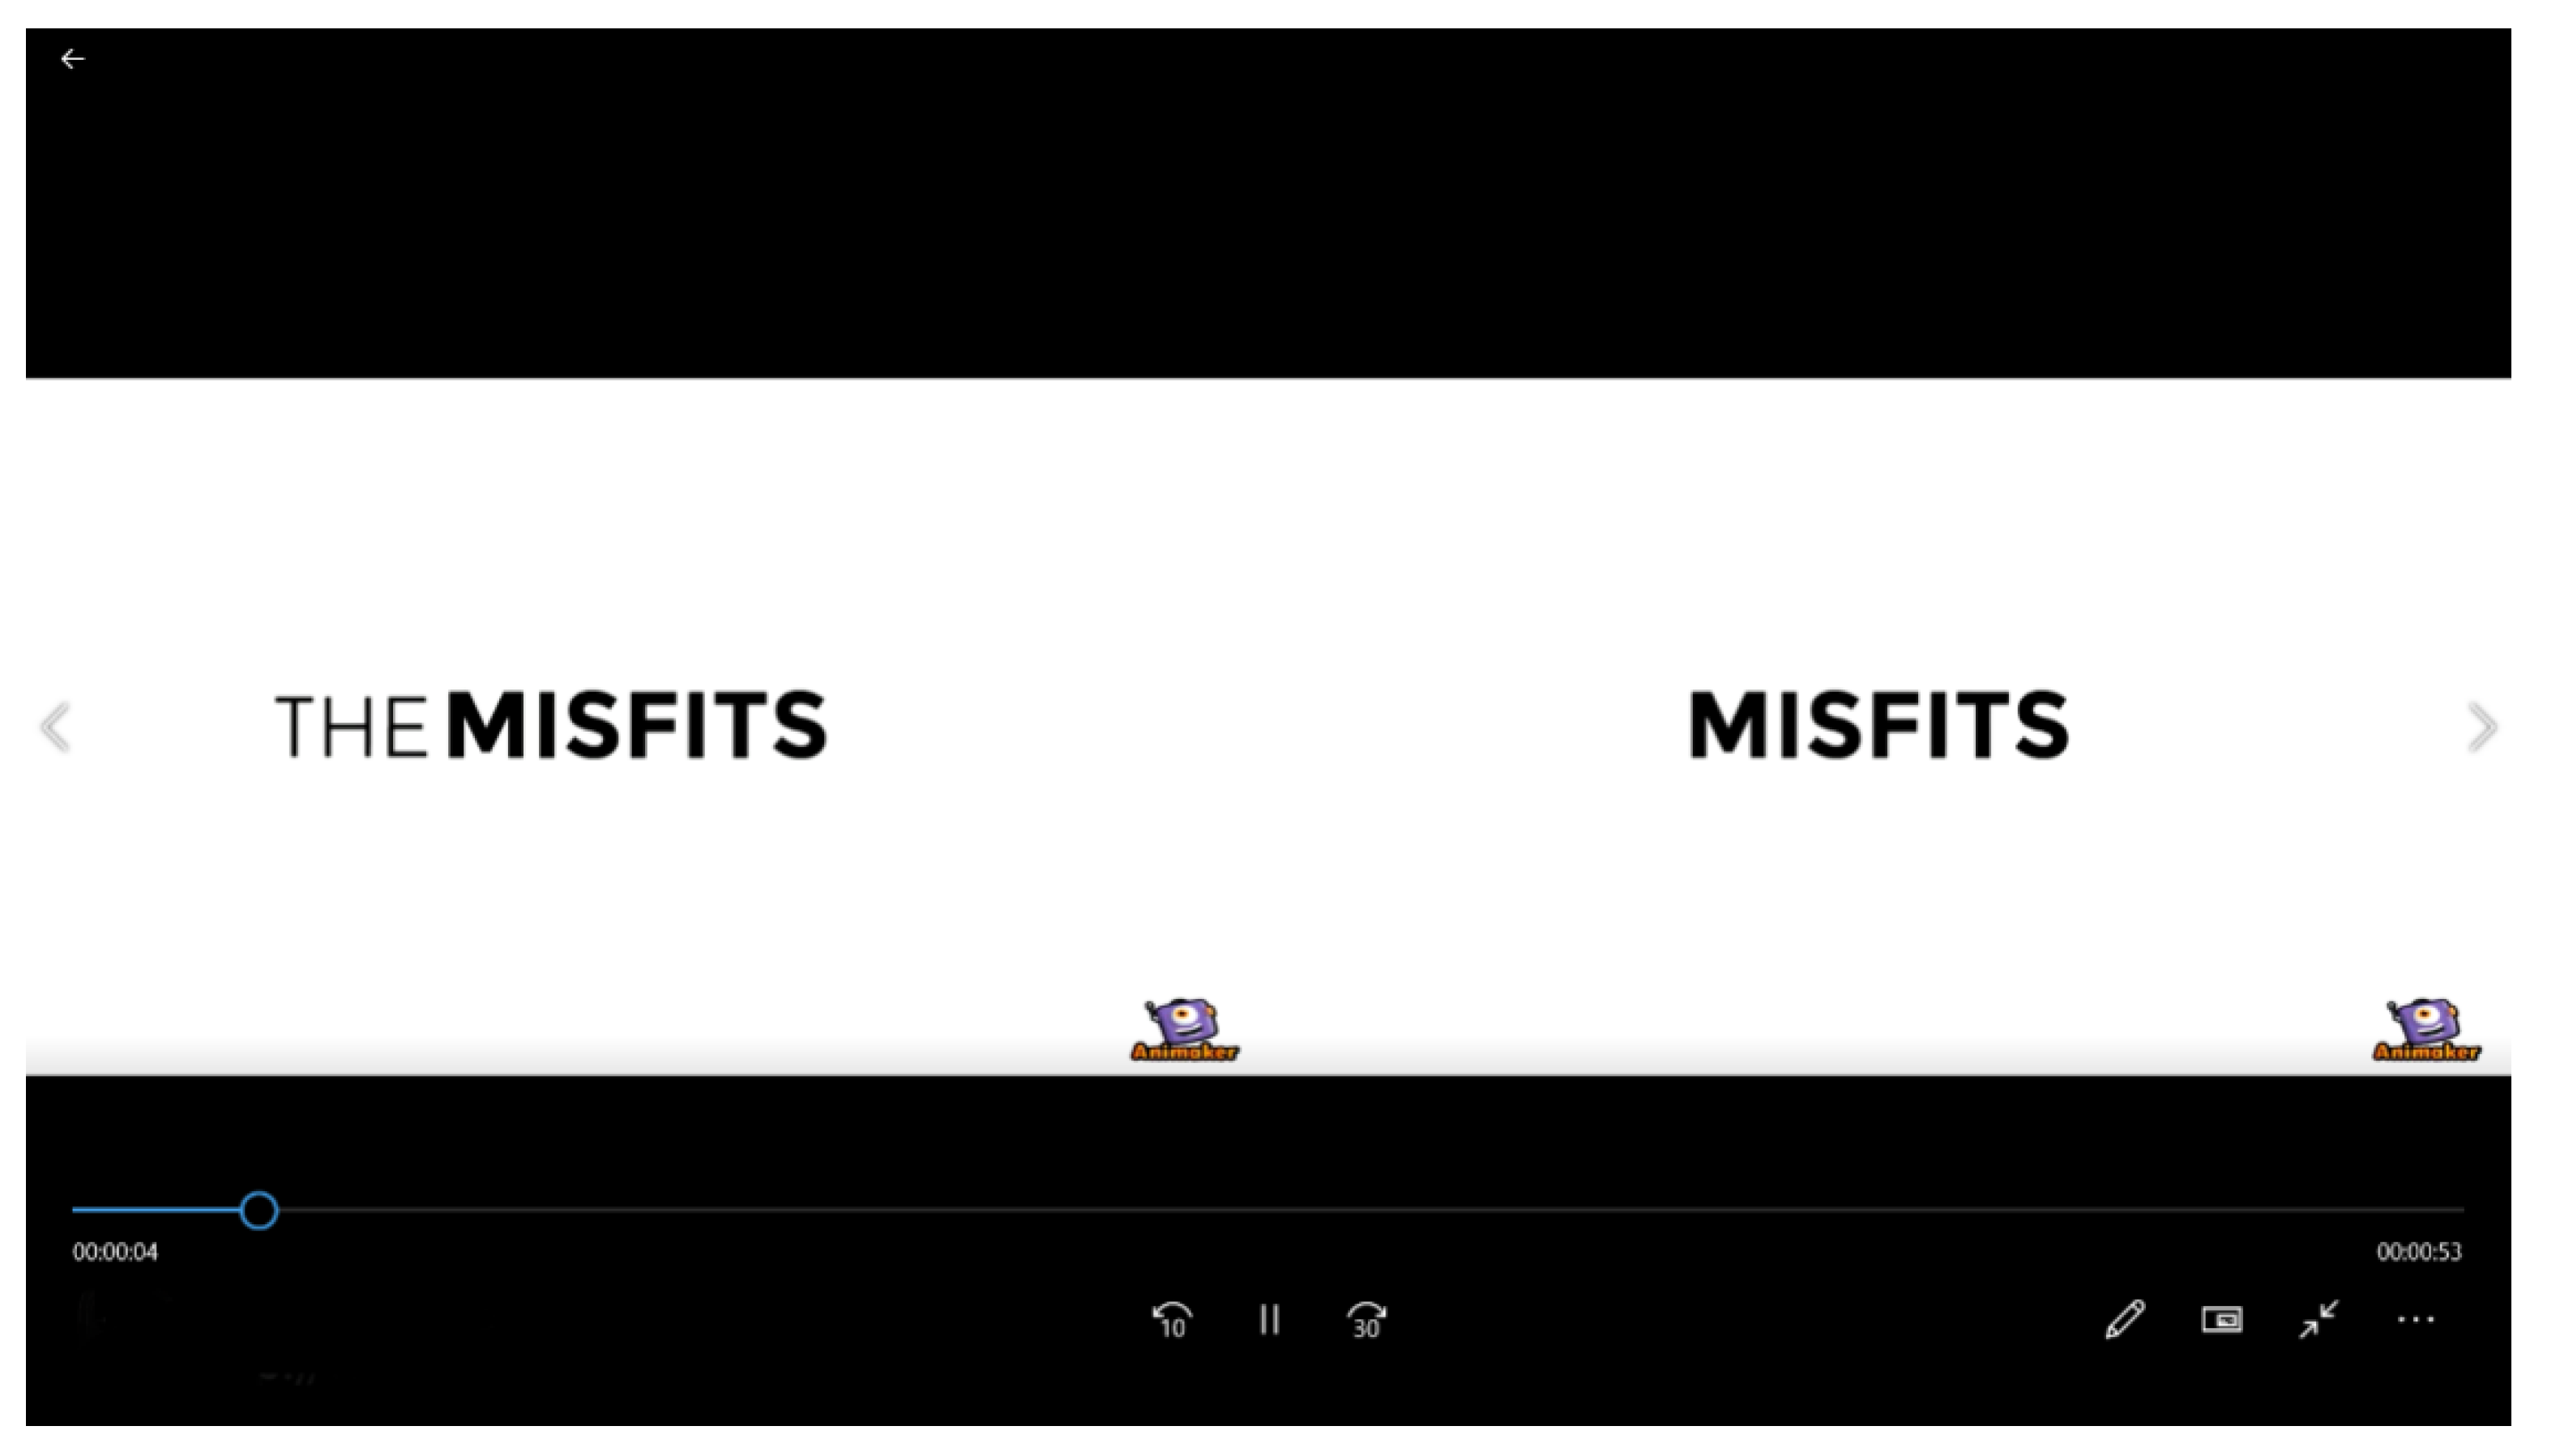
Figure 1.
A frame of text video without a background and with a left-to-right arrangement.

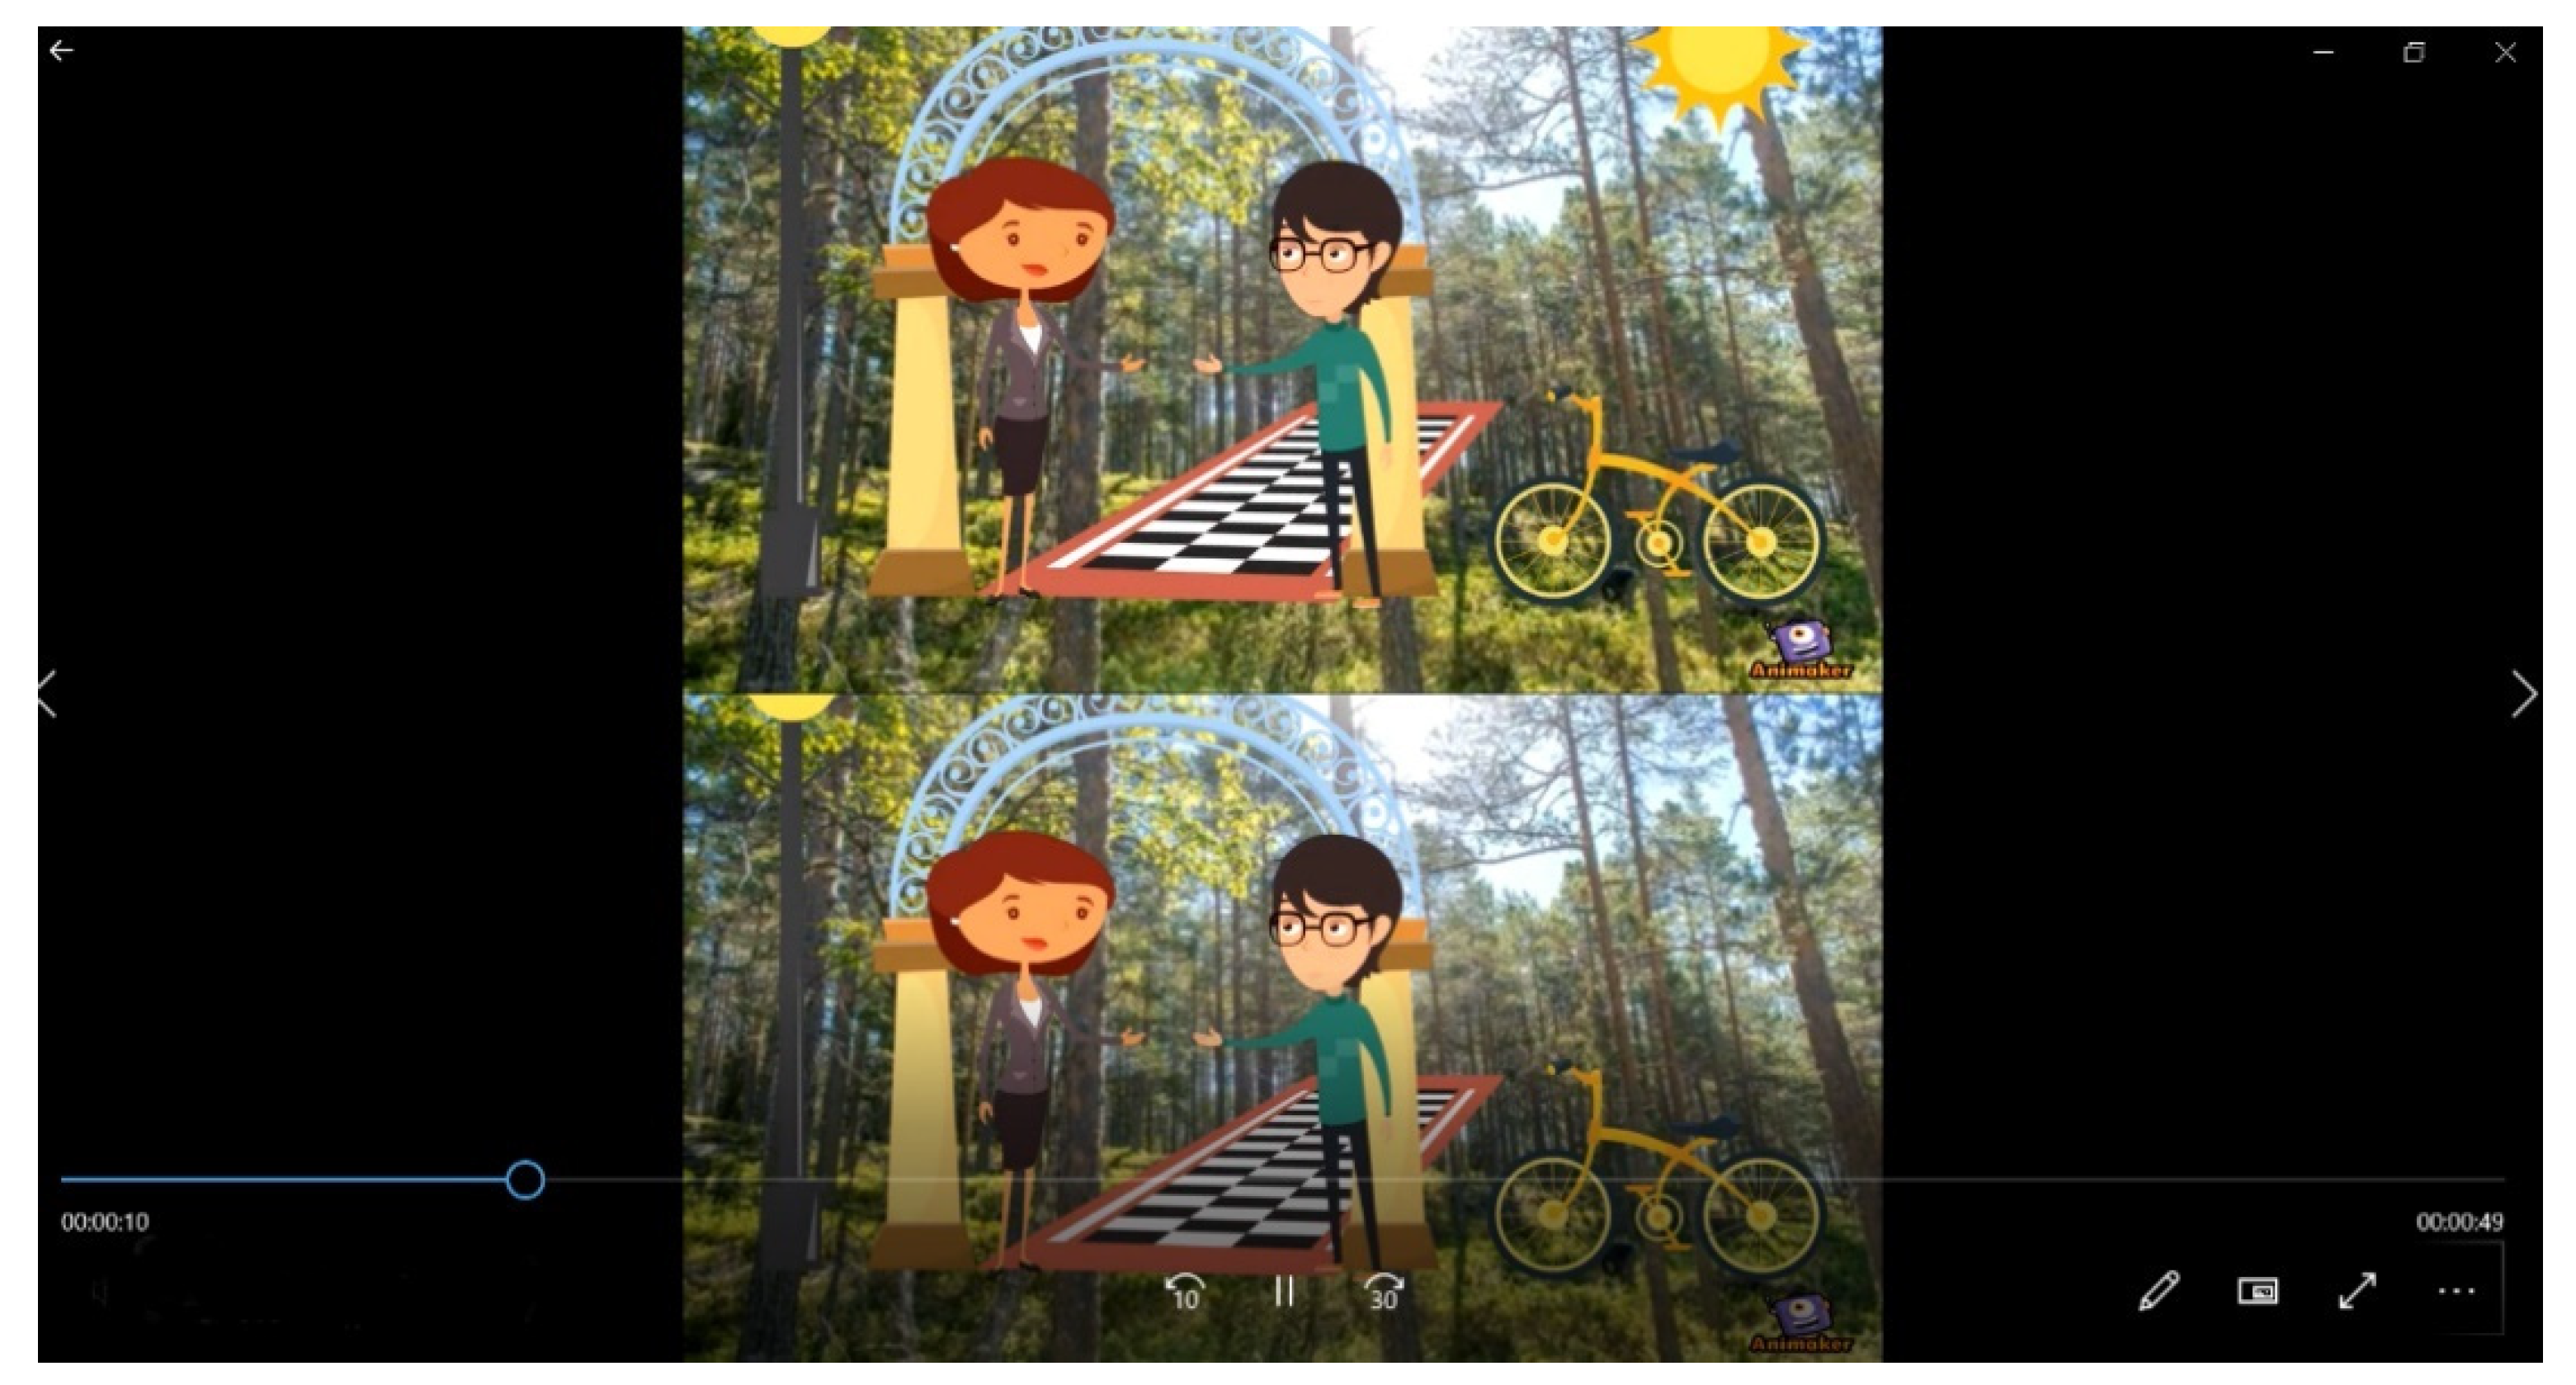
Figure 2.
A frame of animation video with a background and with a top-to-bottom arrangement.

Figure 3.
The interaction among background, film type, and arrangement for accuracy.

Figure 4.
The interaction between film type and arrangement for accuracy.

Figure 5.
The interaction between background and arrangement for the number of fixations.

Figure 6.
The interaction between display technique and ambient illumination for subjective visual fatigue.
Figure 6.
The interaction between display technique and ambient illumination for subjective visual fatigue.

Figure 7.
Scan paths with a top-to-bottom arrangement.

Figure 8.
Scan paths with a left-to-right arrangement.


Table 1.
ANOVA results for dependent variables.
| Source of Variance | Accuracy | Number of Fixations | Subjective Visual Fatigue |
|---|---|---|---|
| Background (B) | 11.599 * | 4.160 * | 7.664 * |
| Film type (F) | 10.101 * | 4.391 * | 5.827 * |
| Arrangement (A) | 2.145 | 6.823 * | 0.611 |
| B × F | 0.059 | 0.328 | 0.539 |
| B × A | 0.431 | 5.832 * | 0.026 |
| F × A | 11.300 * | 3.462 | 5.486 * |
| B × F × A | 63.325 ** | 1.535 | 2.803 |
* p < 0.05; ** p < 0.01.
Publisher’s Note: MDPI stays neutral with regard to jurisdictional claims in published maps and institutional affiliations. |
© 2021 by the authors. Licensee MDPI, Basel, Switzerland. This article is an open access article distributed under the terms and conditions of the Creative Commons Attribution (CC BY) license (https://creativecommons.org/licenses/by/4.0/).
Share and Cite
MDPI and ACS Style
Lin, P.-H.; Chen, H.-J.; Wang, Z.-Q. Visual Performance Assessment of Videos—A Case Study of the Game “Spot the Difference”. Appl. Sci. 2021, 11, 7628. https://doi.org/10.3390/app11167628
AMA Style
Lin P-H, Chen H-J, Wang Z-Q. Visual Performance Assessment of Videos—A Case Study of the Game “Spot the Difference”. Applied Sciences. 2021; 11(16):7628. https://doi.org/10.3390/app11167628
Chicago/Turabian StyleLin, Po-Hung, Hung-Jen Chen, and Zhi-Qian Wang. 2021. "Visual Performance Assessment of Videos—A Case Study of the Game “Spot the Difference”" Applied Sciences 11, no. 16: 7628. https://doi.org/10.3390/app11167628
Note that from the first issue of 2016, this journal uses article numbers instead of page numbers. See further details here.