the Creative Commons Attribution 4.0 License.
the Creative Commons Attribution 4.0 License.
 | 30 Nov 2018
Instrument artifacts lead to uncertainties in parameterizations of cloud condensation nucleation
Jessica A. Mirrielees
Sarah D. Brooks
The concentrations of cloud condensation nuclei (CCN) modulate cloud properties, rainfall location and intensity, and climate forcings. This work assesses uncertainties in CCN measurements and the apparent hygroscopicity parameter (κapp), which is widely used to represent CCN populations in climate models. CCN measurements require accurate operation of three instruments: the CCN instrument, the differential mobility analyzer (DMA), and the condensation particle counter (CPC). Assessment of DMA operation showed that varying the ratio of aerosol to sheath flow from 0.05 to 0.30 resulted in discrepancies between the κapp values calculated from CCN measurements and the literature value. Discrepancies were found to increase from <1 % to 13 % for both sodium chloride and ammonium sulfate. The ratio of excess to sheath flow was also varied, which shifted the downstream aerosol distribution towards smaller particle diameters (for excess flow < sheath flow) or larger particle diameters (for excess flow > sheath flow) than predicted. For the CPC instrument, undercounting occurred at high concentrations, resulting in calculated κapp lower than the literature values. Lastly, undercounting by CCN instruments at high concentration was also assessed, taking the effect of supersaturation on counting efficiency into account. Under recommended operating conditions, the combined DMA, CPC, and CCN uncertainties in κapp are 1.2 % or less for 25 to 200 nm diameter aerosols.
- Article
(3134 KB) -
Supplement
(652 KB) - BibTeX
- EndNote


Aerosol–cloud interactions represent a major uncertainty in current predictions of the Earth's climate (IPCC, 2013). According to the well-known Köhler theory, an aerosol's potential to catalyze cloud droplet formation by activating as a cloud condensation nucleus (CCN) depends on its physical and chemical properties. For any given composition, the CCN activation potential of an aerosol increases as its diameter decreases. While the relationship between aerosol diameter and CCN activation is straightforward, the effect of composition on an aerosol's ability to participate in cloud formation is more complex (Petters and Kreidenweis, 2013; Ovadnevaite et al., 2011). Predicting the cloud forming capacity of various air masses based on the properties of the aerosol they contain is essential for evaluating relative contributions from pollution, continental background, and marine aerosol sources (Brooks and Thornton, 2018; Carslaw et al., 2013). Long-term CCN measurements are available from numerous locations globally (Schmale et al., 2018). However, understanding regional and temporal variability in CCN populations requires the ability to assess whether observed differences reflect true physical differences or simply variations in CCN sampling strategies.
Parameterizations of CCN activity that accurately prescribe CCN measurements are needed for climate models, cloud-resolving models, and air quality predictions (Morales Betancourt and Nenes, 2014; Betancourt et al., 2013; Chang et al., 2017; Crosbie et al., 2015; Karydis et al., 2012; Kawecki and Steiner, 2018). One parameterization was designed to represent the cloud droplet activation potential ambient aerosol masses of unknown composition with a single variable, kappa (κ), based on the dry aerosol's hygroscopicity or ability to uptake water and form a solution droplet (Petters and Kreidenweis, 2007). Various names and abbreviations have been given to κ throughout the literature: hygroscopicity parameter, single hygroscopicity parameter, κ (Petters and Kreidenweis, 2007; Carrico et al., 2008; Asa-Awuku et al., 2010; Moore et al., 2012b), CCN-derived κ, κCCN (Carrico et al., 2008; Petters and Kreidenweis, 2007), and the apparent hygroscopicity parameter κapp (Sullivan et al., 2009; Collins et al., 2016; Petters and Kreidenweis, 2013). The term apparent hygroscopicity is favored by many because it emphasizes that fact that while CCN activation can often be predicted accurately by hygroscopic water uptake, they are different physical processes. It is possible for a compound to have high intrinsic hygroscopicity and low apparent hygroscopicity if it is poorly soluble in water (Sullivan et al., 2009).
Parameterizations of hygroscopicity that predate Petters and Kreidenweis (2007) exist as well. Winkler (1973) developed an equation for approximating the growth of an aerosol particle with relative humidity, based on the quantity and physical characteristics of the soluble species in the particle. Another approximation for the relationship between the equilibrium size of a particle and relative humidity was derived by Fitzgerald (1975), in which the soluble fraction and composition of the soluble component(s) are taken into account. Fitzgerald et al. (1982) derived a particle composition parameter using the mass fraction and physical properties of soluble material in a particle. Kreidenweis et al. (2005) determined that the critical activation diameter of dry aerosol particles can be calculated from simplified Köhler theory using the physical properties of water and the solute in a solution droplet. This parameterization has been used in CCN closure studies (Bougiatioti et al., 2009; Moore et al., 2011, 2012a). The earliest prediction of CCN concentrations for specific particle diameters and hygroscopicity used this parameterization as well (Mochida et al., 2006).
Once calculated, hygroscopicity parameters are useful tools for comparing CCN field measurements conducted in various regions and seasons and for making predictions about cloud formation, aerosol–cloud interactions in weather, and climate models. Values of κapp can be used to compare the CCN results in field and laboratory studies, including sea spray aerosol. For example, aggregation of results from several mesocosm experiments and marine field studies found submicron (30–100 nm) κapp for sea spray aerosol as low as 0.4 and as high as 1.3 (Collins et al., 2016). Another study, which included a survey of observational CCN data, reported that marine and continental aerosols could be described by κapp values of 0.7±0.2 and 0.3±0.1, respectively (Andreae and Rosenfeld, 2008).
Several studies have examined the sensitivity of models to κ values derived from humidified tandem differential mobility analyzer (HTDMA) measurements. An analysis of the NASA Global Modeling Initiative chemical transport model (CTM) and the GEOS-Chem CTM (Karydis et al., 2012) found that cloud droplet number concentration is sensitive to κ in Arctic and remote regions, where background aerosol loadings are low. Another study (Morales Betancourt and Nenes, 2014) found that a ±50 % uncertainty range in the κ of secondary organic aerosols and particulate organic matter resulted in a cloud droplet number concentration uncertainty of up to 15 % and 16 %, respectively. Updating precipitation models with lab-derived κ values for specific inorganic and organic species may increase the accuracy of storm forecasts by providing better predictions of intense precipitation (Kawecki and Steiner, 2018). In terms of climate, Liu and Wang (2010) found that increasing the κ of primary organic aerosols from 0 to 0.1, and decreasing the κ of secondary organics aerosols from 0.14 to 0.07, resulted in an uncertainty in global secondary aerosol indirect forcing of 0.4 W m−2 from preindustrial times to present day.
The sensitivity of weather and climate models to hygroscopicity parameters demonstrates the need for accurate measurements. In this study, we examine experimental uncertainties in CCN measurements and the resulting uncertainties in determination of κapp. Differences in reported κapp values may result from experimental artifacts rather any actual differences in an aerosol's ability to facilitate cloud formation. By systematically quantifying sources of experimental error, this study provides a framework for determining the significance of variations in CCN properties reported in multiple studies and defining the operating conditions that minimize instrumental artifacts.
The Köhler equation relates water vapor saturation ratio at the surface of a wet droplet, s, to its radius at equilibrium (Rogers and Yau, 1989):
where s is the equilibrium saturation ratio of a solution droplet with radius r, σw is the surface tension of water, Mw is the molecular weight of water, R is the ideal gas constant, T is temperature in Kelvin, ρw is the density of water, and Ms is the molecular weight of the solute. The minimum saturation ratio that is required for spontaneous droplet growth, sact, is therefore
Petters and Kreidenweis (2007) reformulated the Köhler equation as κ-Köhler theory:
where scrit is the critical water vapor saturation ratio, Dact is the dry particle activation diameter, and κapp is the apparent hygroscopicity parameter. Solving for κapp yields
The apparent hygroscopicity parameter can be calculated from experimental CCN results, for which the dry diameter and water vapor saturation ratio are known. For a chosen aerosol diameter, the activated fraction is the ratio of the concentration aerosols that activate as CCN to the total aerosol concentration:
Activated fraction data are fit with a sigmoid error function to determine the percent supersaturation at which 50 % of the particles have activated as CCN (activated fraction =0.50), which is considered the operationally defined critical percent supersaturation SScrit (Rose et al., 2008). The critical saturation ratio scrit can then be determined and entered into Eq. (4) in order to calculate κapp for the near-monodisperse aerosol:
Reporting κapp as a function of diameter allows for the comparison of the cloud condensation nucleation abilities of multimodal aerosol populations, without overlooking differences that arise due to aerosol composition.
The apparent hygroscopicity parameter is related to chemical composition; therefore, the calculated κapp of a pure substance should be constant across CCN experiments. However, discrepancies among κapp values for a single chemical species have been observed. Experimental results for ammonium nitrate are inconsistent with reported values ranging from (Svenningsson et al., 2006). Also, large ranges are often observed for organic compounds, such as glutaric acid () and malonic acid () (Koehler et al., 2006; Pradeep Kumar et al., 2003; Hartz et al., 2006). Below we evaluate potential sources of uncertainties in CCN measurements and the resulting uncertainties in κapp.
CCN measurements used for calculating apparent hygroscopicity from monodisperse aerosol require accurate operation of three instruments: the CCN, the differential mobility analyzer (DMA), and the condensation particle counter (CPC). The setup for laboratory CCN experiments is shown in Fig. 1. First, a polydisperse population of aerosols is generated by an atomizer and dried using a desiccant tube packed with silica gel. A near-monodisperse flow is obtained through size selection in the DMA. The flow is then split between a CPC (which measures aerosol concentration) and a CCN counter (which measures the concentration of particles that activate as CCN at a given percent supersaturation). Instrument artifacts will first be assessed separately for the DMA, CPC, and CCN counter. In the concluding section of the paper (and Fig. 10), the overall uncertainty due to the combination of these is presented and discussed.
We note that this study considers sized CCN measurements, which may be used for the determination of κapp. In contrast, a number of earlier CCN studies were conducted on the full ambient aerosol population without sizing the aerosol (Jennings et al., 1996; Hudson and Xie, 1998; Modini et al., 2015; Duan et al., 2017; Schmale et al., 2018; Leng et al., 2013). While useful, such studies do not produce the data required for accurate determination of κapp from the CCN measurements.
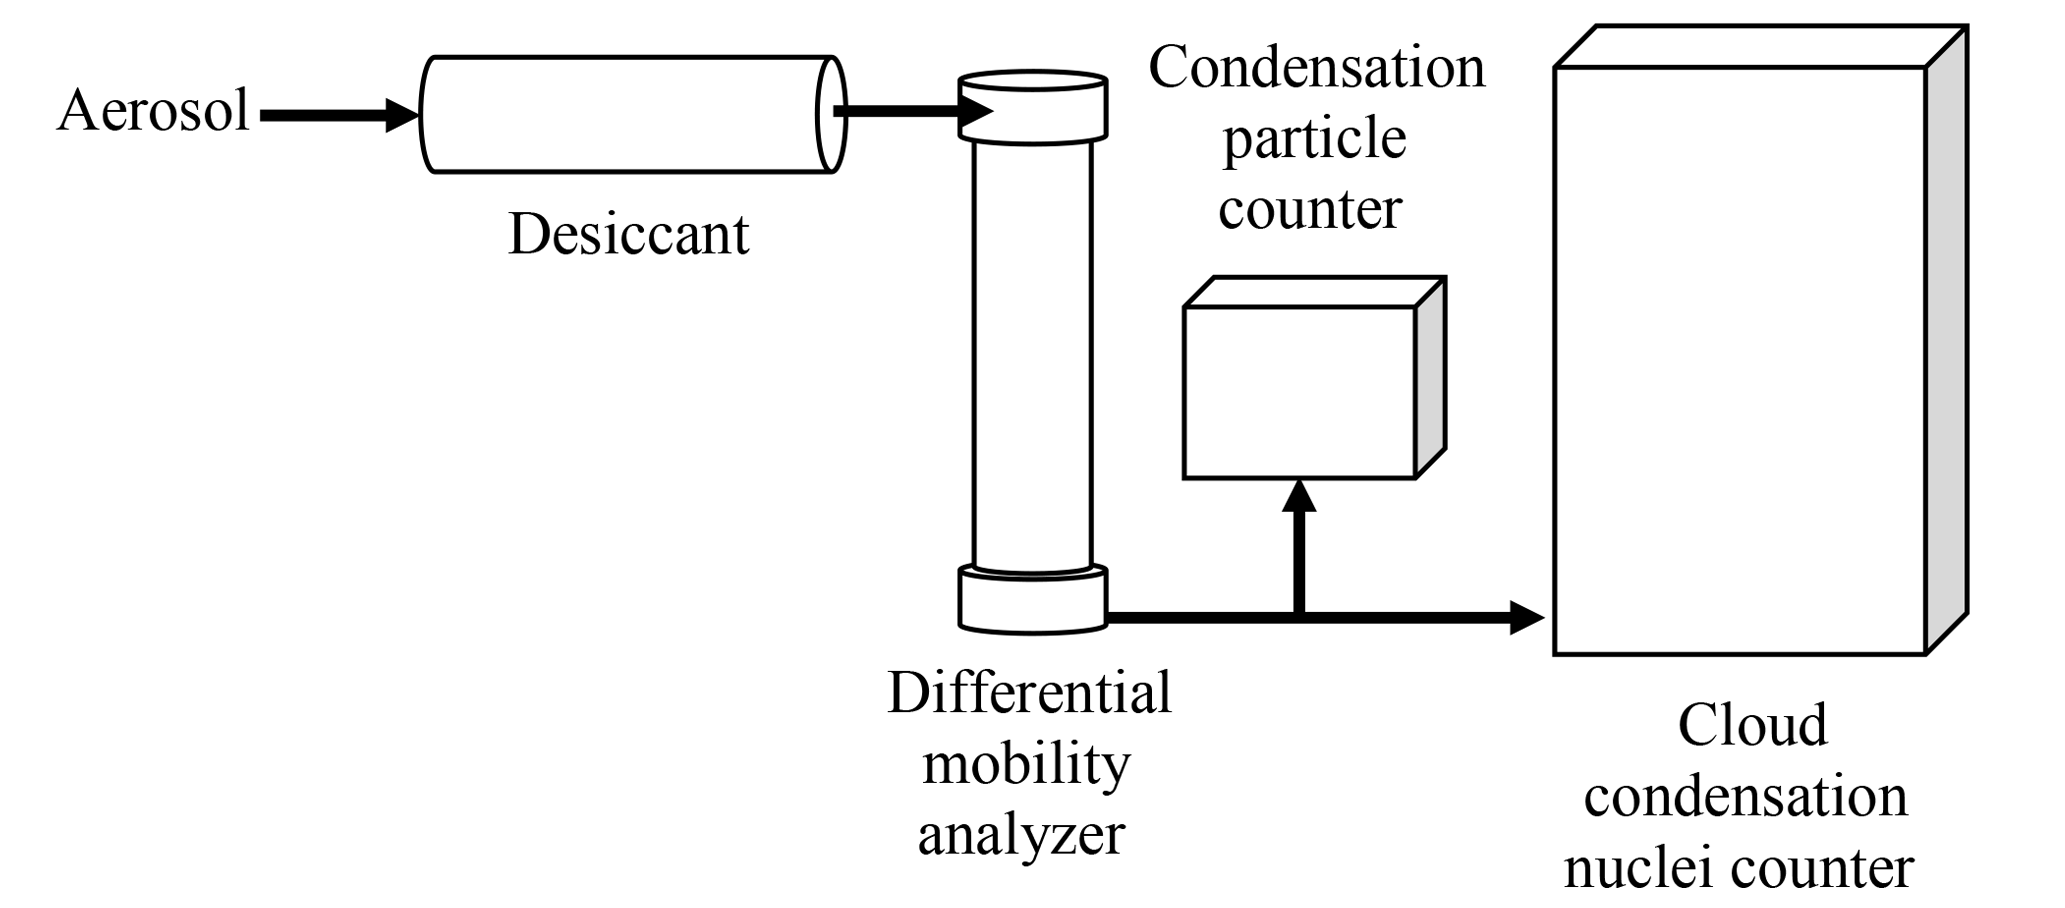
Figure 1Experimental setup used for obtaining sized CCN and particle concentration measurements from an aerosol sample.
3.1 Artifacts derived from differential mobility analyzers
3.1.1 DMA operation and electrical mobility
DMAs used in atmospheric science include commercially available instruments from Grimm Aerosol Technik, TSI Incorporated, and MSP Corporation. They have also been custom-built by a number of research groups (Mei et al., 2011; Barmpounis et al., 2016; Jokinen and Makela, 1997; Seol et al., 2000). All models allow for the selection of particles through electrical mobility, the ability of a particle to move through a medium (such as air) while acted upon by an electrical field. The DMA size-selects near-monodisperse aerosol from a polydisperse aerosol source, as shown in Fig. 2 (modeled after the Vienna-type long DMA from Grimm Technologies). The electrical mobility Zp of a particle with mobility diameter dm can be calculated according to
where n is the number of charges on the particle (assumed to be one in this study), e is the elementary unit of charge, η is the gas dynamic viscosity, and CC(dm) is the Cunningham slip correction factor:
where λ is the mean free path (DeCarlo et al., 2004). For the Vienna-type long DMA from Grimm Technologies, Inc. considered here, αCC=1.246, βCC=0.42, and γCC=0.86 (Grimm Aerosol Technik, 2009).
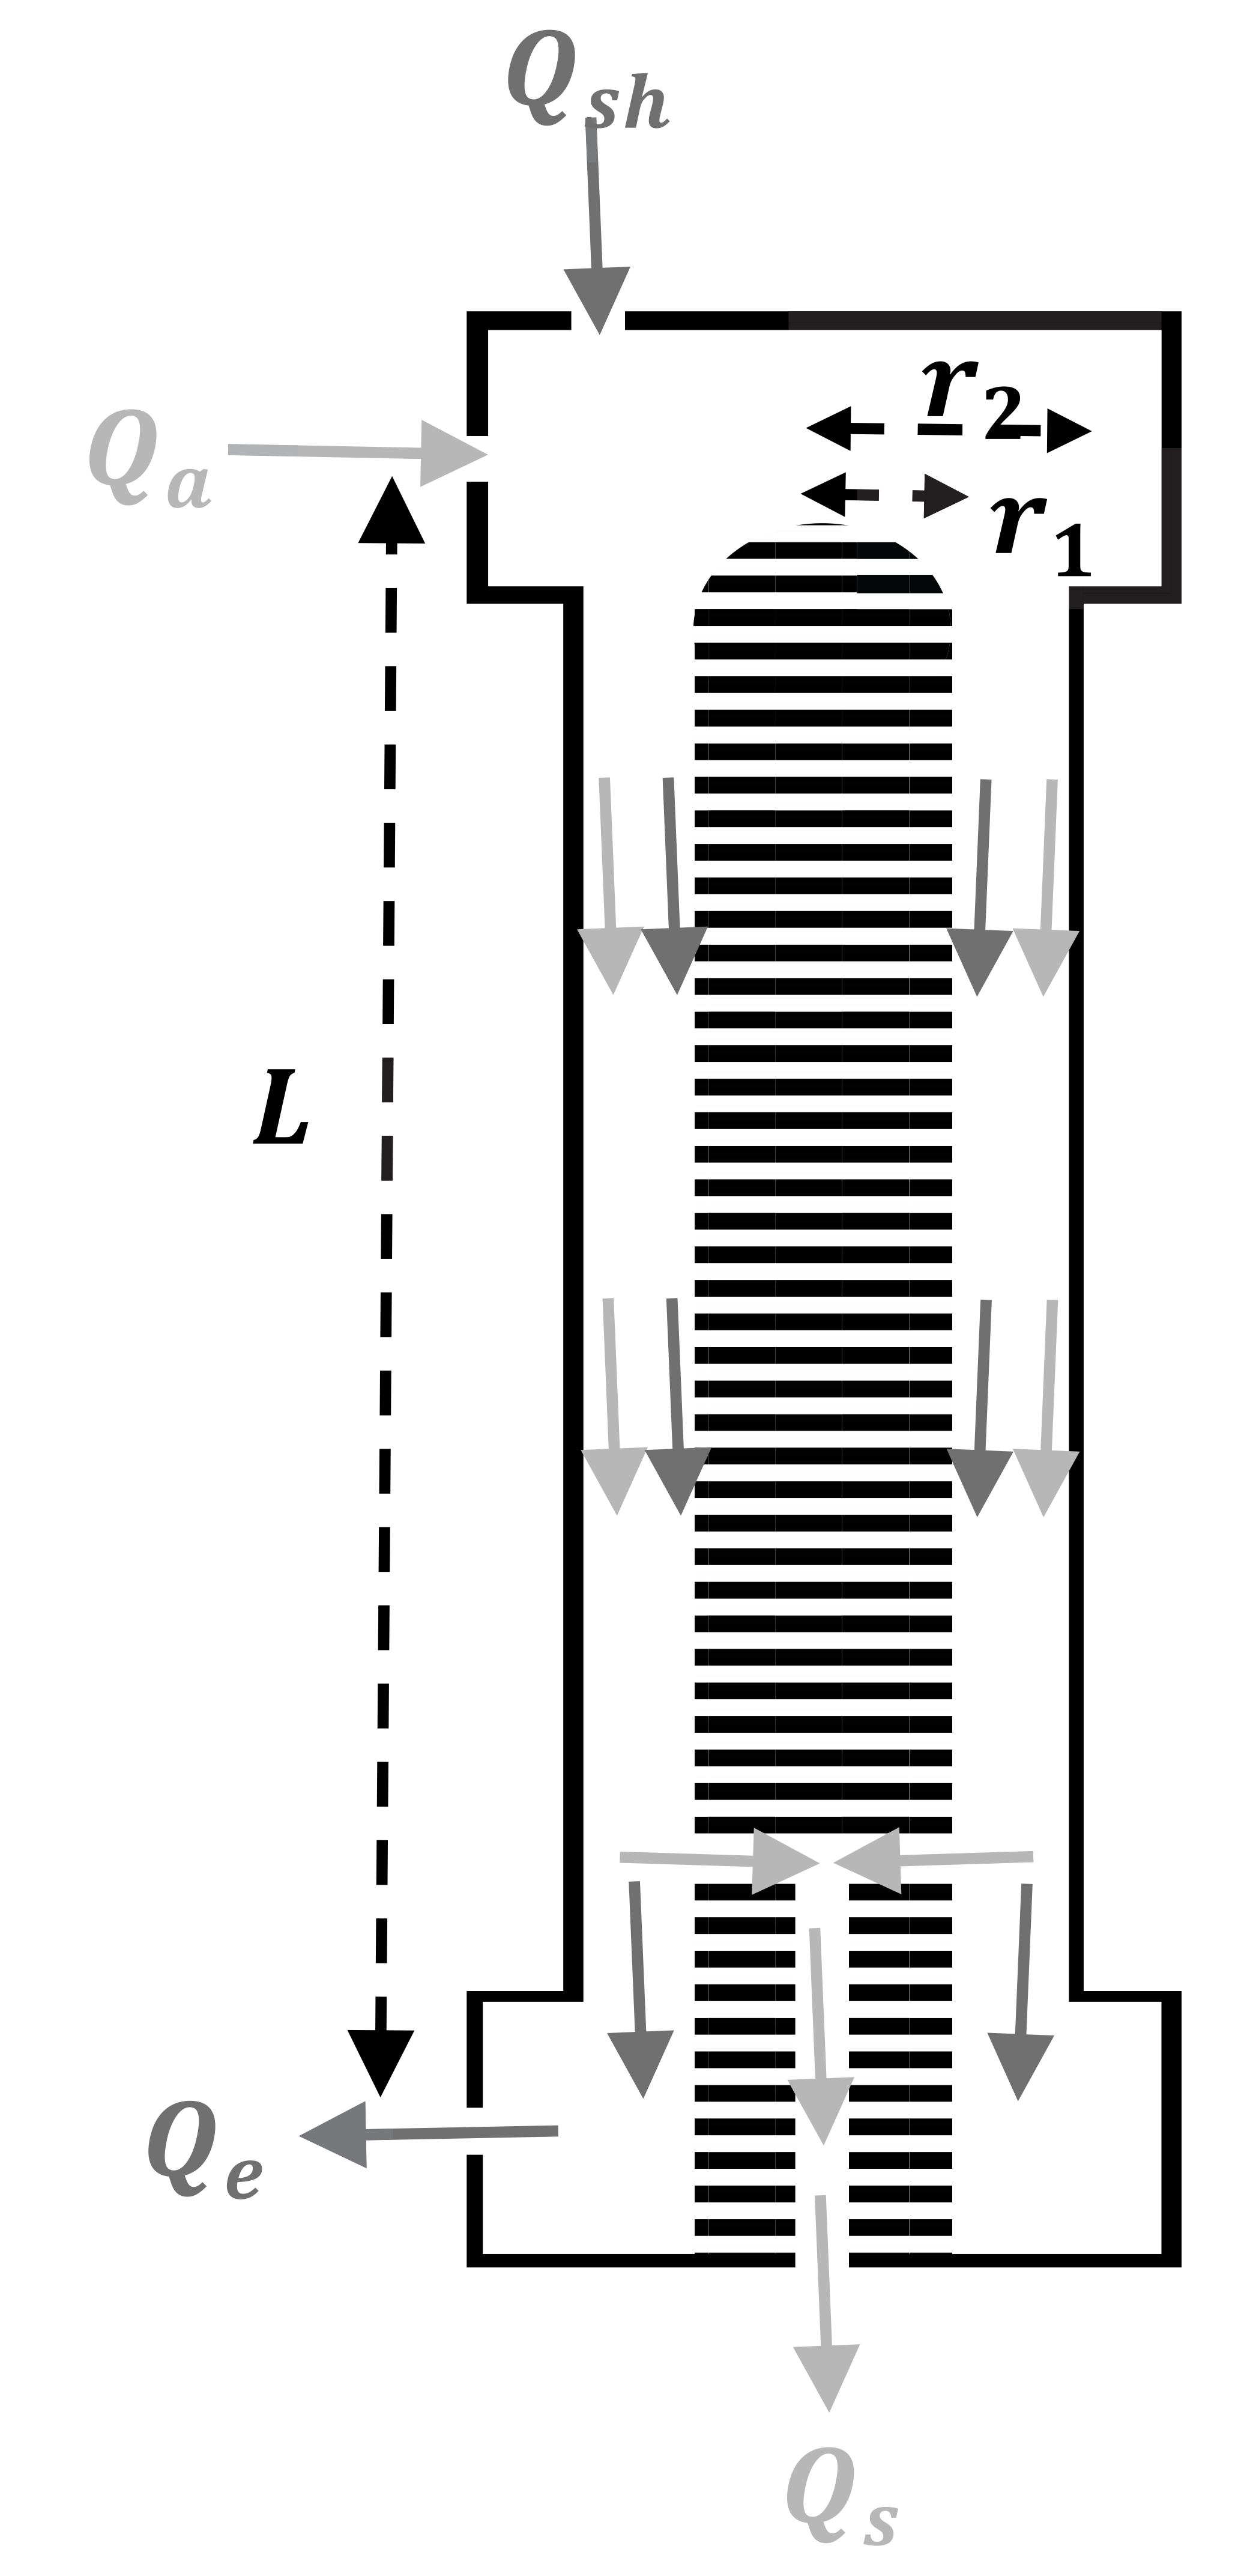
Figure 2Simplified flow diagram of a DMA with an inner electrode radius r1, outer electrode radius r2, distance between aerosol inlet and sample outlet L, clean sheath air flow Qsh, aerosol flow Qa, excess air flow Qe, and sample air flow Qs.
Particle-laden flow enters the DMA through the aerosol inlet (flow Qa) and travels down the DMA column (inner radius r1, outer radius r2) with the clean air sheath flow Qsh. Positively charged particles are attracted by the negatively charged inner electrode, to which voltage V0 has been applied. Ideally, selection of a voltage allows only particles of a specific mobility diameter to exit the DMA through the sample flow Qs. All particles with a larger diameter (lower Zp) or smaller diameter (higher Zp) will exit the DMA through the excess flow Qe. In other words, Qs would ideally consist only of aerosols with diameters equal to, or very nearly equal to, the selected diameter.
In reality, the aerosol flow that leaves the DMA through Qs is polydisperse with a mobility distribution determined by instrumental parameters. A triangular approximation has been chosen as a model for this distribution, as particle inertia is negligible for the diameters considered in this study (Stratmann et al., 1997; Mamakos et al., 2007). The probability that a particle at the aerosol inlet will exit with the sampling flow is defined by transfer function :
where Zp, mid is the midpoint mobility of the transfer function, and αTF and βTF are flow-derived constants, defined as
and
The midpoint and half-width of the transfer function are respectively calculated according to Knutson and Whitby (1975):
and
where L is the distance between the DMA inlet and outlet.
3.1.2 κapp artifacts arising from DMA flow ratios
Next we assess the ramifications of the DMA transfer function for the derived κapp. A lognormal theoretical aerosol number distribution was used to represent a polydisperse ambient aerosol population (Fig. 3a). This distribution was converted to an electrical mobility distribution using Eqs. (7) and (8), assuming that the aerosols in the distribution were spherical and singly charged. From the distribution, a series of single aerosol sizes were selected (25, 50, 100, and 200 nm diameter). For each aerosol size, the resulting DMA transfer functions were calculated for seven cases using Eq. (9) and the various parameters for DMA sheath, excess, aerosol, and sample flow listed in Table 1. These seven cases were chosen to represent possible measurement scenarios that may be encountered in a CCN experiment. The aerosol ∕ sheath ratio is varied in cases 1–4 in order to study the effects of chosen experimental parameters. Sheath flow is predetermined in some DMAs (for example, the Grimm Vienna DMA considered in this study), but can be varied in other instruments. The aerosol flow rate may also be selected in an experiment. Cases 5–7 vary the excess ∕ sheath ratio in order to take proper instrument operation into account. The excess and sheath flow should be identical, but small discrepancies may occur.
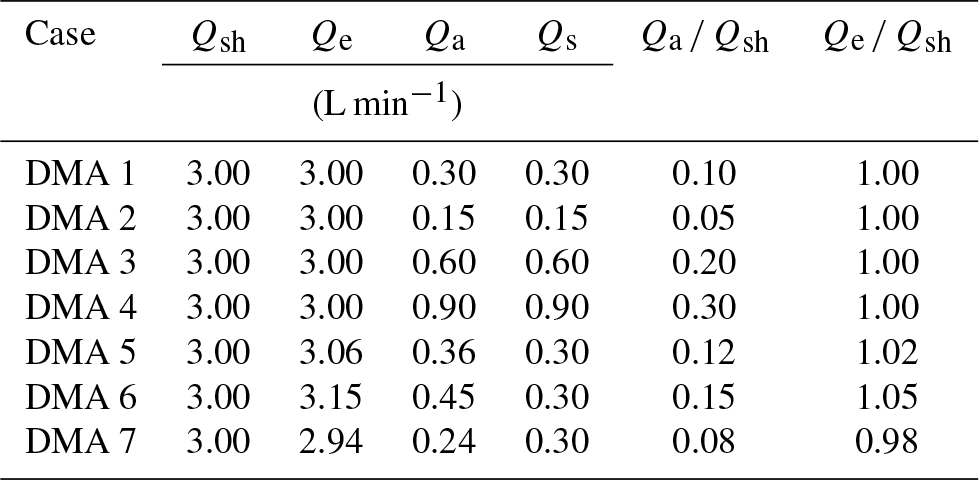
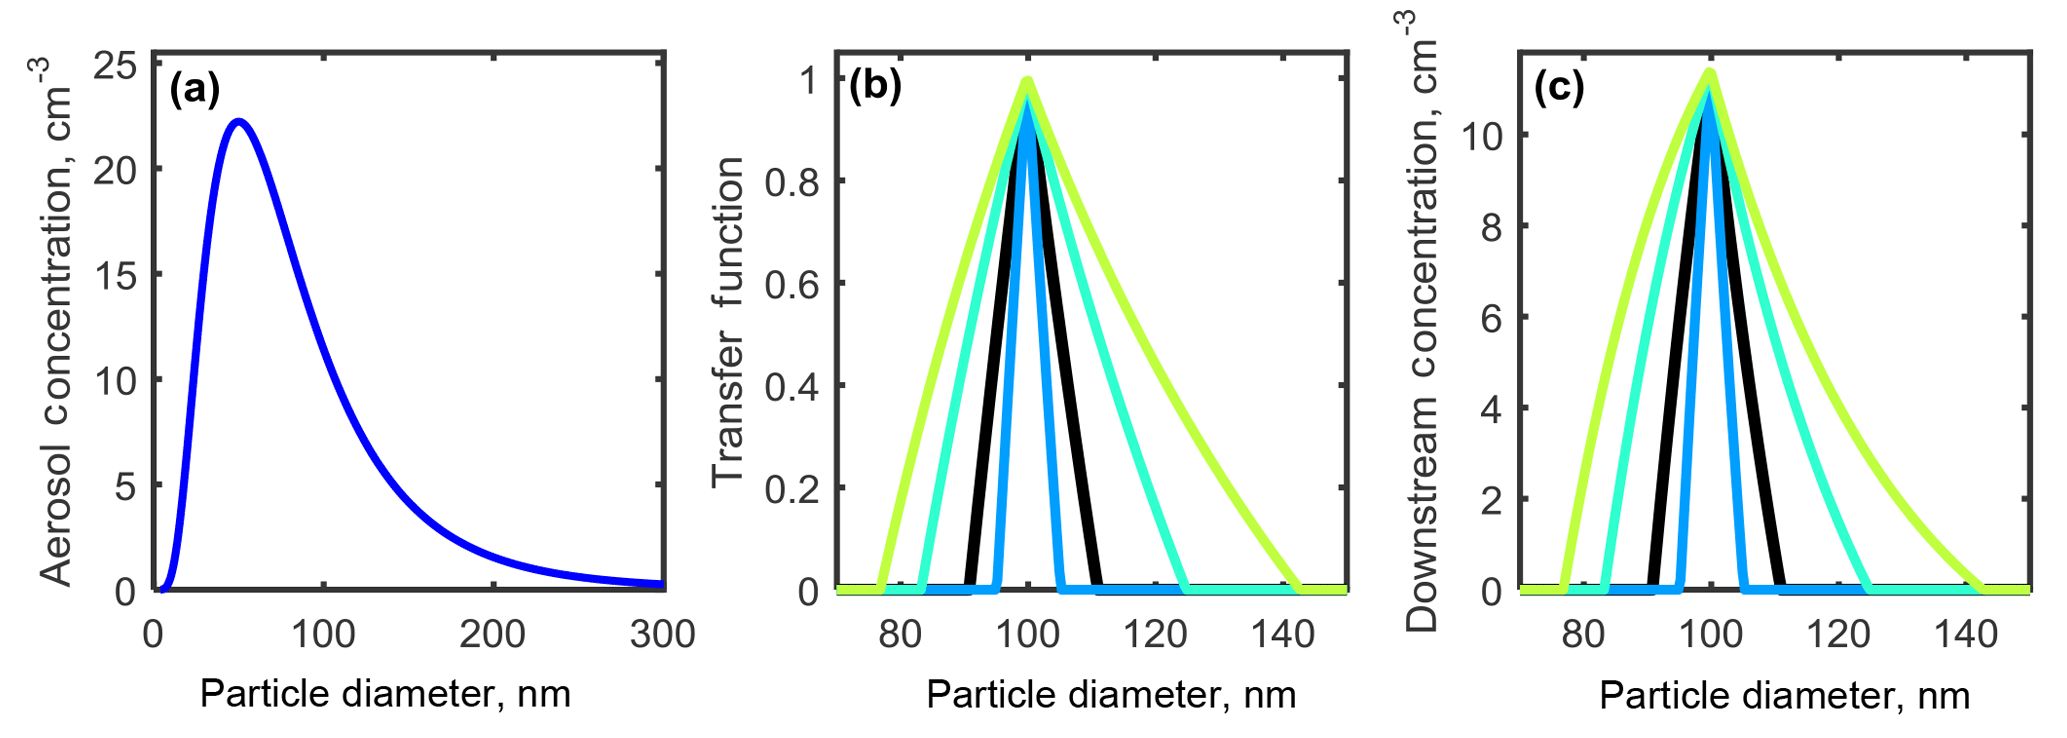
Figure 3(a) A theoretical aerosol distribution generated using a lognormal function centered at 50 nm. (b) The transfer function calculated using Eq. (7). (c) Multiplying the distribution by the transfer function gives the downstream aerosol concentration (cm−3).
For example, the resulting DMA transfer functions for 100 nm aerosol conditions constrained by cases 1–4 are shown in Fig. 3b, in which an increase in Qa ∕ Qsh from 0.1 (black line) to 0.3 (green line) tripled the width of the number distribution, and decreasing Qa ∕ Qsh to 0.05 (blue line) from 0.10 halved the width of the number distribution. The result of applying the transfer functions shown in Fig. 3b to the distribution in Fig. 3a is shown in Fig. 3c.
All downstream distributions for all seven DMA cases and all aerosol sizes are shown in Fig. S1 in the Supplement. DMA cases 1–4 represent experimental conditions in which the sheath and excess air flows are equal and the aerosol ∕ sheath flow ratio is varied. As Qa ∕ Qsh increases, the width of the number distribution measured downstream of the DMA increases, while the midpoint diameter remains constant. It was found that doubling the aerosol-to-sheath ratio doubled the width of the downstream number distribution for 25, 50, 100, and 200 nm particles. For example, when selecting 200 nm particles, increasing Qa ∕ Qsh from 0.10 to 0.20 increased the downstream diameter range from 181–222 nm (a spread of 41 nm) to 167–250 nm (a spread of 87 nm). The particle diameter ranges that would be observed downstream of the DMA are summarized in Table 2.
Table 2Predicted downstream particle diameter range for each DMA case.

To assess the variations in CCN properties resulting from DMA uncertainties, the critical percent supersaturation was calculated for representative atmospheric aerosols. The value of SScrit was calculated for each particle diameter using Eq. (3a), using literature values for apparent hygroscopicity of 0.61 for ammonium sulfate and 1.28 for sodium chloride (Clegg et al., 1998). It should be noted that this analysis considers two homogeneous aerosol distributions of hygroscopic salts. Real aerosol distributions tend to be mixtures of many species, and the shape of the number distribution can vary among species.
To test how uncertainties in DMA diameter translate to uncertainties in κapp, the activation of particles downstream of the DMA was assessed. First, for each case and diameter (25, 50, 100, and 200 nm) the critical saturation ratio scrit was calculated for each particle diameter range downstream from the DMA using Eq. (3a). These critical saturation ratios were converted to critical percent supersaturation SScrit and used to calculate the activated fraction (AF) for the aerosol particles downstream from the DMA for percent supersaturations , using the equation
where the standard deviation σ was equal to 1∕100 of SScrit. The small σ ∕ SScrit ratio was chosen in order to generate accurate activated fraction curves for each particle diameter.
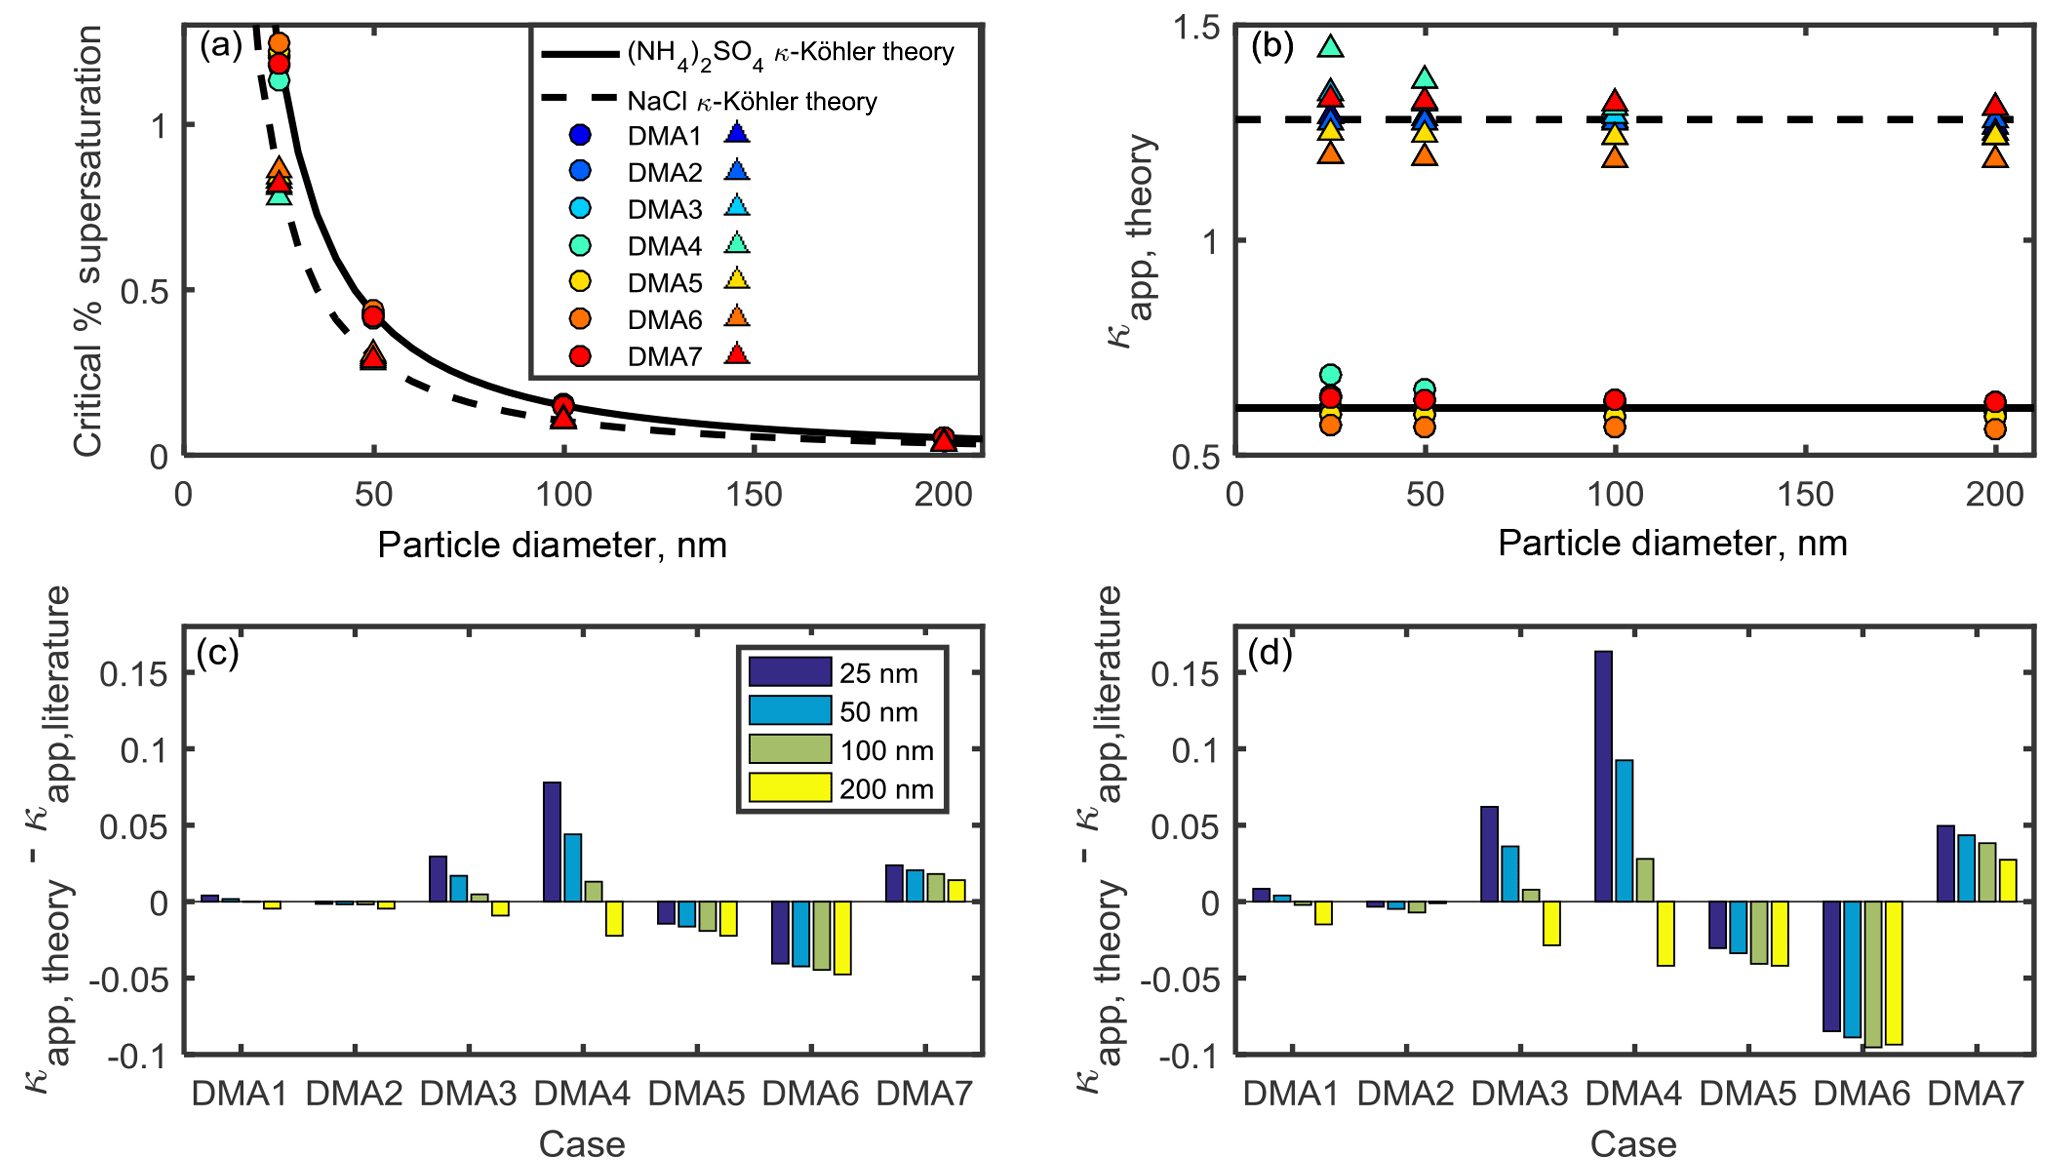
Figure 4(a) Critical supersaturation of ammonium sulfate and sodium chloride particles calculated for DMA cases 1–7 for sodium chloride (triangles) and ammonium sulfate (circles). Ammonium sulfate and sodium chloride curves from κ-Köhler theory are shown for comparison. (b) Apparent hygroscopicity κapp for DMA cases 1–7. (c) DMA-flow-derived artifacts in ammonium sulfate κapp are shown for each DMA case. (d) DMA-flow-derived artifacts in sodium chloride κapp are shown for each DMA case.
The activated fraction curve for each selected diameter (25, 50, 100, and 200 nm) was then calculated as the sum of the number-weighted activated fractions of each particle diameter downstream from the DMA. For example, for a selected diameter of 25 nm, the downstream diameters ranged from 23 to 27 nm for DMA case 1 and from 20 to 36 nm in DMA case 4. The equation used for this calculation is
where AFi is the activated fraction calculated using Eq. (12) and is the fraction of particle downstream from the DMA of diameter i.
This calculation was repeated for each selected diameter (25, 50, 100, and 200 nm), each DMA case (1–7), and percent supersaturation (0.01–1.5) in order to construct activation curves for each selected diameter and DMA case. As an example, in Fig. S2, the shape and position of each activated fraction curve vary with the DMA flow ratios. As the aerosol ∕ sheath ratio increases, the activated fraction curve flattens out (DMA case 4). The critical percent supersaturation SScrit was then determined for each activation curve as the percent supersaturation, for which AF =0.50. These results are shown in Fig. 4a for ammonium sulfate and sodium chloride. Equation (4) was then used to calculate κapp, theory for each DMA case and selected diameter, as shown in Fig. 4b. Discrepancies between κapp, theory calculated in this study and literature values (hereafter referred to as “κapp artifacts”) are shown for both compounds in Fig. 4c–d.
The largest κapp artifact was found in DMA case 4 (in which the aerosol ∕ sheath ratio was the highest) for both ammonium sulfate and sodium chloride aerosols. The artifact for 25 nm ammonium sulfate aerosol in DMA case 4 was 0.08, or ∼13 % of the literature value used for , while the artifact for 25 nm sodium chloride in DMA case 4 was 0.16, or ∼13 % of the literature value used for . Artifacts were also high for DMA case 6 () and DMA case 7 (), in which sheath and excess flow were unequal. This result demonstrates that artifacts may still occur when low aerosol ∕ sheath flow ratios are chosen (0.15 and 0.08 for DMA cases 6 and 7, respectively) due to small differences between sheath and excess flow rates (5 % and 2 % for DMA cases 6 and 7, respectively).
κapp artifacts were larger for sodium chloride () than for ammonium sulfate () across the DMA cases. As our results show, when two or more compounds are compared, the more hygroscopic compound will have larger κapp artifacts.
This analysis was also applied to the range of apparent hygroscopicity values Svenningsson et al. (2006) reported for ammonium nitrate , with a mean value of 0.670. If 0.670 is assumed to be the true κapp for ammonium nitrate, then the sample ∕ sheath ratio used to determine κapp (1.2–2.0 L min−1) could lead to an experimental kappa as low as 0.665 or as high as 0.674, which would not fully explain the actual experimental range. This assessment ignores possibility of under- or overcounting, which could introduce additional errors.
In addition to the errors discussed above, accuracy in CCN measurements depends on the accuracy of the instrument calibration. Specifically, accurate determination of the percent supersaturation set points within the CCN instrument is dependent on accurate sizing of aerosols entering the CCN, and therefore is dependent on the DMA sizing during CCN calibration. CCN calibrations were performed using two standard compounds, ammonium sulfate and sodium chloride, as described in detail in Rose et al. (2008). Fortunately, if the calibration procedure described by Rose is followed and an optimal DMA aerosol-to-sheath ratio is employed, the uncertainties will be minimal. Specifically, this analysis shows that an aerosol ∕ sheath ratio of 1 : 10 or 1 : 20 (case 1 or 2, respectively) is recommended for all CCN calibrations. This will result in κapp uncertainties of less than 1 % for all dry sizes (25–200 nm). However, if CCN calibrations are performed using a DMA operated with less-than-ideal aerosol-to-sheath ratios, substantial errors will be introduced. Analysis of the impact of DMA uncertainties on CCN calibrations is discussed in detail in the Supplement. In the worst case scenario amongst the cases evaluated here (case 4), the resulting uncertainty in κapp is 15 %.
3.1.3 Effect of double and triple charges on particles
During normal operation, the Grimm DMA employs a bipolar charger (also known as a neutralizer) to charge aerosol particles through the capture of gaseous ions. The analysis in Sect. 3.1.2 assumes that each particle carries a single (+1) charge. In reality, the methods used to charge particles prior to entering a DMA may impart two, three, or more charges to individual particles (Fuchs, 1963). The charge distribution resulting from a bipolar charger is roughly approximated using the Boltzmann law (Keefe et al., 1959). However, the Boltzmann law assumes symmetric aerosol particle charging (equal concentrations of negatively and positively charged particles). Deviation from symmetric charging is observed in regions of high ionizations, and this deviation becomes more pronounced as particle size increases (Hoppel and Frick, 1990). A more accurate estimation of stationary charge distribution has been calculated using an approximation formula for the charge distribution produced by a bipolar charger:
where f(k) is the fraction of particles carrying k charges, ai(k) is the approximation coefficients determined using a least-squares regression analysis, and Dnm is the particle diameter in nanometers (Wiedensohler, 1988). The approximation coefficients only apply to particles with 0, ±1, and ±2 charges. In a separate study, Maricq (2008) determined approximation coefficients for poly (α-olefin) oligomer oil droplets with ±1, ±2, and ±3 charges. The approximation coefficients reported by these two studies were in excellent agreement for particles with a ±1 charge and in weak agreement for ±2 charges (+2 and −2 charging efficiencies were overestimated by 50 % and 100 %, respectively). Therefore, this analysis will use the approximation coefficients from Wiedensolher (1988) for particles with +1 and +2 charges and the approximation coefficient for particles with a +3 charge from Maricq (2008).
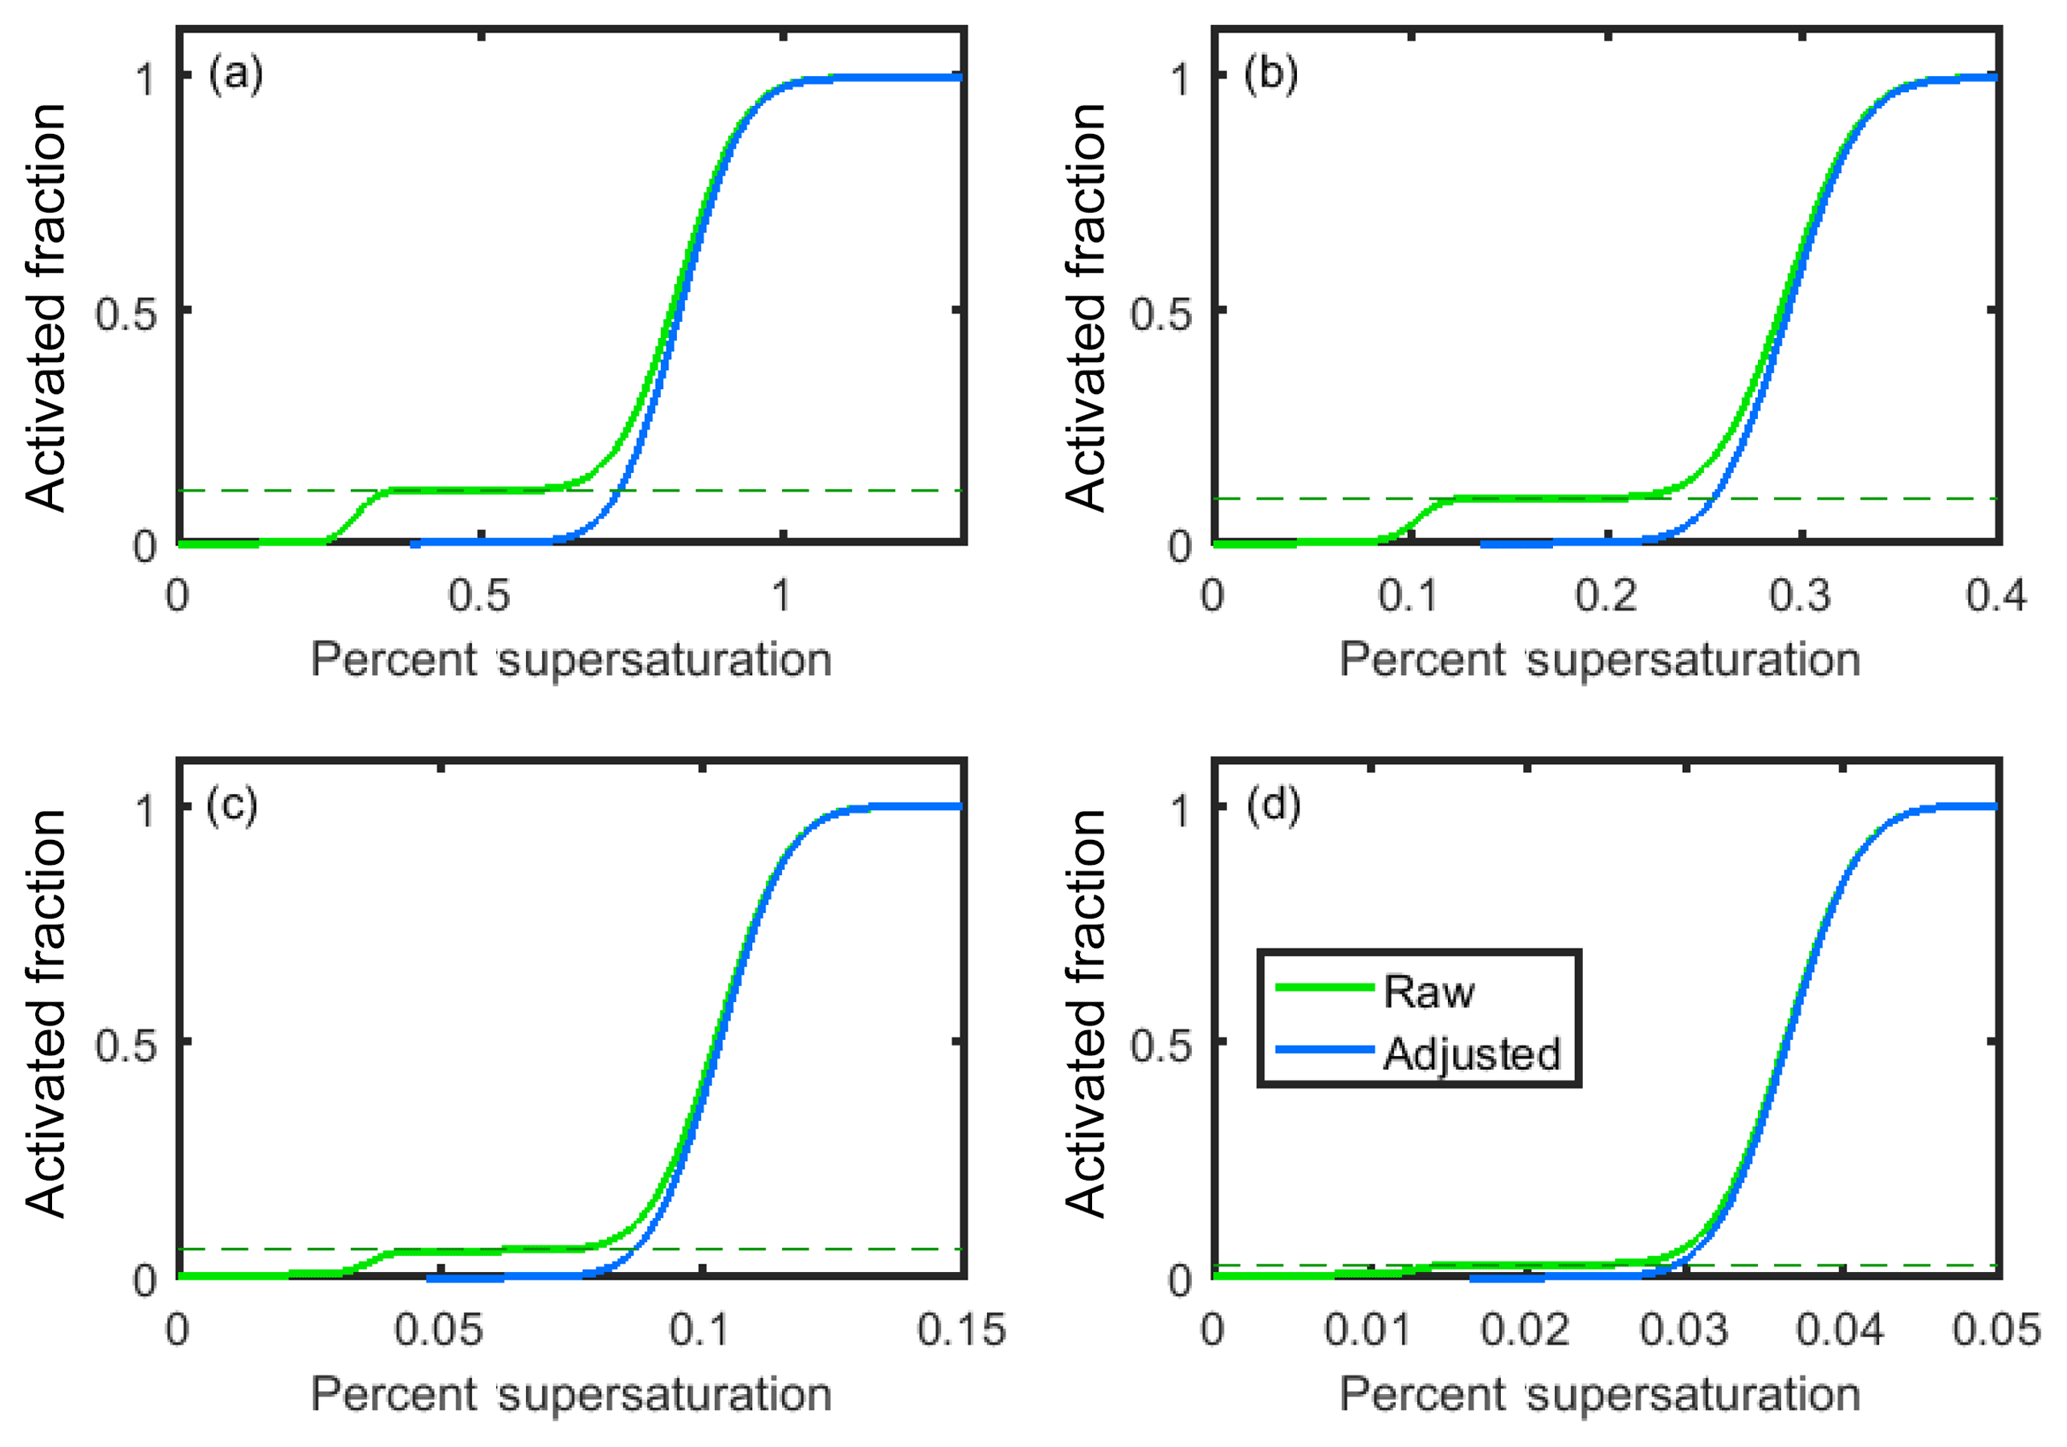
Figure 5Theoretical raw (green) and adjusted (blue) activated fraction curves for (a) 25 nm (+1), 50 nm (+2), and 75 nm (+3) particles; (b) 50 nm (+1), 100 nm (+2), and 150 nm (+3) particles; (c) 100 nm (+1), 200 nm (+2), and 300 nm (+3) particles; and (d) 200 nm (+1), 400 nm (+2), and 600 nm (+3) particles. All particles are pure sodium chloride.
In order to assess the impact of multiple charges on κapp, Eq. (14) and the approximation coefficients from Wiedensohler (1988) and Maricq (2008) were used to calculate the charge distribution of the representative aerosol population shown in Fig. 3a. The resulting charge distribution is shown in Fig. S6a. An increase in multiple charging is observed as particle diameter increases, though this is offset somewhat by the decrease in concentration with particle size above 50 nm.
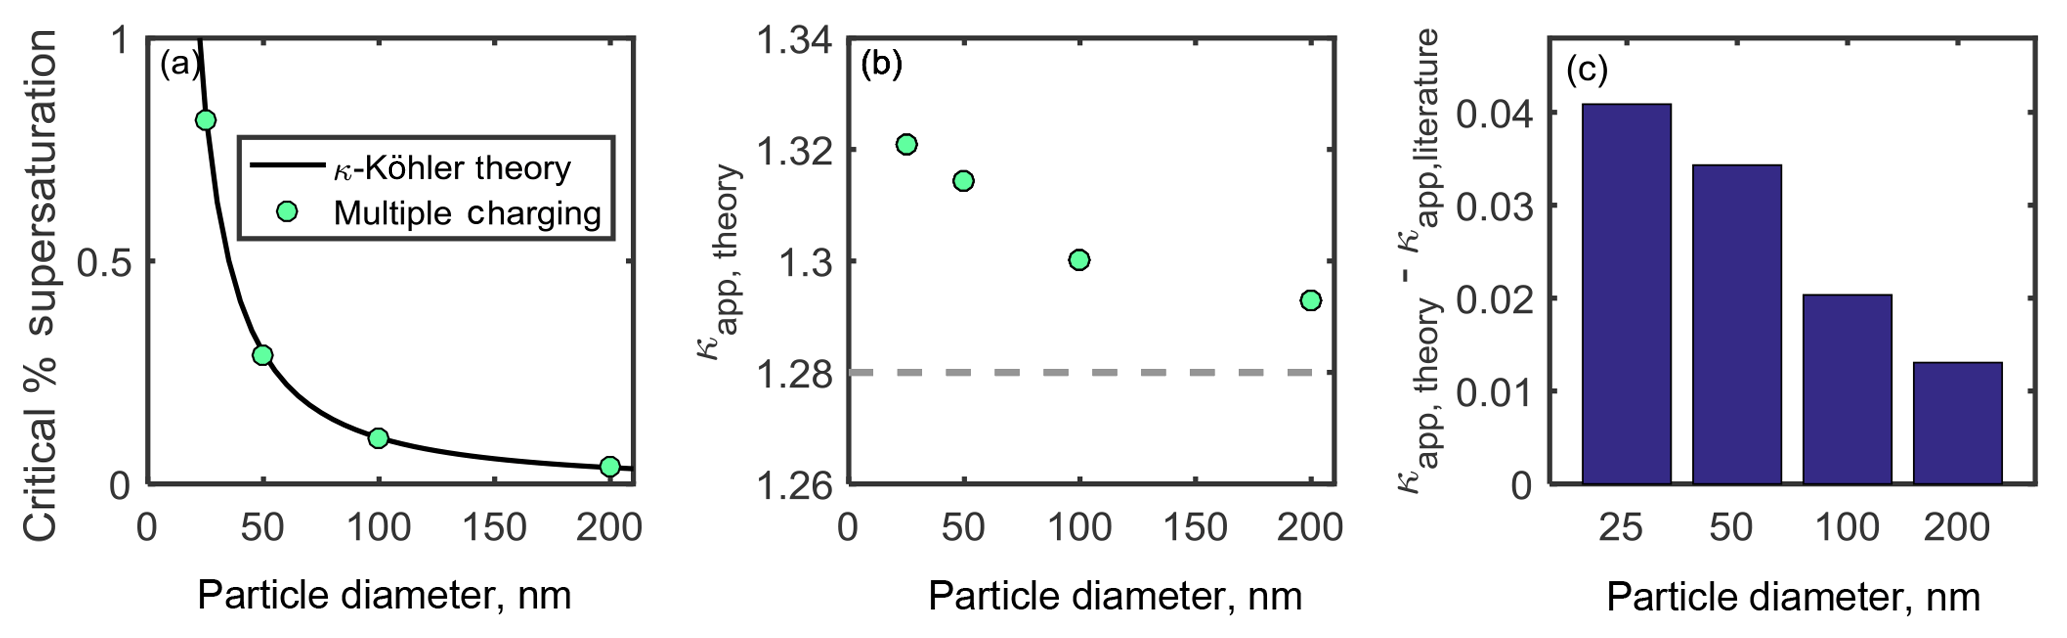
Figure 6(a) Critical percent supersaturation of sodium chloride particles determined from activated fraction curves shown in Fig. 5. A κ-Köhler curve for sodium chloride is shown for comparison. (b) Theoretical κapp for each particle diameter (gray dashed line indicates literature value for ). (c) Artifacts in κapp resulting from multiple particle charges.
It follows that aerosols incorrectly sized due to double and triple charging will be passed from the DMA to the CCN counter and result in an additional uncertainty in the CCN measurements. To illustrate this, activated fraction curves were generated for 25, 50, 100, and 200 nm sodium chloride particle selection by the DMA (Fig. 5). The activation of sodium chloride is represented by sigmoid curves, for which the midpoint of each activation curve is the κ-Köhler-derived critical supersaturation of sodium chloride, and the standard deviation of each curve is 1∕10 of this value (consistent with the standard deviation ∕ midpoint ratio observed from our instrument's ammonium sulfate CCN calibration data). For each particle diameter, D, the observed activated fraction, AF, for each percent supersaturation SS was determined by weighting the activated fraction AF of each particle diameter and charge at that percent supersaturation by the fraction of particles of that diameter:
The raw data shown in Fig. 5 (green curves) can be corrected for multiple charging by determining the fraction of particles with charge from the lower plateau in each plot (dashed lines). The adjusted activated fraction for each percent supersaturation, AFadjusted, is calculated using the equation
where AFraw is the raw activated fraction at that percent supersaturation, and AFplateau is the activated fraction corresponding to the lower plateau (Rose, 2008). The adjusted activated fraction curves are shown in Fig. 5 (blue curves). These are in good agreement with the theoretical κ-Köhler-derived activation curves for sodium chloride (not shown).
Critical supersaturation was determined for each diameter by calculating the percent supersaturation at which the raw AF. These critical supersaturations are shown in Fig. 6a, and the theoretical critical supersaturations calculated from κ-Kohler theory are shown for comparison. Equation (4) was used to calculate apparent hygroscopicity for each particle diameter, shown in Fig. 6b. A dashed line in Fig. 6b indicates the literature value for . It is apparent that failing to account for multiply charged particles in the activated fraction curves shown in Fig. 5 leads to an overestimation of κapp. Artifacts in κapp are shown in Fig. 6c.
For the theoretical aerosol distribution used in this analysis (Fig. 3a), small, positive deviations from κ-Köhler theory and the literature value for were observed (, 1 %–3 % of ). As shown in the figure, κapp artifacts resulting from unaccounted-for multiple charges decrease with particle diameter for this theoretical aerosol population. Greater κapp artifacts would be expected for aerosol populations with more prevalent accumulation modes.
The aerosol ∕ sheath ratio within the DMA also modulates the effect of multiple charges on κapp. As the aerosol ∕ sheath ratio increases, the transfer function broadens, allowing particles that are both larger and smaller than the selected diameter to exit the DMA. This in turn broadens the CCN activated fraction curve (Rose et al., 2008). The larger particles will activate as CCN at lower supersaturations than particles with the selected diameter, resulting in an increase in the activated fraction plateau due to multiply charged particles and a further decrease in the determined SScrit. Petters et al. (2007) showed that CCN activated fraction curves are significantly skewed by multiply charged particles when the mode diameter of the aerosol population upstream of the DMA exceeds the critical diameter of the size-selected particles. In an example CCN activated fraction curve, Rose et al. (2008) demonstrated that a 1 : 6 ratio of doubly to singly charged particles resulted in an underestimation of the critical activation diameter by 2 %. Zhao-Ze and Liang (2014) also showed that multiply charged particles can introduce significant uncertainty into hygroscopicity calculations.
3.1.4 Additional artifacts resulting from DMA measurements
Several additional factors that may impact experimental κapp are beyond the scope of this study, but are worth mentioning as they represent additional potential sources of error in some cases. First, volatile aerosols may partially evaporate inside the DMA, resulting in a decrease in particle size exiting the DMA. DMA sizing error due to aerosol volatility (defined as the ratio of sampled diameter to the selected diameter) increases with volatility, though sizing error can be decreased by increasing the sheath flow rate in the DMA. Conversely, hygroscopic aerosols may grow inside the DMA, resulting in larger particles existing in the DMA. Operationally, errors in DMA sizing due to hygroscopic growth can be mitigated if aerosols entering the DMA inlet are in wet metastable states (higher aerosol relative humidity at DMA inlet) and if DMA sheath flow rates are kept low (Khlystov, 2014).
Voltage shifts within the DMA (differences between the selected voltage and the actual voltage inside the DMA) can lead to discrepancies between selected and sampled particle diameters. Voltage shifts may result from a space-charge field generated by the motion of charges within the DMA. Particles charged by the bipolar neutralizer will either be attracted towards or repelled away from the inner column of the DMA, depending on whether they are positively or negatively charged. This charge separation creates a space-charge field that shifts the actual voltage within the DMA from the selected voltage. The impact of the space-charge field on the midpoint and spread of the DMA transfer function increases as particle mobility increases (as particle size decreases) and as particle concentration increases (Alonso and Kousaka, 1996; Alonso et al., 2000, 2001).
4.1 CPC operation at low concentration
The second instrument that must function accurately during CCN experiments is the CPC. CPC performance is characterized by the maximum counting efficiency (which may be influenced by the working fluid in the instrument) and the 50 % cutoff diameter (d50), the particle diameter at which 50 % counting efficiency is observed, both of which can vary among commercially available models and even among individual CPCs (Heim et al., 2004). One study found that n-butanol CPCs (TSI, Inc. models 3772, 3775, and 3776) exhibited smaller d50 values for silver particles than sodium chloride ( nm and nm) due to the more effective condensation of n-butanol on silver particles (Hermann et al., 2007).
Maximum counting efficiencies in that study varied from 88.9 % to 100.3 %. Another comparison of n-butanol CPCs (TSI Inc. models 3010 and 3022, Grimm Tech. Inc. model 5.403) found nm for sodium chloride aerosols (Heim et al., 2004). In another study, the counting efficiencies observed in measurements of tungsten oxide particles by different instruments of the same model (TSI 3025) varied from 88.9 % to 138.9 %, while varied from 3.2 to 11.0 nm (Hameri et al., 2002).
While some issues can cause undercounting at all concentrations, the additional issue of uncounted particles due to the arrival of more than one particle in the detector's field of view at any time arises only at higher concentrations. The cutoff between low and high concentration is not exact and varies among instruments. CPC undercounting issues that arise even at relatively low concentrations (which one would expect to encounter under standard experimental conditions) will be discussed in this section. Concentration-dependent effects encountered at higher concentrations will be explored in Sect. 4.2.
Six counting efficiency curves were generated using sigmoidal distributions and the 50 % cutoff diameters and maximum counting efficiencies listed in Table 3. Chosen values represent d50 values and maximum counting efficiencies reported in the literature under relatively low concentrations of 1000–4000 cm−3 (Hermann et al., 2007). The resulting sigmoidal distributions (Fig. 7a) were used to determine the counting efficiency of 25, 50, 100, and 200 nm particles.
Table 3Values of 50 % cutoff diameter and maximum counting efficiency used in investigating κapp artifacts for low particle concentrations measured by a CPC.
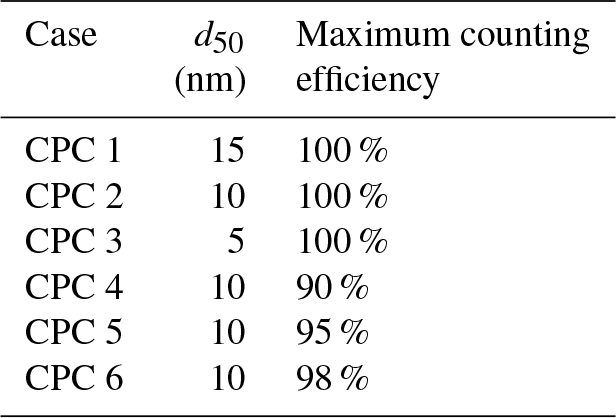
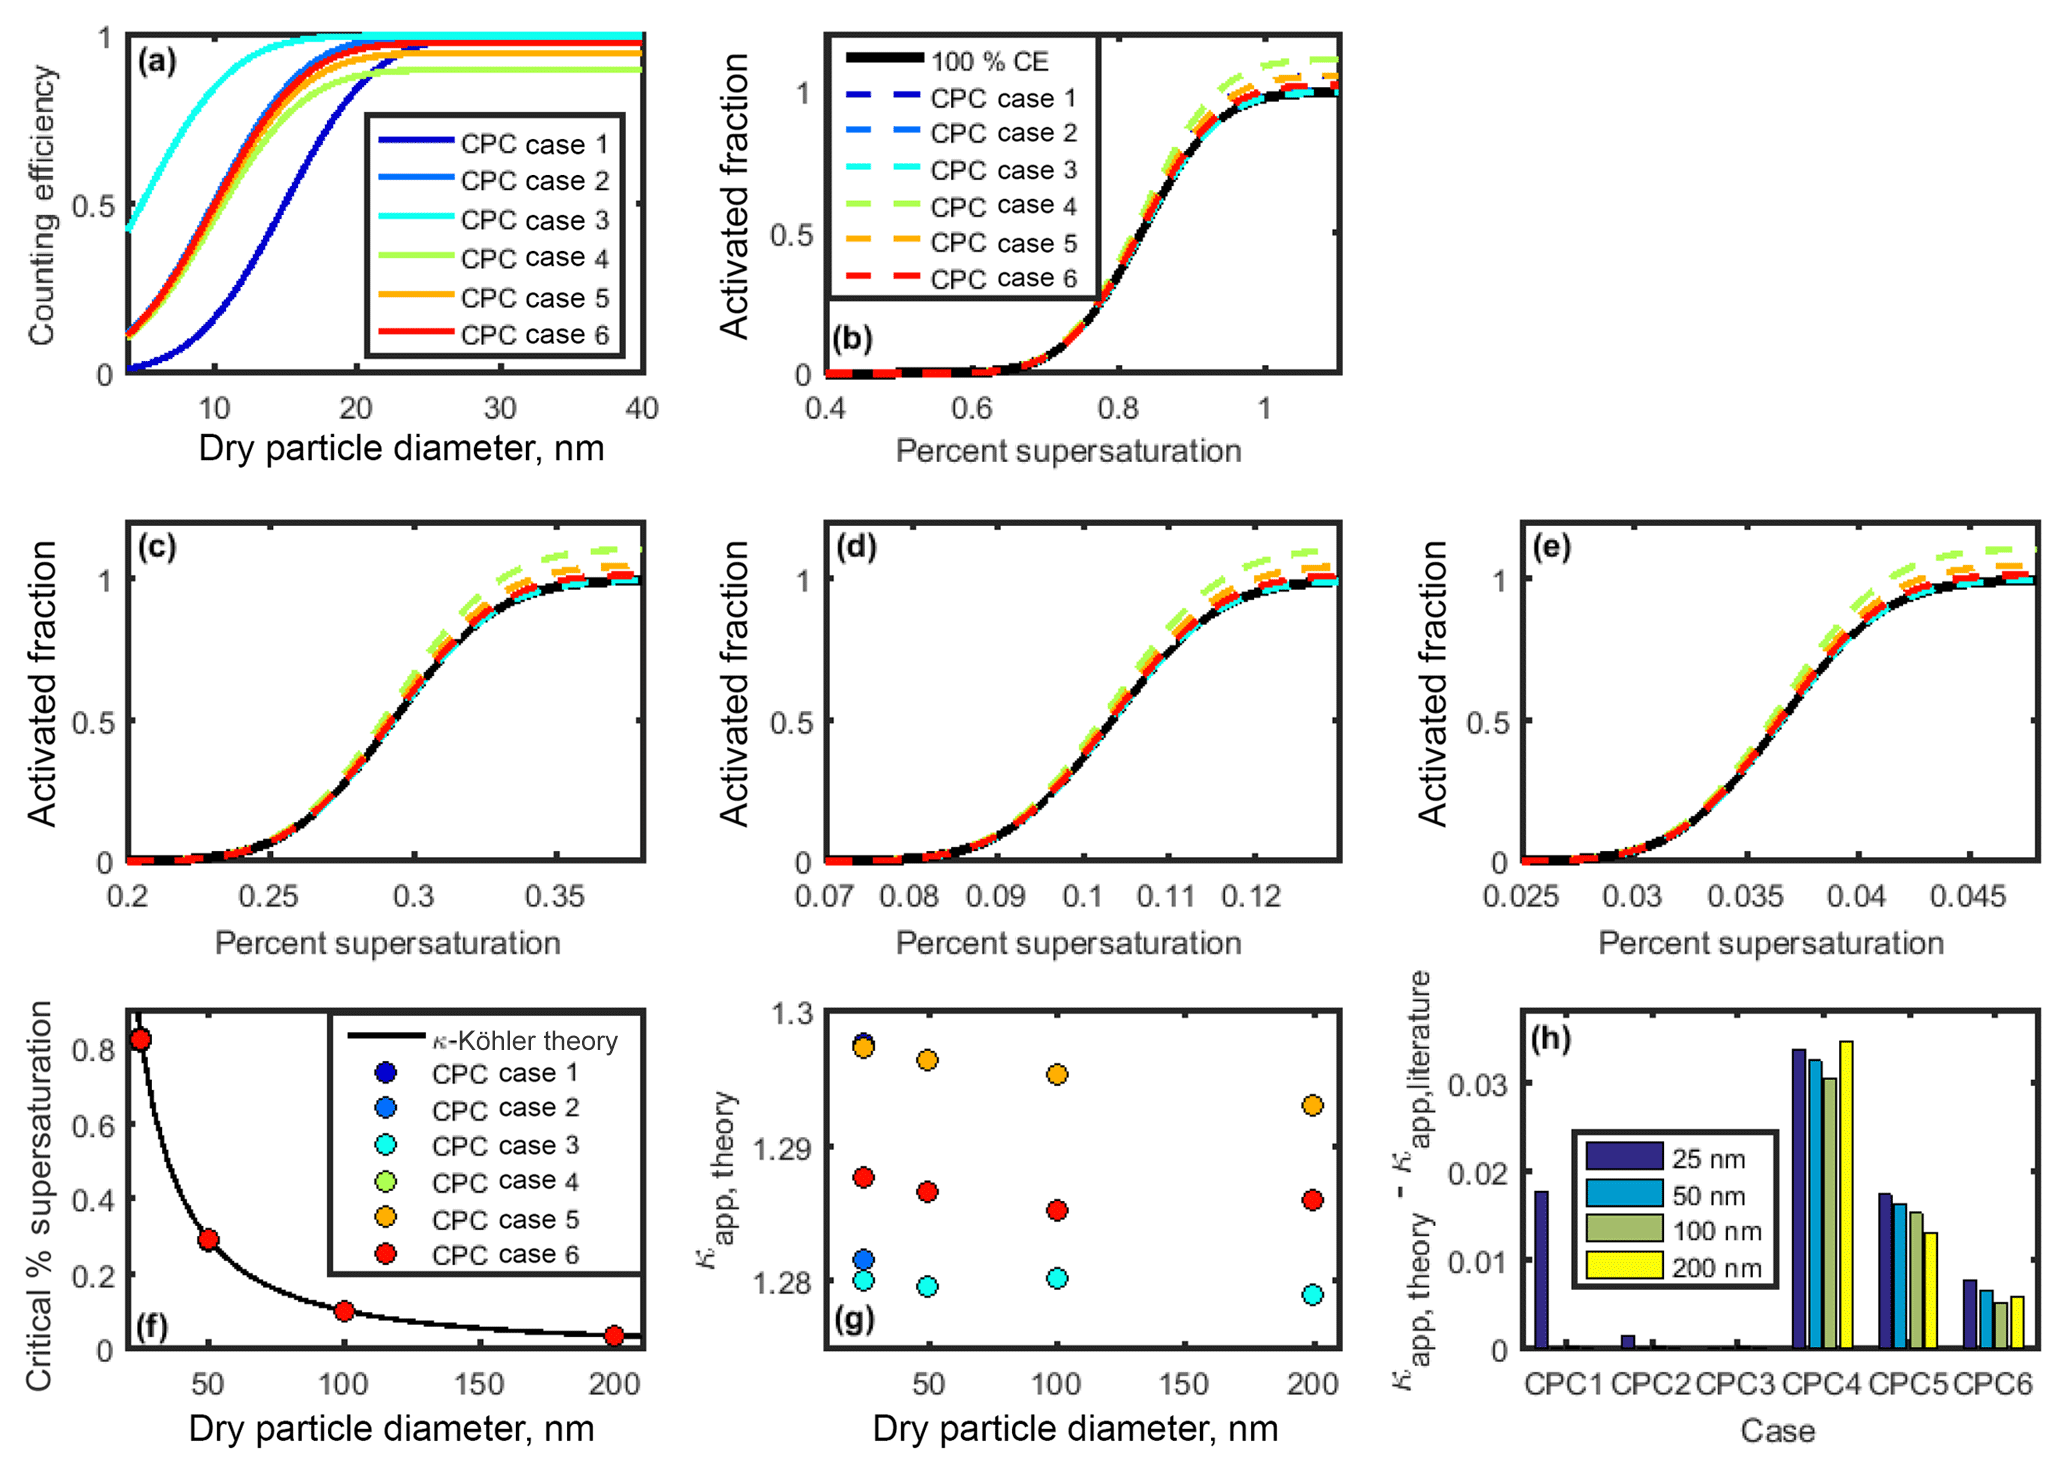
Figure 7(a) Counting efficiency curves for CPC cases 1–6 (shown in Table 3). (b–e) CCN activated fraction curves for 25, 50, 100, and 200 nm NaCl, respectively. (f) Critical supersaturation calculated for each particle diameter. (g) Theoretical κapp for each CPC case and particle diameter. (h) Artifacts in κapp for each CPC case and particle diameter.
Next, κapp was calculated from theoretical critical percent supersaturations for each chosen diameter. To do so, four sigmoid curves representing sodium chloride CCN activation (hereafter referred to as “activation curves”) for 25, 50, 100, and 200 nm were generated. The κ-Köhler SScrit of sodium chloride was used as the midpoint of each activation curve, and 1∕10 of this value was used as the standard deviation (100 % CE, Fig. 7b–e). These values are consistent with the standard deviation ∕ midpoint ratio observed from our instrument's ammonium sulfate CCN calibration data.
Activation curves were then generated for CPC cases 1–6 by dividing the activated fraction for each dry particle diameter by the counting efficiency for that diameter. SScrit was determined for each CPC case by finding the percent supersaturation at which the activated fraction =0.50. Results are summarized in Fig. 7f. Next, critical supersaturation was converted to saturation, and κapp, theory was calculated for each diameter in each CPC case using Eq. (4) (see Fig. 7g). As above, κapp artifacts were calculated by finding the difference between these results and the literature value of κapp for sodium chloride (see Fig. 7h).
For the diameters studied, the effect of maximum counting efficiency on CPC concentration (and activated fraction) is greater than the effect of the the 50 % cutoff diameter. However, neither characteristic resulted in large κapp artifacts. The largest κapp artifact observed at low concentrations was 0.035 for CPC case 4, 2.4 % of the literature value for the apparent hygroscopicity factor for sodium chloride.
4.2 CPC operation at high concentration
Operation at high concentrations introduces an additional source of undercounting through particle coincidence at the CPC optical counter. For the TSI 3010 CPC, undercounting is observed for particle concentrations above 1×104 cm−3. At 5×104 cm−3, the detector saturates and cannot detect higher concentrations. By comparison, the TSI 3025 is effective at counting higher particle concentrations, of up to 2.5×104 cm−3 (Hameri et al., 2002; Sem, 2002).
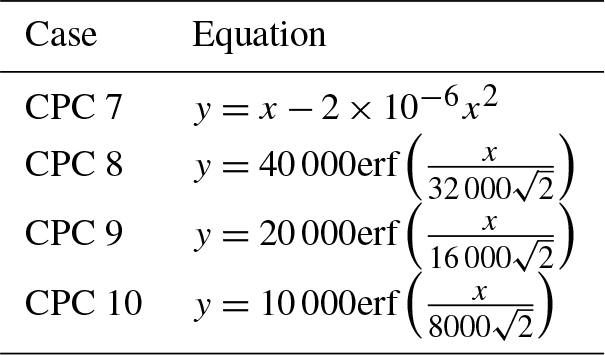
To model undercounting due to particle coincidence, four CPC counting curves (Fig. 8a) were generated using the equations in Table 4. Case 7 represents a CPC for which counting efficiency decreases with particle concentration, without reaching saturation. Cases 8–10 represent CPCs for which saturation is reached at 4×10⁴, 2×10⁴, and 1×104 cm−3, respectively. These saturation concentrations are of similar magnitude to those observed from TSI 3010 concentration data. It should be noted that the CPC concentration in cases 7–10 levels off at the saturation concentration for each case.
In order to assess the importance of undercounting in CPC cases 7–10, four theoretical aerosol distributions with a peak concentration at 50 nm were employed (Table 5, Fig. 8b). CPC distribution 1 represents a worst case scenario of similar magnitude to the highest particle concentrations measured during a coastal nucleation event (Hameri et al., 2002; Sem, 2002), while CPC distributions 2, 3, and 4 are lower in concentration (due to the lack of undercounting in CPC distributions 2, 3, and 4 as demonstrated in Fig. 6b; the remaining analysis for CPC operation at high concentration considers only CPC distribution 1.) CPC cases 8–10 were applied to CPC distribution 1 in order to determine the concentration measured by the CPC for 25, 50, 100, and 200 nm aerosols. The counting efficiency was then calculated for each case and aerosol diameter in CPC distribution 1.
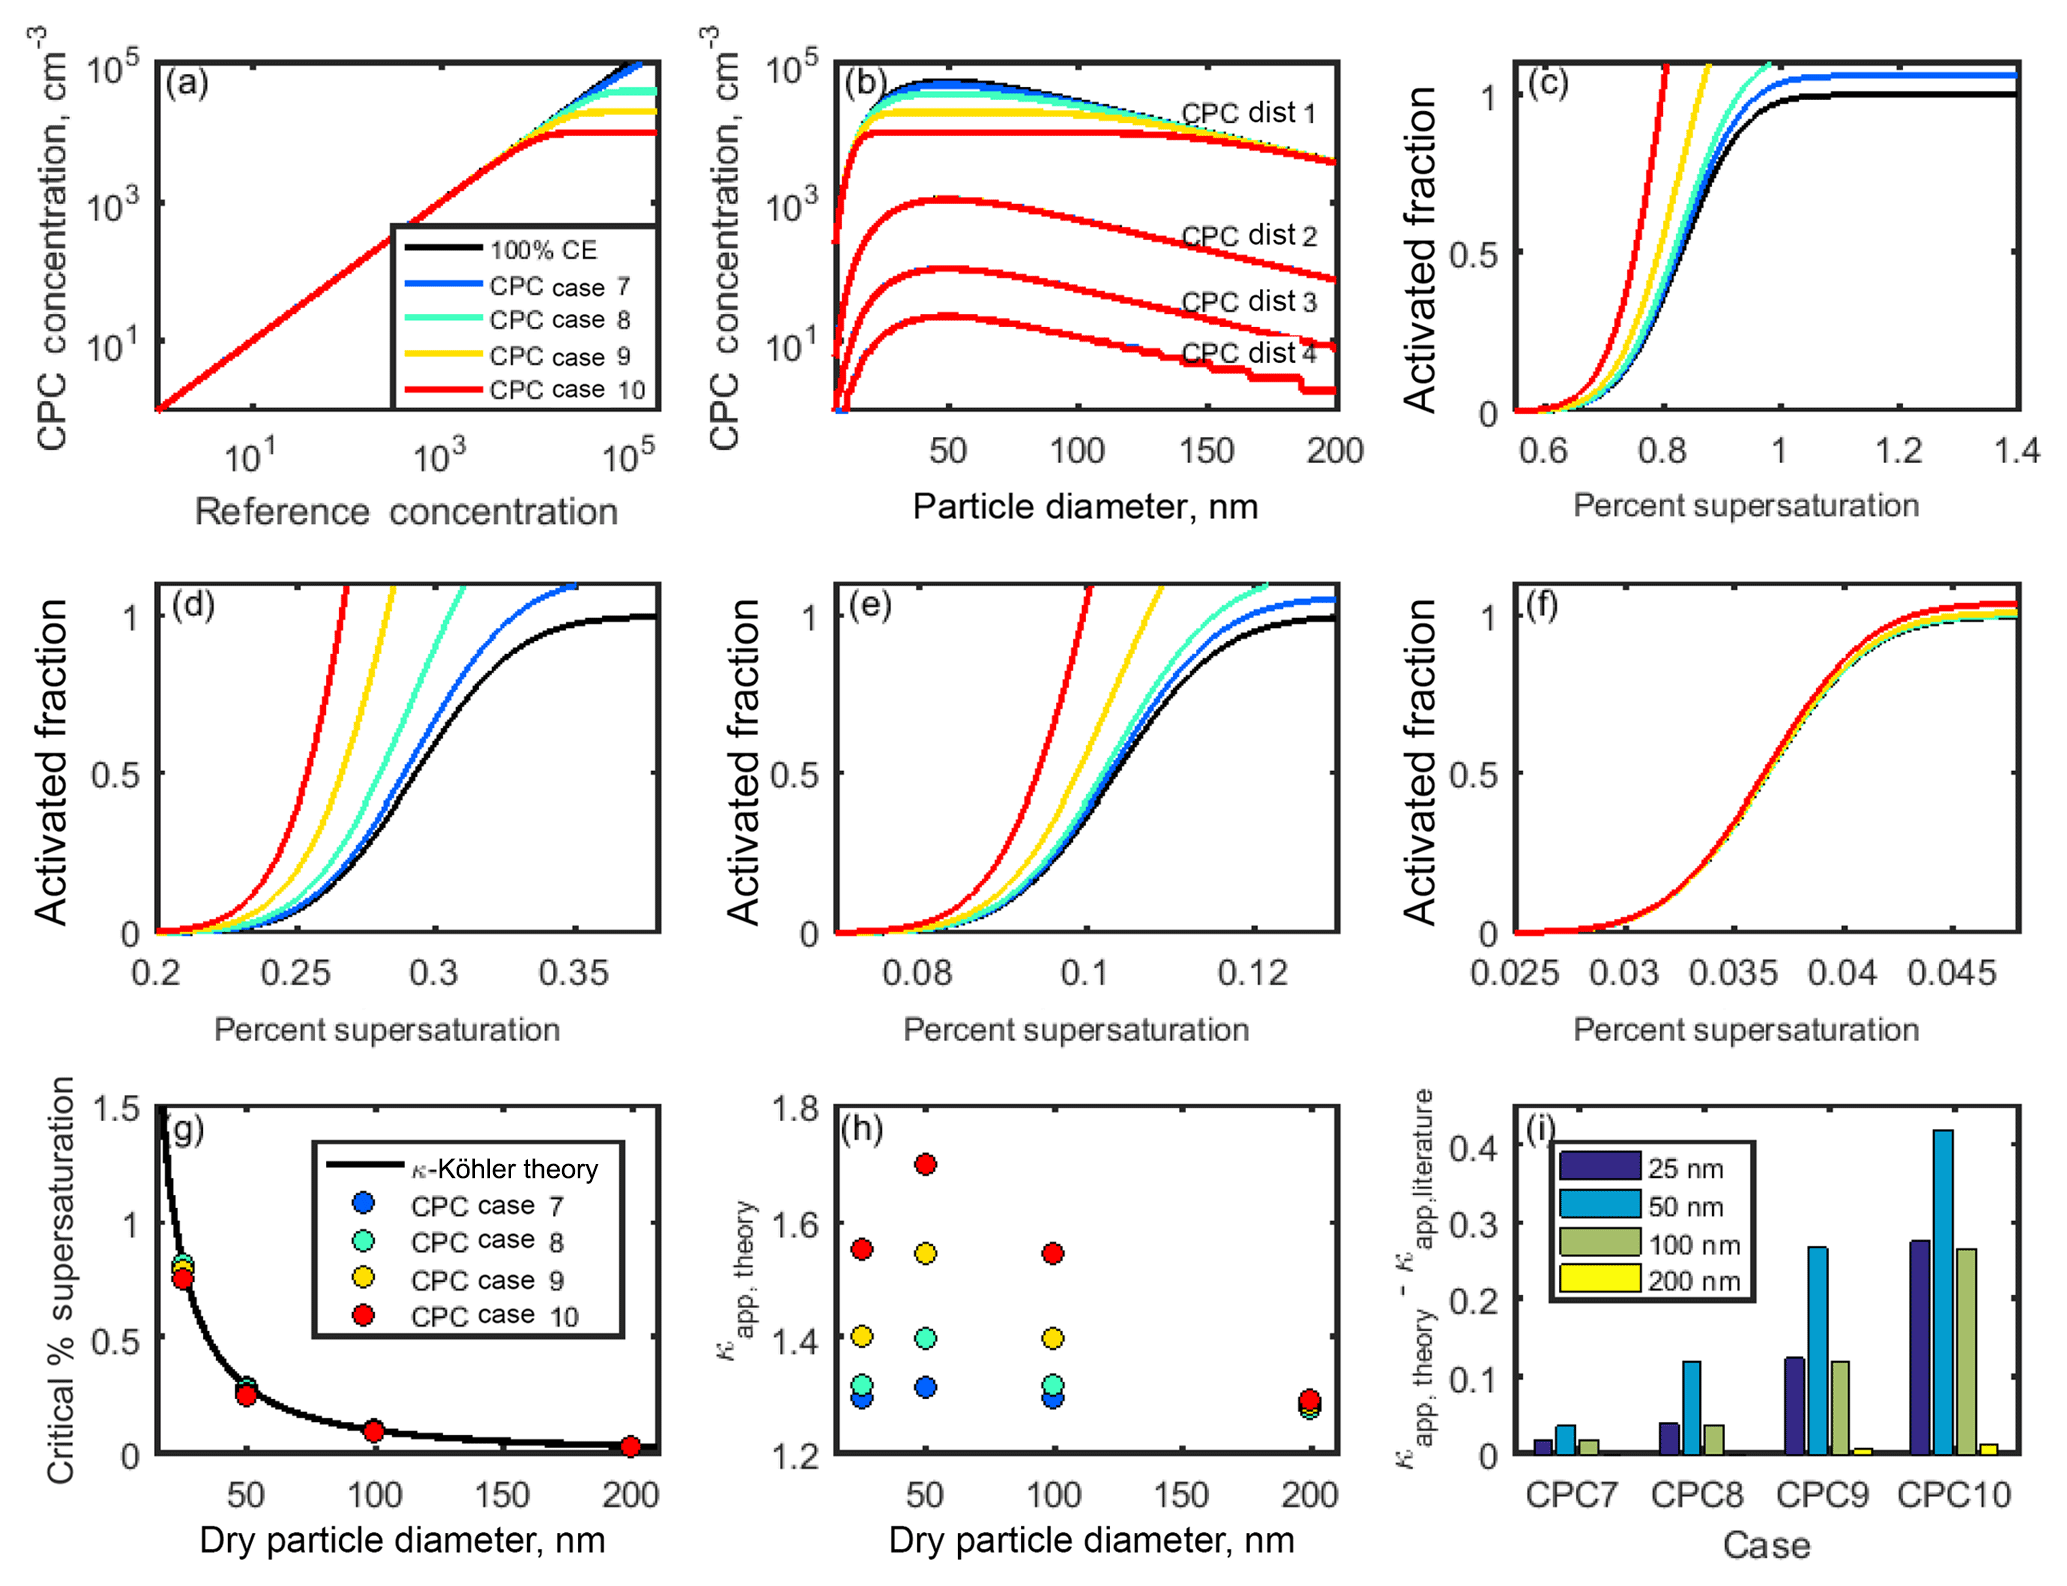
Figure 8(a) Theoretical relationships between the reference aerosol concentration and CPC concentration. (b) Concentration-dependent counting efficiencies from (a) were applied to four theoretical aerosol distributions. (c–f) Activated fraction curves for CPC distribution 1 and particle diameters 25, 50, 100, and 200 nm NaCl aerosol, respectively. (g, h) Critical supersaturation and κapp for each case. (i) Artifacts in κapp for each case.
Table 4Equations used to model the relationship between a reference or true aerosol concentration x (particles cm−3) and the concentration measured by a condensation particle counter y (particles cm−3).
Sigmoidal activated fraction curves were generated for 25, 50, 100, and 200 nm sodium chloride aerosols. As in the low concentration cases, the midpoint of each 100 % CE curve was chosen to be equal to the κ-Köhler-derived SScrit of sodium chloride at each dry diameter, and the standard deviation of each curve is equal to 1∕10 of the SScrit. These activated fraction curves were adjusted using the counting efficiencies calculated in the previous step. In cases in which the activated fraction has increased due to undercounting by the CPC, the theoretical sigmoidal curve shifts to the left relative to the 100 % CE case (Fig. 8c–f). Thus, undercounting by the CPC effectively increases the reported activated fraction. As before, SScrit was determined from each of these curves, and κapp, theory was subsequently calculated using Eq. (4) (Fig. 8g–h).
κapp, theory fell over a much wider range for 25, 50, and 100 nm particles (1.30–1.56, 1.32–1.70, and 1.30–1.55, respectively) than for 200 nm particles (1.28–1.29) due to the lower concentration of 200 nm particles in the chosen aerosol distribution, which resulted in a higher counting efficiency for these aerosols. In comparison, the largest range in κapp, theory was observed for 50 nm aerosols, the peak diameter in this aerosol distribution.
A wider range in κapp, theory was observed for the high-concentration CPC cases (7–10) compared to the low-concentration CPC cases (1–6). The lowest counting efficiency observed across the low-concentration cases was 89.9 % for 25 nm aerosol in case 4, while the lowest counting efficiency observed in the high-concentration cases was 18.0 % for 50 nm aerosol in case 10.
Artifacts in the apparent hygroscopicity parameter are shown in Fig. 8i. κapp artifacts were the greatest for a CPC that becomes saturated at 20 000 particles cm−3 (). The lower the concentration at which a CPC becomes saturated, the more quickly its counting efficiency will drop as concentration increases, resulting in increased activated fraction and increased apparent hygroscopicity. The magnitude of artifacts due to CPC undercounting depends on the saturation concentration of the CPC and the distribution of the aerosol population being studied.
Finally, the third instrument whose performance accuracy contributes to the overall certainty in CCN assessment is the CCN instrument itself. Several instruments have been implemented for measuring CCN concentrations over the last few decades. Older models include the continuous-flow parallel-plate diffusion chamber (Sinnarwalla and Alofs, 1973) and the Hudson CCN spectrometer (Hudson, 1989), which both employ an applied temperature gradient perpendicular to the aerosol flow. Newer models, such as the widely used Droplet Measurement Technologies cloud condensation nuclei counter (DMT CCN-100), operate with a streamwise temperature gradient and continuous laminar flow (Lance et al., 2006). The total flow through the DMT CCN-100 is 0.20–0.90 L min−1, though the instrument is typically operated with a total flow of 0.50 L min−1. The aerosol ∕ sheath ratio in the DMT CCN-100 is set by the user, and a ratio of 1 : 10 is commonly chosen. The following analysis considers the DMT CCN-100. According to the CCN-100 manual, the counting efficiency for this CCN instrument depends on concentration and supersaturation (Fig. 9a). The counting efficiency decreases rapidly with concentration at <0.2 % SS due to rapid water vapor depletion at these low supersaturations and falls off more slowly for >0.2 % SS (DMT CCN-100 manual).
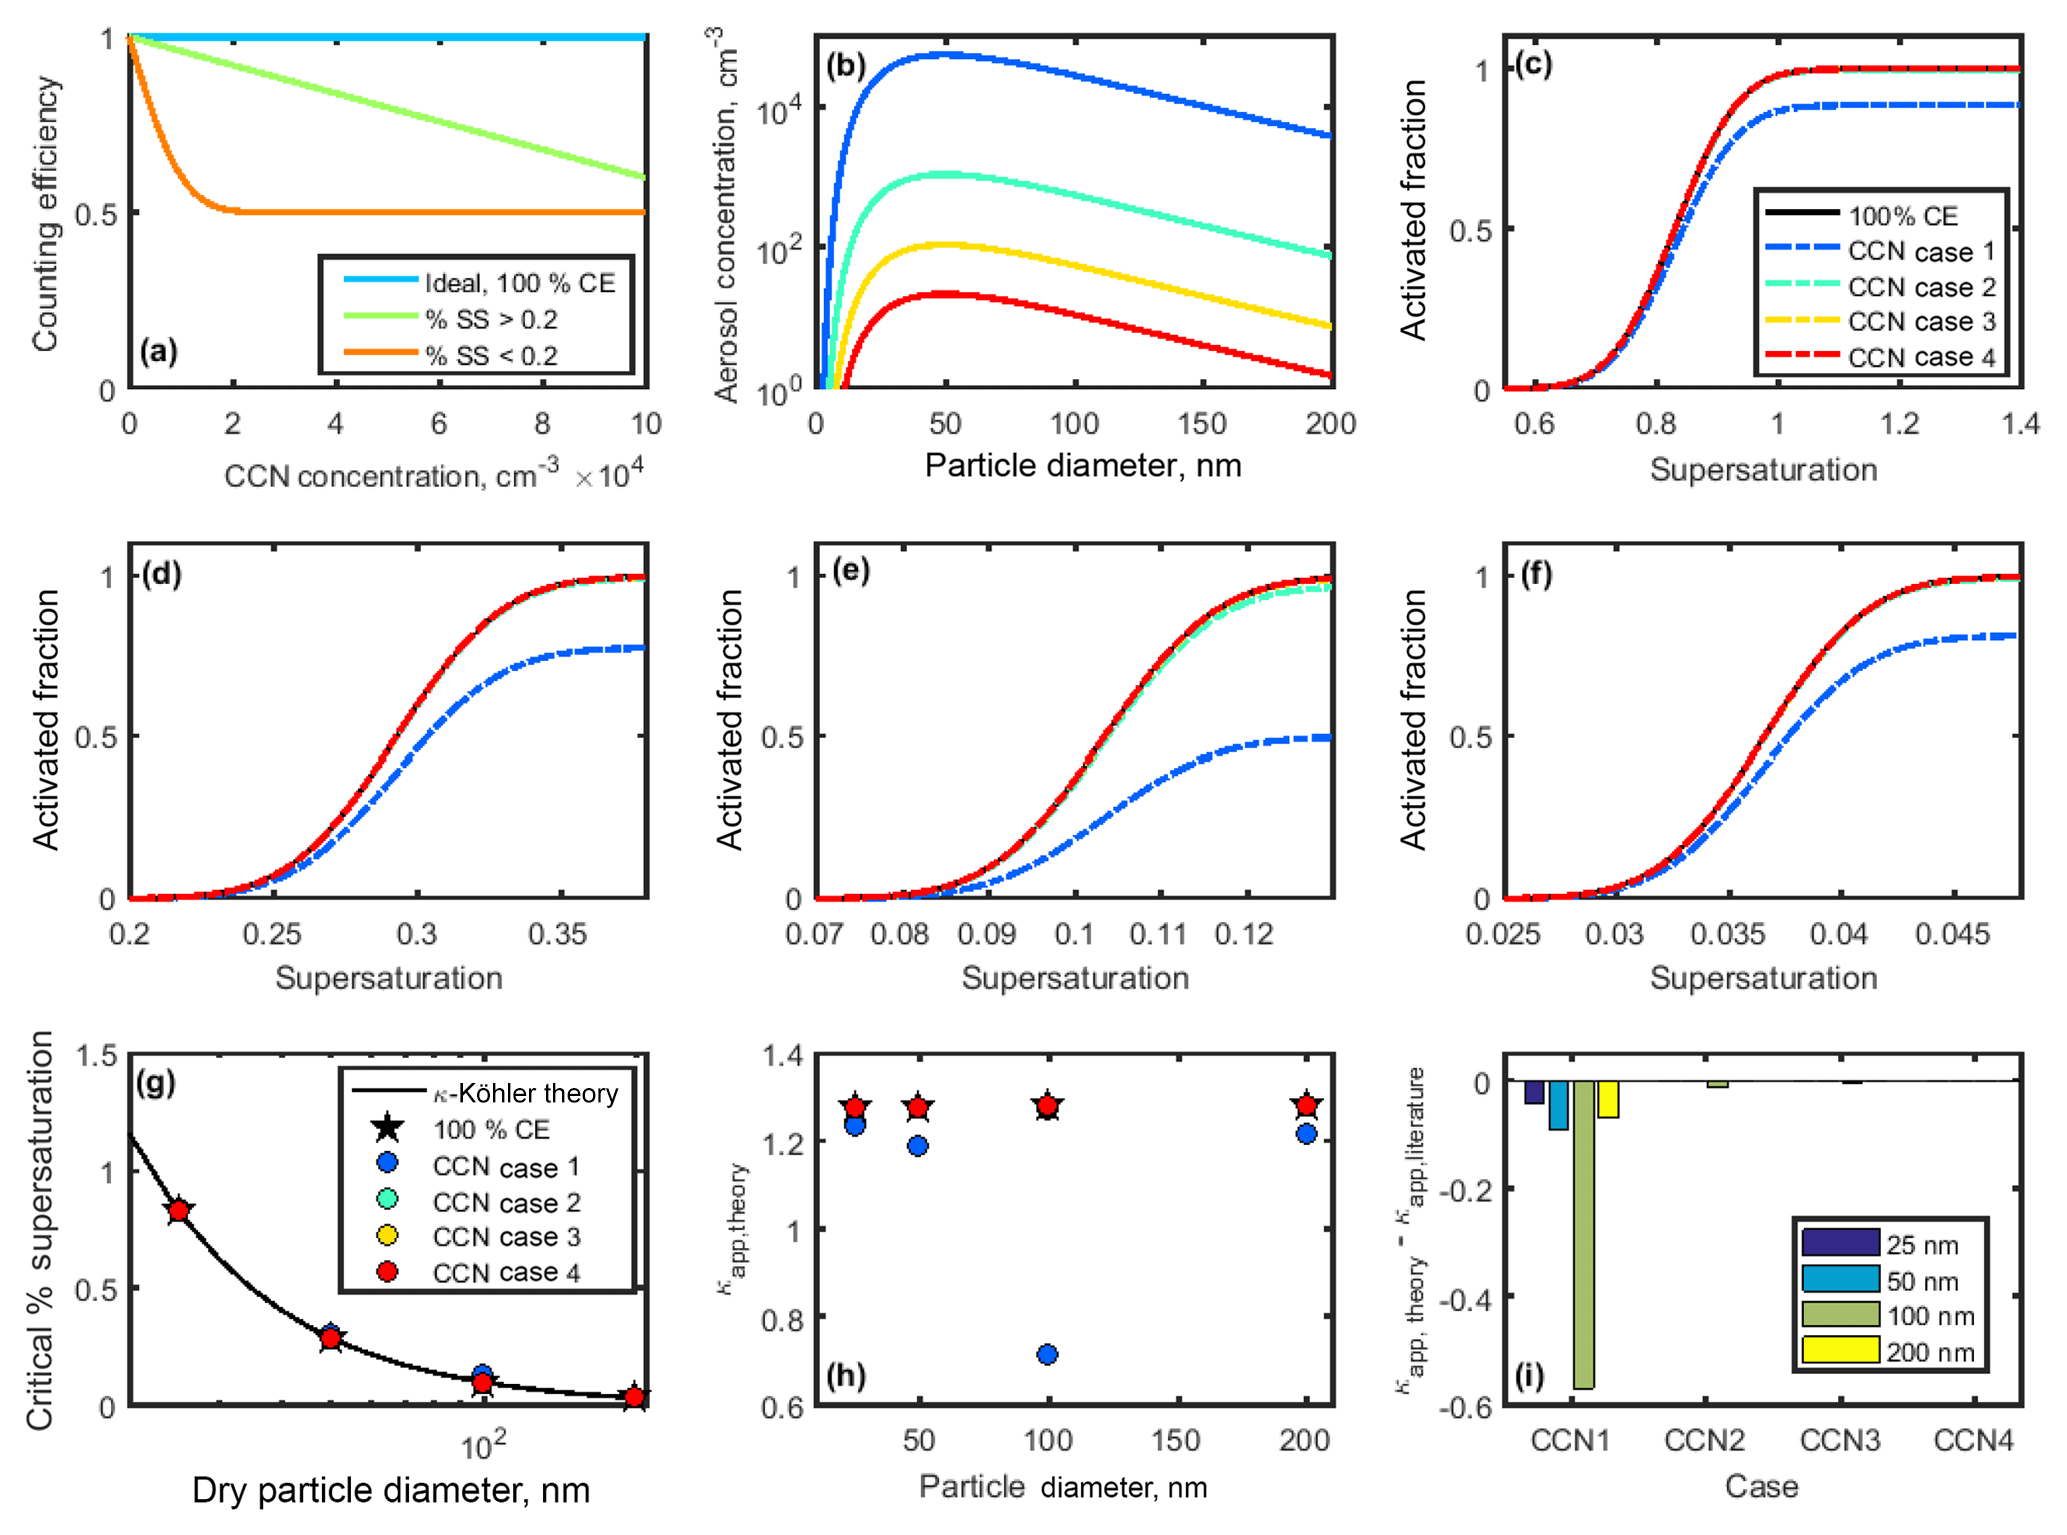
Figure 9(a) Counting efficiencies of the DMT CCN-100 for specific supersaturations. (b) Lognormal aerosol distributions used to study CCN undercounting at high concentrations. (c–f) Activated fraction curves for 25, 50, 100, and 200 nm NaCl particles. Supersaturation-specific counting efficiencies from (a) applied to theoretical sigmoid curves for NaCl CCN activation. Activated fraction in the case of 100 % counting efficiency is shown for comparison. (g) Critical supersaturation for each case. (h) Theoretical κapp calculated for each case. (i) Artifacts in κapp artifacts for each case.
The counting efficiency of the DMT CCN-100 was tested for four lognormal aerosol distributions with peak concentrations at 50 nm and varying total concentrations (Table 5, Fig. 9b). Note that CCN cases 1–4 are identical to the aerosol distributions CPC distributions 1–4 used for the high-concentration CPC cases.
The counting efficiencies for each case were applied to theoretical sodium chloride sigmoidal activated fraction curves to produce normalized activated fraction curves (Fig. 9c–f). As above, the midpoint is set to the SScrit of sodium chloride at each dry diameter, and the standard deviation is assumed to be 1∕10 of SScrit. CCN undercounting effectively decreases the activated fraction, therefore shifting the activated fraction curve downwards and towards higher percent supersaturations. The opposite effect is observed when CPC undercounting occurs. Critical supersaturation was determined for each CCN case, as above (Fig. 9g). Values of SScrit were then converted to saturation, and κapp, theory was calculated using Eq. (4) (Fig. 9h).
Table 5Total concentrations used in theoretical aerosol distribution for CPC operation at high concentration and CCN-derived κapp artifacts.
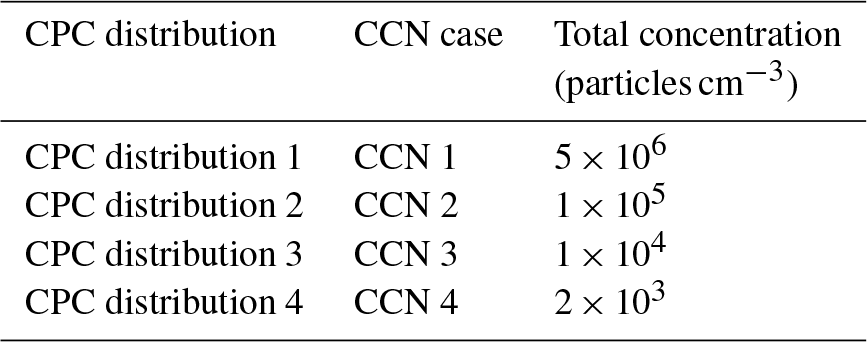
Significant deviations from κ-Köhler theory were only observed in CCN case 1, with total aerosol concentration of 5×10⁶ particles cm−3 (Fig. 9g–i). The largest deviation for CCN case 1 was observed in 100 nm particles (), due to the higher concentration of 100 nm particles compared to 25 and 200 nm particles and the lower percent supersaturation necessary for activation. The largest artifacts across CCN cases 2 and 3 were also observed for 100 nm particles, though no artifacts were observed for any particle diameter in CCN case 4 due to the much lower concentrations.
Sodium chloride is very hygroscopic. It should be noted that aerosols consisting of less hygroscopic compounds will activate at higher percent supersaturations (>0.2 % SS regime), which will lead to smaller κapp artifacts when the same aerosol distribution and total aerosol concentration is considered. If a mixture was considered (for example, sodium chloride with a nonhygroscopic species such as soot) the results may also be different. The shape of the aerosol distribution must also be taken into account. A distribution with a narrower peak than the one generated for this analysis would be at risk for larger κapp artifacts for any total aerosol concentration, and these artifacts would be greater at the peak diameter, while a broader distribution would result in less variation in κapp artifacts for each particle diameter.
Though it is beyond the scope of this analysis, it should be mentioned that sampling at very low particle concentrations (<200 cm−3 total particle concentration) can introduce additional error into CCN and CPC measurements. This error can be mitigated by increasing scan times (Moore et al., 2010). For example, Moore et al. (2010) averaged CCN and particle concentrations over 5 s intervals for monodisperse particle concentrations <10 cm−3 and increased averaging time to 20 s intervals when the monodisperse particle concentration reached <6 cm−3.
A comparison of the major instrument sources of error in CCN-derived κapp is shown in Fig. 10. In addition, the best and worst case combination of errors, determined by additive error propagation, are also shown. DMA case 4, CPC case 4, CPC case 10, and CCN case 1 represent the operating conditions that resulted in the largest κapp artifacts in this study. In DMA case 4, the aerosol ∕ sheath ratio of 0.30 resulted in a broadened aerosol distribution downstream of the DMA. Compared to DMA case 1, in which , the downstream diameter range in DMA case 4 was 300 % higher for 25 nm particles, resulting in a spread of 20–36 nm. Similarly, the diameter ranges for the 50, 100, and 200 nm diameters were 220 %, 230 %, and 220 % wider than in case 1, respectively. Compared to the most ideal DMA case presented in this study (DMA case 2), in which , the downstream diameter range in DMA case 4 was 700 % higher for 25 nm particles; the diameter ranges for the 50, 100, and 200 nm diameters were 540 %, 560 %, and 520 % wider than in case 2, respectively. The results demonstrate that limiting Qa ∕ Qsh to ≤0.10 will result in a narrow particle size distribution downstream of the DMA. Other studies have recommended employing DMA sample ∕ sheath ratios of 0.2 (Petters et al., 2007; Carrico et al., 2008; Moore et al., 2010) or 0.1 (Moore et al., 2010; Zhao-Ze and Liang, 2014) in order to minimize measurement aerosols due to transfer function broadening.
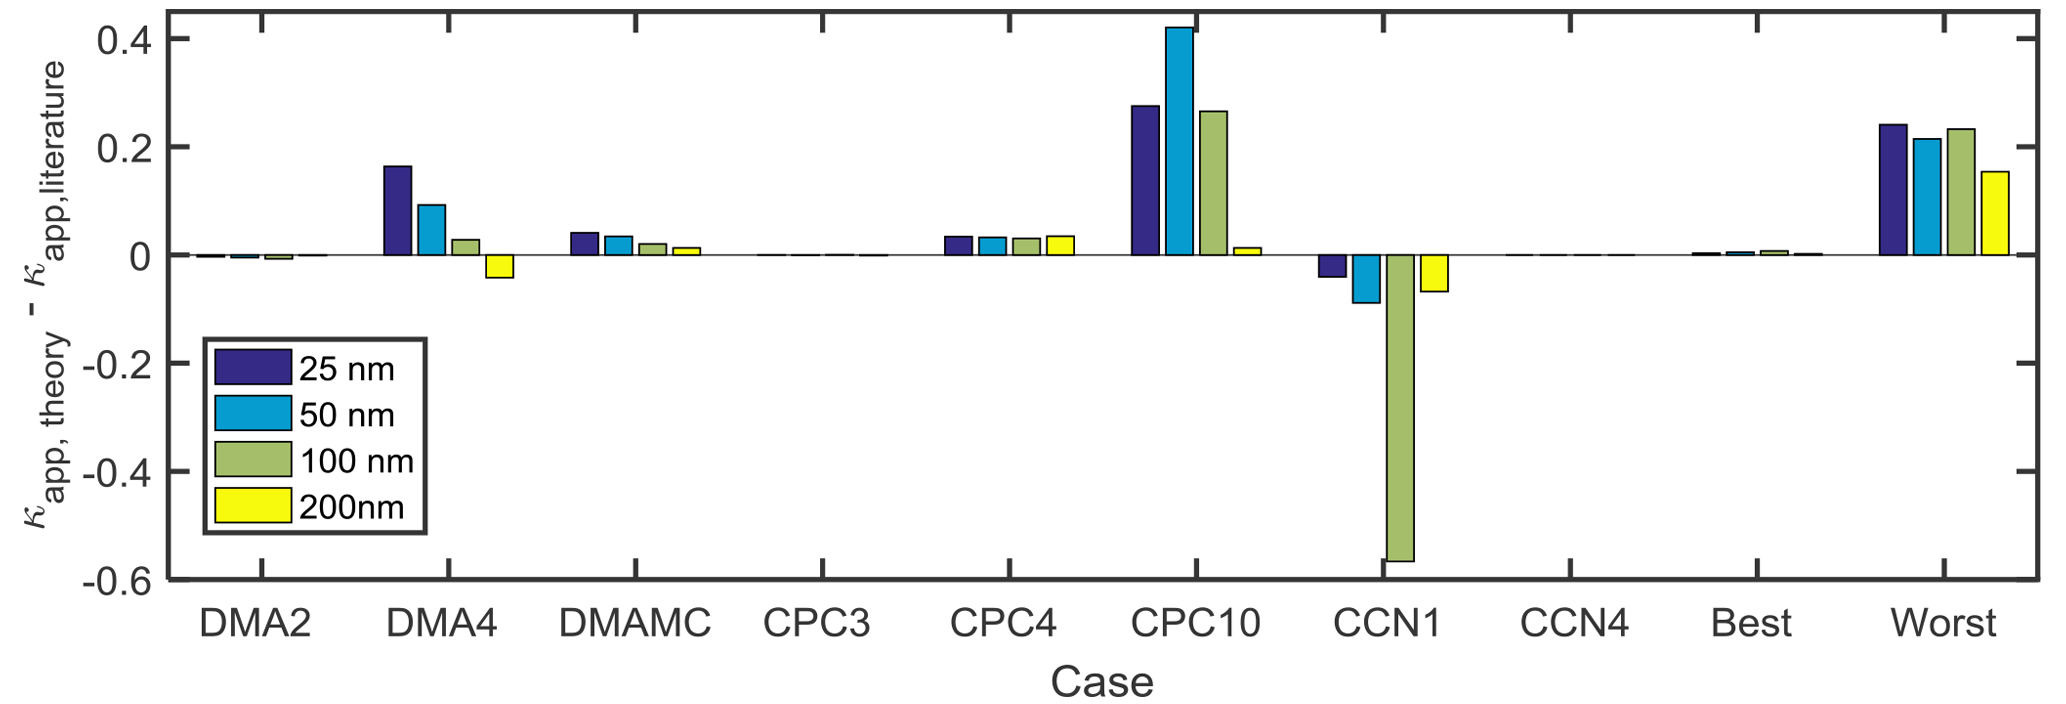
Figure 10Comparison of κapp artifacts derived from best and worst case scenarios for instrumental measurements for sodium chloride. Combined artifacts for the lowest-artifact cases (best: DMA case 2, CPC case 3, and CCN case 4) and the highest-artifact cases (worst: DMA case 4, multiple charging, CPC case 4, CPC case 8, and CCN case 1).
The effects of multiply charged particles on κapp calculations were also quantified, as shown in Fig. 10. Small, positive κapp artifacts (1 %–3 % of ) were observed when particles with +2 and +3 charges were not accounted for. This analysis considered a theoretical aerosol distribution in which most of the particles measure less than 100 nm in diameter. Actual aerosol distributions vary temporally and spatially and often include accumulation and coarse modes that would result in larger κapp artifacts.
CPC case 4 represents κapp artifacts (0.031–0.035) due to undercounting that arises from poor maximum CPC counting efficiency (90 %), which may be observed when using butanol as a working fluid while measuring the concentration of inorganic aerosols. In contrast, κapp artifacts are negligible (<0.10 % of ) in CPC case 3, in which maximum counting efficiency =100 %. CPC cases 8 and 10 (applied to the highest-concentration case, CPC distribution 1) represent undercounting at high concentration with CPCs for which saturation is observed at 4×10⁴ and 1×104 cm−3, respectively. Counting efficiency drops off more rapidly with concentration in the latter case, resulting in κapp artifacts that are highest at the peak of the aerosol distribution (0.1190 and 0.4206 for 50 nm aerosols in CPC cases 8 and 10, respectively). It should be noted that undercounting was only observed for one of the four upstream distributions studied, CPC distribution 1. No undercounting was observed when CPC cases 7–10 were applied to CPC distributions 2–4.
CCN case 1 represents CCN undercounting at high concentration (total aerosol concentration cm−3). CCN undercounting is greatest for low supersaturation (<0.2 %) and high concentration, resulting in the lowest counting efficiency and highest κapp artifacts (−0.57) for 100 nm aerosols in CCN case 1. The largest CCN-derived κapp artifact observed outside of CCN case 1 was −0.01 for 100 nm aerosols in CCN case 2.
The combined artifacts for the cases in which the highest artifacts were observed (DMA case 4, multiple particle charging, CPC case 4, CPC case 10, CCN case 1) are 0.24, 0.21, 0.23, and 0.15 for 25, 50, 100, and 200 nm particles, respectively, as shown in Fig. 10. The combined artifacts for the lowest-artifact cases (DMA case 2, CPC case 3, and CCN case 4) are <0.008 except for all four particle diameters.
The sensitivity of weather and climate models to accuracy in CCN activation predictions has been demonstrated in other works. Possible sources of apparent hygroscopicity artifacts calculated from CCN measurements have been presented in this study. This analysis has focused on sodium chloride and ammonium sulfate aerosols, but it can be extended to other aerosol populations, including mixtures and field samples.
The greatest combined artifacts (, NaCl) occurred as a result of the combined issues of the highest DMA aerosol ∕ sheath ratio, uncorrected multiple particle charging, and undercounting by both CPC and CCN instruments. The lowest combined artifacts (, NaCl) occurred as a result of ideal operating conditions: lowest DMA ∕ sheath ratio, corrected multiple particle charging, and little to no undercounting.
The largest single-instrument artifacts ( for sodium chloride) in this study arise from undercounting by either the CPC or CCN counter at high concentration. This problem occurs during attempts to measure aerosol concentrations of ∼104 cm−3, which is much higher than the recommended concentration ranges for either instrument (CPC cases 7–10 and CCN case 4). Corrective action should be taken to dilute aerosol samples in order to avoid undercounting. It should be noted that these artifacts are for individual instruments and do not take combined operation of the CPC and CCN into account; when both instruments undercount, artifacts in κapp, artifact are reduced.
Smaller single-instrument artifacts ( were observed for the CPC cases in which 50 % cutoff diameter and maximum counting efficiency were varied. Given the chosen particle diameters (25, 50, 100, 200 nm), κapp artifacts due to d50 were minimal. The largest κapp artifacts for a CPC counting at low concentration (0.031–0.035) were observed when the maximum counting efficiency was equal 0.90. This may represent a compositional mismatch between n-butanol as the working fluid and sodium chloride as the aerosol due to the poor solubility of the latter in the former. Individual n-butanol CPCs may exhibit higher maximum counting efficiencies for sodium chloride.
Uncertainty arising from the DMA depended greatly on the chosen aerosol and sheath settings. One set of DMA cases (cases 2–4) examined the effect of aerosol ∕ sheath ratio. By decreasing this ratio, a narrower near-monodisperse flow can be produced, which increases the accuracy of calculated κapp. The κapp artifacts for an aerosol ∕ sheath ratio of 0.10 were 0.65 % of κliterature for 25 nm sodium chloride aerosols, 0.31 % for 50 nm, −0.17 % for 100 nm, and −1.2 % for 200 nm.
The second set of DMA cases (5–7) were designed to evaluate the effects of holding the sheath flow constant while varying the excess air flow by −2 %, +2 %, and +5 %. These resulted in shifts of ≤2 nm for 25 and 50 nm particles, ≤4 nm for 100 nm particles, and ≤7 nm for 200 nm particles. The downstream aerosol distribution was shifted towards larger particle diameters when sheath flow exceeded excess flow and towards smaller particle diameter when sheath flow was less than excess flow. When taking field measurements, the composition of the sample may vary with particle diameter, thereby introducing another source of error from a broader DMA distribution.
By extension, the issue of uncertain sizing by the DMA leads to added uncertainties in the CCN instrument calibrations, which are strongly dependent on the chosen aerosol-to-sheath ratio within the DMA. We recommend conducting all CCN calibrations with a DMA aerosol-to-sheath ratio of 1 : 10 or 1 : 20, which will reduce kappa uncertainties to less than 1 % for all dry sizes (25 to 200 nm).
Overall, under optimal operating conditions, where the DMA aerosol ∕ sheath ratio is 0.10 and excess ∕ sheath ratio is 1.0, and in the absence of undercounting by the CPC or CCN, uncertainties in κapp are less than ±1.2 % for 25 to 200 nm particles. During sampling, when the DMA sample ∕ sheath ratio is reduced to 0.05, κapp uncertainties decrease to ±0.58 %. Additionally, errors in the activated fraction (and therefore κapp) resulting from the bipolar charge distribution can be corrected by determining the fraction of particles with multiple charges.
Apparent hygroscopicity parameter artifacts were calculated for two pure inorganic species in this study. This analysis could be used to estimate κapp artifacts for ambient aerosol populations, which may result in a better understanding of the real differences among these populations. As discussed in the introduction, Collins et al. (2016) aggregated κapp from several mesocosm and field studies for 30–100 nm sea spray aerosol (). The wide range of κapp in these studies may be attributed to differences in composition, experimental artifacts, or a combination of the two. Quantification of experimental artifacts would facilitate interpretation of κapp in aerosol populations and constrain the importance of composition in CCN activation. There has been a recent proliferation of CCN data availability from multiple researchers and multiple experimental setups. To maximize the utility of these studies and to compare cloud-activating properties of various ambient aerosol masses, it is essential that artifacts are considered in both CCN data collection and reporting of the data.
This work is theoretical (no data were collected using instruments).
| αCC, βCC, γCC | Empirically determined constants used to calculate Cunningham slip correction factor |
| Zp | Aerosol particle electrical mobility |
| CC | Cunningham slip correction factor |
| dm | Electrical mobility diameter |
| n | Number of charges on particle |
| e | Elementary unit of charge |
| η | Gas dynamic viscosity |
| λ | Mean free path |
| Qsh | Sheath flow |
| Qe | Excess air flow |
| Qa | Aerosol flow |
| Qs | Sample flow |
| κapp | Apparent hygroscopicity parameter |
| κapp, artifact | Apparent hygroscopicity parameter artifact |
| s | Equilibrium water vapor saturation |
| scrit | Critical saturation (50 % of aerosols active as cloud condensation nuclei) |
| A | Constant used in calculating κapp |
| σlv | Surface tension of water |
| T | Temperature |
| Dact | Activation diameter |
| SScrit | Critical percent supersaturation |
| αTF | Height of DMA transfer function |
| βTF | Half-width of DMA transfer function |
| Mobility of particle at DMA inlet | |
| Zp, mid | Midpoint of transfer function |
| ΔZp | Half-width of transfer function |
| V0 | Voltage selected at DMA |
| r1 | DMA inner radius |
| r2 | DMA outer radius |
| L | DMA length |
| d50 | 50 % cutoff diameter |
The supplement related to this article is available online at: https://doi.org/10.5194/amt-11-6389-2018-supplement.
SDB provided the conceptual framework and contributed to the writing of the paper. JAM performed the analysis and led the writing of the paper.
The authors declare that they have no conflict of interest.
This project was supported by the National Science Foundation of the United
States (award no. 15398810). In addition, Jessica A. Mirrielees thanks Texas
A&M University for support through the Institute for Advanced Study HEEP
PhD Fellowship and a Lechner Scholarship.
Edited by: Mingjin Tang
Reviewed by: three anonymous referees
Alonso, M. and Kousaka, Y.: Mobility shift in the differential mobility analyzer due to Brownian diffusion and space-charge effects, J. Aerosol Sci., 27, 1201–1225, https://doi.org/10.1016/0021-8502(96)00052-3, 1996.
Alonso, M., Alguacil, F. J., and Kousaka, Y.: Space-charge effects in the differential mobility analyzer, J. Aerosol Sci., 31, 233–247, https://doi.org/10.1016/s0021-8502(99)00051-8, 2000.
Alonso, M., Alguacil, F. J., Watanabe, Y., Nomura, T., and Kousaka, Y.: Experimental evidence of DMA voltage shift due to space-charge, Aerosol Sci. Technol., 35, 921–923, https://doi.org/10.1080/02786820126855, 2001.
Andreae, M. O. and Rosenfeld, D.: Aerosol-cloud-precipitation interactions. Part 1. The nature and sources of cloud-active aerosols, Earth-Sci. Rev., 89, 13–41, https://doi.org/10.1016/j.earscirev.2008.03.001, 2008.
Asa-Awuku, A., Nenes, A., Gao, S., Flagan, R. C., and Seinfeld, J. H.: Water-soluble SOA from Alkene ozonolysis: composition and droplet activation kinetics inferences from analysis of CCN activity, Atmos. Chem. Phys., 10, 1585–1597, https://doi.org/10.5194/acp-10-1585-2010, 2010.
Barmpounis, K., Maisser, A., Schmidt-Ott, A., and Biskos, G.: Lightweight differential mobility analyzers: Toward new and inexpensive manufacturing methods, Aerosol Sci. Technol., 50, 4 pp., https://doi.org/10.1080/02786826.2015.1130216, 2016.
Betancourt, R. M., Nenes, A., and Liu, X. H.: Relative Contributions of Aerosol Properties to Cloud Droplet Number: Adjoint Sensitivity Approach in a GCM, in: AIP Conference Proceedings, 19th International Conference on Nucleation and Atmospheric Aerosols (ICNAA), Colorado State Univ, Ctr Arts, Fort Collins, CO, 2013, WOS:000319766400170, 679–682, 2013.
Bougiatioti, A., Fountoukis, C., Kalivitis, N., Pandis, S. N., Nenes, A., and Mihalopoulos, N.: Cloud condensation nuclei measurements in the marine boundary layer of the Eastern Mediterranean: CCN closure and droplet growth kinetics, Atmos. Chem. Phys., 9, 7053–7066, https://doi.org/10.5194/acp-9-7053-2009, 2009.
Brooks, S. D. and Thornton, D. C. O.: Marine Aerosols and Clouds, Annu. Rev. Mar. Sci., 10, 289–313, https://doi.org/10.1146/annurev-marine-121916-063148, 2018.
Carrico, C. M., Petters, M. D., Kreidenweis, S. M., Collett, J. L., Engling, G., and Malm, W. C.: Aerosol hygroscopicity and cloud droplet activation of extracts of filters from biomass burning experiments, J. Geophys. Res., 113, D08206, https://doi.org/10.1029/2007jd009274, 2008.
Carslaw, K. S., Lee, L. A., Reddington, C. L., Pringle, K. J., Rap, A., Forster, P. M., Mann, G. W., Spracklen, D. V., Woodhouse, M. T., Regayre, L. A., and Pierce, J. R.: Large contribution of natural aerosols to uncertainty in indirect forcing, Nature, 503, 67–71, https://doi.org/10.1038/nature12674, 2013.
Chang, D. Y., Lelieveld, J., Tost, H., Steil, B., Pozzer, A., and Yoon, J.: Aerosol physicochemical effects on CCN activation simulated with the chemistry-climate model EMAC, Atmos. Environ., 162, 127–140, https://doi.org/10.1016/j.atmosenv.2017.03.036, 2017.
Clegg, S. L., Brimblecombe, P., and Wexler, A. S.: Thermodynamic model of the system H+––––H2O at tropospheric temperatures, J. Phys. Chem. A, 102, 2137–2154, https://doi.org/10.1021/jp973042r, 1998.
Collins, D. B., Bertram, T. H., Sultana, C. M., Lee, C., Axson, J. L., and Prather, K. A.: Phytoplankton blooms weakly influence the cloud forming ability of sea spray aerosol, Geophys. Res. Lett., 43, 9975–9983, https://doi.org/10.1002/2016gl069922, 2016.
Crosbie, E., Youn, J.-S., Balch, B., Wonaschütz, A., Shingler, T., Wang, Z., Conant, W. C., Betterton, E. A., and Sorooshian, A.: On the competition among aerosol number, size and composition in predicting CCN variability: a multi-annual field study in an urbanized desert, Atmos. Chem. Phys., 15, 6943–6958, https://doi.org/10.5194/acp-15-6943-2015, 2015.
DeCarlo, P. F., Slowik, J. G., Worsnop, D. R., Davidovits, P., and Jimenez, J. L.: Particle morphology and density characterization by combined mobility and aerodynamic diameter measurements. Part 1: Theory, Aerosol Sci. Tech., 38, 1185–1205, https://doi.org/10.1080/027868290903907, 2004.
Duan, J. Y., Tao, J., Wu, Y. F., Cheng, T. T., Zhang, R. J., Wang, Y. Y., Zhu, H. Y., Xie, X., Liu, Y. H., Li, X., Kong, L. D., Li, M., and He, Q. S.: Comparison of aerosol and cloud condensation nuclei between wet and dry seasons in Guangzhou, southern China, Sci. Total Environ., 607, 11–22, https://doi.org/10.1016/j.scitotenv.2017.06.246, 2017.
Fitzgerald, J. W.: Approximation formulas for equilibrium size of an aerosol particle as a function of its dry size and composition and relative humidity, J. Appl. Meteorol., 14, 1044–1049, https://doi.org/10.1175/1520-0450(1975)014<1044:afftes>2.0.co;2, 1975.
Fitzgerald, J. W., Hoppel, W. A., and Vietti, M. A.: The size and scattering coefficient of urban aerosol partices at Washington, DC as a function of relative humidity, J. Atmos. Sci., 39, 1838–1852, https://doi.org/10.1175/1520-0469(1982)039<1838:tsasco>2.0.co;2, 1982.
Fuchs, N. A.: On the stationary charge distribution on aerosol partices in a bipolar ionic atmosphere, Geofisica pura e applicata, 56, 185–193, 1963.
Hameri, K., O'Dowd, C. D., and Hoell, C.: Evaluating measurements of new particle concentrations, source rates, and spatial scales during coastal nucleation events using condensation particle counters, J. Geophys. Res., 107, 8101, https://doi.org/10.1029/2001jd000411, 2002.
Hartz, K. E. H., Tischuk, J. E., Chan, M. N., Chan, C. K., Donahue, N. M., and Pandis, S. N.: Cloud condensation nuclei activation of limited solubility organic aerosol, Atmos. Environ., 40, 605–617, https://doi.org/10.1016/j.atmosenv.2005.09.076, 2006.
Heim, M., Kasper, G., Reischl, G., and Gerhart, C.: Performance of a New Commercial Electrical Mobility Spectrometer, Aerosol Sci. Tech., 38, 3–14, https://doi.org/10.1080/02786820490519252, 2004.
Hermann, M., Wehner, B., Bischof, O., Han, H. S., Krinke, T., Liu, W., Zerrath, A., and Wiedensohler, A.: Particle counting efficiencies of new TSI condensation particle counters, J. Aerosol Sci., 38, 674–682, https://doi.org/10.1016/j.jaerosci.2007.05.001, 2007.
Hoppel, W. A. and Frick, G. M.: The nonequilibrium character of the aerosol charge distributions produced by neutralizers, Aerosol Sci. Tech., 12, 471–496, https://doi.org/10.1080/02786829008959363, 1990.
Hudson, J. G.: An Instantaneous CCN Spectrometer, J. Atmos. Ocean. Tech., 6, 1055–1065, https://doi.org/10.1175/1520-0426(1989)006<1055:aics>2.0.co;2, 1989.
Hudson, J. G. and Xie, Y. H.: Cloud condensation nuclei measurements in the high troposphere and in jet aircraft exhaust, Geophys. Res. Lett., 25, 1395–1398, https://doi.org/10.1029/97gl03705, 1998.
IPCC: Summary for Policymakers, in: Climate Change 2013: The Physical Science Basis. Contribution of Working Group I to the Fifth Assessment Report of the Intergovernmental Panel on Climate Change, edited by: Stocker, T. F., Qin, D., Plattner, G.-K., Tignor, M., Allen, S. K., Boschung, J., Nauels, A., Xia, Y., Bex, V., and Midgley, P. M., Cambridge University Press, Cambridge, United Kingdom and New York, NY, USA, 2013.
Jennings, S. G., Geever, M., and Oconnor, T. C.: Surface CCN measurements at Mace Head, on the west coast of Ireland, Nucleation and Atmospheric Aerosols 1996, 1996, 800–803, https://doi.org/10.1016/b978-008042030-1/50193-1, 1996.
Jokinen, V. and Makela, J. M.: Closed-loop arrangement with critical orifice for DMA sheath excess flow system, J. Aerosol Sci., 28, 643–648, https://doi.org/10.1016/s0021-8502(96)00457-0, 1997.
Karydis, V. A., Capps, S. L., Russell, A. G., and Nenes, A.: Adjoint sensitivity of global cloud droplet number to aerosol and dynamical parameters, Atmos. Chem. Phys., 12, 9041–9055, https://doi.org/10.5194/acp-12-9041-2012, 2012.
Kawecki, S. and Steiner, A. L.: The Influence of Aerosol Hygroscopicity on Precipitation Intensity During a Mesoscale Convective Event, J. Geophys. Res.-Atmos., 123, 424–442, https://doi.org/10.1002/2017jd026535, 2018.
Keefe, D., Nolan, P. J., and Rich, T. A.: Charge Equilibrium in Aerosols According to the Boltzmann Law, P. Roy. Irish Acad. A, 60, 27–45, 1959.
Khlystov, A.: Effect of Aerosol Volatility on the Sizing Accuracy of Differential Mobility Analyzers, Aerosol Sci. Tech., 48, 604–619, https://doi.org/10.1080/02786826.2014.899681, 2014.
Knutson, E. O. and Whitby, K. T.: Aerosol classification by electric mobility: apparatus, theory, and applications, J. Aerosol Sci., 6, 443–451, https://doi.org/10.1016/0021-8502(75)90060-9, 1975.
Koehler, K. A., Kreidenweis, S. M., DeMott, P. J., Prenni, A. J., Carrico, C. M., Ervens, B., and Feingold, G.: Water activity and activation diameters from hygroscopicity data – Part II: Application to organic species, Atmos. Chem. Phys., 6, 795–809, https://doi.org/10.5194/acp-6-795-2006, 2006.
Kreidenweis, S. M., Koehler, K., DeMott, P. J., Prenni, A. J., Carrico, C., and Ervens, B.: Water activity and activation diameters from hygroscopicity data – Part I: Theory and application to inorganic salts, Atmos. Chem. Phys., 5, 1357–1370, https://doi.org/10.5194/acp-5-1357-2005, 2005.
Lance, S., Medina, J., Smith, J. N., and Nenes, A.: Mapping the operation of the DMT Continuous Flow CCN counter, Aerosol Sci. Technol., 40, 242–254, https://doi.org/10.1080/02786820500543290, 2006.
Leng, C. P., Cheng, T. T., Chen, J. M., Zhang, R. J., Tao, J., Huang, G. H., Zha, S. P., Zhang, M. G., Fang, W., Li, X., and Li, L.: Measurements of surface cloud condensation nuclei and aerosol activity in downtown Shanghai, Atmos. Environ., 69, 354–361, https://doi.org/10.1016/j.atmosenv.2012.12.021, 2013.
Liu, X. H. and Wang, J. A.: How important is organic aerosol hygroscopicity to aerosol indirect forcing?, Environ. Res. Lett., 5, 10 pp., https://doi.org/10.1088/1748-9326/5/4/044010, 2010.
Mamakos, A., Ntziachristos, L., and Sarnaras, Z.: Diffusion broadening of DMA transfer functions. Numerical validation of Stolzenburg model, J. Aerosol Sci., 38, 747–763, https://doi.org/10.1016/j.jaerosci.2007.05.004, 2007.
Maricq, M. M.: Bipolar diffusion charging of soot aggregates, Aerosol Sci. Tech., 42, 247–254, https://doi.org/10.1080/02786820801958775, 2008.
Mei, F., Fu, H. J., and Chen, D. R.: A cost-effective differential mobility analyzer (cDMA) for multiple DMA column applications, J. Aerosol Sci., 42, 462–473, https://doi.org/10.1016/j.jaerosci.2011.04.001, 2011.
Mochida, M., Kuwata, M., Miyakawa, T., Takegawa, N., Kawamura, K., and Kondo, Y.: Relationship between hygroscopicity and cloud condensation nuclei activity for urban aerosols in Tokyo, J. Geophys. Res., 111, D23204, https://doi.org/10.1029/2005jd006980, 2006.
Modini, R. L., Frossard, A. A., Ahlm, L., Russell, L. M., Corrigan, C. E., Roberts, G. C., Hawkins, L. N., Schroder, J. C., Bertram, A. K., Zhao, R., Lee, A. K. Y., Abbatt, J. P. D., Lin, J., Nenes, A., Wang, Z., Wonaschutz, A., Sorooshian, A., Noone, K. J., Jonsson, H., Seinfeld, J. H., Toom-Sauntry, D., Macdonald, A. M., and Leaitch, W. R.: Primary marine aerosol-cloud interactions off the coast of California, J. Geophys. Res.-Atmos., 120, 4282–4303, https://doi.org/10.1002/2014jd022963, 2015.
Moore, R. H., Nenes, A., and Medina, J.: Scanning Mobility CCN Analysis-A Method for Fast Measurements of Size-Resolved CCN Distributions and Activation Kinetics, Aerosol Sci. Tech., 44, 861–871, https://doi.org/10.1080/02786826.2010.498715, 2010.
Moore, R. H., Bahreini, R., Brock, C. A., Froyd, K. D., Cozic, J., Holloway, J. S., Middlebrook, A. M., Murphy, D. M., and Nenes, A.: Hygroscopicity and composition of Alaskan Arctic CCN during April 2008, Atmos. Chem. Phys., 11, 11807–11825, https://doi.org/10.5194/acp-11-11807-2011, 2011.
Moore, R. H., Cerully, K., Bahreini, R., Brock, C. A., Middlebrook, A. M., and Nenes, A.: Hygroscopicity and composition of California CCN during summer 2010, J. Geophys. Res., 117, D00V12, https://doi.org/10.1029/2011jd017352, 2012a.
Moore, R. H., Raatikainen, T., Langridge, J. M., Bahreini, R., Brock, C. A., Holloway, J. S., Lack, D. A., Middlebrook, A. M., Perring, A. E., Schwarz, J. P., Spackman, J. R., and Nenes, A.: CCN Spectra, Hygroscopicity, and Droplet Activation Kinetics of Secondary Organic Aerosol Resulting from the 2010 Deepwater Horizon Oil Spill, Environ. Sci. Technol., 46, 3093–3100, https://doi.org/10.1021/eS303362w, 2012b.
Morales Betancourt, R. and Nenes, A.: Understanding the contributions of aerosol properties and parameterization discrepancies to droplet number variability in a global climate model, Atmos. Chem. Phys., 14, 4809–4826, https://doi.org/10.5194/acp-14-4809-2014, 2014.
Ovadnevaite, J., Ceburnis, D., Martucci, G., Bialek, J., Monahan, C., Rinaldi, M., Facchini, M. C., Berresheim, H., Worsnop, D. R., and O'Dowd, C.: Primary marine organic aerosol: A dichotomy of low hygroscopicity and high CCN activity, Geophys. Res. Lett., 38, L21806, https://doi.org/10.1029/2011gl048869, 2011.
Petters, M. D. and Kreidenweis, S. M.: A single parameter representation of hygroscopic growth and cloud condensation nucleus activity, Atmos. Chem. Phys., 7, 1961–1971, https://doi.org/10.5194/acp-7-1961-2007, 2007.
Petters, M. D. and Kreidenweis, S. M.: A single parameter representation of hygroscopic growth and cloud condensation nucleus activity – Part 3: Including surfactant partitioning, Atmos. Chem. Phys., 13, 1081–1091, https://doi.org/10.5194/acp-13-1081-2013, 2013.
Petters, M. D., Prenni, A. J., Kreidenweis, S. M., and DeMott, P. J.: On measuring the critical diameter of cloud condensation nuclei using mobility selected aerosol, Aerosol Sci. Tech., 41, 907–913, https://doi.org/10.1080/02786820701557214, 2007.
Pradeep Kumar, P., Broekhuizen, K., and Abbatt, J. P. D.: Organic acids as cloud condensation nuclei: Laboratory studies of highly soluble and insoluble species, Atmos. Chem. Phys., 3, 509–520, https://doi.org/10.5194/acp-3-509-2003, 2003.
Rogers, R. R. and Yau, M. K.: A Short Course In Cloud Physics, 3rd edn., edited by: Haar, D. T., Elsevier Science Inc., Tarrytown, New York, USA, 87–89, 1989.
Rose, D., Gunthe, S. S., Mikhailov, E., Frank, G. P., Dusek, U., Andreae, M. O., and Pöschl, U.: Calibration and measurement uncertainties of a continuous-flow cloud condensation nuclei counter (DMT-CCNC): CCN activation of ammonium sulfate and sodium chloride aerosol particles in theory and experiment, Atmos. Chem. Phys., 8, 1153–1179, https://doi.org/10.5194/acp-8-1153-2008, 2008.
Grimm Aerosol Technik: Scanning Mobility Particle Sizer Series 5.400 and 5.500, Grimm Aerosol Technik, Ainring, Germany, 2009.
Schmale, J., Henning, S., Decesari, S., Henzing, B., Keskinen, H., Sellegri, K., Ovadnevaite, J., Pöhlker, M. L., Brito, J., Bougiatioti, A., Kristensson, A., Kalivitis, N., Stavroulas, I., Carbone, S., Jefferson, A., Park, M., Schlag, P., Iwamoto, Y., Aalto, P., Äijälä, M., Bukowiecki, N., Ehn, M., Frank, G., Fröhlich, R., Frumau, A., Herrmann, E., Herrmann, H., Holzinger, R., Kos, G., Kulmala, M., Mihalopoulos, N., Nenes, A., O'Dowd, C., Petäjä, T., Picard, D., Pöhlker, C., Pöschl, U., Poulain, L., Prévôt, A. S. H., Swietlicki, E., Andreae, M. O., Artaxo, P., Wiedensohler, A., Ogren, J., Matsuki, A., Yum, S. S., Stratmann, F., Baltensperger, U., and Gysel, M.: Long-term cloud condensation nuclei number concentration, particle number size distribution and chemical composition measurements at regionally representative observatories, Atmos. Chem. Phys., 18, 2853–2881, https://doi.org/10.5194/acp-18-2853-2018, 2018.
Sem, G. J.: Design and performance characteristics of three continuous-flow condensation particle counters: a summary, Atmos. Res., 62, 267–294, https://doi.org/10.1016/s0169-8095(02)00014-5, 2002.
Seol, K. S., Tsutatani, Y., Camata, R. P., Yabumoto, J., Isomura, S., Okada, Y., Okuyama, K., and Takeuchi, K.: A differential mobility analyzer and a Faraday cup electrometer for operation at 200–930 Pa pressure, J. Aerosol Sci., 31, 1389–1395, https://doi.org/10.1016/s0021-8502(00)00037-9, 2000.
Sinnarwalla, A. M. and Alofs, D. J.: A Cloud Nucleus Counter with Long Available Growth Time, J. Appl. Meteorol., 12, 831–835, 1973.
Stratmann, F., Kauffeldt, T., Hummes, D., and Fissan, H.: Differential electrical mobility analysis: A theoretical study, Aerosol Sci. Tech., 26, 368–383, https://doi.org/10.1080/02786829708965437, 1997.
Sullivan, R. C., Moore, M. J. K., Petters, M. D., Kreidenweis, S. M., Roberts, G. C., and Prather, K. A.: Timescale for hygroscopic conversion of calcite mineral particles through heterogeneous reaction with nitric acid, Phys. Chem. Chem. Phys., 11, 7826–7837, https://doi.org/10.1039/b904217b, 2009.
Svenningsson, B., Rissler, J., Swietlicki, E., Mircea, M., Bilde, M., Facchini, M. C., Decesari, S., Fuzzi, S., Zhou, J., Mønster, J., and Rosenørn, T.: Hygroscopic growth and critical supersaturations for mixed aerosol particles of inorganic and organic compounds of atmospheric relevance, Atmos. Chem. Phys., 6, 1937–1952, https://doi.org/10.5194/acp-6-1937-2006, 2006.
Wiedensohler, A.: An approximation of the bipolar charge distribution for particles in the sub-micron size range, J. Aerosol Sci., 19, 387–389, https://doi.org/10.1016/0021-8502(88)90278-9, 1988.
Winkler, P.: The growth of atmospheric aerosol particles as a function of the relative humidity. II. An improved concept of mixed nuclei, J. Aerosol Sci., 4, 373–387, 1973.
Zhao-Ze, D. and Liang, R.: Highly biased hygroscopicity derived from size-resolved cloud condensation nuclei activation ratios without data inversion, Atmos. Ocean. Sci. Lett., 7, 254–259, 2014.
- Abstract
- Introduction
- Background
- Artifacts derived from sized CCN measurements
- Artifacts derived from condensation particle counters
- Artifacts derived from cloud condensation nuclei instruments
- Counting statistics in CCN and CPC measurements
- Discussion
- Conclusions
- Data availability
- Appendix A
- Author contributions
- Competing interests
- Acknowledgements
- References
- Supplement