


Abstract
The method presented here aims to assess the tsunami threat very rapidly after the occurrence of a large earthquake, using as input the parameters of the seismic source, and an approach based on Green's summation. We show that the main weakness of the approach (the need to consider only linear shallow water propagation) is largely compensated by the advantages in terms of computing performance and independence with respect to pre-computed scenarios. To test the approach and to illustrate its implementation in a real environment, we focus on the Sea of Oman, a tsunamigenic area characterized by Makran subduction zone which detailed structure is partially unknown and where secondary tsunami sources must also be taken into account, both for hazard studies and warning purposes. The potential source area is partitioned into a grid of unity water sources. A shallow water (SW) numerical model is used to pre-compute the corresponding empirical Green's functions on several points of interest located on the coasts of Iran, Pakistan and Oman. The comparison between Green's summation and the direct SW computation using the full resolution of the bathymetric grid shows that the accuracy is good enough for practical applications.
1 INTRODUCTION
Numerical modelling of tsunami is nowadays a standard tool in tsunami studies and operational warning procedures. The fast computation of tsunamis generated from specific initial water disturbances is an important topic for tsunami warning systems (TWS) and for empirical estimations of tsunami hazard. Operational tsunami warning requires the computation of tsunami propagation and inundation within a short time interval, whereas hazard studies require tsunami calculations for a huge number of potential sources and corresponding scenarios. This fact led to the development of tsunami scenario databases or, in some cases, to the use of simplified statistical simulations, because detailed hydrodynamic modelling is always a time-consuming task.
Many countries are presently implementing comprehensive TWS based upon the concept of pre-computed tsunami scenario databases: for example the Japan Meteorological Agency (JMA) database (Furumoto et al.1999), the NOAA Center for Tsunami Research (NCTR) database that includes 1691 scenarios (Gica et al.2008; Titov et al.2011), the T2 database of the Australian TWS (Greenslade et al.2009; Allen and Greenslade, 2010), the scenario database in use for the implementation of the Portuguese TWS (Annunziato et al.2009; Matias et al.2012), and MOD1 of the Turkish tsunami warning centre (Ozel et al.2012). Upon the occurrence of an earthquake, the TWS uses the earthquake parameters estimations to sort out from the scenario databases the pre-computed generation–propagation–inundation scenario that best matches the seismic observations.
Presently, operational TWSs deal exclusively with tsunamis generated by earthquakes. In this case, the initial perturbation of the water surface is related with the elastic deformation of the seafloor that behaves closely to an isotropic elastic half-space media, where the elastic parameters can be obtained from seismology. The elastic deformation of a finite rectangular fault was established analytically by Mansinha & Smiley (1971) for thrusts, normal and strike-slip sources and extended by Okada (1985) to incorporate also tensile sources. The final analytical expression is nonlinear in all fault parameters except in slip.
There are two different situations when one needs to generate scenario databases: (i) when tsunamis are only generated in subduction zones, where the geometry of the fault plane is reasonably well constrained and (ii) when tsunamis are generated outside subduction zones or their geometry is loosely known, and the identification of a fault plane common to most earthquakes is not straightforward; in some cases even in a subduction zone the mechanism of an earthquake may differ significantly from what can be expected from plate kinematics.
In active subduction zones, the seismic motion is in principle well constrained by the geometry of the zone. Therefore, the linearity in terms of slip makes possible the computation of the tsunami waveform at any point of interest by dividing the subduction area into a number of ‘subfaults’ with known strike, dip, rake and unit slip. Then, the tsunami waveforms generated by all subfaults are computed with a tsunami numerical model at the points of interest and, when simulating a specific tsunami earthquake event, all contributions weighted by their slips are summed up (Greenslade & Titov 2008). This method, implemented in some operational warning systems, is an example of the more general law of physics that states that the response of any linear dynamic system under the influence of an arbitrary external forcing can be expressed as a linear combination of its Green's functions (Xu 2007).
The identification of an obvious fault plane, common to most earthquakes, is not straightforward outside active subduction zones. Examples are the Gulf of Cadiz, in the North East Atlantic, that was the place of past transatlantic tsunamis (Baptista & Miranda 2009), and the Eastern Mediterranean (Necmioğlu & Özel 2013). In both areas, there is no unique compilation of earthquake source parameters that covers all possible tsunamigenic sources and thus the number of different scenarios can be huge. In such situations, tsunami studies and TWS consider that a tsunamigenic earthquake can be generated at any node of a grid extending over a given active tectonic area. In order to reduce the number of possible scenarios, some approaches use the a priori definition of a typical fault (TF) for each different generation zone. Once these TFs are settled, the rupture parameters and the magnitude are allowed to float within pre-fixed intervals, compatible with the rupture mechanism of the TF, thus allowing for the computation of a collection of scenarios at each grid node. Matias et al. (2012) developed a scenario database for the Portuguese coasts, defining a regular grid of potential tsunami sources, with 0.5° spacing, fixing a shallow depth for the sources in the sense of a ‘worst case approach’, and computing a large number of scenarios based on incremental changes of the fault parameters, including the shear modulus. In ‘hazard mode’ a probability is affected to each member of the family; in ‘warning mode’ the ‘closest’ source is selected.
In this study, we discuss an alternative database that does not require any a priori information on the rupture mechanism. It consists of a collection of empirical Green's functions computed for unit water sources distributed along the potential source area and a set of points of interest (POIs). The synthesis of the tsunami waveforms is based on the source parameters computed by seismologists (not described here) and the estimated elastic deformation of the seafloor. The waveform is computed at each POI summing the contributions of all unit sources weighted by the initial averaged sea surface elevations, supposed to equal the elastic seafloor deformation
2 METHOD
The methodology includes two main stages. The first stage deals with the compilation of the Green's functions database for the study area; the second stage deals with the study of one given event (in tsunami warning mode) or a collection of synthetic events in hazard studies.
The first stage deals with the compilation of the empirical Green's Functions Database (GFD) and includes: (i) identification/definition of the area displaced by any seismic source; this area must encompass the region where the initial sea surface displacement is significantly different from zero. In the case of earthquake generated tsunamis the use of a half-space elastic model leads to a displacement field that tends to be zero only in the infinity (Mansinha & Smiley 1971); this fact shows the need to fixing the minimum value below which the displacement does not contribute significantly to the tsunami; (ii) Partition of the source into unit water sources or rectangular prisms of water of unit height—1 m; the length and width of those prisms should be as small as possible in order to ensure a good partition of the initial displaced area and large enough to be used as the initial displacement by a numerical SW code; (iii) Definition of POIs along the coasts and (iv) computation of GFD: tsunami waveforms at POIs due to unit prisms.
The second stage for event study includes: (i) the computation of the initial sea surface displacement, using seismic parameters; (ii) Averaging out of the initial sea surface displacement into the geometry of the empirical Green's functions as stated in stage one and (iii) Synthesis of the tsunami waveforms in POIs. In hazard studies, the definition of a tsunami synthetic catalogue is required in order to generate a large number of scenarios.
The SW model runs for t time steps and the water displacement ηm(tt) is sampled at the m points of interest.
3 MAKRAN SUBDUCTION ZONE TEST CASE
The northern limit of the Sea of Oman (see Fig. 1 for locations) corresponds to the Makran subduction zone, a 900 km long, north dipping thrust, which is a segment of the Eurasian–Arabian Plate boundary. The largest well studied seismic event in the area is the 1945 M = 8.1 event (Byrne et al.1992) with epicentre located in the eastern part of the subduction zone. Similar size historical earthquakes are reported in 1765 and 1851, each of them corresponding probably to the rupture of one-fifth of the total subduction length, probably on complementary subduction segments (Byrne et al.1992). The western part of the Makran thrust has a lower seismic activity, with no well documented large events with the exception of an event close to 1483, that affected the Strait of Hormuz and NE Oman (Byrne et al.1992). The plate boundary between the Arabian and Indian plates also crosses the Sea of Oman, running along the Murray Ridge, a predominantly extensional feature (Edwards et al.2000), and the Owen Fracture Zone, mainly characterized by strike-slip motion (Quittmeyer & Kafka 1984; Gordon & DeMets 1989).
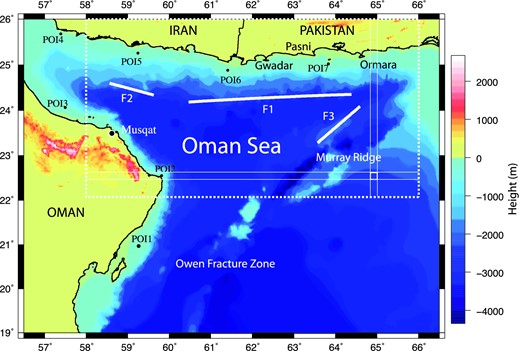
Study area for the demonstration of the method. The dashed rectangle corresponds to the source area; the two small rectangles correspond to unit sources U1,1 and U48,20, respectively. POI1–POI7 are the seven points of interest and F1–F3 the three possible tsunami sources with different sizes and/or focal mechanisms.
The 1945 tsunami impacted the areas of Ormara and Pasni along the Makran coast, Karachi in Pakistan and Oman; it reached as far as the Indian west coast, and the Seychelles (Neetu et al.2011); the report of several waves separated by 2 hr delay and the rupture of the Mumbai–London telegraphic cable suggest that an underwater landslide was triggered by the earthquake (Okal & Synolakis 2008). The tsunami is supposed to have killed more than 4000 people on the coast of Pakistan (Pararas-Carayannis 2006). The population density along the coast of Makran is small and so the information available on historical events in scarce. Nevertheless, the existing documents and the geodynamic context favour its interpretation as an active tsunamigenic area that can generate significant tsunami hazard for the whole Sea of Oman.
To conduct a test case we chose as source area, the rectangle depicted in Fig. 1. It does not cover entirely the whole area of the elastic deformation if a large event occurs, to allow the analysis of the effect of the size of the source area on the accuracy of the results. The partition step is also graphically indicated in Fig. 1; it also corresponds to an almost extreme choice, to stress as much as possible the limits of the approach. A set of seven virtual tide gauges was selected, named herein POIs (points of interest) with the most relevant configurations: close to a large (POI6, POI7) or a small event (POI5), away from the source area (POI1, POI2, POI3 and POI4). Three different fault scenarios are shown (see Table 1 for details), the first one (F1) corresponds to a large Mw = 8.6 pure thrust event along the eastern Makran subduction zone; the second one (F2) to a smaller Mw = 7.7 earthquake in the western Makran coast; the third one to a Mw = 7.8 strike slip event close to the Murray Ridge, and also close to the limits of the source area.
Source parameters.
| Source | Length (km) | Width (km) | Dip (°) | Top (km) | Rake (°) | Strike (°) | Slip (m) |
|---|---|---|---|---|---|---|---|
| F1 – M = 8.6 | 394 | 100 | 25 | 2 | 90 | 268 | 8 |
| F2 – M = 7.7 | 108 | 40 | 30 | 1 | 90 | 286 | 3 |
| F3 – M = 7.8 | 137 | 45 | 88 | 1 | 180 | 49 | 3.5 |
| Source | Length (km) | Width (km) | Dip (°) | Top (km) | Rake (°) | Strike (°) | Slip (m) |
|---|---|---|---|---|---|---|---|
| F1 – M = 8.6 | 394 | 100 | 25 | 2 | 90 | 268 | 8 |
| F2 – M = 7.7 | 108 | 40 | 30 | 1 | 90 | 286 | 3 |
| F3 – M = 7.8 | 137 | 45 | 88 | 1 | 180 | 49 | 3.5 |
Numerical modelling was made with the code described above, including no friction and no Coriolis terms. For each case, the direct calculation of the tsunami waveform was done using the full resolution of the bathymetric grid and the linear SW code, and using Green's summation as described earlier in this paper. The comparison between the waveforms computed by both methods is depicted in Fig. 2. In Fig. 4, we show the size and location of the source area, the partition of the source area into the unit sources and the inherent resolution in terms of the initial displacement of the water surface.
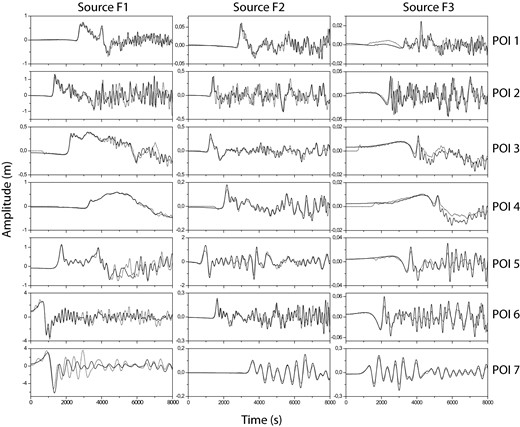
Comparison between the tsunami waveforms computed directly by the shallow water model (solid black line) and indirectly by Green's summation (solid red line) using the geometry depicted in Fig. 1. F1, F2 and F3 refer to the three faults described in Table 1, POI1–POI7 are the seven points of interest studied here (see locations in Fig. 1).
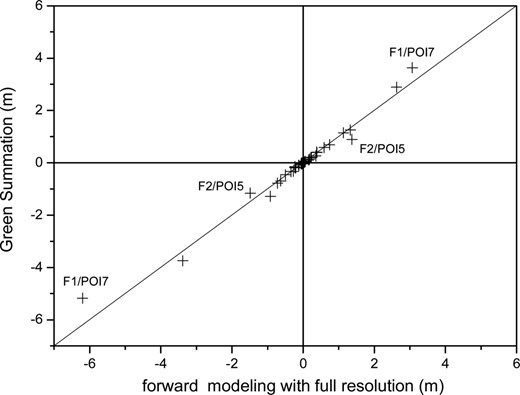
Comparison between the maximum amplitude of the tsunami waveform as given by direct forward modelling using the full resolution of the bathymetric grid and Green's summation. POI4 from F3 is excluded because the waveform is not meaningful.
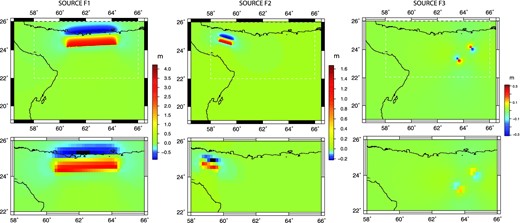
Comparison between the full-resolution initial water displacement field computed using the topo-bathymetric full resolution grid (above), and the resolution inherent to the partition analysed in this work (below), for the three typical faults studied in this work. The rectangle in dashed line shows the location of the source area.
4 DISCUSSION
The comparisons between the direct calculation of tsunami waveforms and maximum amplitudes based on the SW model for the full resolution grid, and the indirect calculation based on Green's summation are displayed in Figs 2 and 3, respectively. They show that the waveforms are well reproduced. The largest differences are found on the points of interest located very close to the sources, as is the case of POI7 for F1 and POI5 for F2, where Green's summation deviates somehow from shallow water modelling. These differences are identified in Fig. 3, and they are a consequence of the discretization of the source applied by Green's summation which smooth out the high frequency content of the maxima and minima of the seafloor deformation. The location of the POIs and the diversity of possible sources (see Fig. 1) tries to illustrate a variety of possible sources and position of POIs related to each source. It is relevant, that simulation results are good for different tsunamis scenarios: Mw = 8.5 (F1) and Mw = 7.7 (F2). This is also clear in the case of the more complex displacement field of the strike-slip source (F3). As much smaller sources are not relevant to tsunami generation we can conclude that Green's summation can be applied to a wide range of earthquake magnitudes and rupture mechanisms.
A limitation of the approach concerns the fact that the POIs must be fixed before the computation of the Green's functions otherwise all modelling results must be stored for every time step. However, computing time depends weakly on the number of POI and so it is possible to be rather generous on the amount of points of interest to be considered. A similar situation concerns the inclusion of distant tsunami sources for the assessment of tsunami impact: each source area must be the object of a collection of Green's functions relating the source areas with the POIs.
One inherent limitation of the method is the use of linear SW equations to model tsunami propagation. Nevertheless, Shuto (1991) concluded that the linear approach works well for depths greater than ∼50 m. For smaller depths, and particularly over the inundated area, advective terms become important. In the approach described here, the local effects must be dealt separately, either by using simple rules relating the maximum water elevation offshore with the expected run-up and run-in, or by performing local studies including inundation and run-up computations.
The major advantage of the method is that it is free of strong geological a priori assumptions inherent to pre-computed scenarios. The only constraint is the number of source areas and their size. This is important in areas of regional transpression where the seismic rupture cannot be a priori attributed to any fault plane or a collection of faults. In operational warning, the preliminary values of the earthquake parameters available within a few minutes after the earthquake are the epicentre, the magnitude and the focal mechanism. The selection of the closest source either in the sense of a group of sub-faults or as a member of a family of pre-computed possible sources seems weaker than the use of Green's summation described here. A striking example is the 7.9 magnitude earthquake of 1975 May 26 in the North East Atlantic; this event took place ∼100 km south of the Gloria Fault, a segment of the Eurasia Nubia Plate boundary between Iberia and the Azores (Kaabouben et al.2008), and would never be considered in a pre-computed scenario database.
5 CONCLUSIONS
Green's summation is an effective approach to compute the tsunami threat very rapidly after the occurrence of a large earthquake, using as input the seismic source parameters obtained by fast (automatic) procedures.
The comparison between Green's summation and direct linear SW computation shows that the accuracy of the method is good enough for practical applications, within the limits of the linear SW model. In this method, the time consuming task is the computation of the empirical Green's functions database; the computation of the tsunami waveforms is quite fast operation, involving only the determination of the elastic deformation of the seafloor and a multiplication of the Green's function by the average water elevation.
The major drawback of the approach is the use of the linear SW model. The limitation due to the need to fix the location of the points of interest is common to most scenario-based methodologies. Moreover, the scenario based methodologies also require strong a priori assumptions on the location and geometry of the seismic rupture. The major advantages are the easy computation of the Green's function database, and the possibility to use it to perform fast determinations of tsunami waveforms for a large variety of earthquake scenarios/sources.
Green's summation in also useful in hazard computations, particularly for stochastic simulations, when one needs to compute a large number of tsunami waveforms for empirical deduction of the probabilistic distribution of water heights. Computational effort is mainly constrained by the evaluation of elastic deformation because the reconstruction of the tsunami waveforms is straightforward, once the Green's functions are pre-computed and stored;
Green's summation in also useful for warning purposes, because the parameters of the seismic rupture are the earlier information available on warning centres allowing a fast computation of tsunami forecast on all points of interest with the only constraint that the earthquake source lies inside the ‘source area’ where Green's functions were pre-computed. During the propagation of the tsunami, updates on of the seismic parameters can be effectively used into new tsunami forecasts.
This work is a contribution of ASTARTE, Assessment, Strategy and Risk Reduction for Tsunami in Europe, FP7-ENV-2013 6.4-3 Project 603839. The case study used to illustrate the approach was prepared in the framework of the cooperation between the authors and the Earthquake Monitoring Centre of Sultan Qaboos University, Oman. The authors express gratitude to Issa El-Hussein, Director of the Earthquake Monitoring Centre of Sultan Qaboos University, and the reviewers for the comments and suggestions to improve the manuscript.
