Article

Tube Drawing with Tilted Die: Texture, Dislocation Density and Mechanical Properties

1
Institute of Materials Mechanics, Department of Laser Processing and Structural Assessment, Helmholtz-Zentrum Hereon, Max-Planck Str. 1, 21502 Geestacht, Germany
2
Hochschule Wismar, MVU-Fakultät für Ingenieurwissenschaften, Philipp-Müller-Straße 14, 23699 Wismar, Germany
3
Institute of Metallurgy, Clausthal University of Technology, 38678 Clausthal-Zellerfeld, Germany
4
Institut de Physique et Chimie des Matériaux de Strasbourg—CNRS UMR7504, Université de Strasbourg, 23, rue du Loess BP 43, 67034 Strasbourg, France
5
German Engineering Materials Science Center at MLZ, Helmholtz-Zentrum Hereon, D-85748 Garching, Germany
6
German Engineering Materials Science Center at DESY, Helmholtz-Zentrum Hereon, D-20095 Hamburg, Germany
7
Institute of Materials Engineering, Clausthal University of Technology, Agricolastrasse 2, 38678 Clausthal-Zellerfeld, Germany
*
Author to whom correspondence should be addressed.
Metals 2021, 11(4), 638; https://doi.org/10.3390/met11040638
Submission received: 8 March 2021 / Revised: 4 April 2021 / Accepted: 6 April 2021 / Published: 14 April 2021

Abstract

:
Anisotropic behavior is a key characteristic for understanding eccentricity in tubes. In this paper, the effect of using a tilted die during tube drawing on eccentricity, texture, dislocation density, and mechanical properties is shown. Copper tubes were drawn with a ±5° tilted die for two passes. The increase or decrease in eccentricity can be controlled by controlling the angle of the tilted die. Two types of textures have been developed during tube drawing, namely plane strain and uniaxial types. Plain strain type texture is mainly characterized by the β fiber with a dominant copper component {112}<111>. The uniaxial deformation type is dominated by the <111> fiber, as commonly found by wire drawing. Texture sharpness increases with increasing drawing strain, and the texture varies significantly between the maximum and minimum wall thickness. This texture variation between maximum and minimum wall thickness has no significant influence on mechanical properties, which are more or less similar, but the increase in strength after each drawing pass is apparent. The dislocation density is low for the as-received tubes due to recovery and recrystallization. This is consistent with the as-received texture dominated by the cube component {001}<100>. During tube drawing, dislocation density increases as a function of the deformation strain. The variation of dislocation density between the maximum and minimum wall thickness in the tube deformed with −5° tilted die is higher than the variation in the tube deformed with +5° tilted die.

1. Introduction

Tube drawing is used to fabricate tubes by reducing their diameter and—if used with an inner tool—wall thickness. In the case of seamless tubes, the pre-form is a billet to be pierced or extruded to obtain the pre-tube, which is often processed downstream by cold drawing to reach its final dimensions and properties [1,2]. In spite of careful alignment of the centerline of the container, the tube and the mandrel during tube manufacturing, it is almost impossible to avoid eccentricity. Because of the vibration of the mandrel, tolerance in positioning the die and the billet and possible temperature inhomogeneities in the billet, this step inherently results in a variation of the wall thickness (eccentricity) [3,4]. The eccentricity U [5] of tubes is defined as the deviation of the wall thickness from an average value as shown in Figure 1:
U = t m a x t m i n t a v e × 100
Low eccentricity means less mass is needed for the final tube with its demanded properties, which is of importance in the case of high-cost materials. On the other hand, the increase in the eccentricity is sometimes favorable depending on the application, as shown by Guillot et al. [6] Moreover, with high eccentricity, the mechanical properties will vary around the circumference, which is an important feature needed to be taken into account for manufacturing, e.g., roller bearings.
In the copper industry, the acceptable eccentricity values for tubes are approximately 1% to 5% [7], the same as for steel tubes [8].
Eccentricity will cause inhomogeneous material flow during the tube manufacturing process, which results in texture inhomogeneity around the circumference. The crystallographic texture is an essential feature in deformed polycrystalline materials. Texture types and texture sharpness are affected by parameters such as the coefficient of friction, geometry of the deformation gap, the reduction rate and the process temperature during deformation. In the tube manufacturing process, two types of texture inhomogeneities are generated, firstly around the circumference (eccentricity) and secondly along the wall thickness. Therefore, a different wall thickness results in the variation of the texture.
In general, the tube manufacturing process consists of wall thickness reduction (Rw) and diameter reduction (RD). The ratio Q = Rw/RD defines how the material will flow. If Q > 1, then the material will deform similarly to plane strain deformation. If Q = 1, the material will deform similarly to uniaxial deformation. For Q < 1, the material will deform similarly to uniaxial deformation, but in the circumferential direction [7].
Orowan (1934), Polanyi (1934) and Taylor (1934) introduced the idea of crystal dislocations, whereas the conception of the elastic properties of dislocation in isotropic materials had been known since 1905 [9].
The definition of dislocations is the summation of defects whose motion generates or produces plastic deformation of crystals at stress well below the theoretical shear strength of a perfect crystal [9]. During the plastic deformation, the different kinds of defects, such as cracking, residual stress, distortion, dislocation and stacking faults, will be stored as energy.
Many researchers have utilized X-ray diffraction peak profiles to analyze the character of crystalline materials. Diffraction peaks broaden when crystallites are smaller than 500 nm or the material contains lattice defect [10]. Integral breadth methods are frequently used in studies of the microstructure of materials for a quick estimation of the so-called size–strain line broadening effect [11]. This method is based on the famous Scherrer formula [12] or on the Williamson–Hall [10] method. This approach to diffraction line profile analysis is still very commonly used.
According to the Scherrer equation, the peak width B(2θ) varies inversely with the crystallite size (D) following Equation (2).
B 2 θ = k λ D c o s θ
The Scherrer constant K depends on how the width is determined, the shape of the crystal and the size distribution.
Not only the crystal size affects the peak width of the peak profile. Besides the instrumental line broadening, the microstrain is key for line broadening, namely by screw and edge dislocations, nonuniform lattice distortions, faulting, antiphase domain boundaries, grain surface relaxation and solid solution inhomogeneity [10].
Two classical methods were used in the past to estimate the dislocation density: the Williamson–Hall plot, as shown in Equation (3) [13], and the Warren–Averbach method [14,15]. The first method is based on the full width at half-maximum (FWHM) values and the integral breadths, while the second one is based on the Fourier coefficients of the profiles. Williamson and Hall suggested that the FWHM of the line profile can be written as [14]
F W H M 2 θ = k λ D c o s θ + 4 ε t a n θ
Both methods do not consider strain anisotropy effects. Williamson and Hall suggested plotting the peak width against sinθ of a copper specimen deformed by equal channel angular pressing (ECAP) [16]. They observed that the data points did not follow a straight line. This is due to a strong strain anisotropy effect on the line broadening, crystal size and strain effects being a function of the direction in the crystal lattice. Strain anisotropy in the classical Williamson–Hall plot can be rationalized by the contrast factors for dislocated crystals, and the result is called the modified Williamson–Hall [16].
The contrast factor expression is defined as
C h k l = A + B h 2 k 2 + h 2 l 2 + l 2 k 2 h 2 + k 2 + l 2
where A and B are constants depending on the elastic constant of the crystal.
The contrast factors of dislocations depend on the relative orientations of the diffraction vector, the line and Burger vectors of the dislocations and the elastic constants of the crystal, in a similar way as in transmission electron microscopy. The value of C can be obtained by numerical methods that consider the elastic constants of the material [10,17,18].
In the case of the integral breadths, the modified Williamson–Hall plot is [17]
Δ k = 1 D + α k C 2 + O k 2 C 2
where D is the volume average grain size or particle size; k = 2sinθ/λ; Δk = 2 cosθθ)/λ; θ and λ are the diffraction angle and X-ray wavelength, respectively; α is a constant; O stands for higher-order terms in k2C; and g = K at exact Bragg position [16].
The kinematical scattering theory is one of the most common procedures for estimating the amount of dislocation density inside the material. Due to domain sizes smaller than 500 nm or due to enough lattice defects, X-ray diffraction peaks broaden. Regarding dislocation, line broadening analysis methods, such as the modified Williamson–Hall, are used to estimate the defect density [18].
Ungár et al. [17] estimated the crystallite size and dislocation density of a severely deformed bulk copper sample via diffraction investigation. For their estimation, they proposed that different crystallographic planes have various influences on the line broadening, and they implemented an hkl-dependent modification of the Williamson–Hall Plot. The so-called “contrast factor” can be related to the ratio between screw and edge dislocations, where the average contrast factor describes the equal proportion of screw and edge dislocations. Woo et al. [19] studied the dislocation density and subgrain size in a friction stir welded aluminum alloy using neutron diffraction. They showed a significant increase in dislocation density using the modified Williamson–Hall plot and Transmission Electron Microscopy (TEM)due to the strong plastic deformation during friction stir welding. Zhong et al. [18] studied the defect density evolution in Al-AA 7020-T6 during an in situ tensile experiment using the modified Williamson–Hall plot by synchrotron diffraction. They showed that after exceeding the yield point, the dislocation density increases rapidly, which causes strain hardening. It must be noticed that the measurement of the line broadening is much faster than a complete texture measurement.
The aim of this work is to estimate the dislocation density and characterize the influence of a tilted die on the eccentricity, the crystallographic texture evolution and the mechanical properties of different Cu tubes. These Cu tubes were manufactured by a drawing process with two different tilted die angles (+5° and −5°).

2. Experimental Procedure

2.1. Tube Drawing Process

The as-received phosphorus deoxidized copper tube (Cu DHP) was produced by the casting of a copper billet. The billet was hot extruded to form the pre-tube, and this was followed by cold drawing. Finally, a recrystallization heat treatment was applied to reach the specified microstructure and properties [20]. The extruded and annealed Cu DHP tube of sizes 65.0 × 5.5 mm2 (outer diameter × average wall thickness) were investigated. The chemical composition of the material is presented in Table 1.
To overcome the eccentricity, Foadian et al. developed a method to influence the eccentricity and residual stresses (RSs) by tilting the die to control the circumferential mass flow in the tubes (Figure 2) before entering the die [20].
The as-received Cu tube (named ST0) was drawn to the final dimension in two steps (ST1 and ST2). The drawing process was performed by tilting the die ±5° as shown in Figure 2. The tube drawn with +5° was named “4ST” and the one with −5° was named “5ST”. The numbers “0”, “1” and “2” indicate “as-received”, “1st pass” and “2nd pass”, respectively. The plug diameter and diameters and the wall thickness of the tubes before and after drawing are shown in Table 2. Two sets were chosen: In the positive case (+), the maximum wall thickness (Max) was placed in the direction of the tilting angle (Figure 2). In the negative case (−), the minimum wall thickness (Min) was placed in the direction of the tilting angle.
Using this technique makes it possible to reproducibly decrease or, with the opposite setup, even increase the eccentricity.

2.2. Pole Figure Measurements

The pole figure measurements were carried out with the STRESS-SPEC diffractometer [22,23] at the Research Neutron Source Heinz Maier-Leibnitz (FRM II in Garching bei München, Germany).
Five different Cu tubes were chosen, namely tubes 4ST0, 4ST1, 5ST1, 4ST2 and 5ST2. Comparing Min and Max, ten samples in total were investigated. In order to enlarge the sample size and thereby increase the counting statistics of the neutron diffraction, cubes of size 10 × 10 × 10 mm3 were prepared by gluing two or three pieces cut from each tube together. Figure 3 schematically shows the sample cut from tube rings to guaranty the same circumferential positions and orientations for all pieces before gluing.
All samples were glued on vanadium pins and installed in the sample changer magazine, as depicted in Figure 4a. Pole figure measurements were carried out one sample after the other using the robot, as shown in Figure 4b. Neutron wavelengths of 1.65 and 1.10 Å, obtained from pyrolytic graphite (PG) monochromator (Union Carbide Corporation, New York, NY, USA) by (0004) and (0006) planes, were selected. Two wavelengths were chosen to save counting time by using only one detector position of 2θ = 50.5° to obtain the information of three reflections, (111), (200) and (220), simultaneously, as shown in Figure 4c. The reflections (111) and (200) are from PG (0004), while (220) is from PG (0006).
According to the sample-to-detector distance of 850 mm, six sample tilts in χ were needed to obtain complete pole figures. For each χ-position, a continuous scan around φ was performed with a continuous readout every 5° in φ. The exposure time was 20 s per 5° φ rotation.
The primary slit was 20 mm in diameter so that the global texture of the whole sample was obtained using the spherical sample method after Tobisch and Bunge [24]. Due to the high penetration power of neutrons, no corrections were needed [25]. No secondary slit was needed. The software package StressTextureCalculator (STeCa) (version 2, Forschungszentrum Jülich, Jülich, Germany) [26] was used to extract pole figure data from area-detector images followed by the orientation distribution function (ODF) calculation using the iterative series expansion method after Bunge [27].

2.3. Mechanical Properties

Tensile samples of quasiflat shape were machined following ASTM E8/E8M-09 to have a width of 6.0 mm, gage length of 25.0 mm and total length of 100 mm. The tensile samples were machined from the Max and Min of each Cu tube as shown in Figure 5. The tensile tests were conducted using a universal tensile machine with a head speed of 0.5 mm/min.

2.4. Dislocation Density Estimation

The experiments were performed at the high-energy beamline HEMS at PETRA III (Deutsches Elektronen-Synchrotron (DESY), Hamburg, Germany) using the energy of 87.7 keV (wavelength of 0.1424 Å). A beam size of 500 µm × 500 µm was used to obtain sufficient grain statistics. The sample-to-detector distance was 990 mm. A PerkinElmer (PE) area detector (PerkinElmer Technologies GmbH & Co. KG, Walluf, Germany) was used with a resolution of 200 µm × 200 µm and with an exposure time of 3 s.
In order to obtain information on the specially oriented grains such as on drawing direction, a sector along the drawing direction (see Figure 6) from complete Debye–Scherrer was integrated by using the software Fit2D (Version 12.077, European Synchrotron Radiation Facility, Grenoble, France) [28].
The angular range for the sector was 10° along the γ angle; i.e., the information such as FWHM obtained from the sector was averaged from grains whose normal planes are within 10° of the specific direction. After integrating the sector, the corresponding spectrum could be obtained in the drawing direction. Figure 7 shows the FWHM (85 to 95°) integration in drawing direction for 4ST for different conditions at Min. The change in peak intensity is related to different texture sharpnesses and measured volumes (tube wall thicknesses).

3. Results and Discussion

3.1. Tube Drawing Process

By examining the wall thickness of the Cu tube optically (Figure 8), it can be seen very clearly that eccentricity decreases in tubes drawn with −5° and increases in tubes drawn with +5° [21,29].
Table 3 shows on one hand that the eccentricity increases up to 10.2% after the second drawing step with a tilting angle of +5°. On the other hand, it decreases down to 2.7% after the second drawing step with a −5° tilting angle.
In conventional tube drawing, there is a quasisymmetrical material flow compared to tube drawing with a tilted angle. The asymmetry in material flow causes an additional increase or reduction in the eccentricity [21].
By observing the wall thickness in Table 3, it can be noticed that the wall thickness reduction of 4ST2 at Max is 25.9% and at Min is 34.5% while the wall thickness reduction of 5ST2 at Max is 34.8% and at Min is 23.3%.

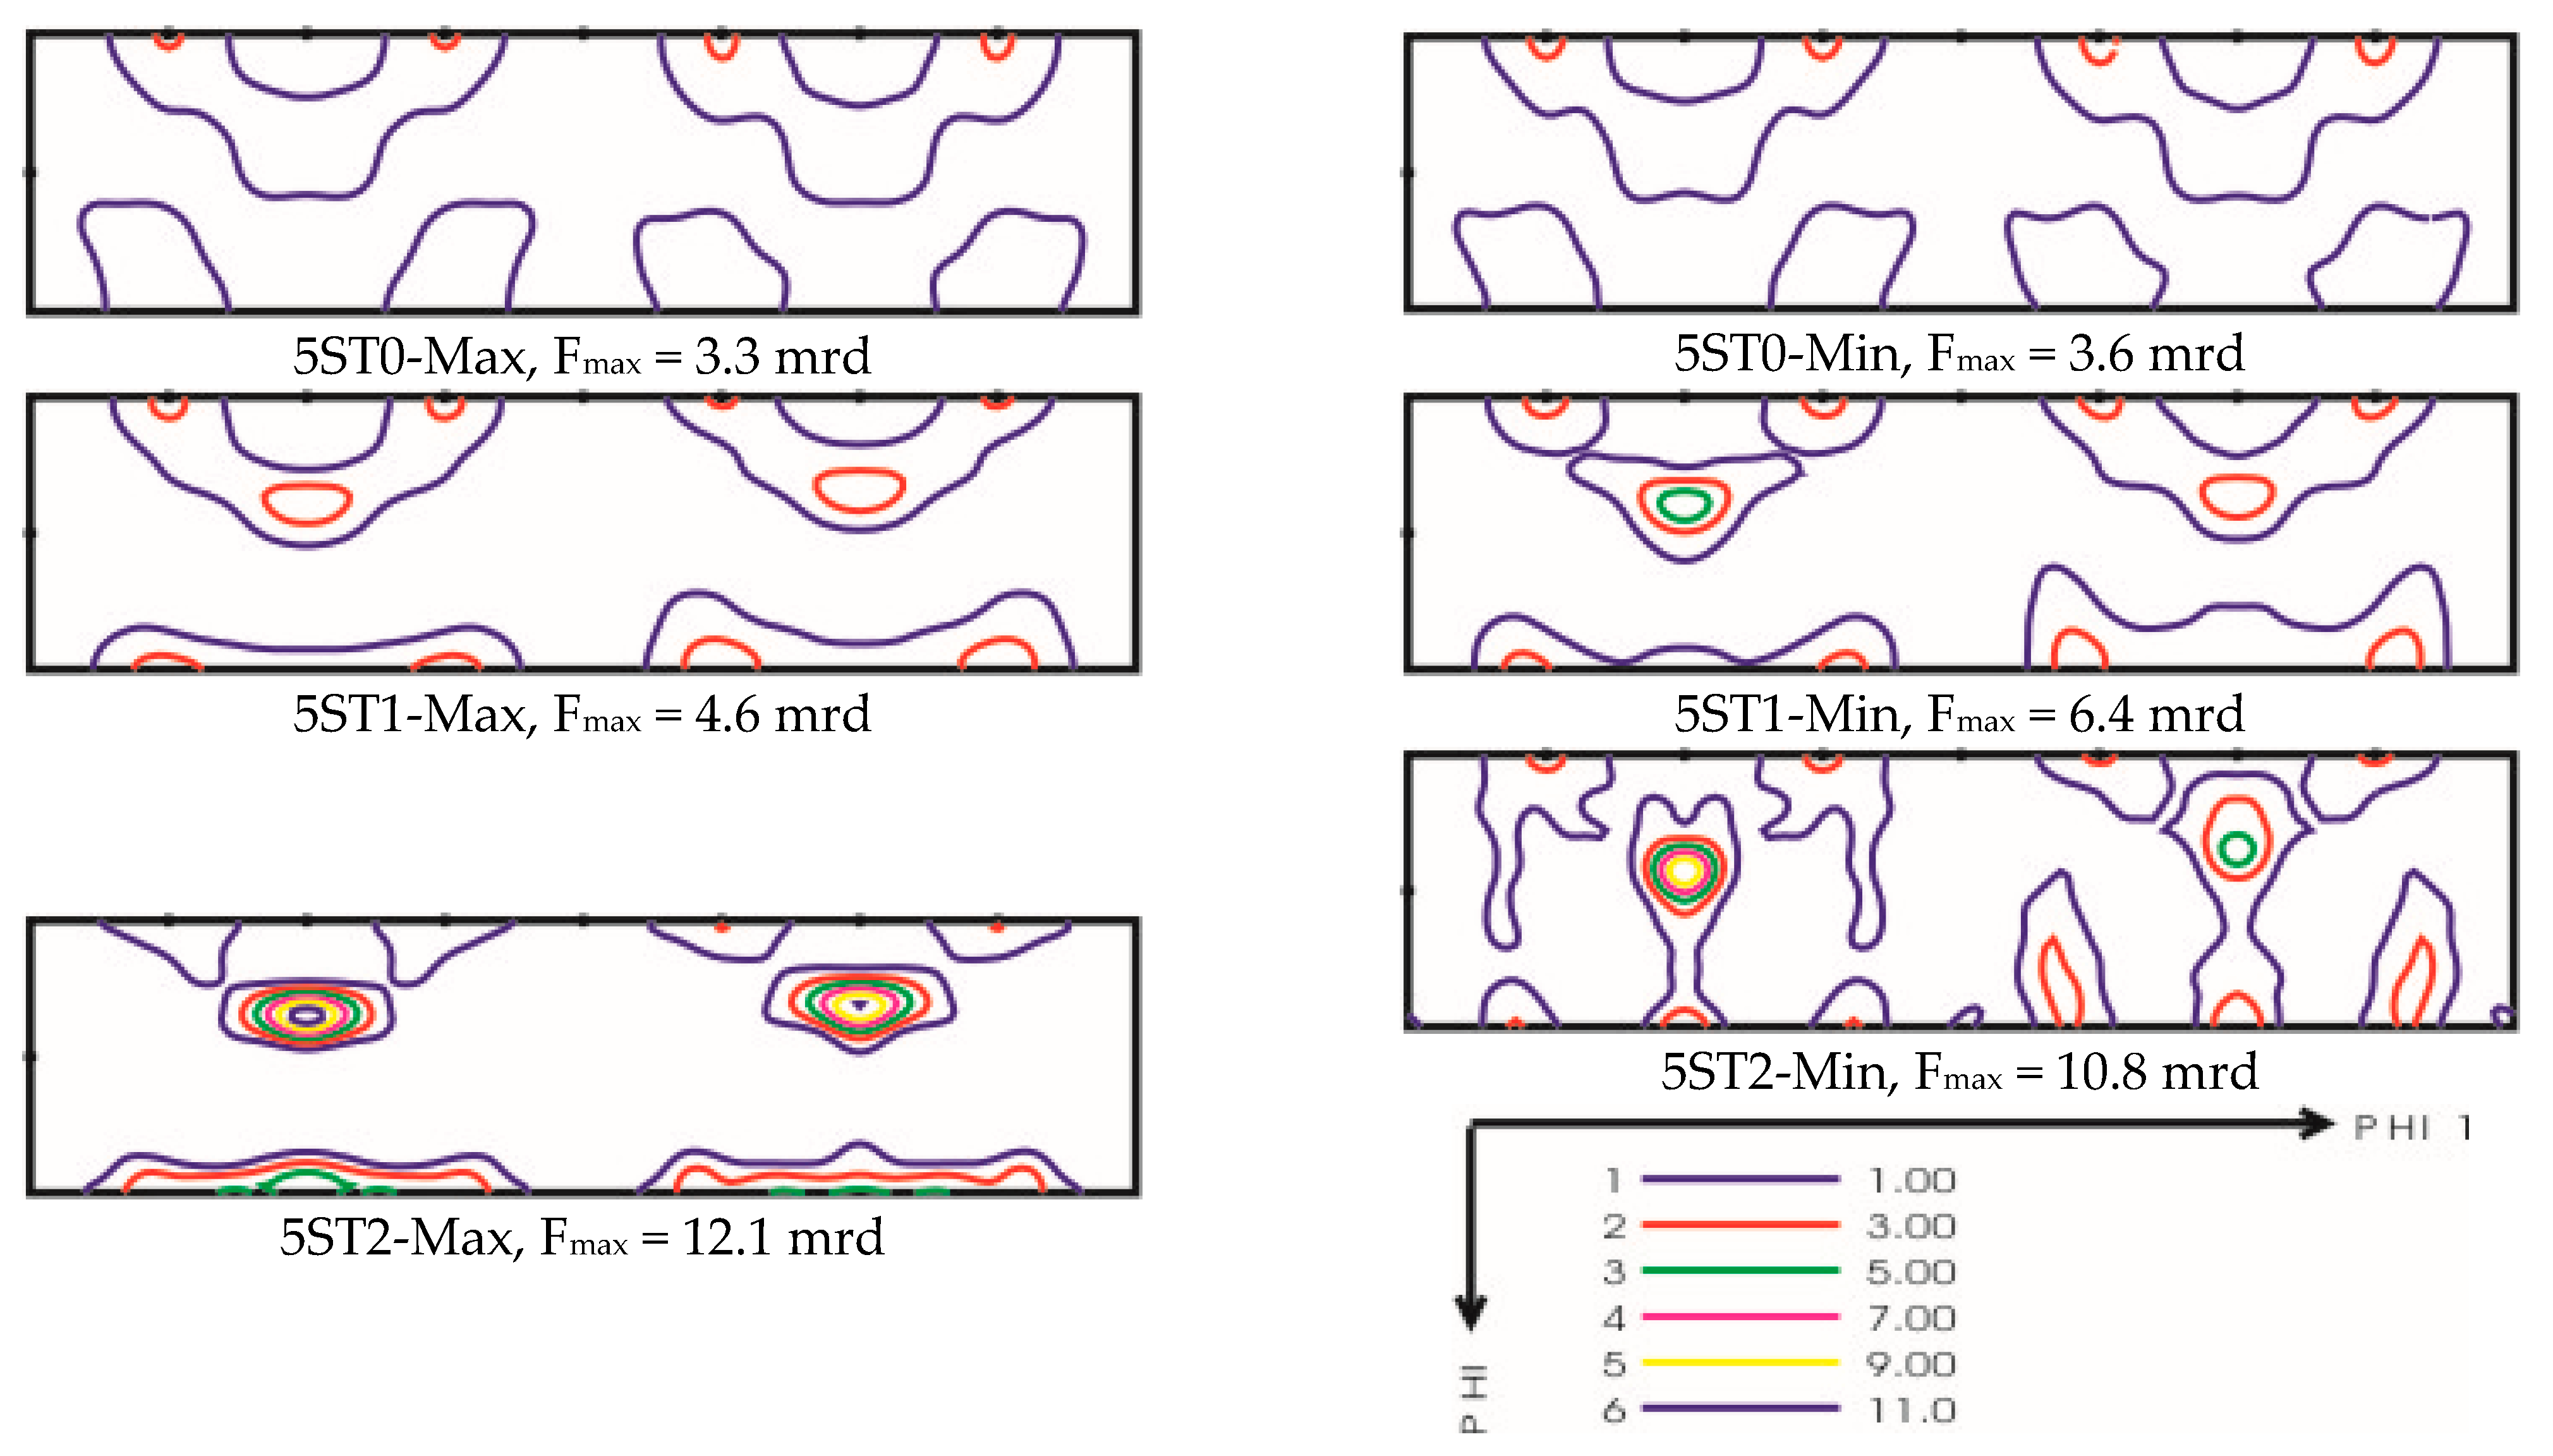
3.2. Texture Evolution

Crystallographic texture gives a good indication of the material flow inside the sample. Figure 9 and Figure 10 show the (111) pole figures of the as-received tube and the drawn tubes with ±5° tilted die at Max and Min. It was already expected that the pole figure symmetry would no longer be orthorhombic. According to the tube process geometry, only monoclinic sample symmetry can be observed, which is defined by the tube axis and the radius [30].
By observing the pole figures of Cu tube 4ST (Figure 9), it can be seen that the pole figures at Max after the first and the second passes have the texture type of uniaxial deformation. The pole figures at Min have the texture type of plane strain deformation. Although the same tube passed through the same die and deformed with the same slip system {111}<110>, the tilt angle caused the material to flow differently between Max and Min. The same behavior can be observed in tube 5ST (Figure 10), but the texture type of the pole figures is switched between Max and Min.
A pole figure is the two-dimensional representation of grain orientation with respect to the sample symmetry. Therefore, to describe the texture qualitatively, the orientation distribution function (ODF) should be calculated. To calculate the ODF, three pole figures were used with a maximum degree of series expansion Lmax = 22.
The texture of the as-received (ST0) tube is characterized by the following five components: cube {001}<100>, Goss {110}<001>, copper {112}<111>, S {123}<643> and brass {110}<112>. The copper, S and brass components are also known as β fiber and are related to the deformation process of the tube formation, while the cube and Goss components are related to recrystallization.
It is important to visualize the texture components and fibers to understand developments of crystallographic texture in the studied material properly. Figure 11 illustrates the position of the texture components and fibers in the orientation space using triclinic sample symmetry for the ODF sections (φ2 = 45°).
When comparing only the cube component in φ2 = 45° (Figure 12), no variation between φ1 = 45°, φ1 = 135°, φ1 = 225° and φ1 = 315° is visible, which means the grains with cube component follow the orthorhombic sample symmetry. The copper and S components show the expected monoclinic sample symmetry (see also Table 4 and Table 5).
For tube 4ST at Max, the main development during the drawing process is the <111> fiber//RD texture with a dominant copper {112}<111> component. The <111> fiber develops when the copper uniaxially deforms with {111}<110> slip system. The cube {001}<100> component was observed combined with the development of incomplete <100>//RD fibers. The <110>//TD fiber was also developed partially during the drawing process, indicating the flow of material in the circumferential direction.
For tube 4ST at Min, the β fiber develops with a dominant copper component {112}<111>. Moreover, a weak incomplete α fiber (<110>//ND) is observed, which starts from Goss to brass components. The above fibers develop when the copper plane undergoes strain deformation with a {111}<110> slip system. The cube component increases after the first drawing step and then decreases. The grains with a neighboring orientation to the cube rotate first to the cube components {001}<100> and then rotate gradually to the β fiber [31]. That can be observed by the reduction in the deviation of the cube component after the first drawing, which increases its sharpness.
The same texture component development can be observed in tube 5 (Figure 13), but the texture type is switched between Max and Min, which was not expected.
In summary, the qualitative texture is a good indicator of the occurrence of eccentricity. In addition, texture variation across the circumference shows that the choice of an angle during tube drawing affects eccentricity. A surprising result was the occurrence of different types of deformation, such as plane strain deformation and uniaxial deformation. It is known that the deformation types correlate with the deformation geometry, plane strain with rolling and uniaxial with wire drawing. In the present case, the local deformation is in the limit of both types due to the choice of section reduction and thickness reduction.

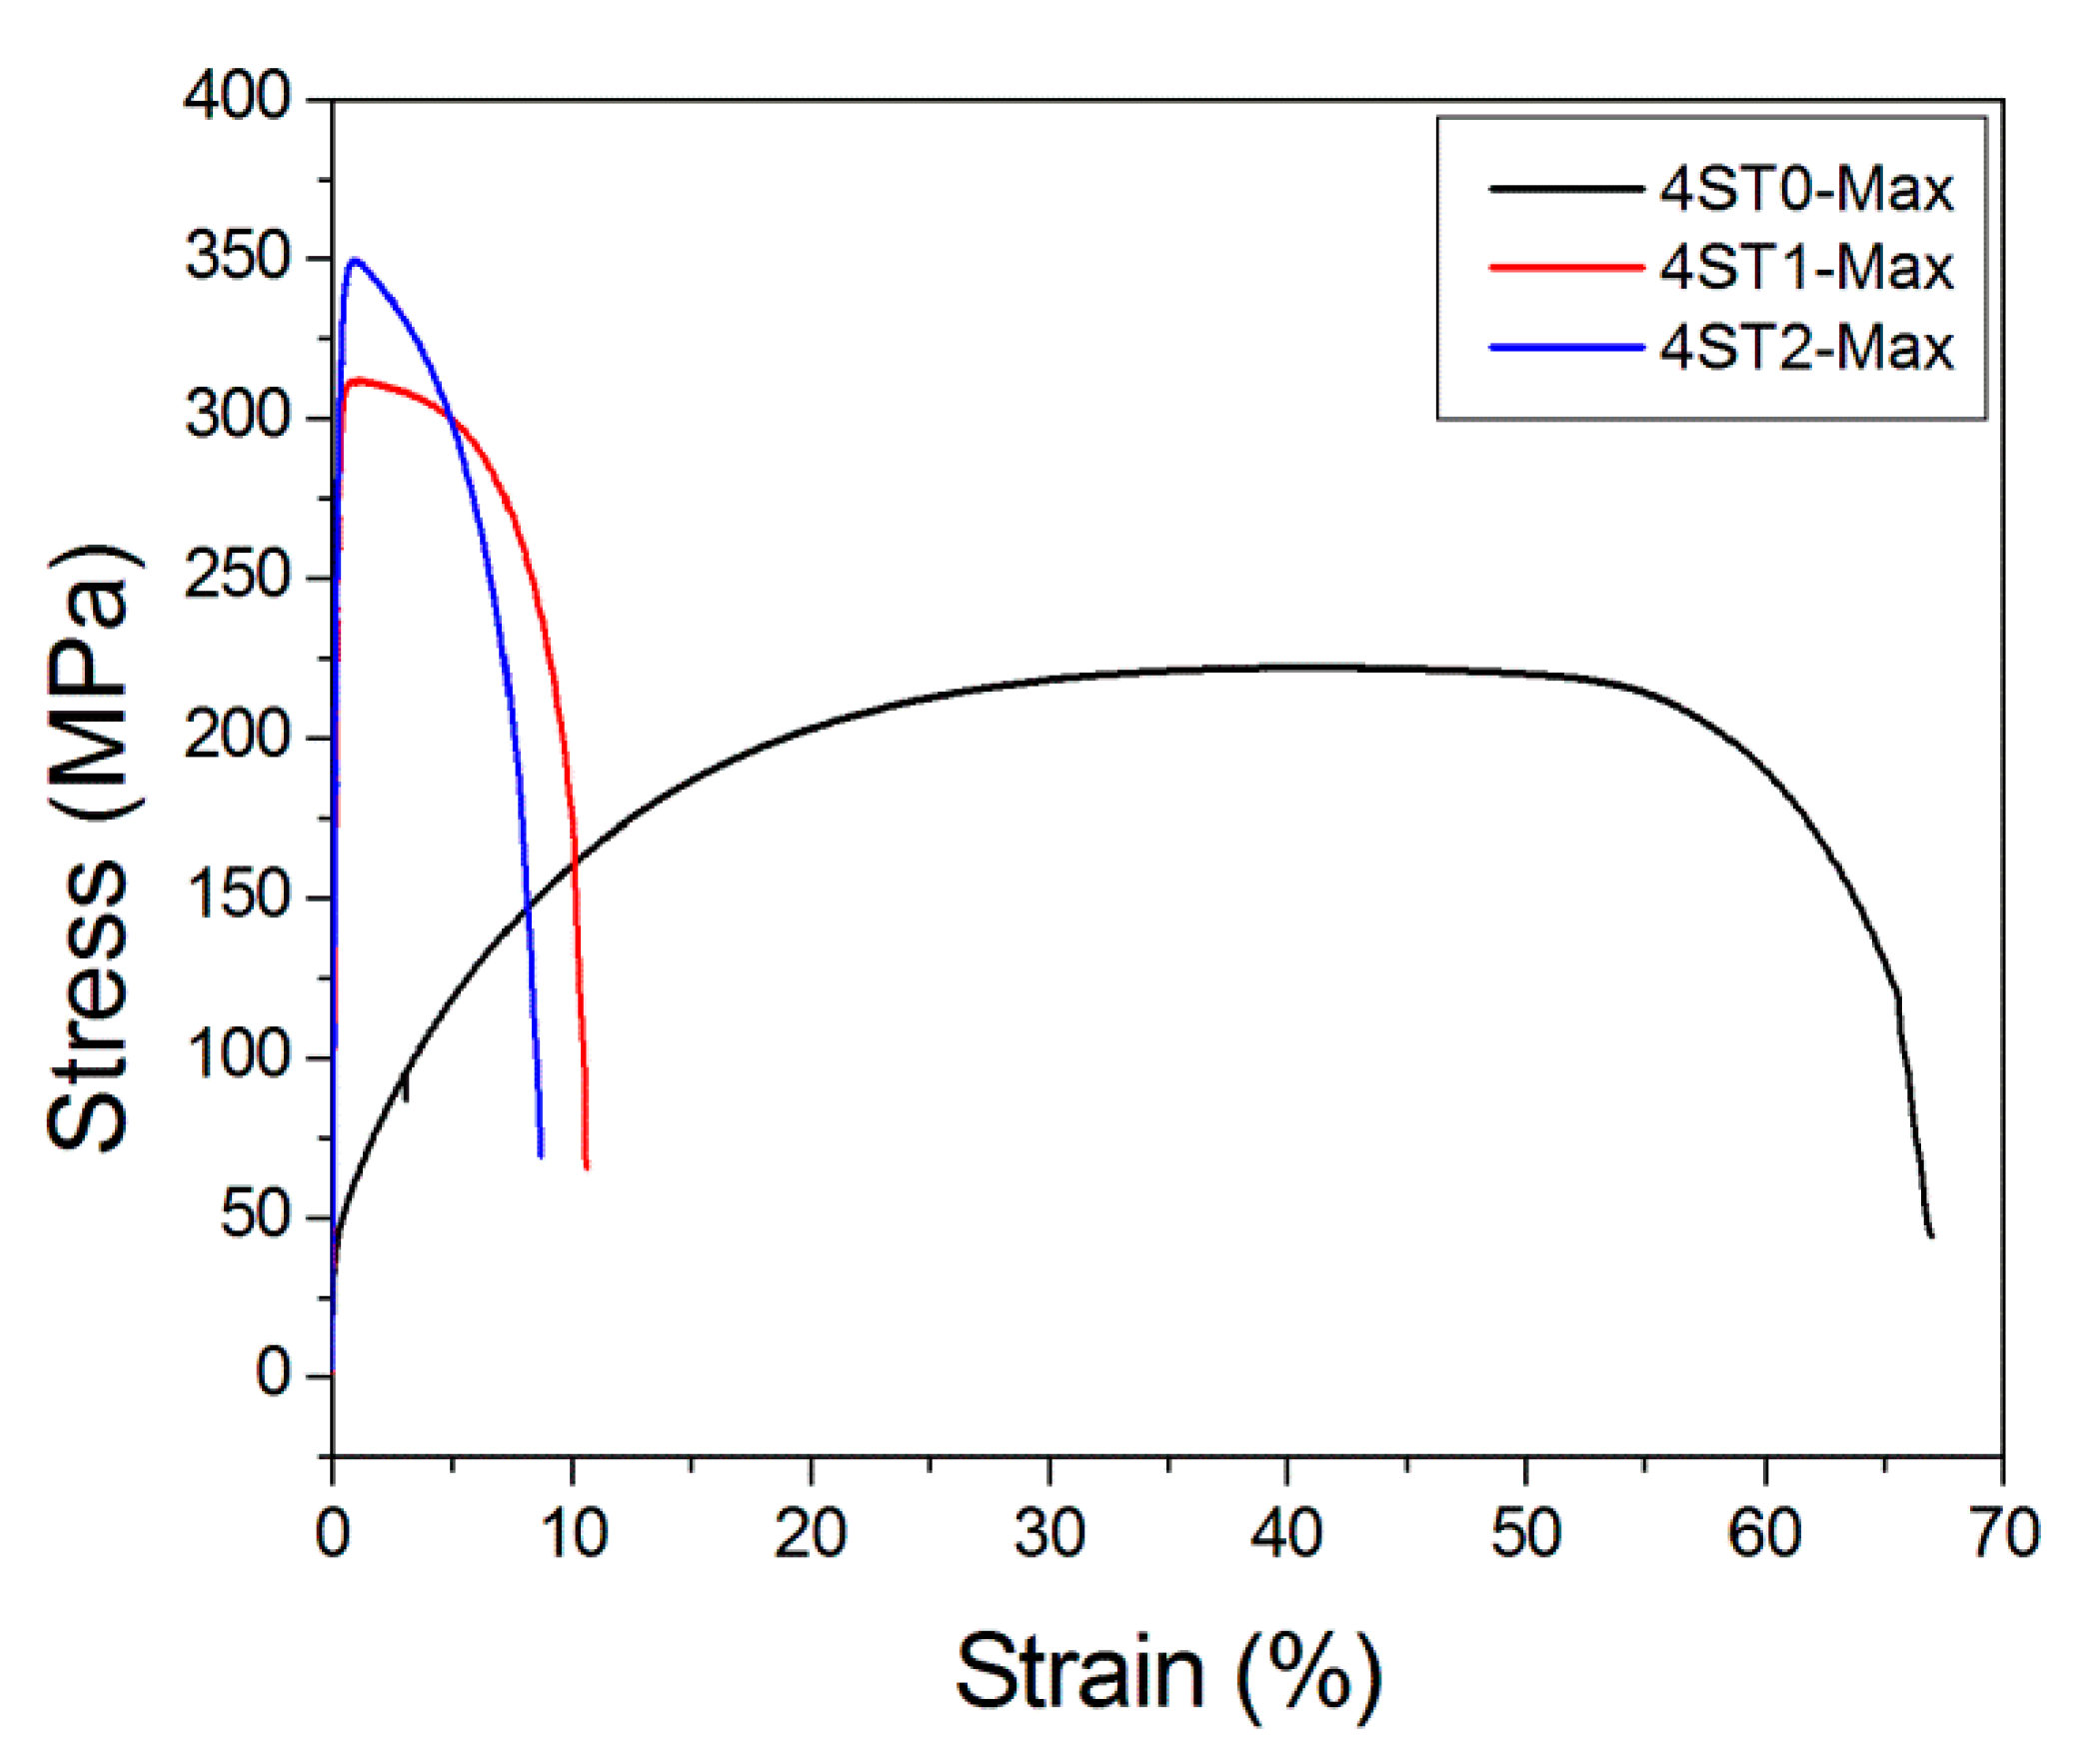
3.3. Mechanical Properties

The stress–strain curves of 4ST0, 4ST1 and 4ST2 for Max are presented in Figure 14. The properties for the as-received (annealed) material are given as 4ST0. After strong cold work (passes 1 and 2), strength increases significantly, and the elongation to rupture decreases as can be expected because of the increase in dislocations (see Section 3.4). The change in slope in Figure 15a between the FWHM and the peak positions indicates an increase in the dislocation density.
The tensile properties of all samples are summarized in Table 6. The yield strength (YS) increased from 41 MPa for ST0-Min to 355 MPa for 5ST2-Min, the ultimate tensile strength (UTS) increased from 223 to 367 MPa and the elongation to rupture (A) decreased from 65% to 8%. By comparing Max and Min, no remarkable differences can be observed in the mechanical properties.

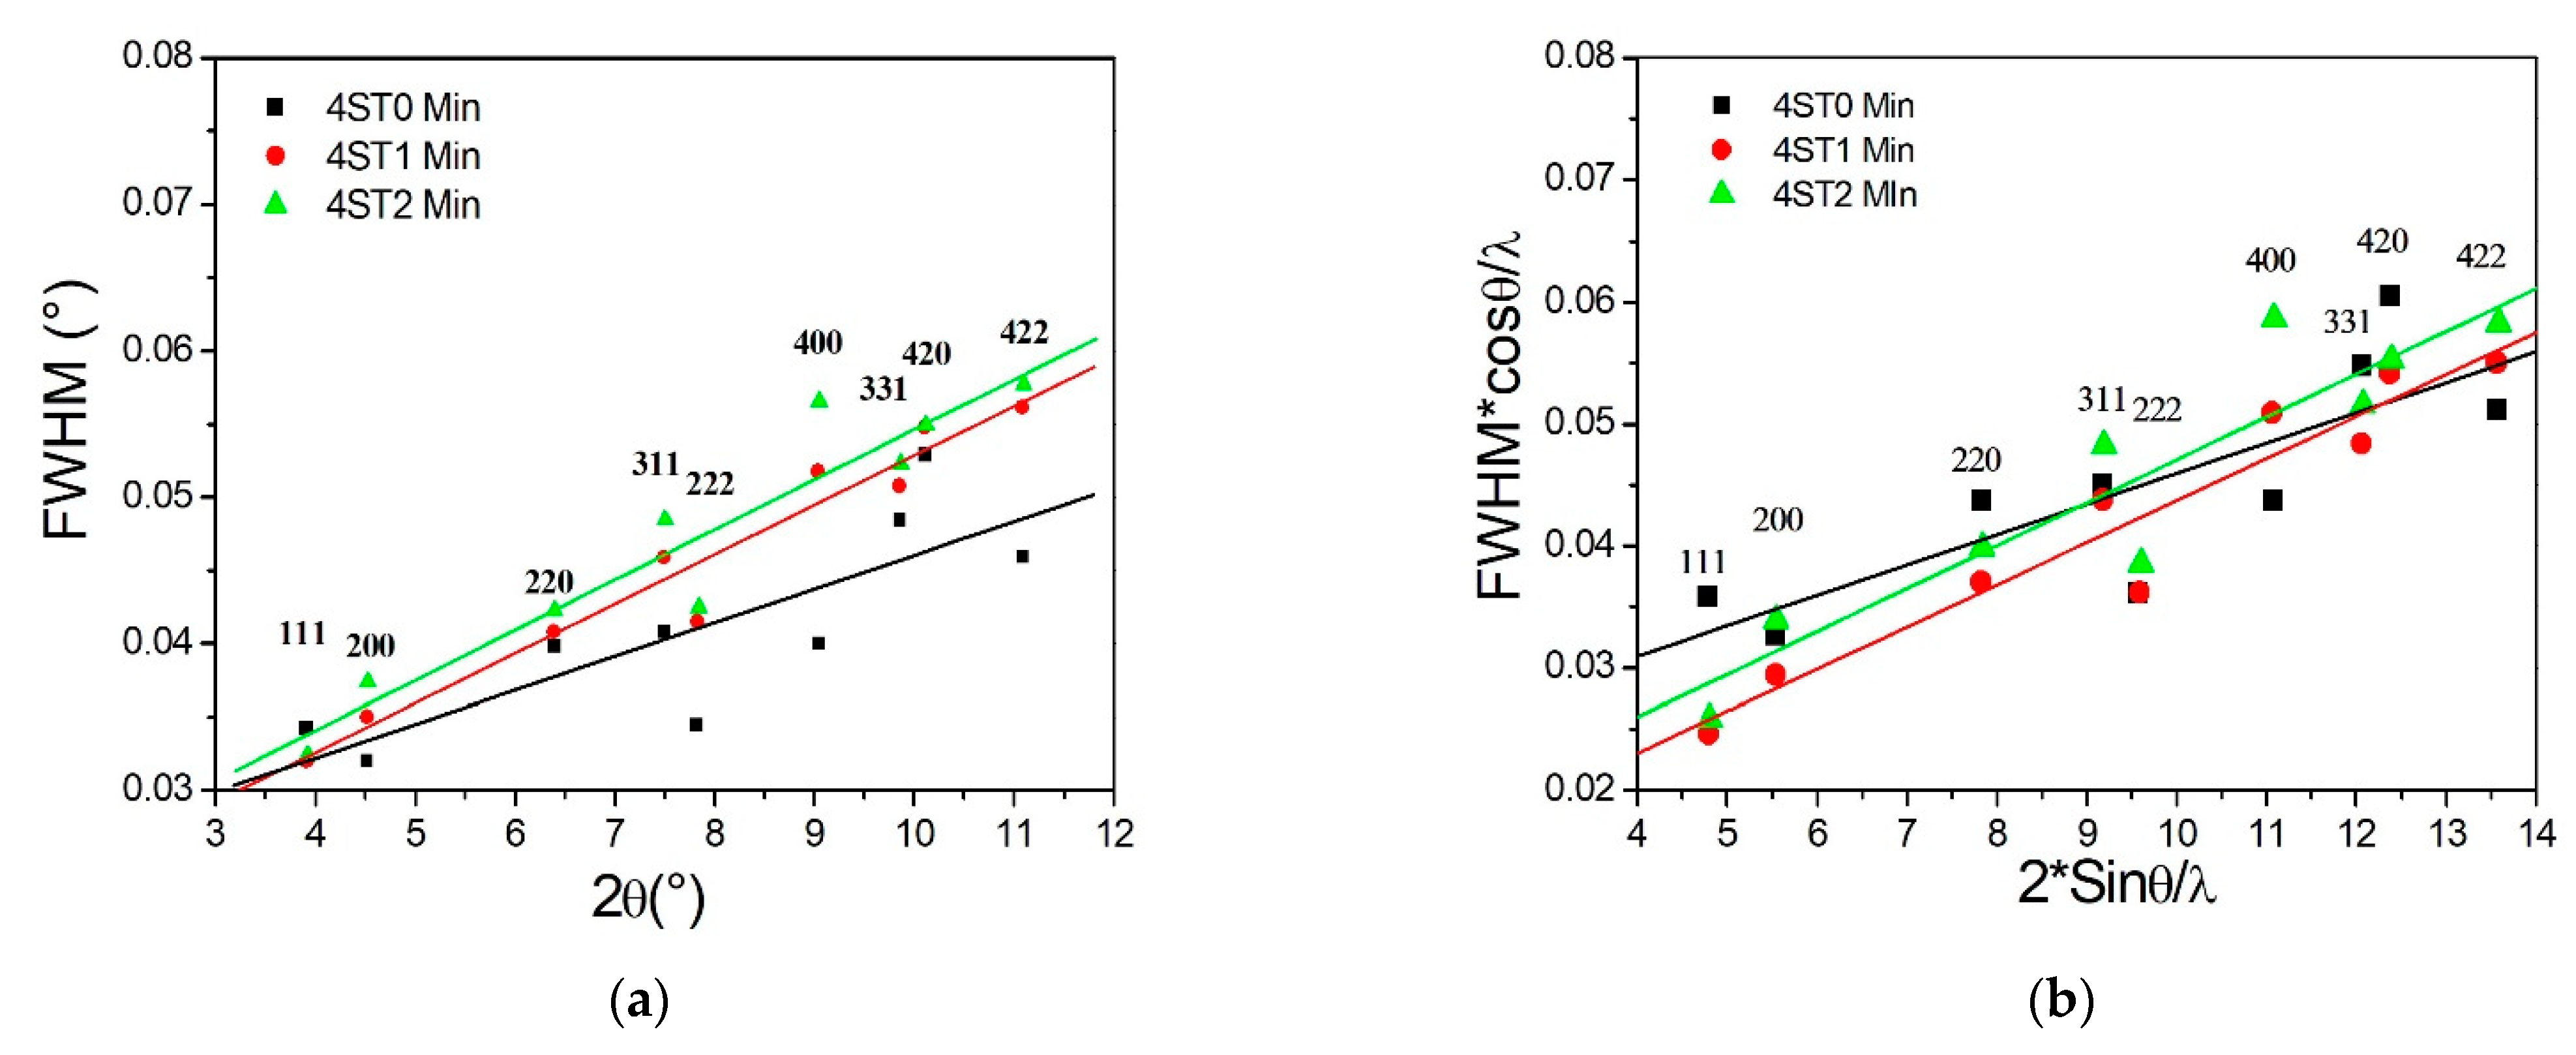
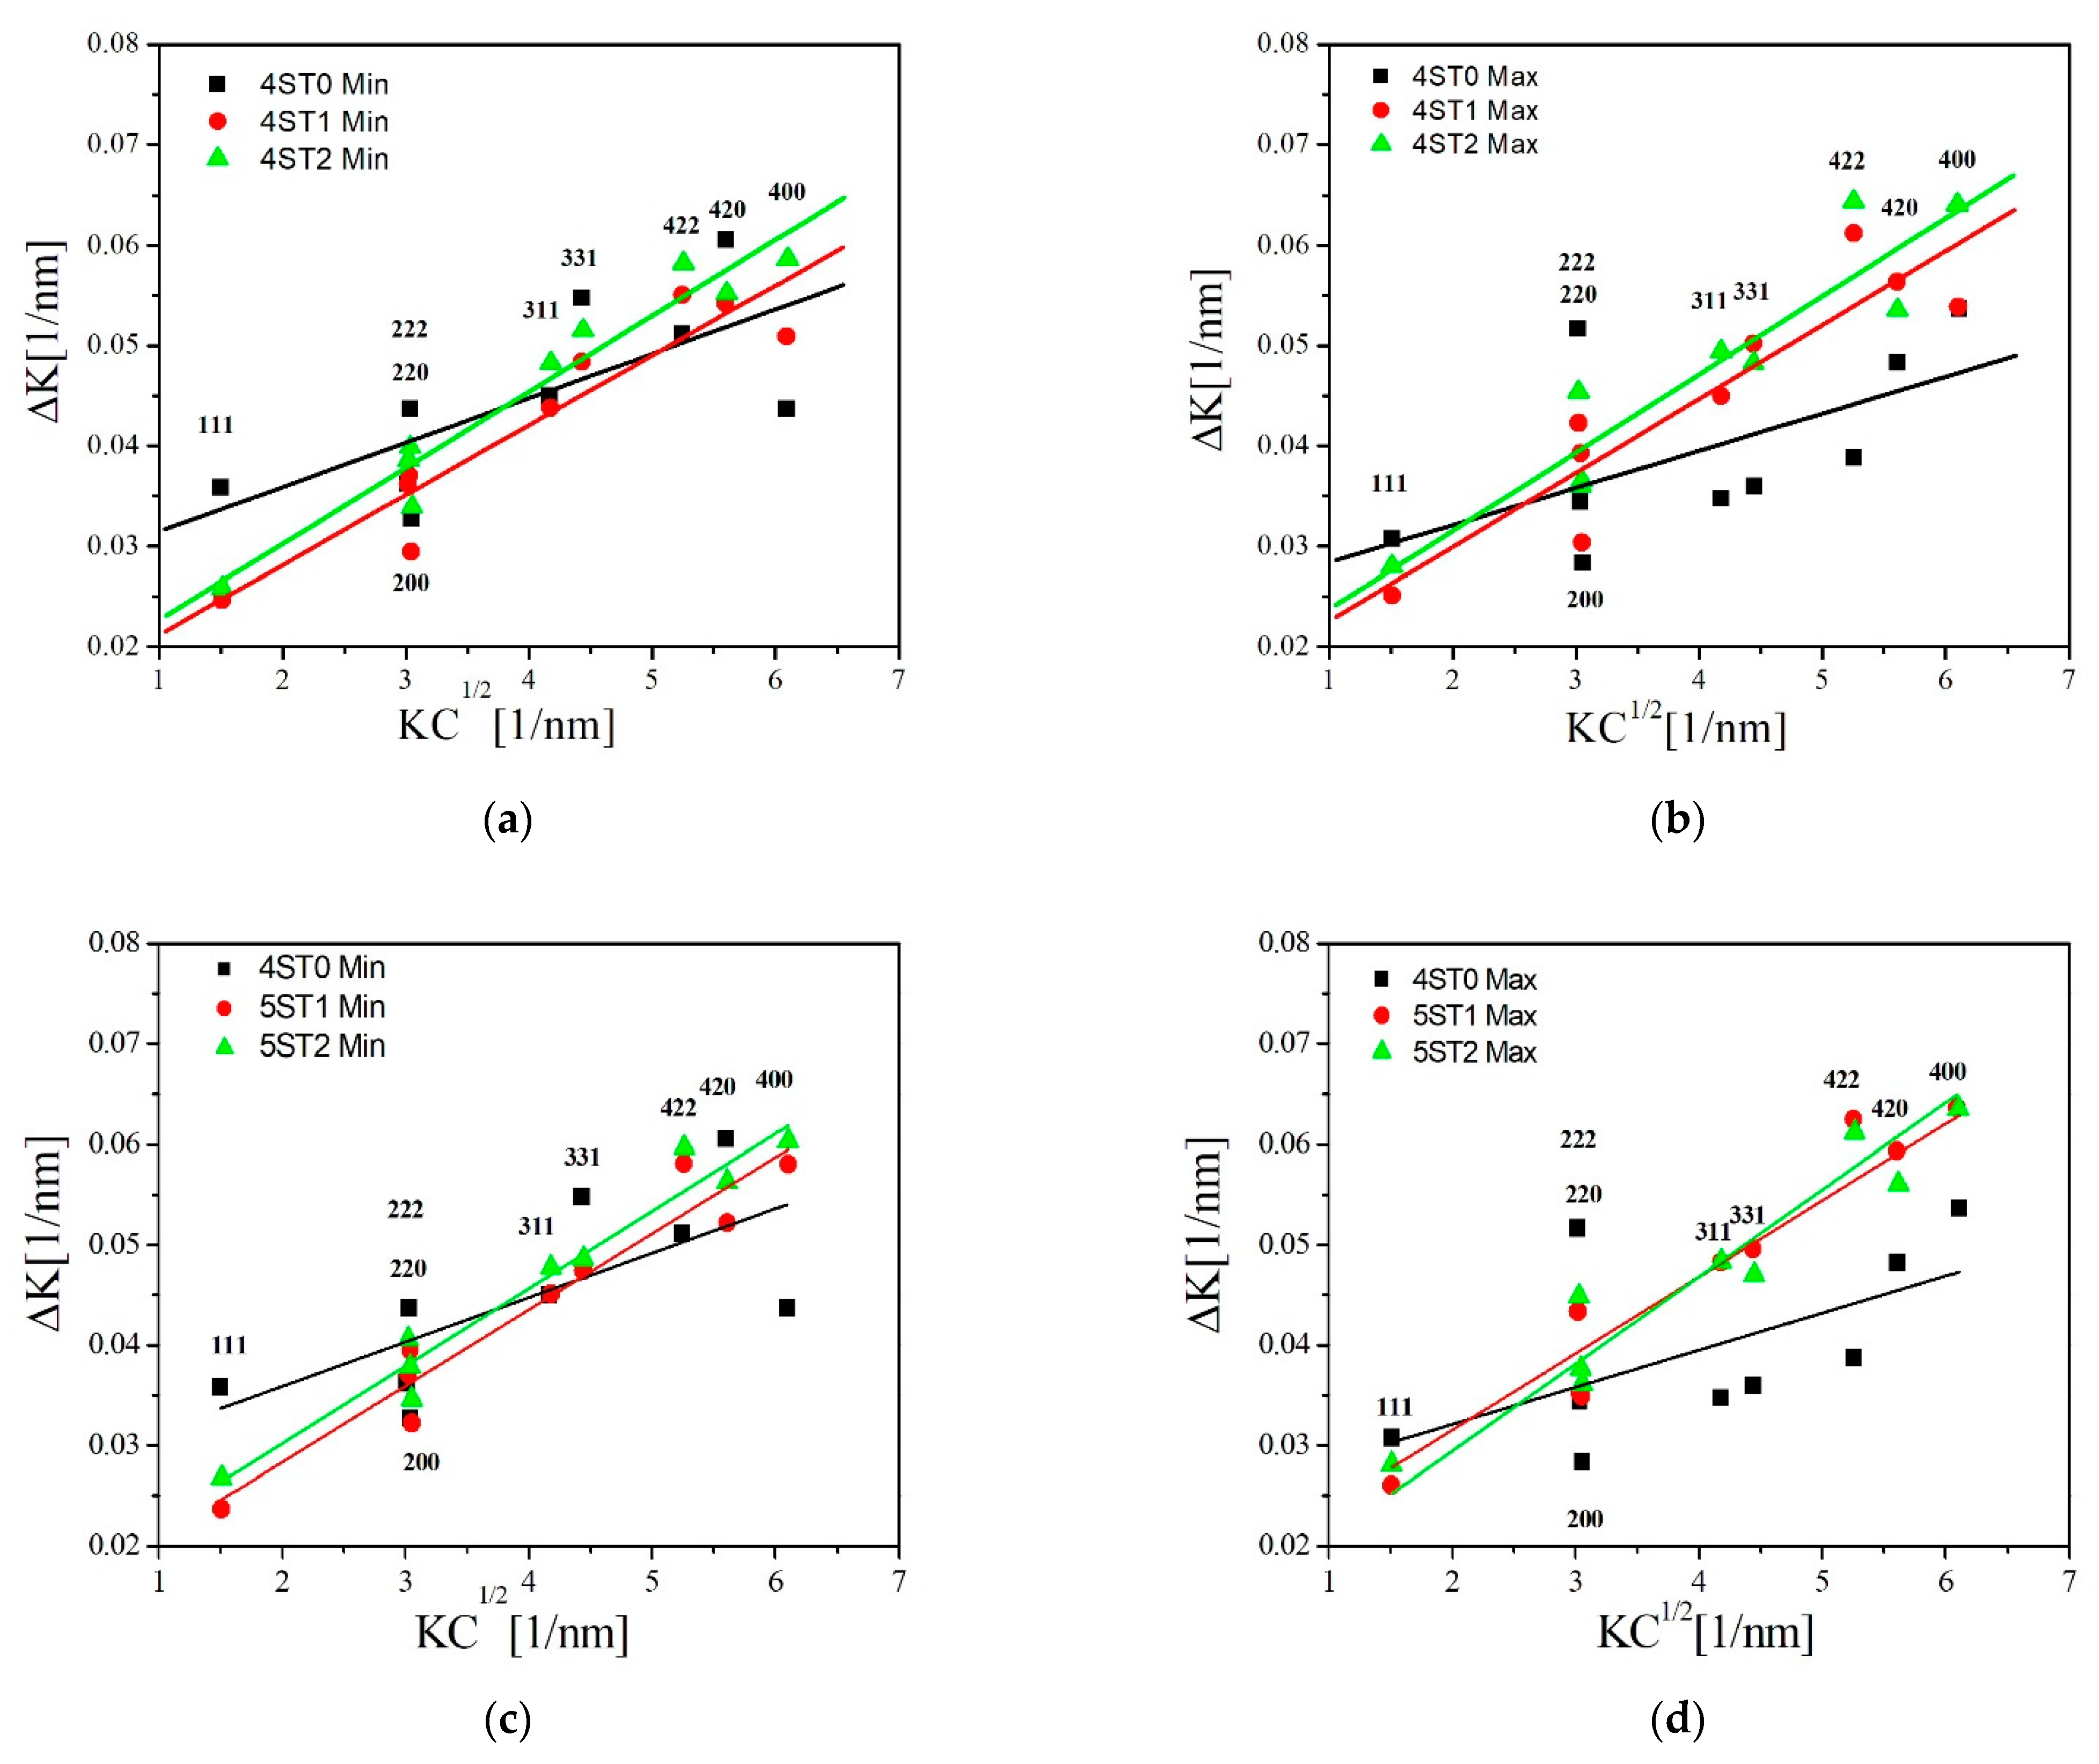
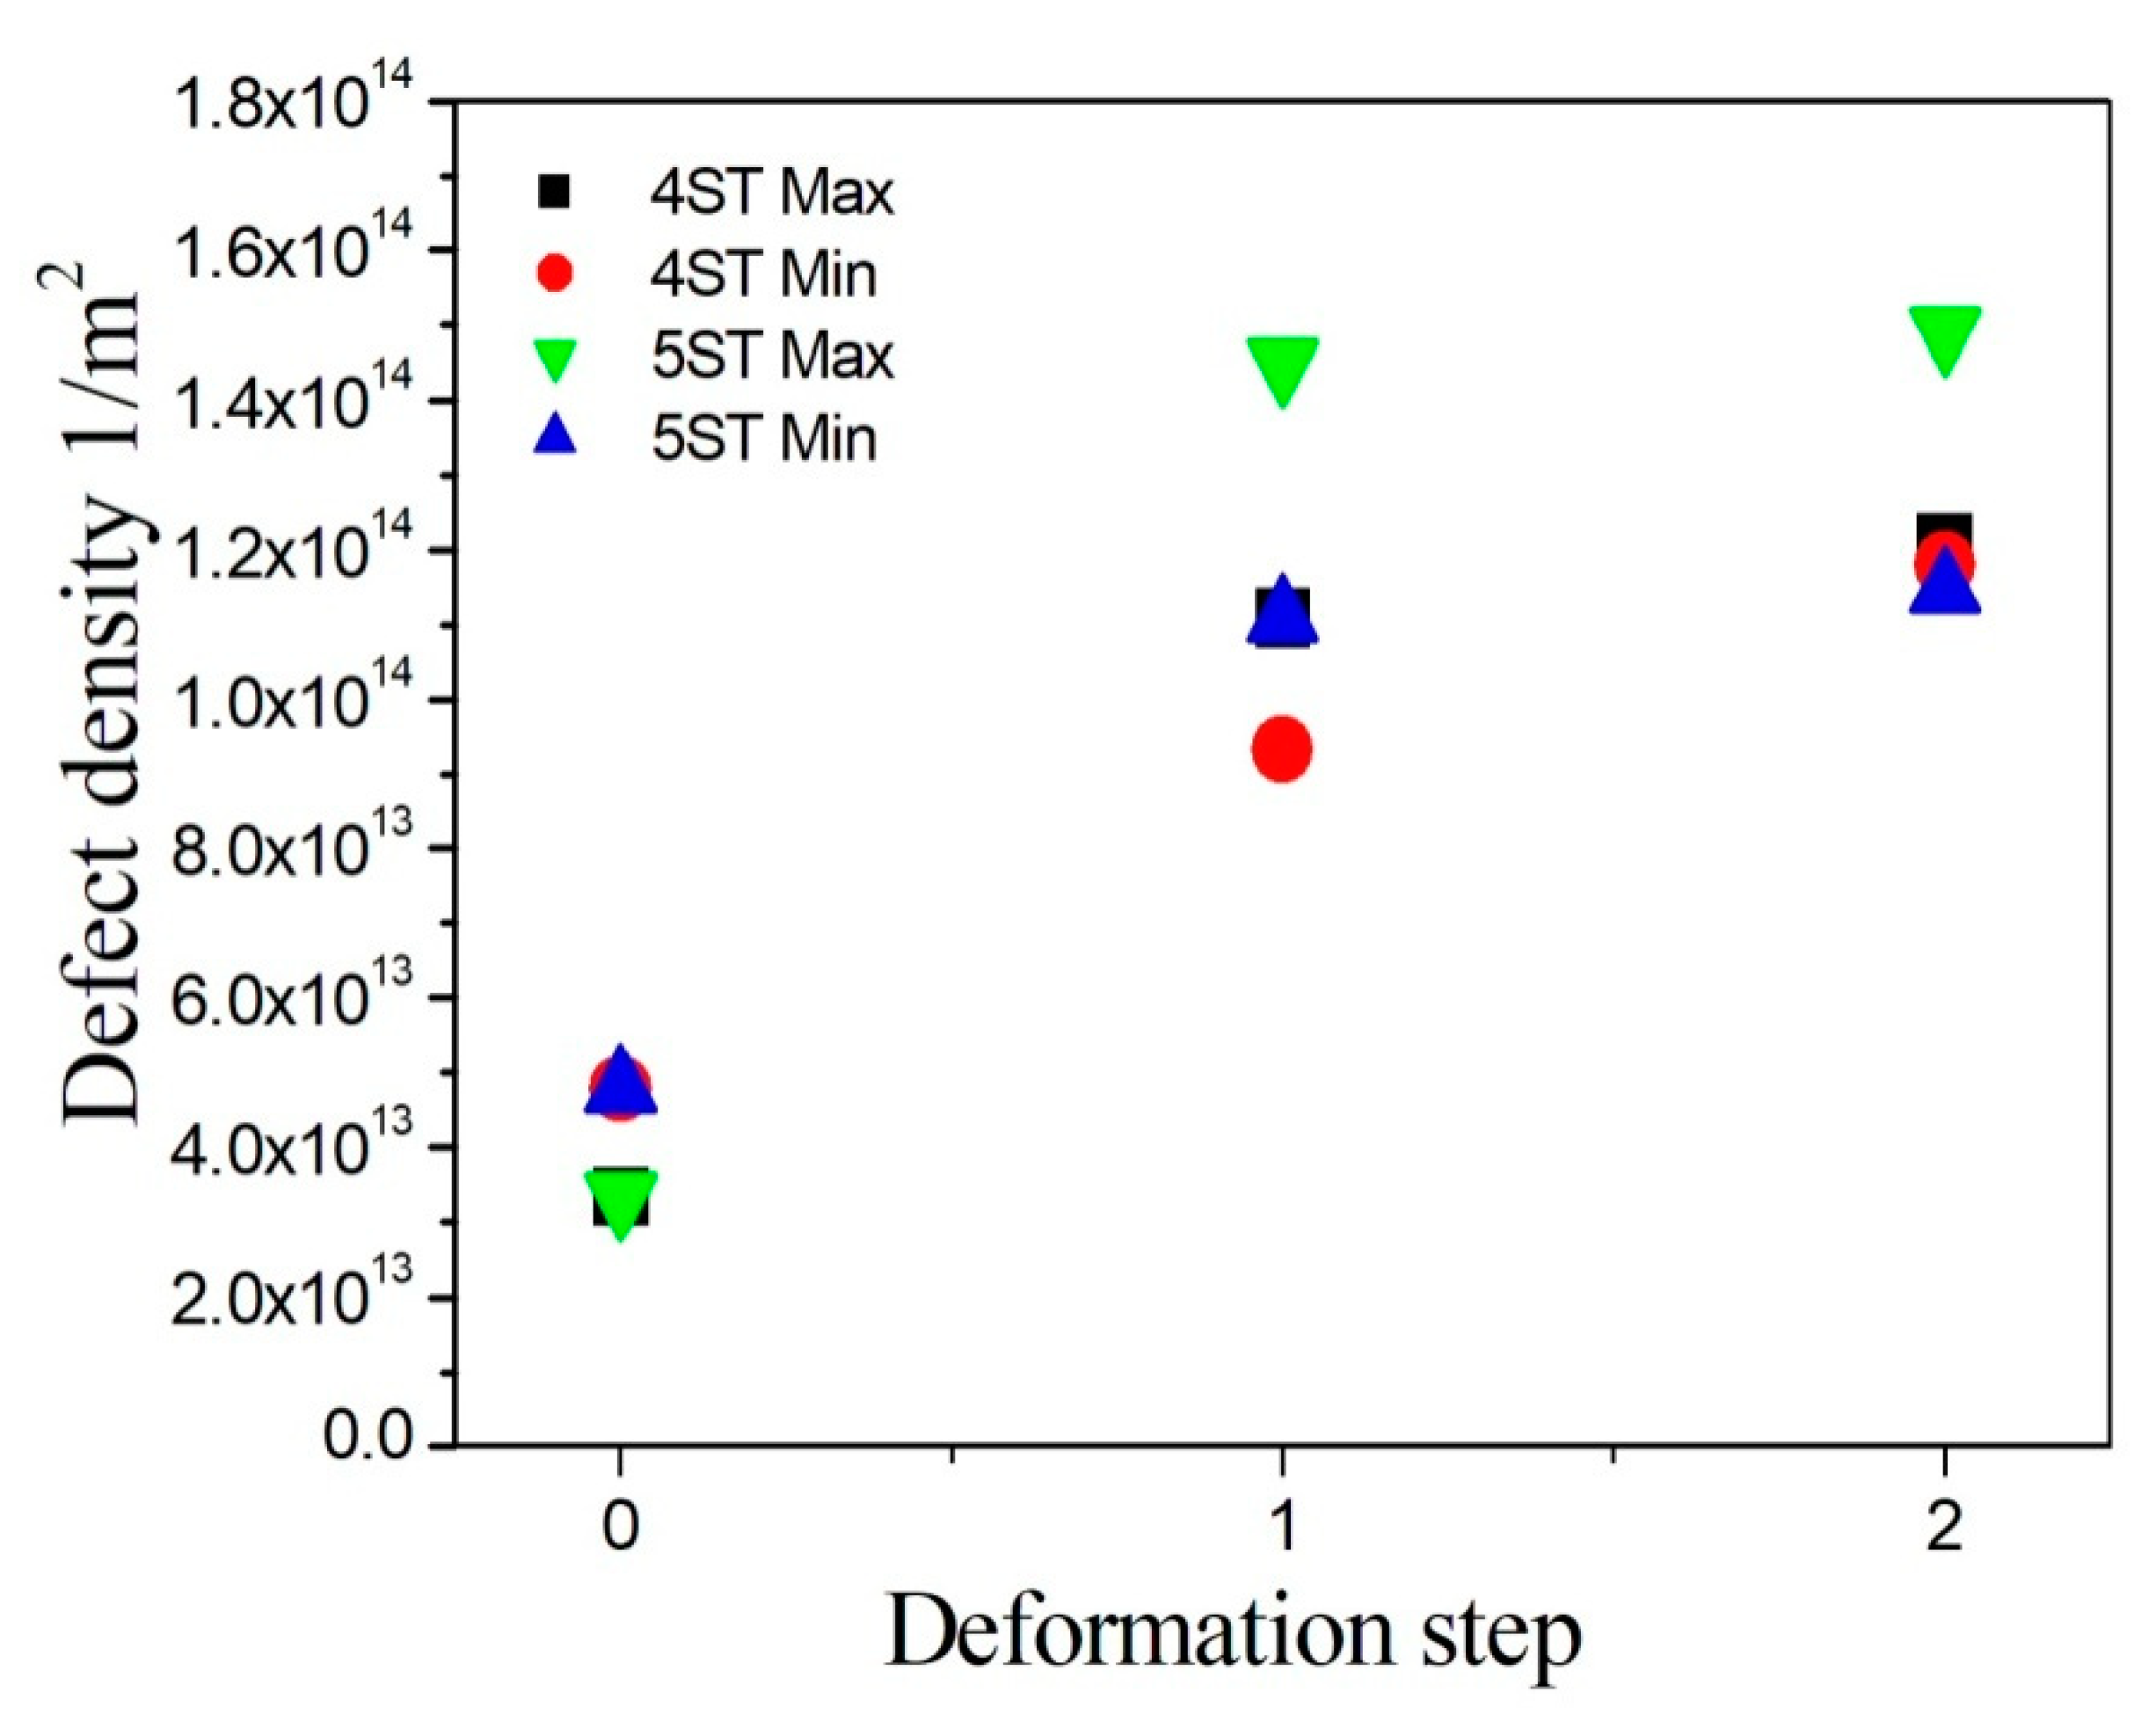
3.4. Dislocation Density Estimation

As an example of defect dislocation estimation sequence, FWHM as a function of the Bragg angle (2θ) is shown in Figure 15a for 4ST-Min samples. These are raw data after instrumental corrections. The Williamson–Hall plot in Figure 15b shows an increase in the slope from 4ST0 (as received tube) to 4ST1 and 4ST2.
The Williamson–Hall equation does not consider the effect of quantitative strain anisotropy. Therefore, the points on each picture cannot fit on the line. The modified Williamson–Hall plot by Ungár and Borbély [16] implements a “contrast factor” in Equation (4) to recognize the effect of strain anisotropy.
Using the modified Williamson–Hall plot [16,32], the dislocation density along the drawing direction was calculated after subtracting the thickness effect and instrumental function from the peak width. The instrumental function was calibrated with the LaB6 standard powder [33]. The elastic constants of Cu (C11 = 171 GPa, C12 = 123.789 GPa and C44 = 71.242 GPa) were taken from the literature [34]. The value of Ch0.0 can be obtained from the AnizC program [15].
For calculation of diffraction contrast factors in fcc polycrystalline material, it was assumed that edge and screw dislocations are present in equal proportion. Figure 16 shows the modified Williamson–Hall plots for the samples 4ST and 5ST.
The dislocation in the tube can be found in the starting material (previous manufacturing process) or develop after the deformation process. During the tube drawing, there are some factors that affect the development of dislocation density, such as the die angle, friction and reduction steps. The results show an increase in the magnitude of the dislocation density in the drawing direction for Cu tubes after drawing with a tilted die, as shown in Table 7 and Figure 17. The difference in magnitude of the dislocation density between Min and Max for the 4ST2 tube is less than that for tube 5ST2. The highest magnitude of dislocation density in both the 4ST2 and 5ST2 tubes is at Max position.
When comparing the dislocation density with the qualitative texture, it can be stated that the dislocation density has no significance for the eccentricity. The variation between Min and Max positions is not important enough.

4. Conclusions

Tube drawing parameters are important in controlling the dimensions and the mechanical properties of the final manufactured product.
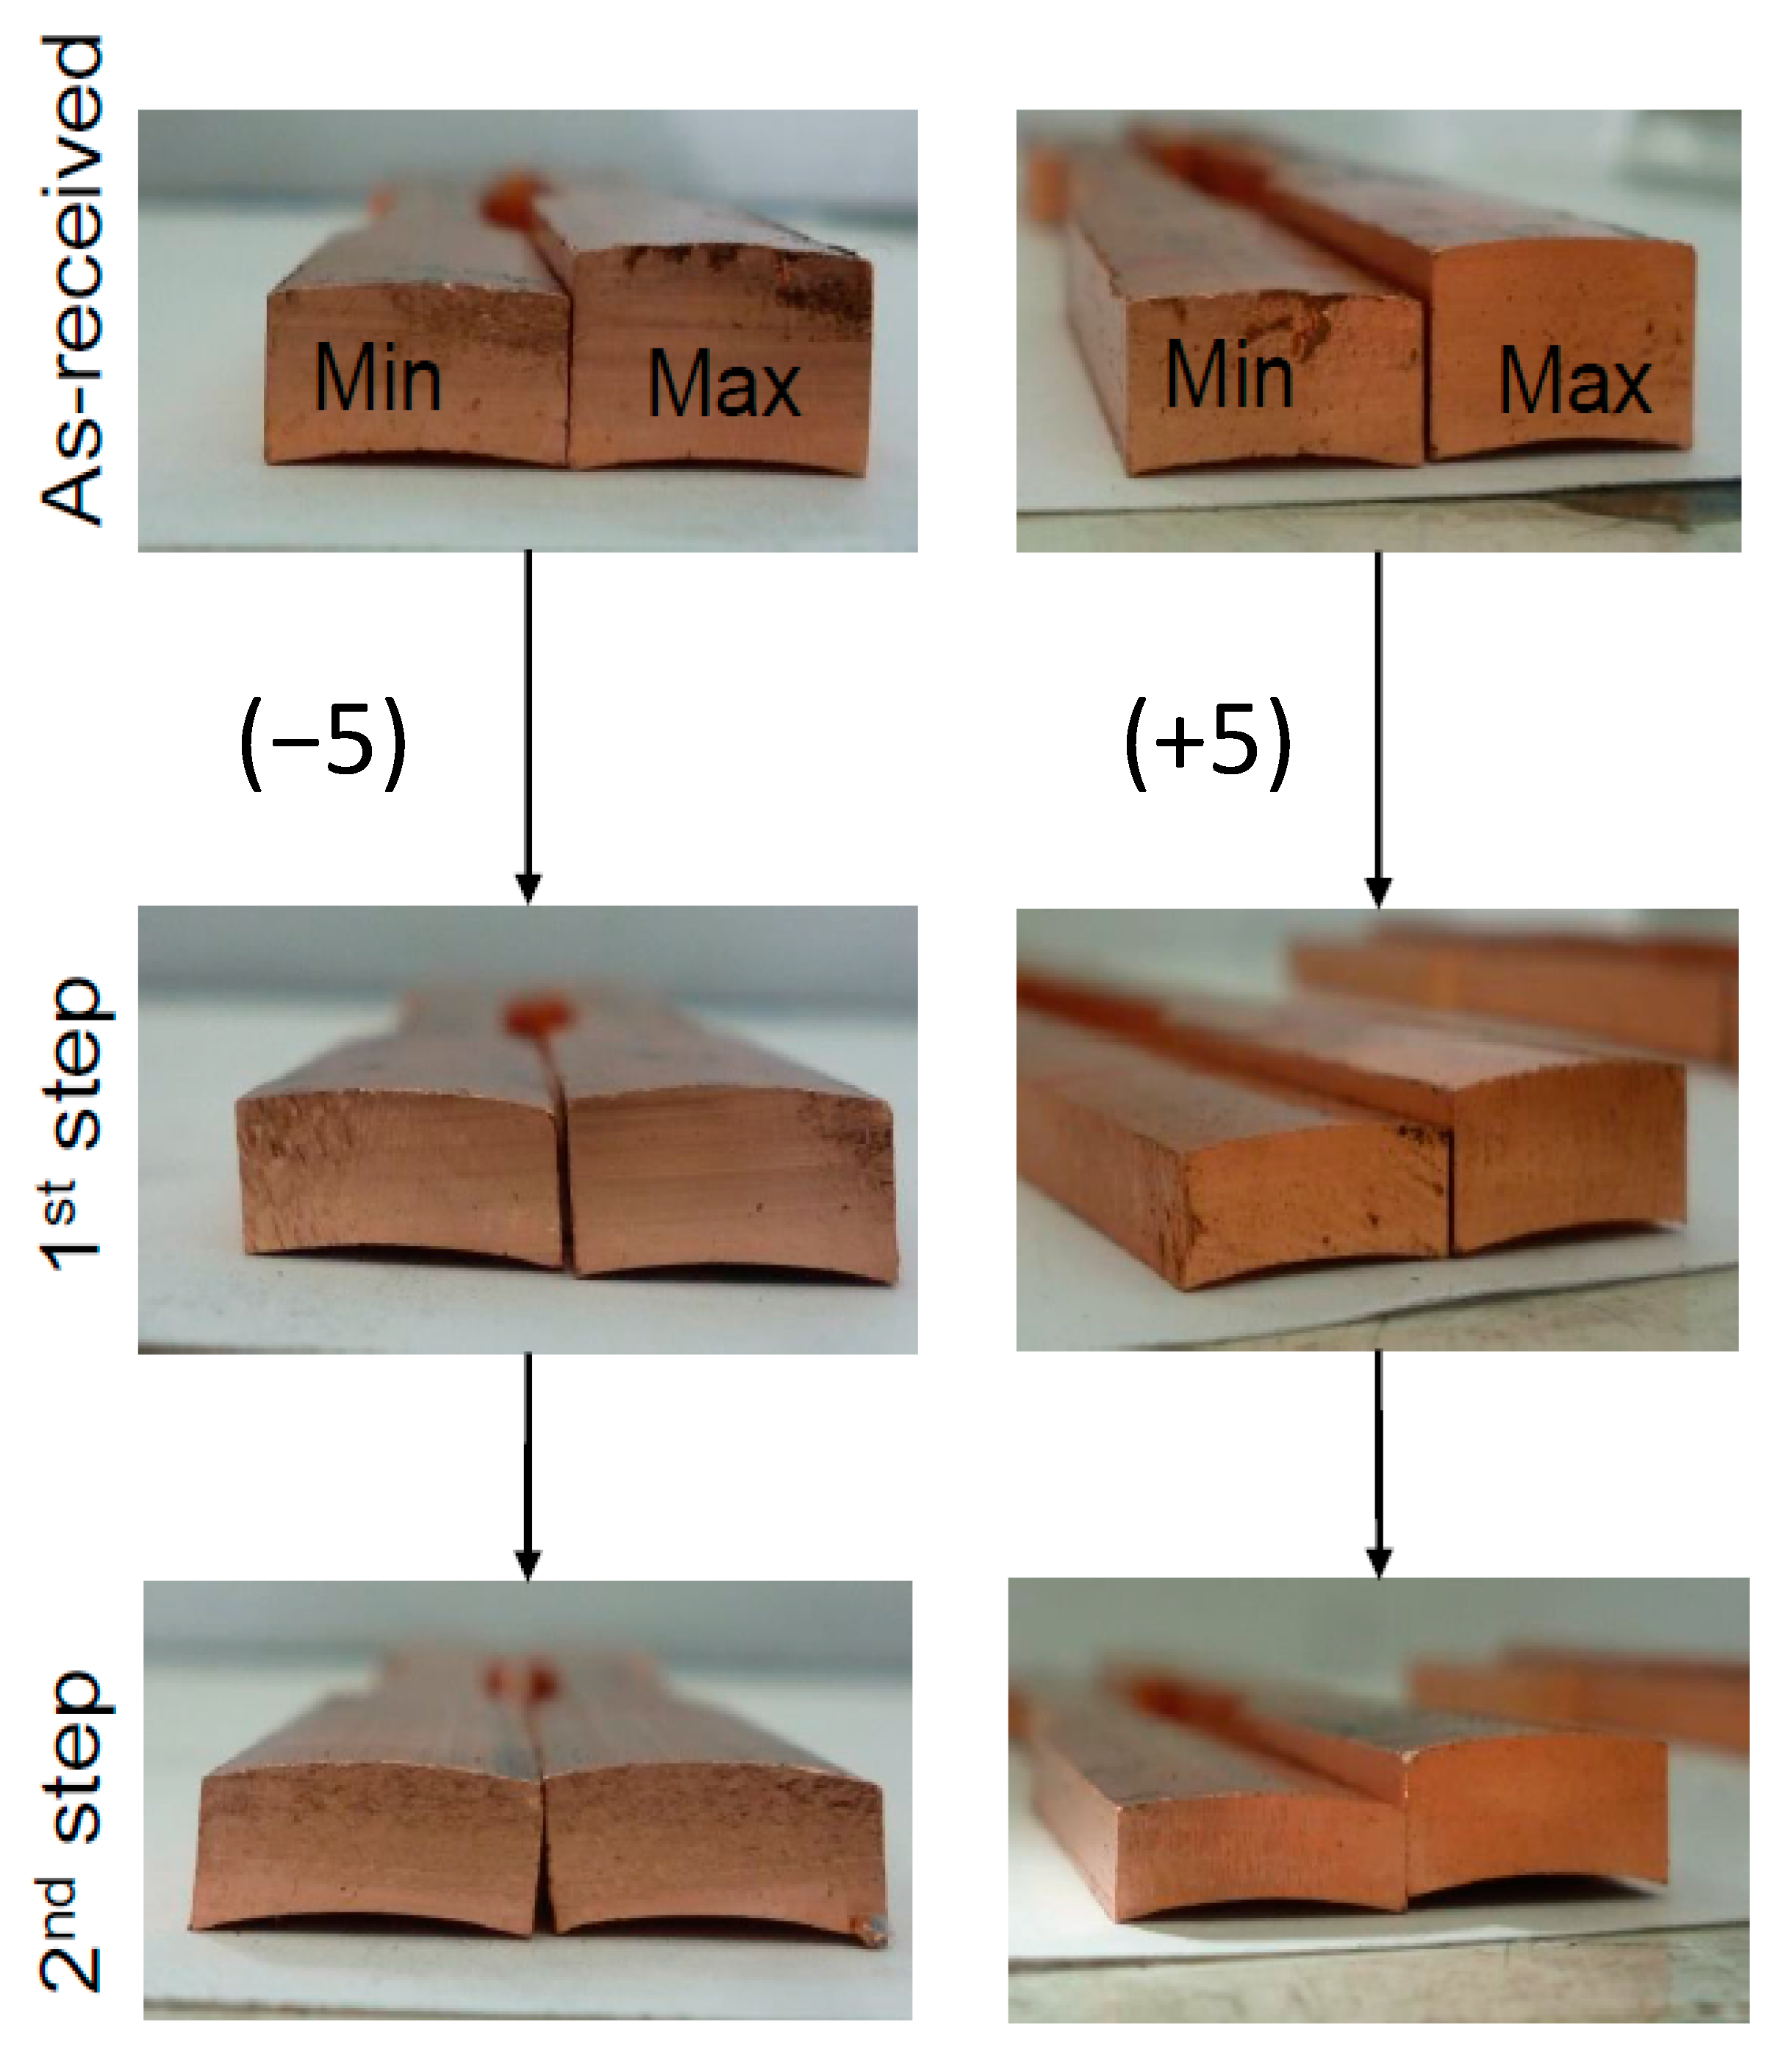
  • Tilting the drawing die shows promising control of tube eccentricity. It was possible to increase the eccentricity from 5.9% to 10.2% in two steps (tube 4ST) and to decrease it from 5.86% to 2.73% (tube 5ST). Increasing and decreasing the eccentricity is important, and expending energy and time on using the right procedure depends on the final requirements and the production costs.
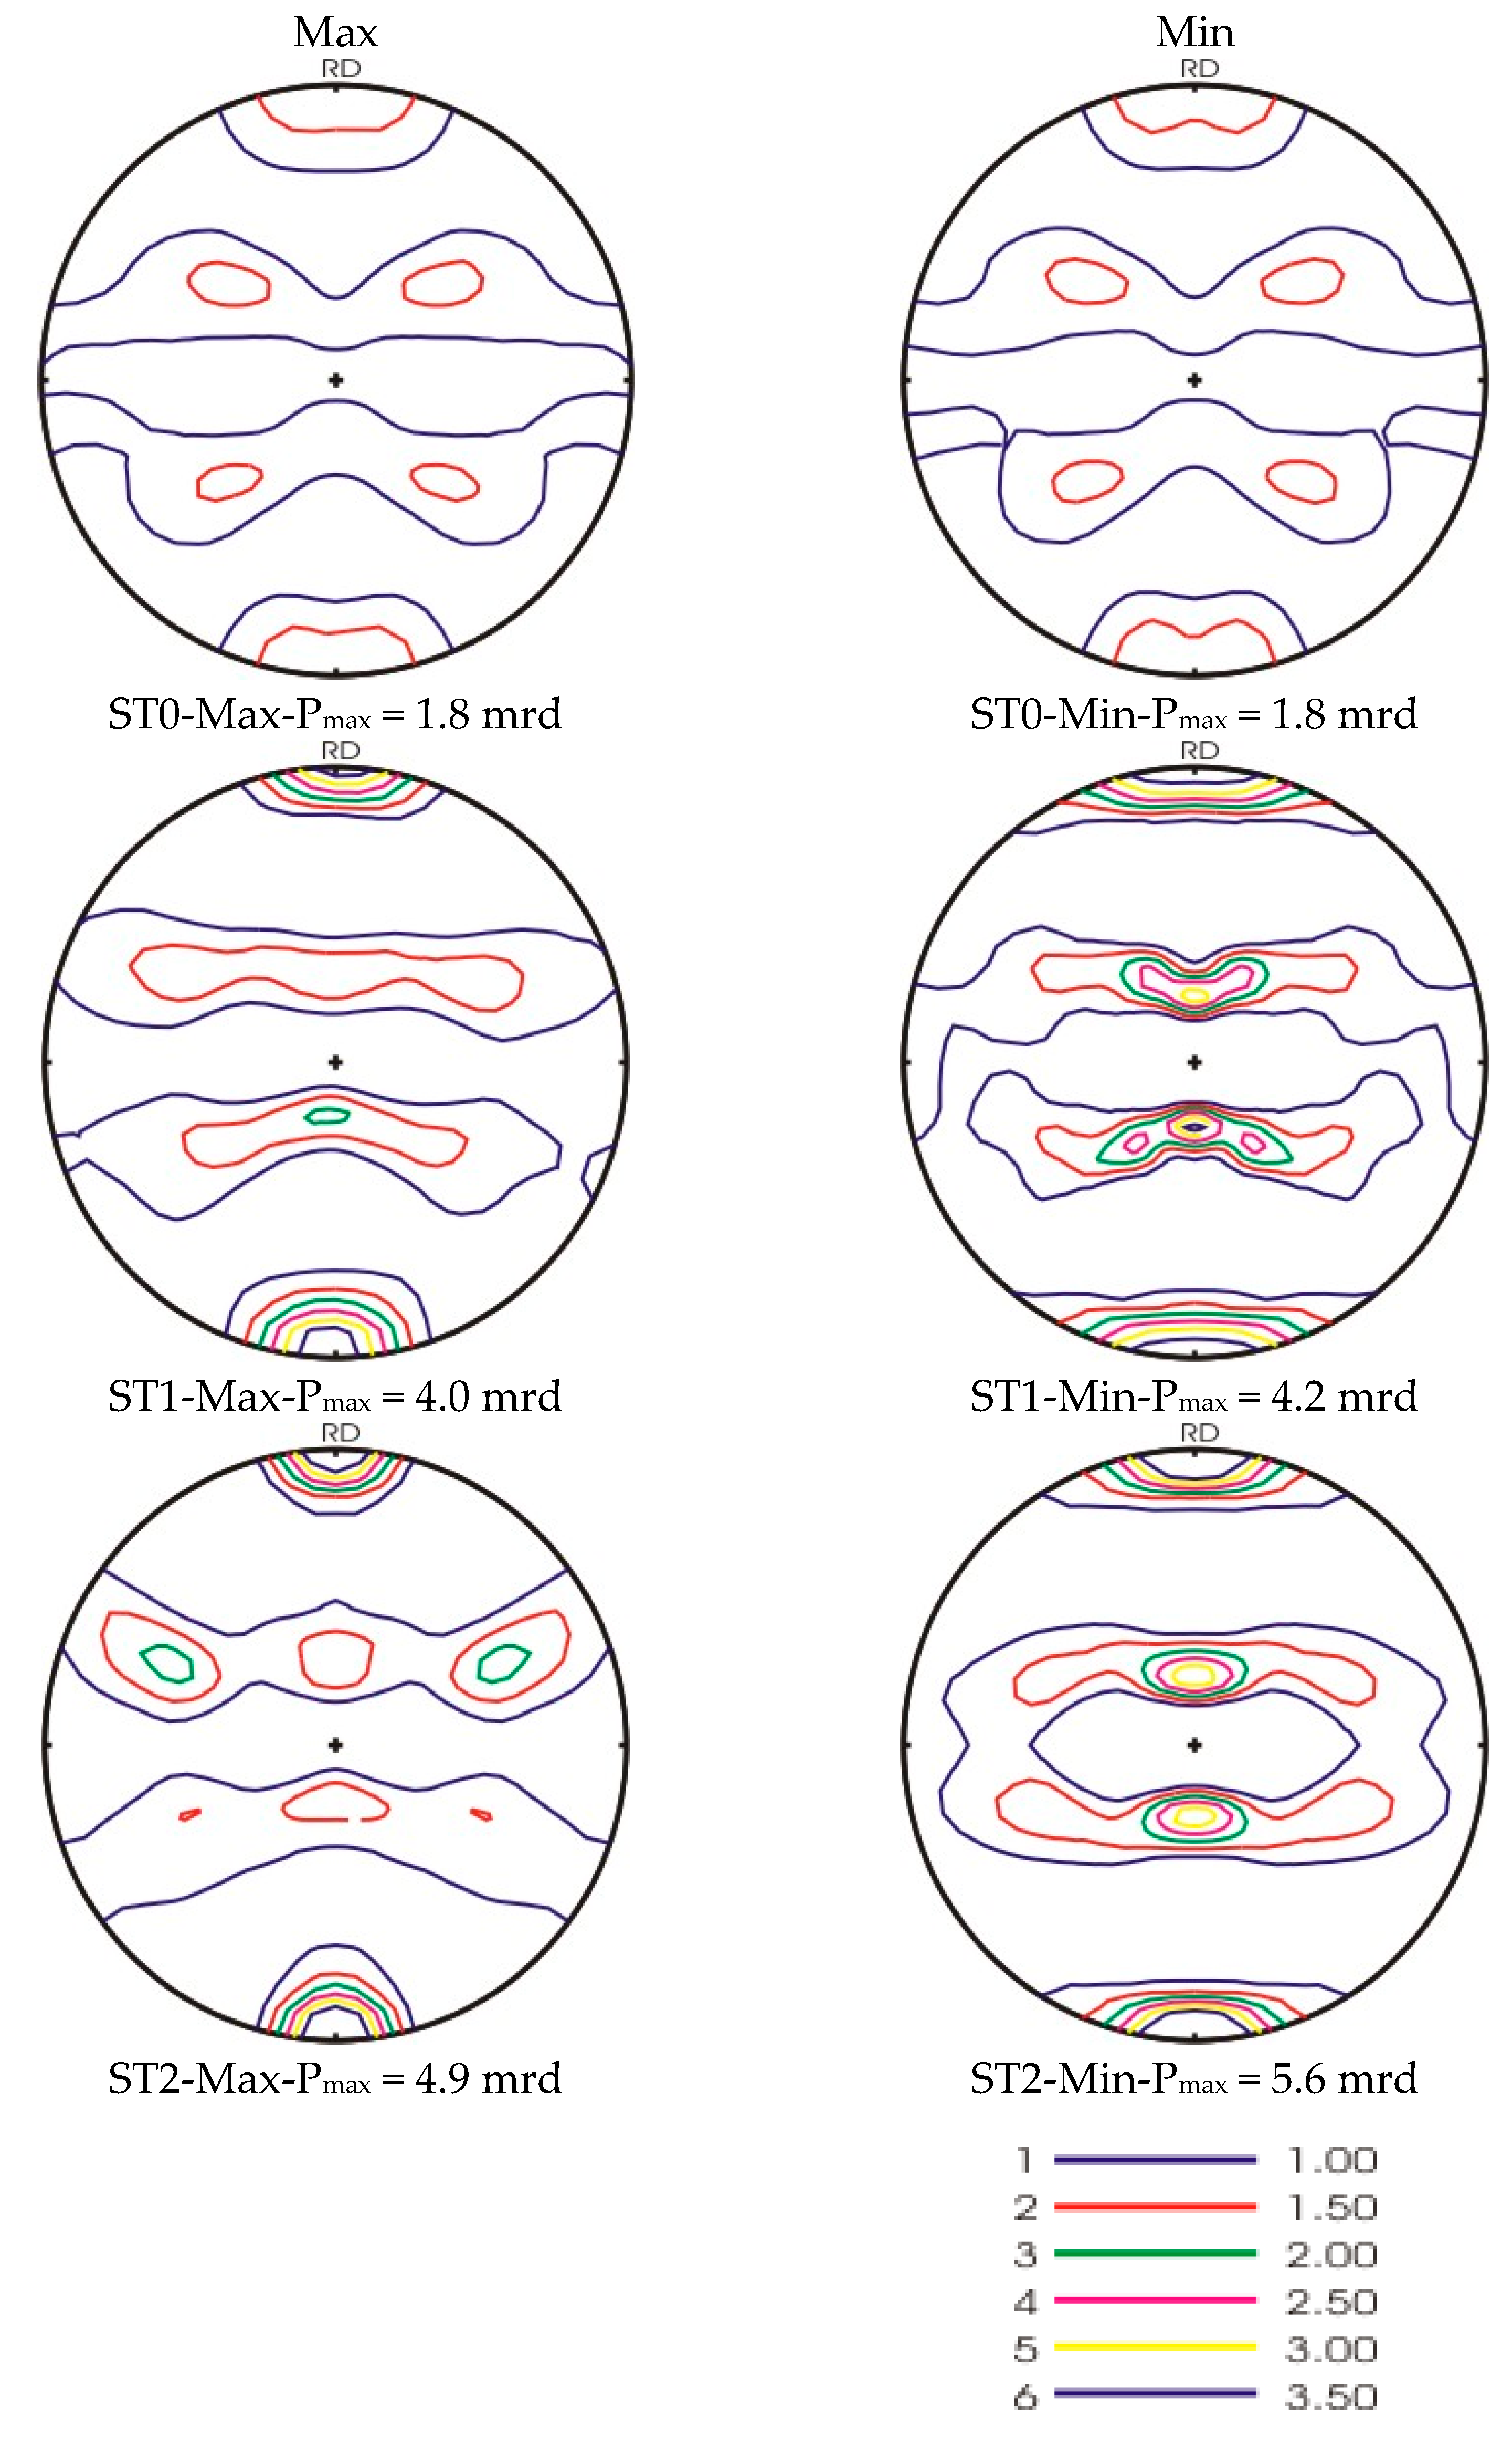
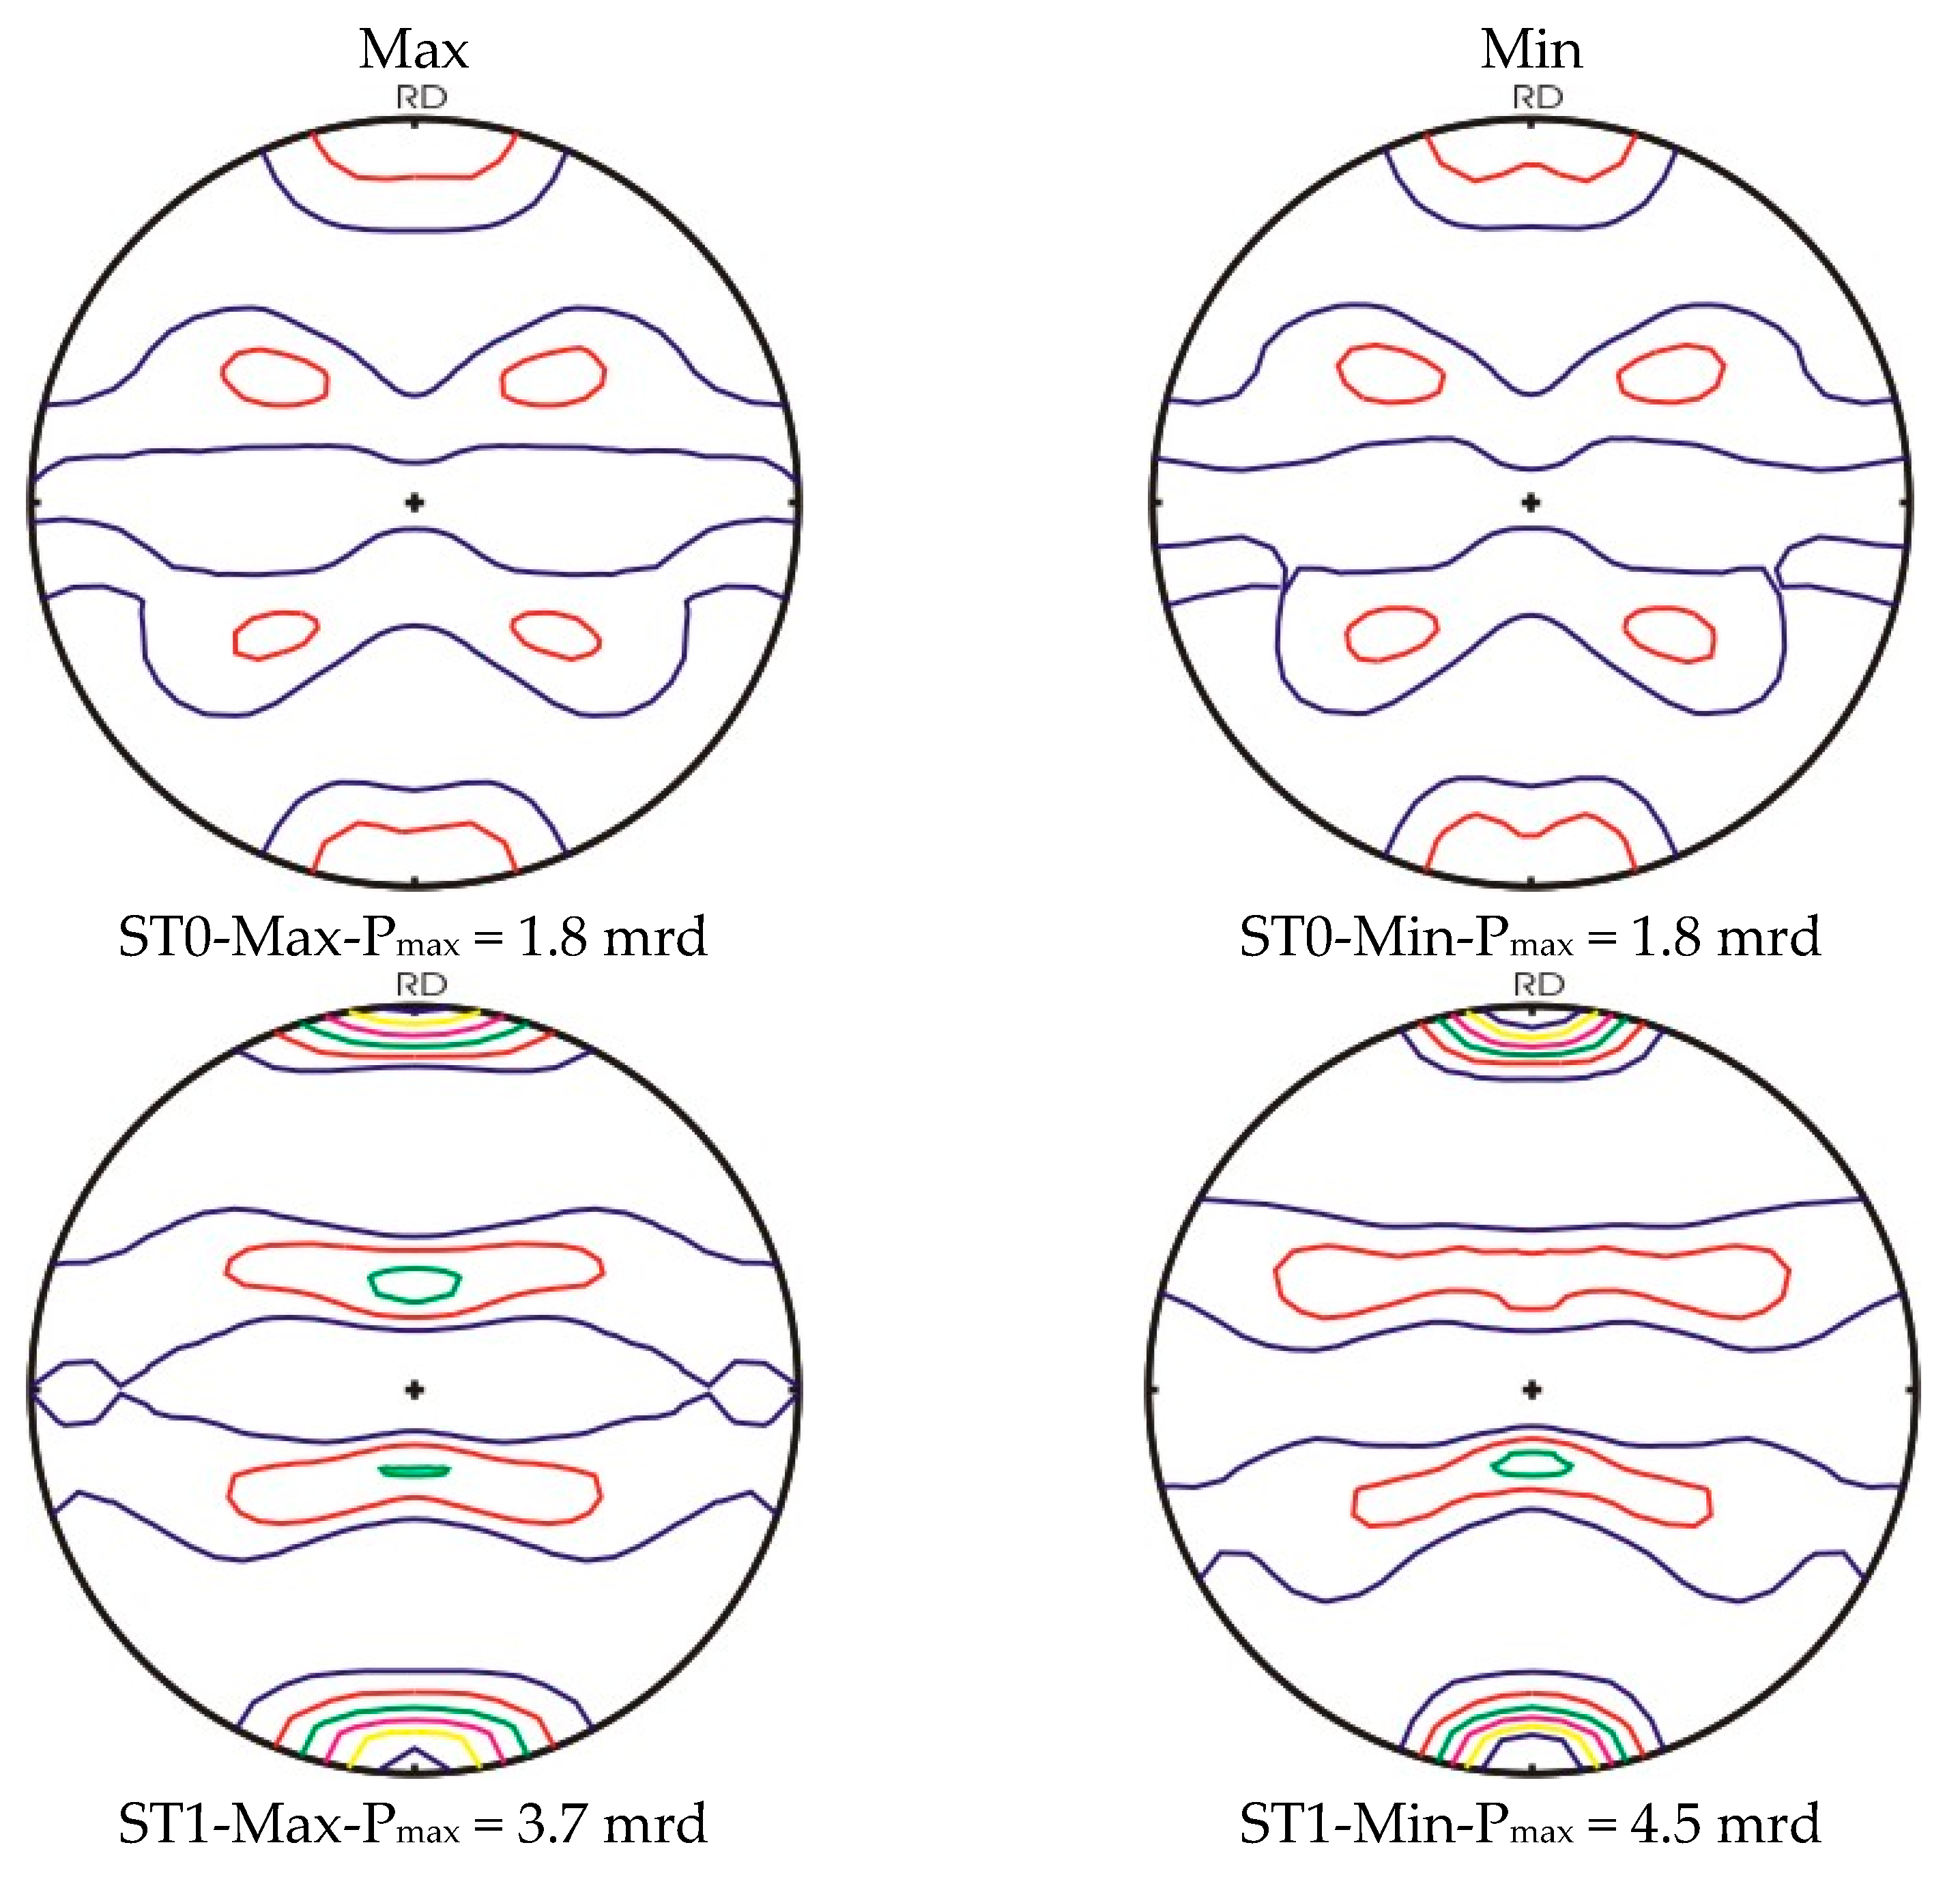
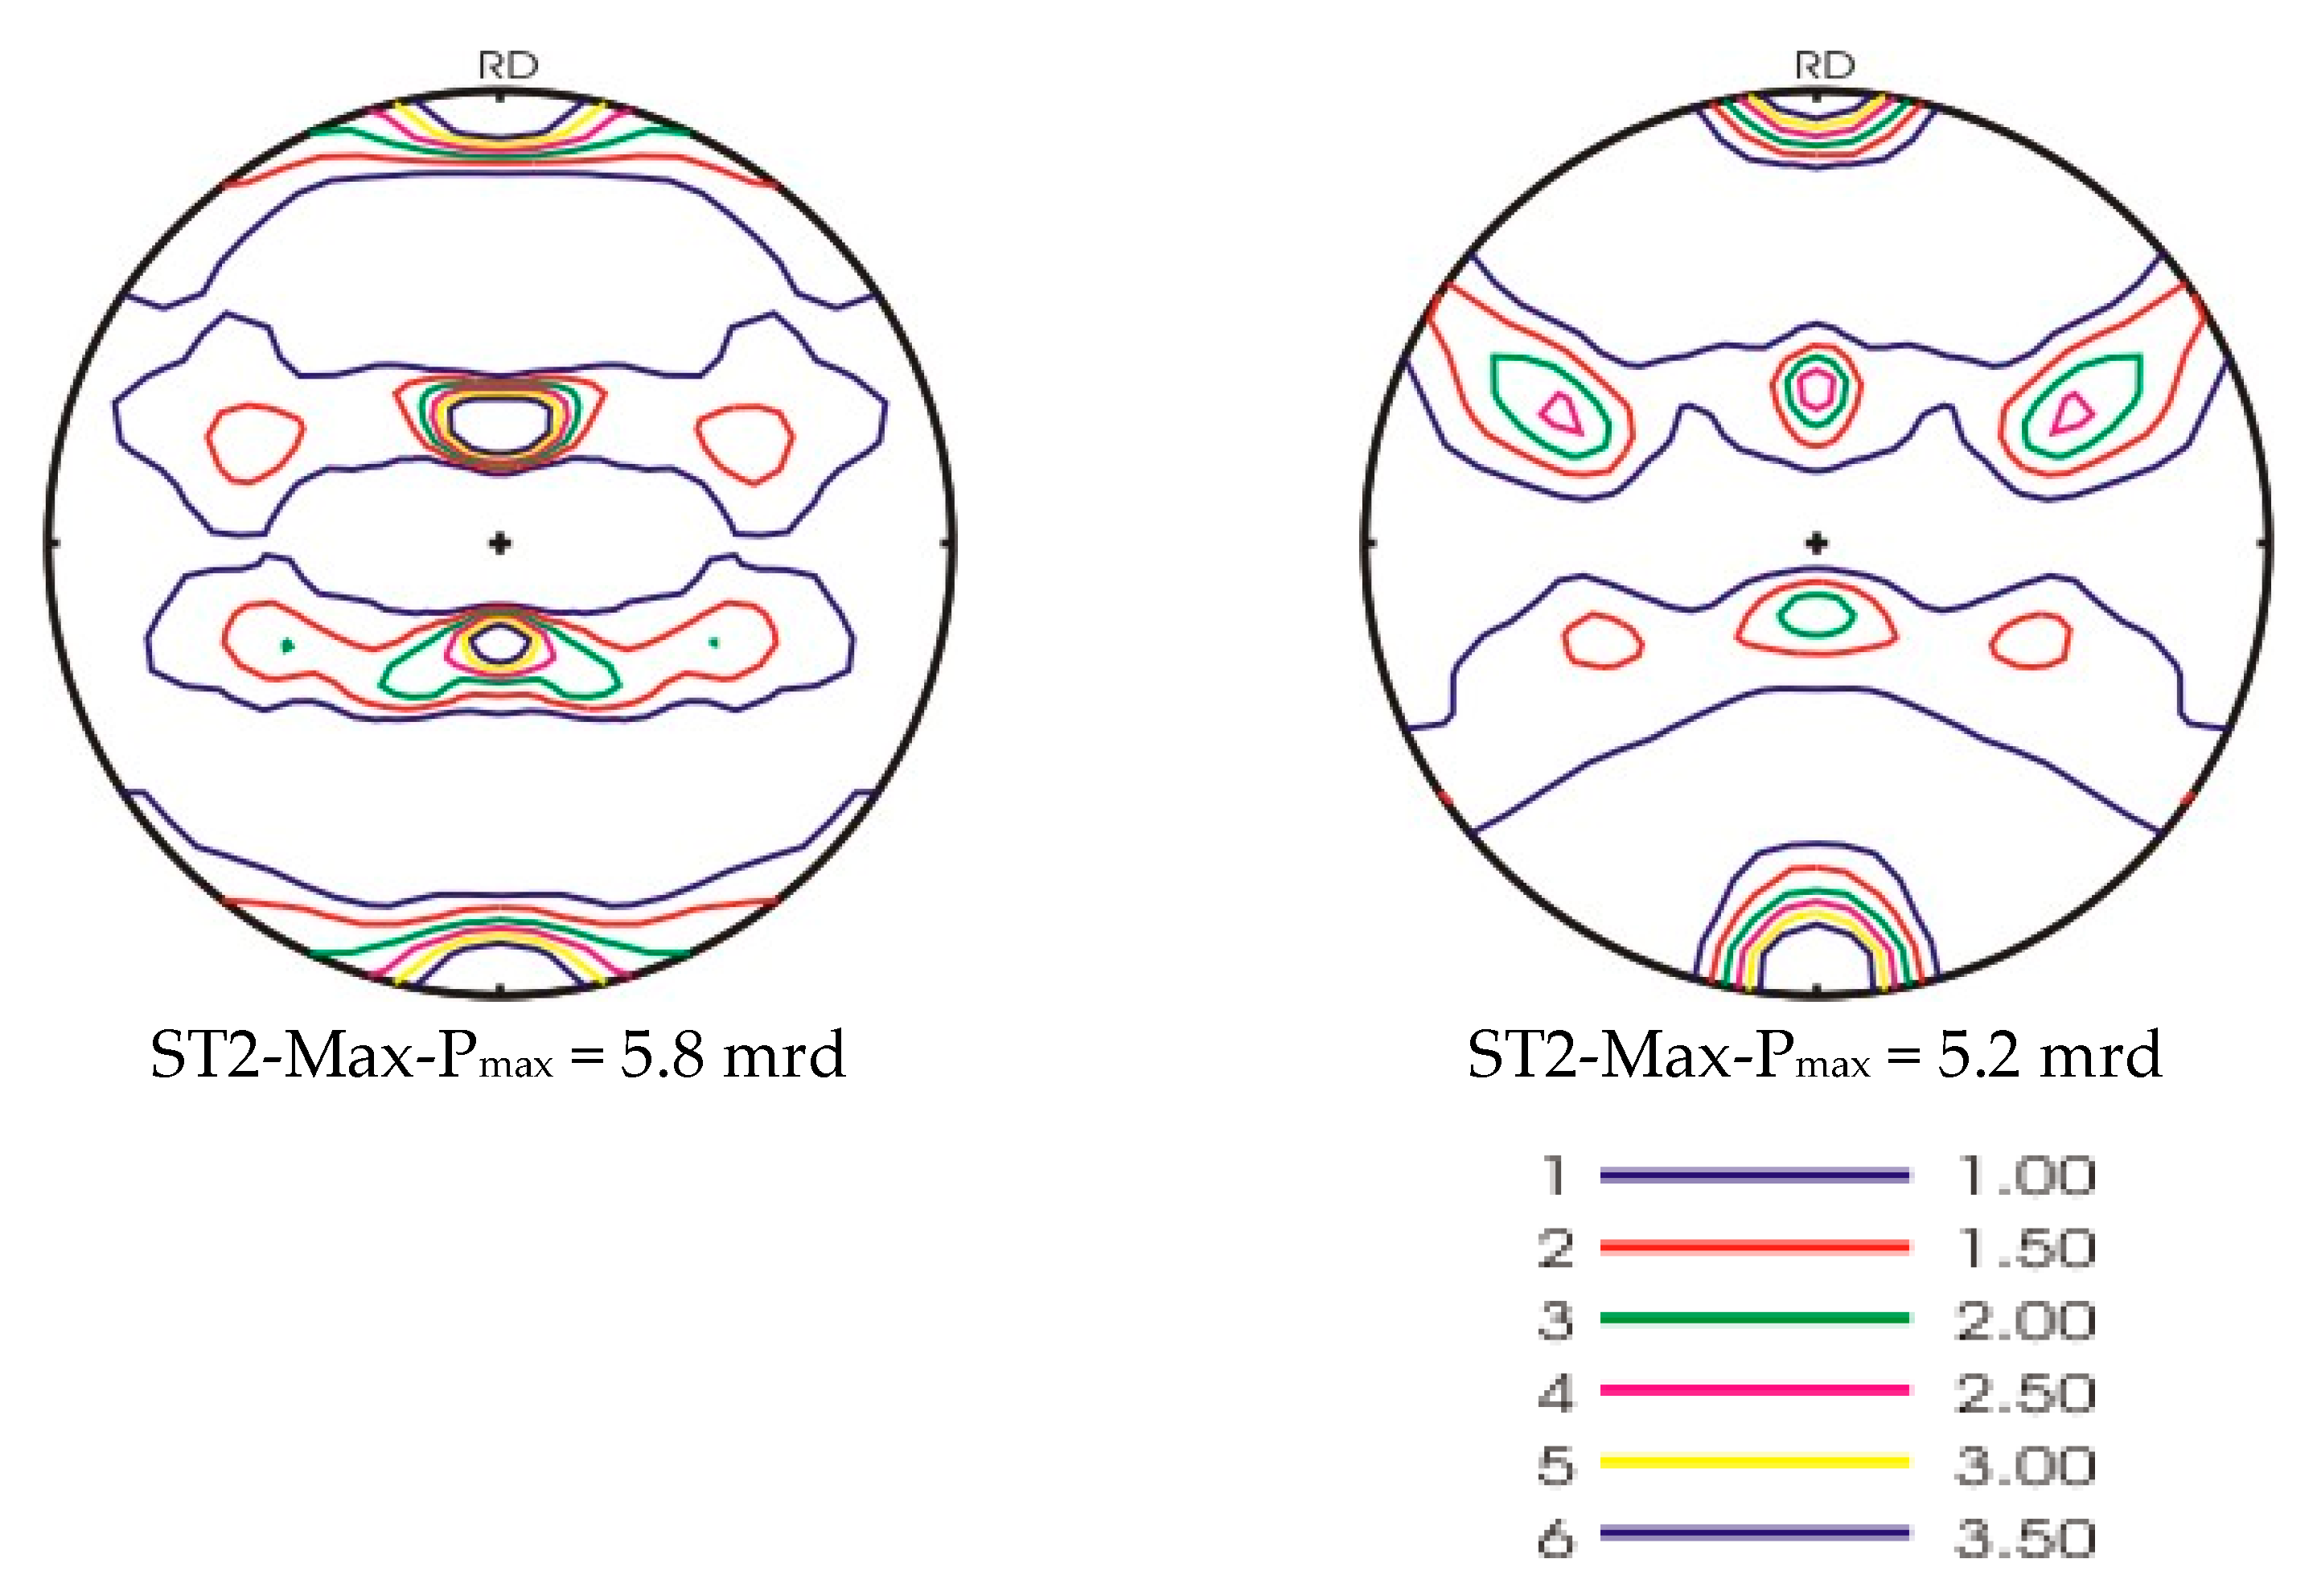
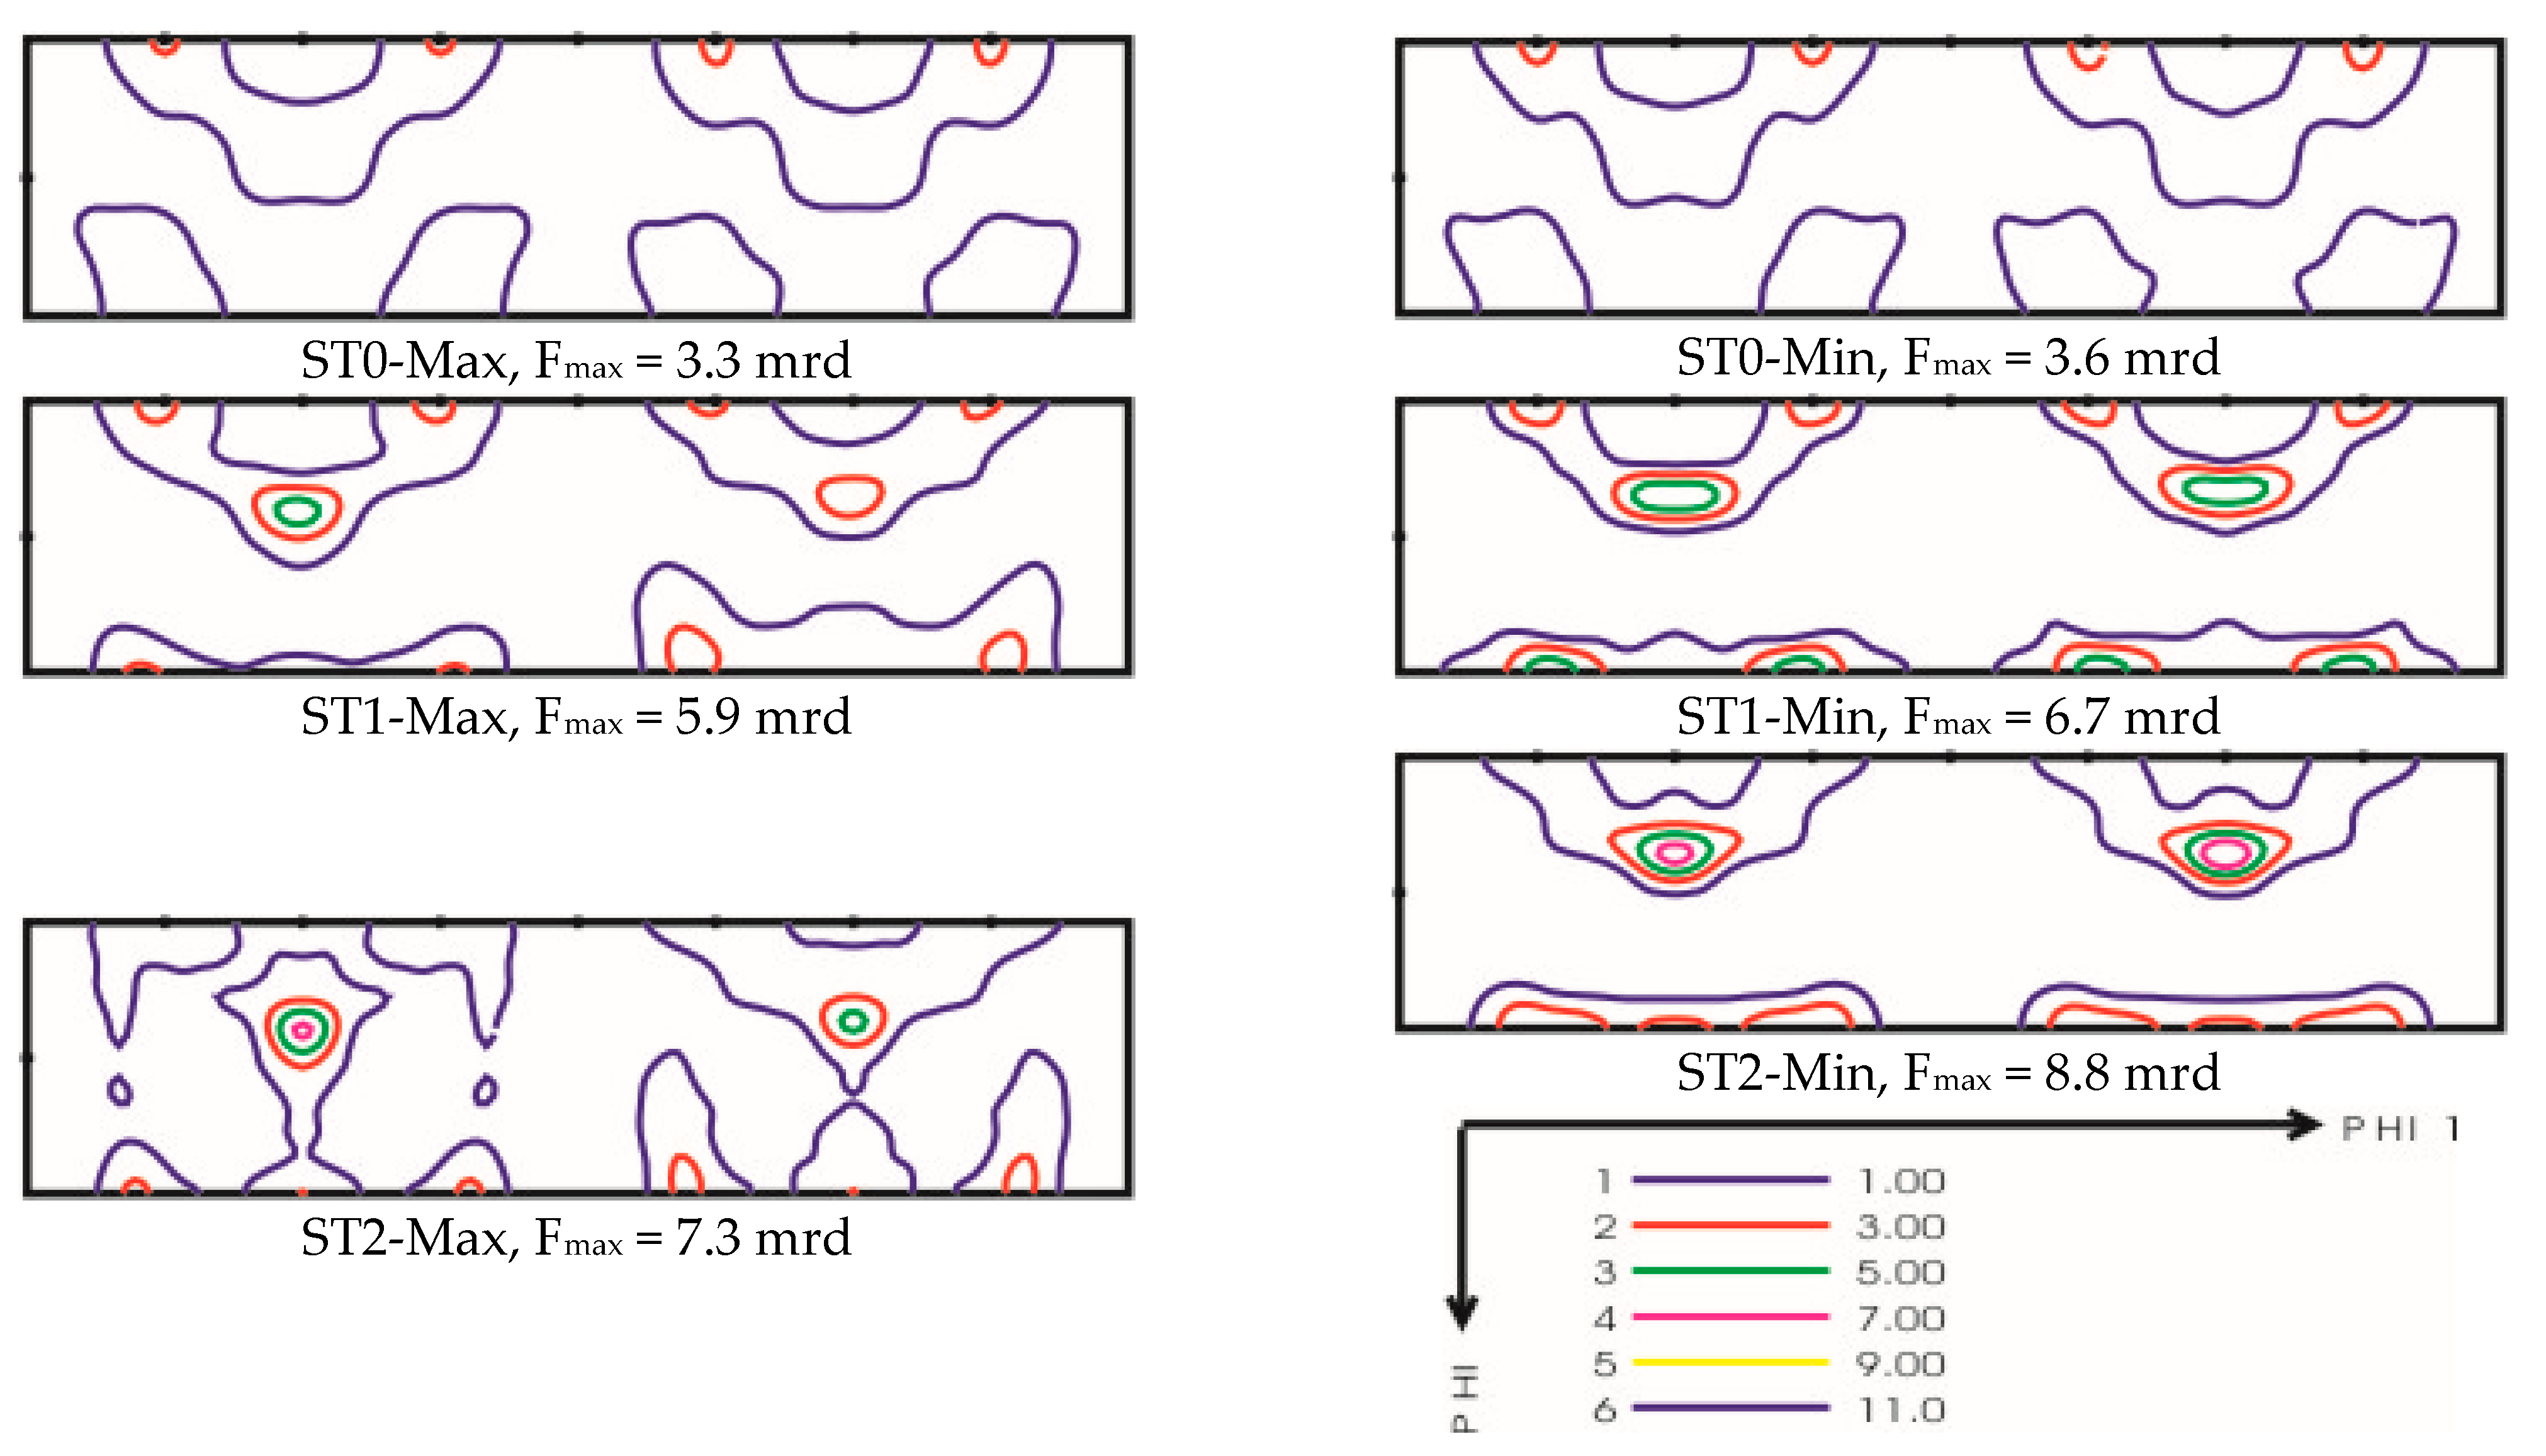
  • The development of texture in the investigated tubes could be described as a superposition of two types of texture: The plane strain and uniaxial texture types were present. Tube 4ST Max had the uniaxial type texture, while Min had the plane strain type texture. In tube 5ST, it was the opposite. Up to now, the relationship between texture evolution as well as variation around the circumference and tube drawing with a tilted die was not fully understood. Additional experiments on different drawn tubes with different tilted angles and different starting textures are necessary. Together with the variation of Q, the ratio of wall thickness reduction to diameter reduction, modeling should be improved by including the texture gradient.
  • As expected, the strength of the tube increased after each drawing pass up to 367 MPa, and the elongation to rupture decreased to 8% for 5ST2 at Min. No significant differences between Max and Min in tubes 4ST and 5ST could be detected.
  • The dislocation density magnitude was influenced by the degree of deformation and the choice of die angle. The variation of dislocation density between Max and Min in tube 5ST2 was higher than the variation in tube 4ST2. This was due to the variation of wall thickness reduction between Max and Min being higher for tube 5ST2 with the tilt angle of −5° than for tube 4ST2 with the tilt angle of +5°. Additionally, the variation of the deformation components (CuII) between Max and Min was higher for tube 5ST2 than for tube 4ST2. The idea of replacing a full texture analysis with a much faster dislocation density measurement could not be confirmed. The investigations have shown that the texture changes described with up to five texture components are much more sensitive to small variations during manufacturing than the defect density development.

Author Contributions

Data curation, N.A.-H. and M.Z.S.; funding acquisition, H.P. and H.-G.B.; investigation, N.A.-H., W.G. and N.S.; project administration, H.P., A.C. and H.-G.B.; writing—original draft, N.A.-H. and M.Z.S.; writing—review and editing, N.A.-H., M.Z.S., H.P., A.C., W.G., N.S. and H.-G.B. All authors have read and agreed to the published version of the manuscript.

Funding

This research was funded by the DFG (German Research Community) within the project BR 961/8-1, PA 837/38-1.

Institutional Review Board Statement

Not applicable.

Informed Consent Statement

Not applicable.

Data Availability Statement

Any data required from this research must be requested directly from one of the authors.

Acknowledgments

The beam time for synchrotron measurement was supported by Hereon at DESY, and the neutron measurement was supported by Hereon at MLZ. The authors would like to thank S. Gavras for his help with English grammar.

Conflicts of Interest

The authors declare no conflict of interest.

References

  1. Dieter, G.E. Mechanical Metallurgy; McGraw-Hill: London, UK, 1988. [Google Scholar]
  2. Gupta, H.N.; Gupta, R.C.; Mittal, A. Manufacturing Processes; New Age International (P) Ltd. Publishers: New Delhi, India, 2009. [Google Scholar]
  3. Pirling, T.; Carradò, A.; Brück, S.; Palkowski, H. Neutron imaging of drawn copper tube: Comparison with finite element model. Metall. Mater. Trans. A 2008, 39, 3149–3154. [Google Scholar] [CrossRef]
  4. Pirling, T.; Carradò, A.; Palkowski, H. Residual stress distribution in seamless tubes determined experimentally and FEM. Procedia Eng. 2011, 10, 3080–3085. [Google Scholar] [CrossRef] [Green Version]
  5. Carradò, A.; Duriez, D.; Barrallier, L.; Brück, S.; Fabre, A.; Stuhr, U.; Pirling, T.; Klosek, V.; Palkowski, H. Variation of residual stresses in drawn copper tube. Mater. Sci. Forum 2008, 571–572, 21–26. [Google Scholar] [CrossRef]
  6. Guillot, M.; Fafard, M.; Girard, S.; Rahem, A.; D’Amours, G. Experimental Exploration of the Aluminum Tube Drawing Process for Producing Variable Wall Thickness Components used in Light Structural Applications. SAE Tech. Pap. 2010. [Google Scholar] [CrossRef] [Green Version]
  7. Tenchhoff, E. Verformungsmechanismen Textur und Anisotropie in Zirkonium un Zircaloy; Meterialkundlich-Technische Reihe, Band 5; Gebrüder Bornträger Berlin: Stuttgart, Germany, 1980. [Google Scholar]
  8. Chan, R.W.; Haasen, P. Physical Metallurgy; North-Holland Physics Publication: North Holland, The Netherlands, 1983. [Google Scholar]
  9. Scardi, P.; Leoni, M.; Delhez, R. Line broadening analysis using integral breadth methods: A critical review. J. Appl. Crystallogr. 2004, 37, 381–390. [Google Scholar] [CrossRef]
  10. Williamson, G.K.; Hall, W.H. X-ray Line Broadening from Filed Aluminium and Wolfram. Acta Metall. 1953, 1, 22–25. [Google Scholar] [CrossRef]
  11. Klug, H.; Alexander, L. X-ray Diffraction Procedures: For Polycrystalline and Amorphous Materials; John Wiley & Sons: New York, NY, USA, 1974. [Google Scholar]
  12. Scherrer, P. Bestimmung der Größe und der Inneren Struktur von Kolloidteilchen Mittels Röntgenstrahlen; Nachrichten von der Gesellschaft der Wissenschaften zu Göttingen; Mathematisch-Physikalische Klasse: Göttingen, Germany, 1918; Volume 2, pp. 98–100. [Google Scholar]
  13. Wilkens, M. The determination of density and distribution of dislocations in deformed single crystals from broadened X-ray diffraction profiles. Phys. Status Solidi 1970, 2, 359–370. [Google Scholar] [CrossRef]
  14. Warren, B.E.; Averbach, B.L. The Effect of Cold-Work Distortion on X-ray Patterns. J. Appl. Phys. 1950, 21, 595–599. [Google Scholar] [CrossRef]
  15. Borbély, A.; Dragomir-Cernatescu, I.; Ribárik, G.; Ungár, T. Computer program ANIZC and Trigonal Crystals. J. Appl. Crystallogr. 2003, 36, 160–162. [Google Scholar] [CrossRef]
  16. Ungár, T.; Borbély, A. The effect of dislocation contrast on x-ray line broadening: A new approach to line profile analysis. Appl. Phys. Lett. 1996, 69, 3173–3175. [Google Scholar] [CrossRef]
  17. Ungár, T.; Dragomir, I.; Ribarik, G.; Borbély, A. Crystallite size distribution and dislocation structure determined by diffraction profile analysis: Principles and practical application to cubic and hexagonal crystals. J. Appl. Crystallogr. 2001, 34, 298–310. [Google Scholar] [CrossRef] [Green Version]
  18. Zhong, Z.Y.; Brokmeier, H.-G.; Maawad, E.; Schell, N. In-situ investigation of the anisotropic mechanical behavior of rolled AA 7020-T6 alloy through lattice strain evolution during uniaxial tension. Mater. Sci. Eng. A 2015, 639, 519–525. [Google Scholar] [CrossRef]
  19. Woo, W.; Ungár, T.; Feng, Z.; Kenik, E.; Clausen, B. X-ray and Neutron Diffraction Measurements of Dislocation Density and Subgrain Size in a Friction-Stir-Weld Aluminum Alloy. Met. Mater. Trans. A 2010, 41, 1210–1216. [Google Scholar] [CrossRef] [Green Version]
  20. Kme, A.G. Available online: http://www.kme.com/de/ (accessed on 8 April 2021).
  21. Foadian, F. Precision Tube Production Influencing the Eccentricity, Residual Stresses and Texture Developments: Experiments and Multiscale Simulation. Ph.D. Thesis, TU-Clausthal, Clausthal-Zellerfeld, Germany, 2017. [Google Scholar]
  22. Hofmann, M.; Schneider, R.; Seidle, G.A.; Rebelo-Kornmeier, J.; Wimpory, R.C.; Garbe, U.; Brokmeier, H.-G. The new materials science diffractometer STRESS-SPEC at FRM-II. Phys. B 2006, 385–386, 1035–1037. [Google Scholar] [CrossRef]
  23. Brokmeier, H.-G.; Gan, W.M.; Randau, C.; Völler, M.; Rebelo-Kornmeier, J.; Hofmann, M. Texture analysis at neutron diffractometer STRESS-SPEC. Nucl. Instrum. Methods Phys. Res. Sect. B 2011, A642, 87–92. [Google Scholar] [CrossRef] [Green Version]
  24. Tobisch, J.; Bunge, H.-J. The spherical sample method in neutron diffraction texture determination. Texture 1972, 1, 125–127. [Google Scholar] [CrossRef] [Green Version]
  25. Brokmeier, H.G. Advances and application of neutron texture analysis. Texture Microstruct. 1999, 33, 13–33. [Google Scholar] [CrossRef] [Green Version]
  26. Randau, C.; Garbe, U.; Brokmeier, H.-G. StressTextureCalculator: A software tool to extract texture, strain, and microstructure information from area-detector measurements. J. Appl. Crystallogr. 2011, 44, 641–646. [Google Scholar] [CrossRef]
  27. Bunge, H.J.; Klein, H. Determination of high resolution pole figures with area detector. Z. Met. 1996, 87, 465–475. [Google Scholar]
  28. Hammersley, A.P.; Svensson, S.O.; Hanfland, M.; Fitch, A.N.; Hausermann, D. Two-dimensional detector software: From real detector to idealised image or two-theta scan. Int. J. High Press. Res. 1996, 14, 235–248. [Google Scholar] [CrossRef]
  29. Foadian, F.; Carradó, A.; Brokmeier, H.-G.; Gan, W.M.; Schell, N.; Al-Hamdany, N.; Palkowski, H. Evolution of texture in precision seamless tubes investigated by synchrotron and neutron radiation. Meas. Mater. Charact. 2019, 151, 582–589. [Google Scholar] [CrossRef]
  30. Linssen, G.; Mengelberg, H.D.; Stüwe, H.P. Zyklische Texturen in Drähten kubisch flächenzenzentrieter Metalle. Z. Met. 1964, 55, 600. [Google Scholar]
  31. Liu, W.C.; Man, C.-S.; Morris, J.-G. Lattice rotation of cube orientation to β fiber during cold rolling of AA 5052 aluminum alloy. Scr. Mater. 2001, 45, 807–814. [Google Scholar] [CrossRef]
  32. Dragomir, I.C.; Ungár, T. The dislocations contrast factors of cubic crystals in the Zener constant range between zero and unity. Powder Diffr. 2002, 17, 104–111. [Google Scholar] [CrossRef]
  33. Zhong, Z.Y.; Brokmeier, H.-G.; Gan, W.M.; Maawad, E.; Schwebke, B.; Schell, N. Dislocation density evolution of Al7020-T6 investigated by in-situ synchrotron diffraction under tensile load. Mater. Charact. 2015, 108, 124–131. [Google Scholar] [CrossRef]
  34. Bollenrath, F.; Hauk, V.; Müller, E.H. Zur Berechnung der vielkristallinen Elastizität-konstanten aus den Werten der Einkristalle. Z. Met. 1967, 58, 76–82. [Google Scholar]
Figure 1. Schematic tube cross section emphasizing eccentricity.
Metals 11 00638 g001
Figure 2. Tilting of the die for a positive (+) setup. Reprinted from ref. [21].
Metals 11 00638 g002
Figure 3. Schematic representation for preparation of the samples for the global texture measurements.
Metals 11 00638 g003
Figure 4. Phosphorus deoxidized copper tube (Cu DHP): (a) installed in the sample changer magazine; (b) mounted on the robot arm for pole figure measurement; (c) detector image at one position.
Metals 11 00638 g004
Figure 5. Tensile sample cut from the Cu tube wall. All dimensions in mm.
Metals 11 00638 g005
Figure 6. Debye–Scherrer rings for a Cu tube and the integration sectors along the drawing direction.
Metals 11 00638 g006
Figure 7. Diffraction patterns of 4ST tubes at Min for the integration sectors along the drawing direction.
Metals 11 00638 g007
Figure 8. Max and Min after two drawing steps with dies tilted ±5° [21].
Metals 11 00638 g008
Figure 9. The (111) pole figures of tube 4ST after different passes.
Metals 11 00638 g009
Figure 10. The (111) pole figures of tube 5ST after different passes.
Metals 11 00638 g010aMetals 11 00638 g010b
Figure 11. Texture components/fibers and their positions in the orientation space using triclinic sample symmetry for the orientation distribution function (ODF) sections (φ2 = 45°) for the copper tube.
Metals 11 00638 g011
Figure 12. ODF section φ2 = 45° of tube 4ST after different passes.
Metals 11 00638 g012
Figure 13. ODF section φ2 = 45° of tube 5ST after different passes.
Metals 11 00638 g013
Figure 14. Stress–strain curves of 4ST0, 4ST1 and 4ST2 for Max.
Metals 11 00638 g014
Figure 15. (a) FWHM as function of 2θ in drawing direction for 4ST-Min. (b) Williamson–Hall plot for 4ST-Min.
Metals 11 00638 g015
Figure 16. Modified Williamson–Hall plots for (a) 4ST Min., (b) 4ST Max., (c) 5ST Min. and (d) 5ST Max.
Metals 11 00638 g016
Figure 17. Dislocation density estimation for the Cu tube at different deformation steps.
Metals 11 00638 g017
Table 1. Chemical composition of the Cu tubes in wt.%.
SampleZnFeSiMgTePSbAlCCu
Cu DHP0.050.020.020.010.020.010.010.010.0199.84
Table 2. Drawing steps. Ø: diameter, t: wall thickness.
StepEntry Ø × t mm2Die, Inner Ø mmDie, Angle°Plug, Ø mmExit Ø × t mm2
1st65 × 5.5601251.060 × 4.5
2nd60 × 4.5501244.050 × 4.0
Table 3. Dimensions of Cu tube before and after drawing with a tilted die.
TubeDiameter (mm)Wall Thickness (mm)Eccentricity (%)
MaxMinMaxMin
4ST065655.785.145.86
4ST1 (+5°)60604.844.147.85
4ST2 (+5°)50504.463.6410.17
5ST065655.785.145.86
5ST1 (−5°)60604.634.353.42
5ST2 (−5°)50504.084.072.73
Table 4. Cube, copper and S components for tube 4 (all units in mrd).
SampleCube
{001}<100>
(45,0,45)
Cu I
{112}<111>
(90,35,45)
Cu II
{112}<111>
(270,35,45)
SI
{123}<634>
(59,37,63)
SII
{123}<634>
(239,37,63)
4ST0-Max3.32.31.92.11.9
4ST1-Max3.45.844.94.1
4ST2-Max2.77.45.46.34.9
4ST0-Min3.62.42.12.12
4ST1-Min4.46.36.16.55.5
4ST2-Min2.67.58.36.97.6
Table 5. Cube, copper and S components for tube 5 (all units in mrd).
SampleCube
{001}<100>
(45,0,45)
Cu I
{112}<111>
(90,35,45)
Cu II
{112}<111>
(270,35,45)
SI
{123}<634>
(59,37,63)
SII
{123}<634>
(239,37,63)
5ST0-Max3.32.31.92.11.9
5ST1-Max3.34.63.94.34.1
5ST2-Max311.910.98.66.4
5ST0-Min3.62.42.12.12
5ST1-Min3.76.44.65.54.2
5ST2-Min3.410.65.97.94.9
Table 6. Tensile properties of the Cu tubes before and after drawing with a tilted die. Three tests were performed in each case. Deviation <1.5% for YS and UTS, <3% for the elongation to rupture.
TubeYS (MPa)UTS (MPa)A (%)
MaxMinMaxMinMaxMin
4ST043412222236765
4ST1 (+5°)3023093123161012
4ST2 (+5°)34534735035399
5ST043412222236765
5ST1 (−5°)3002803052851011
5ST2 (−5°)35035535536788
Table 7. The dislocation density estimation for Cu tube.
TubeDislocation Density
MaxMin
4ST00.36 × 10140.48 × 1014
4ST1 (+5°)1.11 × 10140.93 × 1014
4ST2 (+5°)1.21 × 10141.18 × 1014
5ST00.33 × 10140.48 × 1014
5ST1 (−5°)1.45 × 10141.11 × 1014
5ST2 (−5°)1.49 × 10141.15 × 1014
Publisher’s Note: MDPI stays neutral with regard to jurisdictional claims in published maps and institutional affiliations.

