Article

Right Ventricular Global and Regional Remodeling in American-Style Football Athletes: A Longitudinal 3D Echocardiographic Study

1
Department of Clinical Physiology, Normandie Université, UNICAEN, CHU de Caen Normandie, Inserm Comete, GIP Cyceron, 14000 Caen, France
2
BCN Medtech, DTIC Universitat Pompeu Fabra, 08002 Barcelona, Spain
3
Department of Cardiology, Normandie Université, UNICAEN, CHU de Caen Normandie, EA4650 SEILIRM, 14000 Caen, France
4
Clinique de Médecine du Sport, University of Montreal, Montreal, QC H3T1J4, Canada
5
Philips Research, Medical Imaging (Medisys), 92150 Suresnes, France
6
ICREA, Catalan Institution for Research and Advanced Studies, 08010 Barcelona, Spain
7
Research Center of the Hospital, University of Montreal, Montreal, QC H2X0A9, Canada
*
Author to whom correspondence should be addressed.
The two first and last authors contributed equally to this work.
Appl. Sci. 2021, 11(8), 3357; https://doi.org/10.3390/app11083357
Submission received: 19 February 2021 / Revised: 3 April 2021 / Accepted: 6 April 2021 / Published: 8 April 2021

Abstract

:

Featured Application

The present study described the physiological right ventricular response to intensive training using a geometry processing method to analyze regional volumetric remodeling. We confirmed that right ventricular enlargement is part of the exercise-induced cardiac adaptations to chronic exercise in American-style football-trained athletes. In future work, the use of this method to characterize athletes and clinical populations involving dilatation of the right ventricle might allow to better differentiate physiological remodeling from early pathological changes.

Abstract

Few data exist concerning the right ventricular (RV) physiological adaptation in American-style football (ASF) athletes. We aimed to analyze the RV global and regional responses among ASF-trained athletes. Fifty-nine (20 linemen and 39 non-linemen) ASF athletes were studied before and after inter-seasonal training. During this period, which lasted 7 months, all athletes were exposed to combined dynamic and static exercises. Cardiac longitudinal changes were examined using three-dimensional transthoracic echocardiography. A computational method based on geodesic distances was applied to volumetrically parcellate the RV into apical, outlet, and inlet regions. RV global and regional end-diastolic volumes increased significantly and similarly in linemen and non-linemen after training, with predominant changes in the apex and outlet regions. RV global and regional ejection fractions were preserved. Morphological changes were uniformly distributed among the four cardiac chambers, and it was independent of the field position. Assessment of RV end-diastolic global, inlet and apical volumes showed low intra-observer (3.3%, 4.1%, and 5.3%, respectively) and inter-observer (7%, 12.2%, and 9%, respectively) variability, whereas the outlet regional volumetric assessment was less reproducible. To conclude, ASF inter-seasonal training was associated with a proportionate biventricular enlargement, regardless of the field position. Regional RV analysis allowed us to quantify the amount of exercise-induced remodeling that was larger in the apical and outlet regions.

1. Introduction

In the last decade, a growing number of longitudinal echocardiographic studies focused on describing cardiovascular physiology in American-style football (ASF) athletes [1,2,3,4,5]. These studies made significant contributions to the understanding of the impact of ASF participation on the left ventricular (LV) remodeling phenotype, showing a higher prevalence of maladaptive LV remodeling among competitive athletes playing linemen field positions compared to their non-linemen counterparts [6]. Although a close interaction between exercise-induced LV and right ventricular (RV) adaptations has been confirmed in many sports disciplines [7,8,9], the RV response to ASF participation received less attention. To our knowledge, a single two-dimensional (2D) echocardiographic study analyzed in 24 athletes the RV response to ninety days of exercise throughout an ASF competitive season, showing no effect of team training on the RV morphology nor function [10]. The training regimen during ASF inter-season differs from that undertaken during the competitive period. Therefore, it remains unclear to what extend the inter-seasonal training, which implies more balanced dynamic and static exercises for all team players over a longer period compared to the competitive season could influence the RV structure. Moreover, given the complexity of the RV geometry, assessment of RV physiological adaptations in athletes is three-dimensional (3D) echocardiography preferable [11].
The present study aimed to describe the RV response to the ASF inter-seasonal team mixed training. Since the assessment of RV regional changes is important for discerning pathological and physiological remodeling [12,13], we used an in-house technique to obtain and assess the global and regional RV volume distribution using 3D echocardiography [14].

2. Materials and Methods

2.1. Study Design

We conducted a prospective cohort study to analyze the cardiac remodeling among competitive male ASF players. Eligibility criteria for this study included: (1) to be a member of the University of Montreal (Québec, Canada) ASF team “Les Carabins”, (2) to be able to participate in both visits and (3) willingness to participate in our study. An upcoming first season of football at the University of Montreal was not an exclusion criterion in our study since all the players were either transferred from another university team or engaged in competitive football teams before starting their university studies. The field position of each athlete (linemen or non-linemen) was noted as previously described [15]. Cardiac structure and function were assessed in players using echocardiography at two different visits, immediately before and at the end of the inter-seasonal training program. The supervised training program is detailed in the Supplementary Materials.
At the initial visit, the following data were collected: age, ethnicity, number of football seasons played at the university level, and height. Weight, body fat percentage, heart rate, blood pressure, and personal medical history (past and recent) were collected at both visits. Resting heart rate and blood pressure were measured after 10 min of quiet rest in a supine position. Blood pressure was averaged on duplicate successive measurements assessed using an automated monitor (OMRON Healthcare, Hoofddorp, The Netherlands) with an appropriate-sized arm cuff. Body mass index (BMI) was calculated as follows: (weight (kg)/height (m)2). The body surface area (BSA) was calculated with the Mosteller formula [16]. Body fat percentage was measured using a tetrapolar bioelectrical impedance analysis (Tanita Body Composition Analyzer BF-350, Tanita Corporation, US). Participants were required to abstain from exercise for at least 24 h before data collection time points.

2.2. Echocardiographic Acquisitions and Image Processing

The echocardiographic functional and morphological assessment was carried out according to the current guidelines [17] using a commercially available echocardiographic system EPIQ 7 equipped with an X5-1 xMATRIX-array transducer (Philips Healthcare, Eindhoven, the Netherlands). Participants were scanned at the pre-inter-seasonal medical assessment and within one week of completing the inter-seasonal training program. Cardiac 3D volume acquisitions were performed during end-expiratory apnea (4 to 6 cardiac cycles) in two separate sequences for the LV and RV. All data were stored digitally on a computer system. Offline data analysis was processed, semi-automatically by a single operator blinded to study time points, using commercially available clinically validated software (4D RV-Function and 4D LV-Function, TOMTEC-Arena TTA2, TOMTEC Imaging Systems GMBH, Unterschleißheim, Germany), from which left and right ventricular volumes and RV free wall global longitudinal strain were obtained. RV 3D volume segmentation sequences corresponded to a full cardiac cycle and resulted in a mesh for each time step consisting of 938 nodes and 1872 triangles of the endocardium, and the coordinates of each node were exported for our in-house regional analysis. Two-dimensional linear dimensions for both ventricles and atria were measured manually following the recommendations [17]. To assess the intra-and inter-observer reproducibility, quantifications were blindly repeated in 10 randomly selected players by the same operator who originally quantified the whole dataset and a second independent operator.

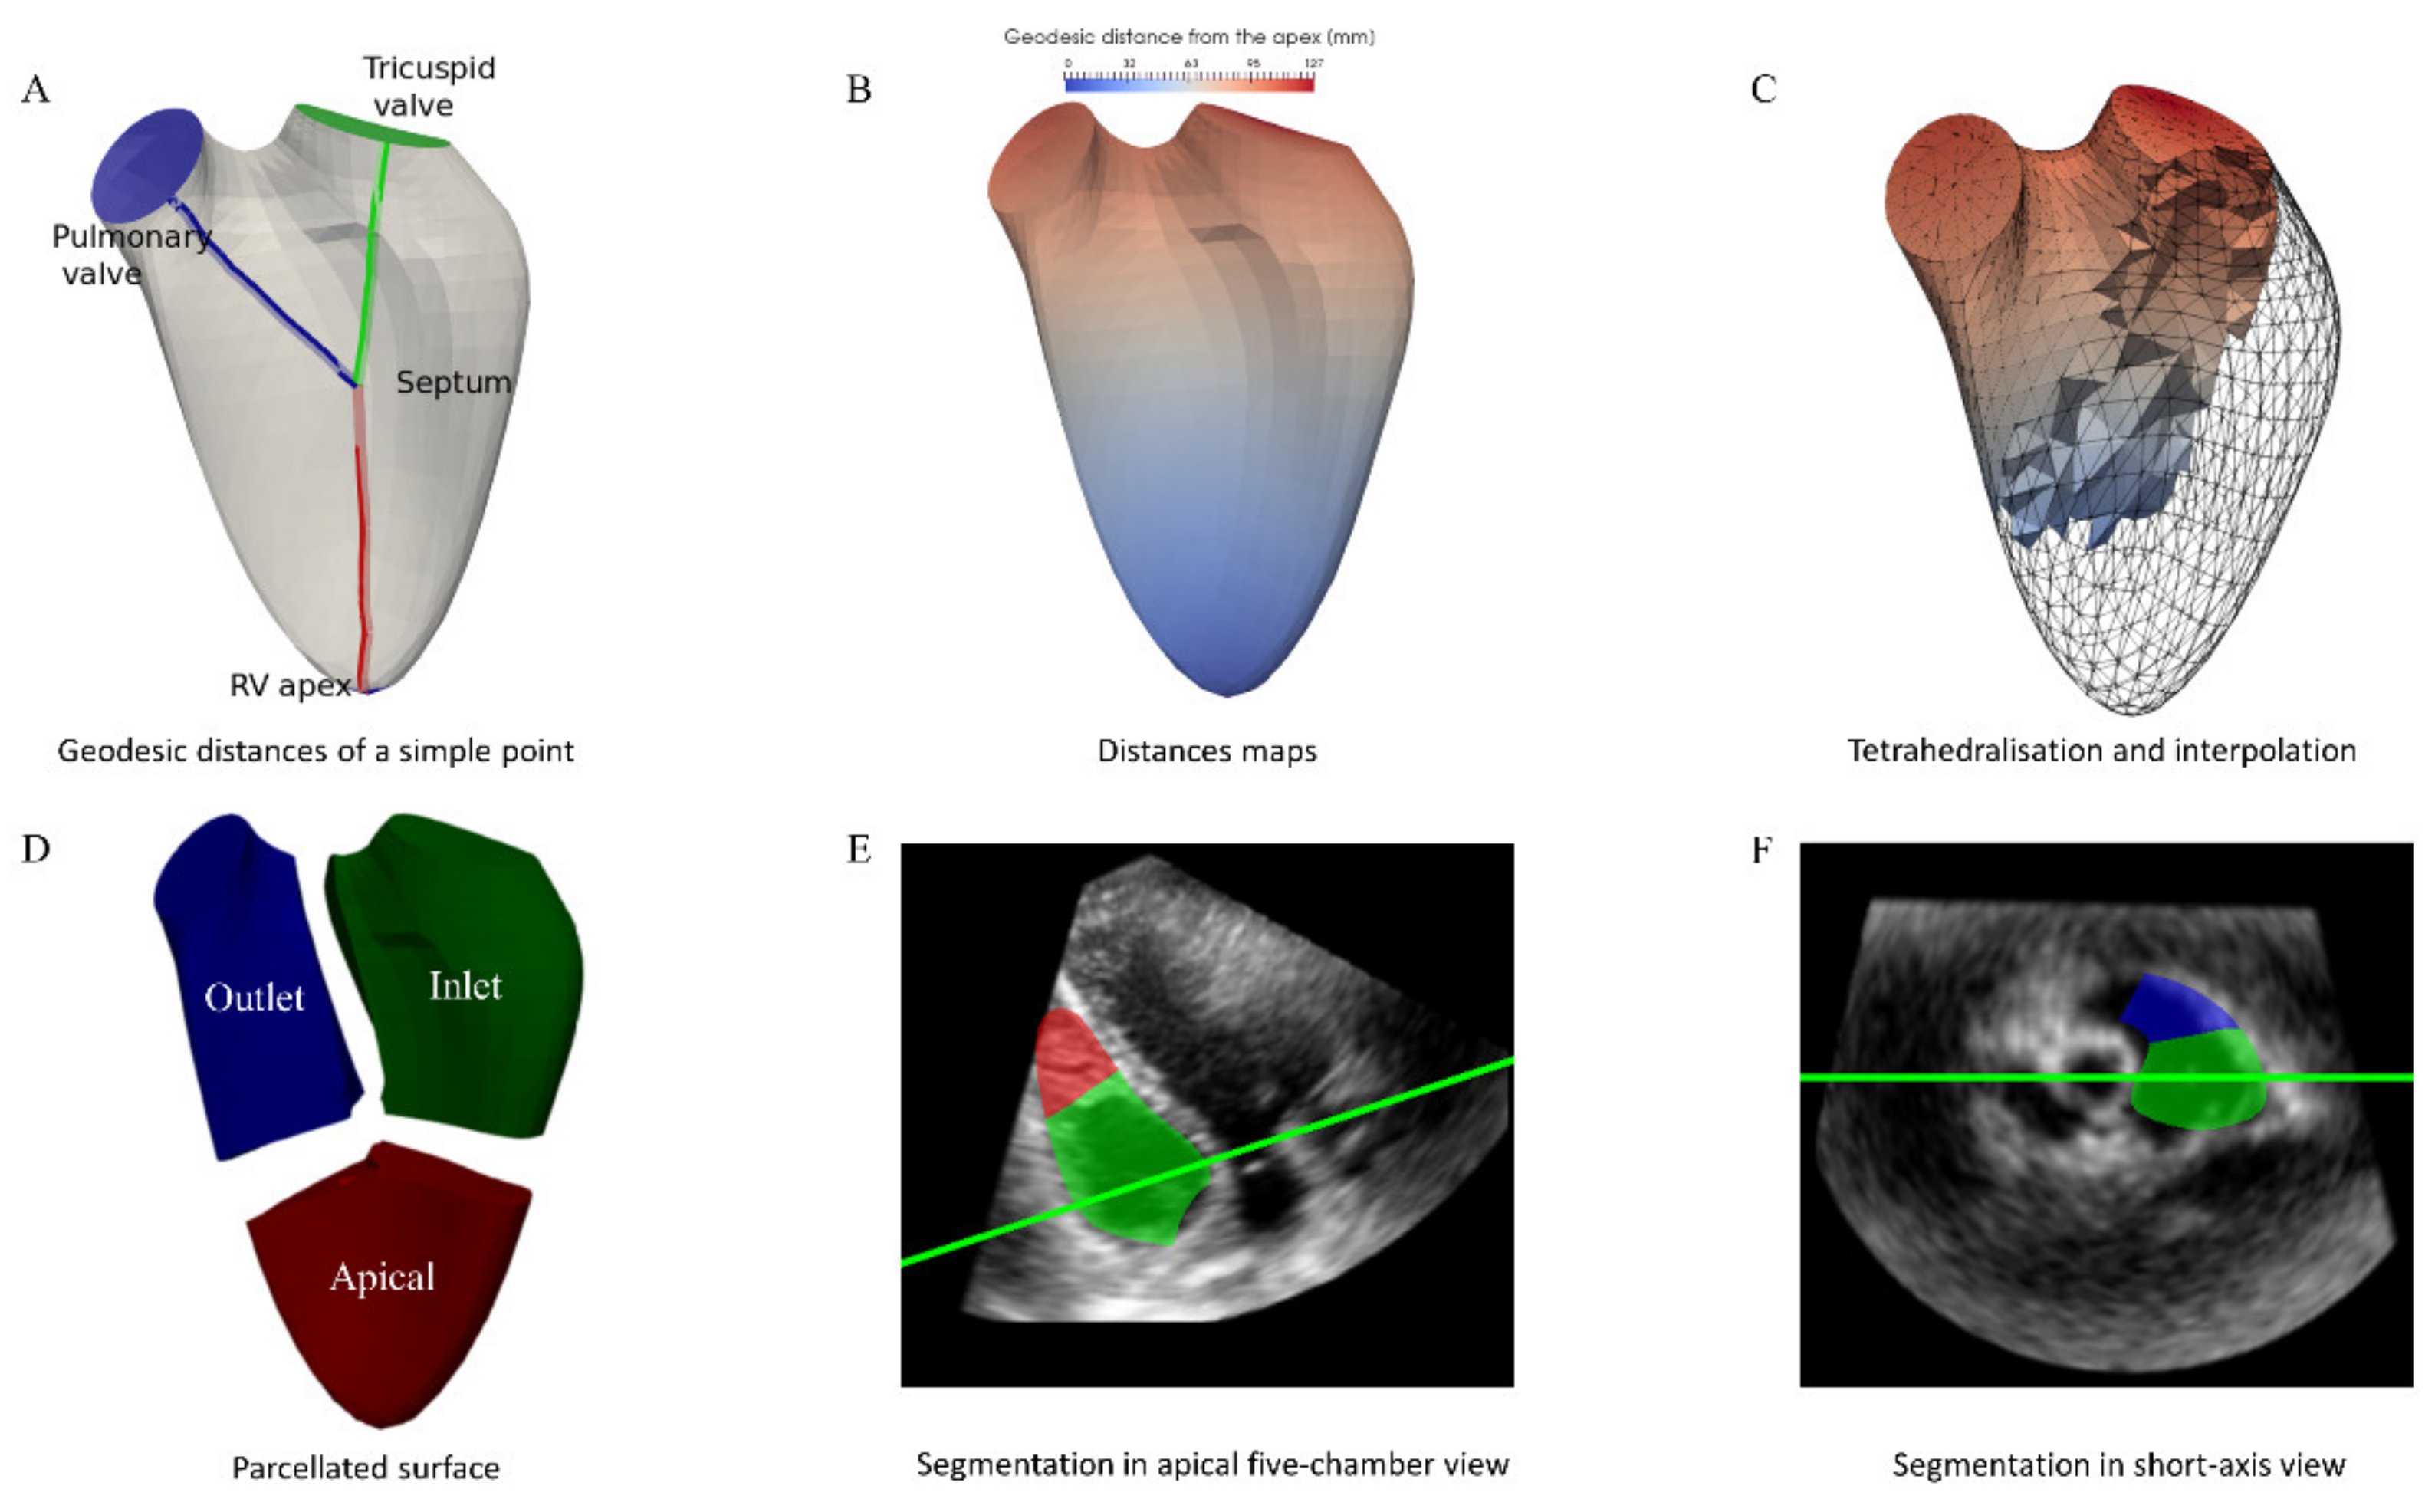
2.3. Parcellation of the Right Ventricle

We used a custom-developed method that parcellates the exported RV volumes in three parts: apical, inlet, and outlet. This parcellation is first computed for the endocardium using the geodesic distances from each surface point to the apex, tricuspid valve, and pulmonary valve. These anatomical landmarks define respectively the apical, inlet, and outlet regions, and each point of the mesh is assigned to the region whose representative landmark is the closest. Afterward, the partition is extended from the endocardium towards the blood cavity using the Laplace interpolation, which mimics the physics of heat diffusion. The process is summarized in Figure 1. This parcellation is initially computed at end-diastole and then tracked during the cardiac cycle to obtain a partition at end-systole. Regional ejection fractions are derived from end-diastolic and end-systolic regional volumes. Our team has described the technical aspects of the RV volumetric partition in previous work [14].

2.4. Statistical Analysis

Statistical analysis was performed in Python 3.6 (Anaconda Inc, Austin, TX, USA), with packages statsmodels (v0.10.0) and scipy (v1.2.1). Categorical variables are presented as proportions and continuous variables as mean ± standard deviation. The normality of distribution was verified using the Shapiro-Wilk test. Paired data were compared using Student’s paired t-test or McNemar’s exact test, while unpaired data were compared using the Student’s independent sample t-test or Fisher’s exact test. Multiple hypothesis testing was corrected using the Holm-Sidak procedure. A mixed-effect linear model with a random effect controlling inter-individual variability was used to predict the relationship between pre-/post-season, field position, and the interaction between the temporal variable and field position (introduced as fixed effects in the model) and the imaging parameters (the dependent variable in the model). A multivariate stepwise analysis model was used to examine variables associated with RV dilatation. The mixed linear model analysis and the multivariate stepwise analysis are detailed in the Supplementary Materials. The intra-and inter-observer reproducibility of the RV volumetric segmentation of the 3D-echocardiographic images processed using TOMTEC was assessed via the mean absolute and percent error. Statistical significance was defined as p < 0.05.

3. Results

Of the 72 athletes who consented to the study, 59 athletes (20 linemen and 39 non-linemen) completed the full inter-seasonal program and thus were analyzed at both study time points. A full 3D echo analysis was not feasible in five linemen athletes due to insufficient image quality (insufficient echogenicity for four athletes, and respiratory artifacts for the other one), thus 3D echo data are representative of 54 athletes.

3.1. Clinical Data

At the pre-training assessment, linemen had significantly higher weight, BMI, and body fat percentage than non-linemen (Table 1). At the end of the inter-seasonal training program, linemen had a significant reduction in weight (Δ = −4.5 ± 4.6 kg) and BMI (Δ = −1 ± 1.3 kg/m2), while non-linemen did not experience any significant changes in those parameters (Table 1). Similarly, systolic and diastolic blood pressure (SBP, DBP) at pre-training were significantly higher in linemen than in non-linemen. However, at post-training, only linemen had a significant reduction in SBP while non-linemen increased DBP without significantly changing SBP (Table 1). None of the athletes reported a personal history of hypertension, chronic treatment, or illicit drug use.

3.2. Impact of Inter-Seasonal Training on Cardiac Morphology and Function

Table 2 shows the evolution of standard 2D and 3D RV morphological and functional indices assessed over the inter-season and compared between non-linemen and linemen. RV end-diastolic volume (EDV), RV end-systolic volume (ESV), and RV linear diameters were larger in linemen at both time points. After indexation to BSA, RV volumes and dimensions appeared similar between groups, except for longitudinal RV diameter that was larger in non-linemen. RV EDV significantly increased after training in both groups, whereas RV ESV remained unchanged. Similarly, the RV linear diameters tended to increase after training in both groups, except for the outflow tract measured in parasternal long-axis view that remained stable. There were no changes in RV wall thickness. The mixed-effect linear model did not find evidence for different RV 2D and 3D morphological remodeling patterns between linemen and non-linemen, except for the RV EDV index, which increased more in linemen (Supplementary Table S1). RV functional parameters were mostly comparable between groups (Table 2). The mixed-effect linear model (Supplementary Table S1) showed that only the tricuspid annular plane systolic excursion (TAPSE) had a weakly statistically significant different behavior between groups during the pre-season: it tended to decrease for linemen and to increase for non-linemen. Right atrial (RA) volume increased for both linemen and non-linemen (Table 2), but the volume increment was greater in linemen (Supplementary Table S1).
Among factors that might influence RV dilatation during the inter-seasonal training in the ASF cohort, intra-seasonal LV mass percentage increment was the only independent predictor for RV dilatation (aOR = 1.13, 95% CI = 1.02−1.25, p = 0.02) (Supplementary Table S2). Seasonal statistically significant remodeling was also observed for the LV end-diastolic volume, LV mass, and left atrial volume with no effect of the field position (Supplementary Tables S3 and S4). Ventricular and atrial volumes changes remained balanced between the right-sided and left-sided heart (Supplementary Table S3).

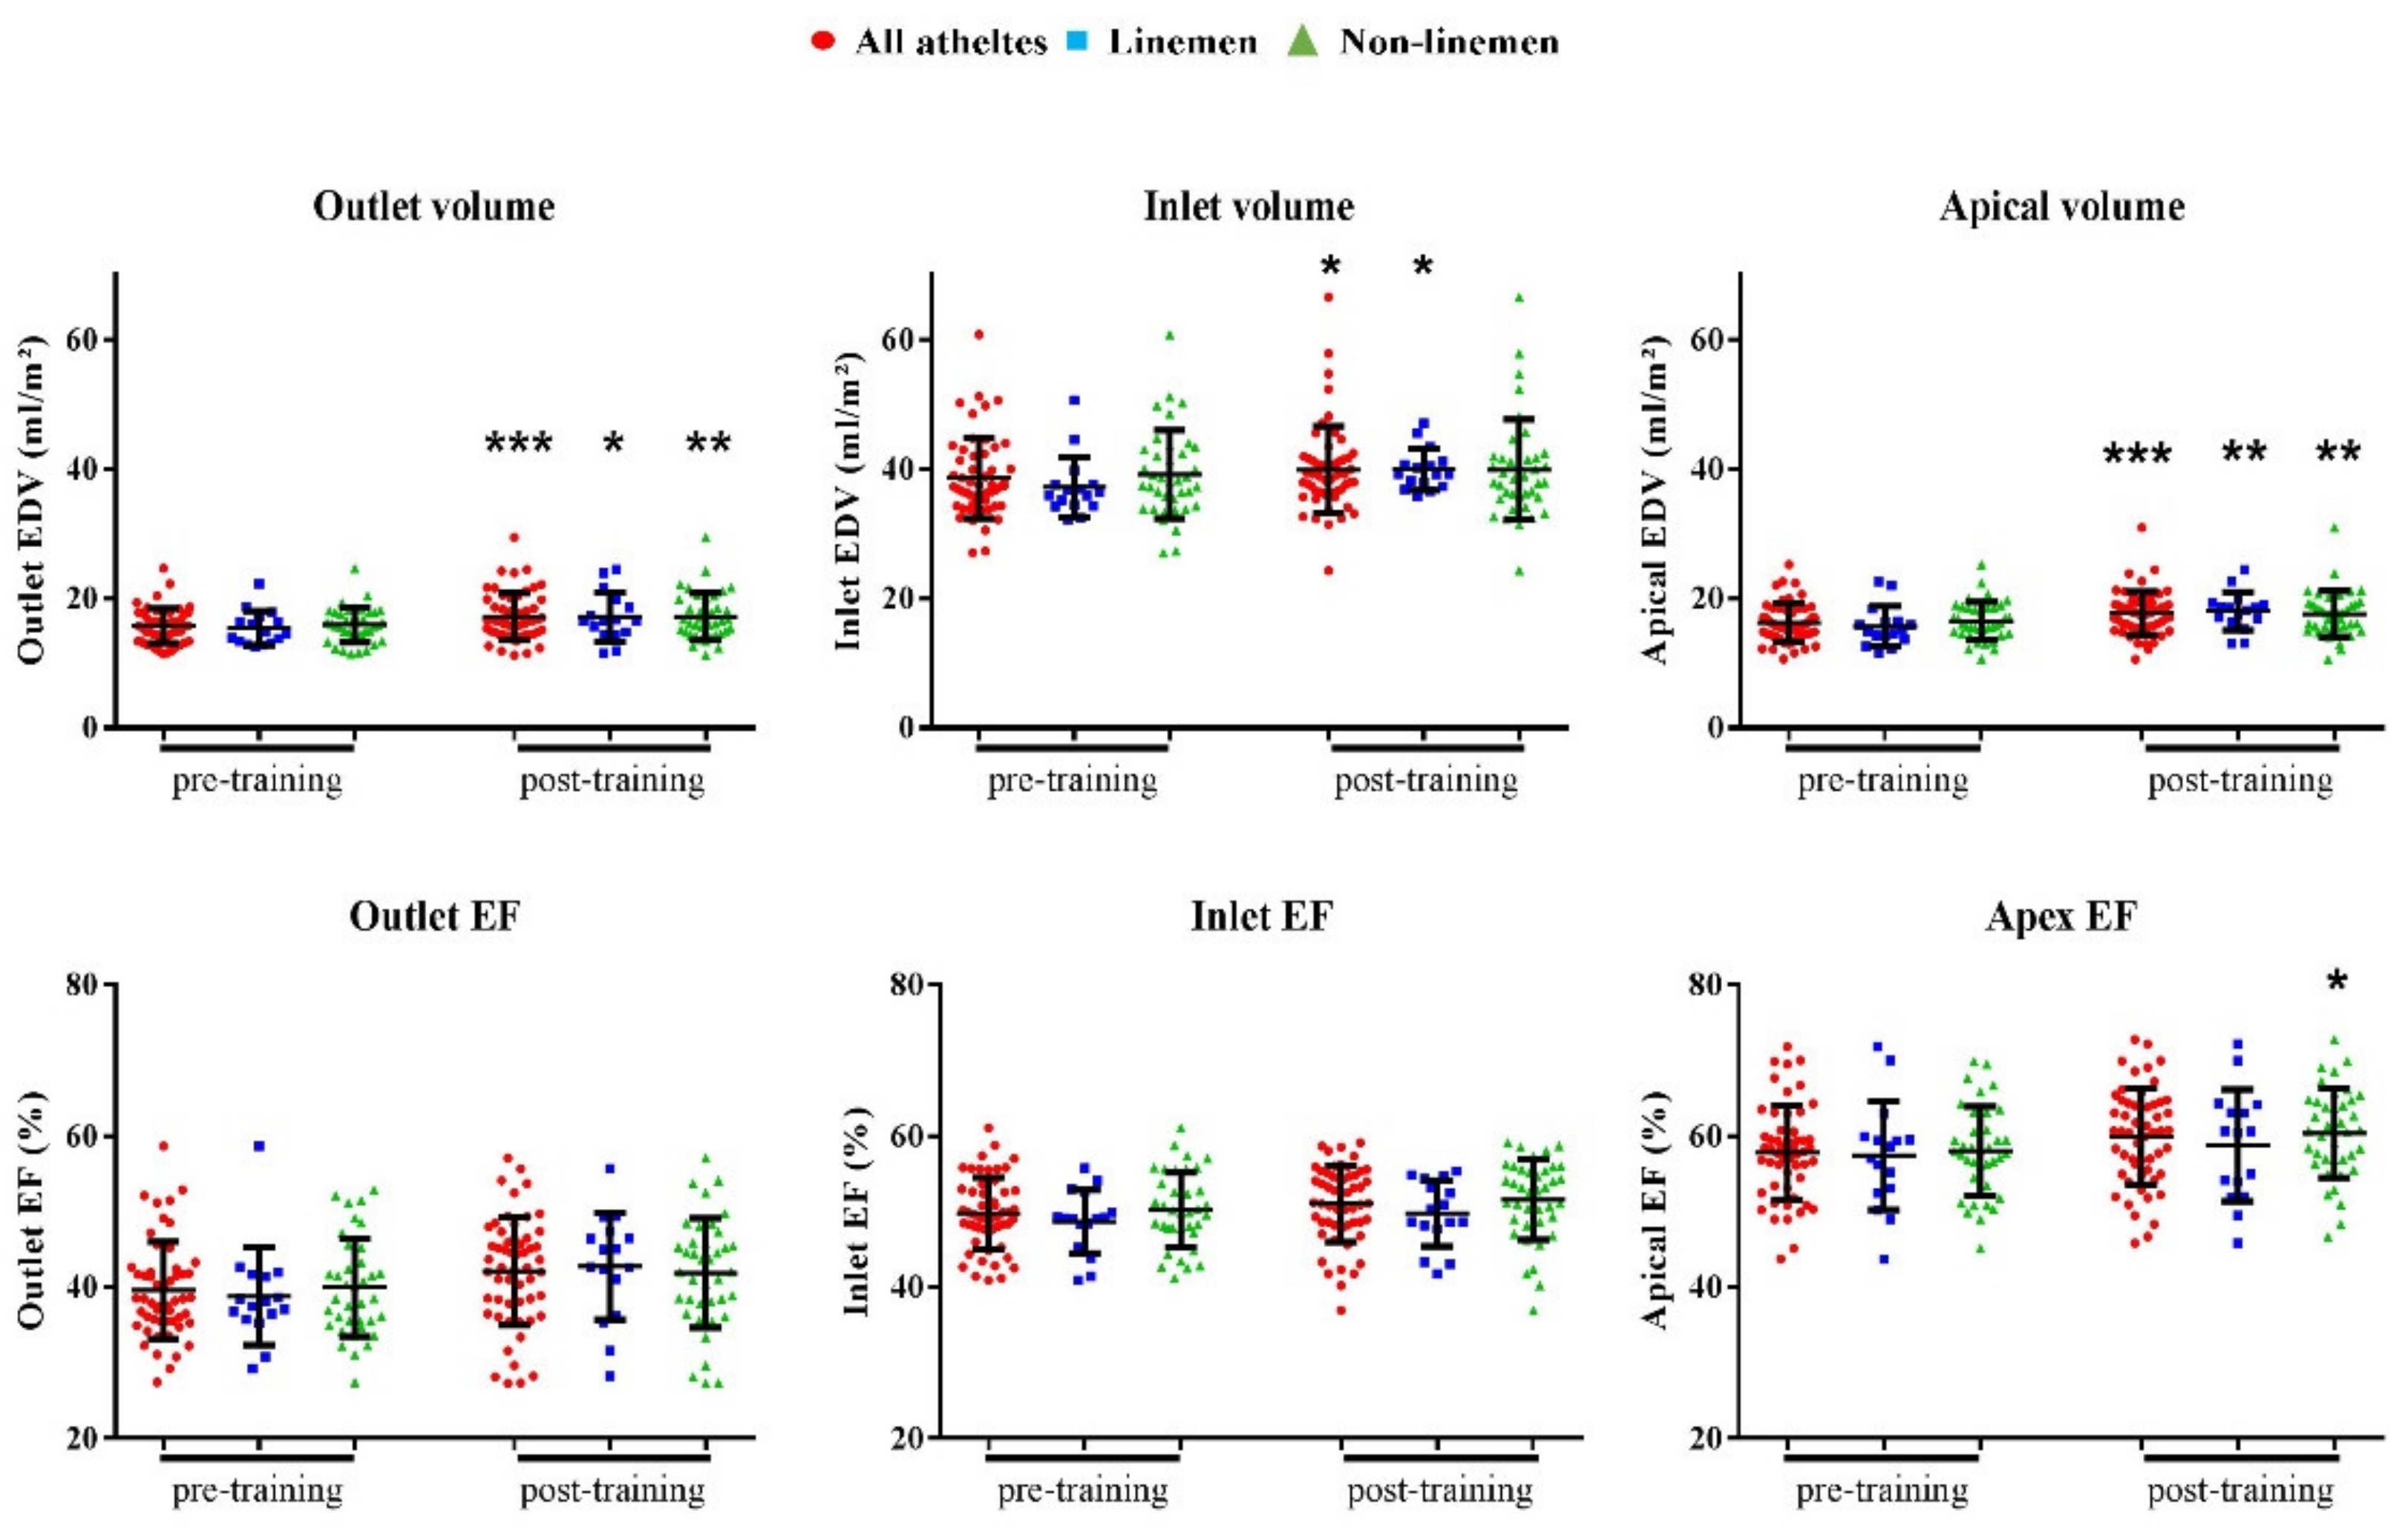
3.3. Assessment of the Regional RV Changes Using 3D Parcellation

At pre-training, the 3D partition method allocated a higher EDV to the RV inlet compared to the other regions (38.6 ± 6.3 mL/m2 vs. 16.2 ± 3 mL/m2 for the apex and 15.8 ± 2.7 mL/m2 for the outlet, p < 0.0001). The apical ejection fraction was higher compared to the inlet and outlet ejections fractions (58.6 ± 8.4% vs. 50.7 ± 8.3% for the inlet and 40.7 ± 10.4% for the outlet, p < 0.0001). Inter-seasonal RV dilatation was present in all three segments (Figure 2). A larger percent dilatation was observed in the apical and outlet regions (Figure 2). The mixed-effect linear model analysis did not show significant differences in RV regional end-diastolic volumes nor ejection fractions evolution over time between linemen and non-linemen (Supplementary Table S1).
Table 3 shows the reproducibility index for intra- and inter-observer variability of the RV volumetric global and regional 3D measurements. The RV global EDV and regional inlet and apical EDV measurements were reproducible (3% to 12%), whereas the outlet EDV had higher variability. The RV ESV measurement reproducibility was lower than EDV, which affected the regional ESV and ejection fraction assessment.

4. Discussion

Using 3D echocardiography with an automated method to volumetrically parcellate the RV, we were able to show for the first time that ASF inter-seasonal training was associated with physiological RV enlargement with predominant changes occurring in the apical and outlet regions, independently of the field position. The RV remodeling was associated with LV hypertrophy.
A proportionate biventricular dilatation with preserved function has been commonly associated with chronic exercise in endurance and mixed-trained athletes [11,18,19,20]. Although strength athletes have been less studied, longitudinal observations suggested that high-intensity strength training could impact the right ventricular structure [21]. ASF, unlike most of the other team sports, implies a heterogeneous combination of static and dynamic exercises that vary according to the player field position (linemen/non-linemen) and to the training timeframe (inter-season physical preparation/competitive season). The dichotomy between linemen and non-linemen players is essentially marked during the competitive season, during which ASF players at the linemen position engage almost exclusively in intense static activity, whereas the non-linemen counterparts experience much higher loads of dynamic exercise. Therefore, studies that have previously analyzed the longitudinal cardiac adaptations to the ASF competitive season, have documented field position-specific LV remodeling [1,2,4]. In those studies, linemen players exhibit a higher prevalence of LV concentric hypertrophy close to what was reported in strength athletes [22], whereas non-linemen players are more likely to develop an eccentric LV hypertrophic pattern. To date, only one longitudinal study assessed the RV response to the ASF season using 2D-echocardiography in a US football team. The authors concluded the absence of RV exercise-induced remodeling among ASF players [10]. In the present study, we described in a Canadian ASF team the longitudinal cardiac changes that occurred during their inter-seasonal training, which involved all athletes combined static and endurance exercises. Linemen athletes experienced an increased dynamic component of exercise compared to their static activity during the competitive season, which may have contributed to weight loss and lower systolic blood pressure observed at the end of the inter-season. Conversely, non-linemen athletes who were asked to perform more strength work tended to increase arterial blood pressure, which is regularly associated with ASF participation [6]. However, based on our echocardiographic assessment, the RV global and regional adaptations appeared physiological and similar between linemen and non-linemen players. We used 3D technics to accurately assess the RV and to overcome the limitations of conventional 2D echocardiographic views [17]. 3D measurements confirmed a small but highly significant increment in RV EDV, while the RV linear dimensions could underestimate the exercise-induced RV response. The RV changes were part of a balanced biventricular and biatrial cardiac response to chronic exercise.
We observed minor group differences in cardiac morphological and functional parameters. The increase in RV EDV seemed to be greater in linemen but only when indexed to BSA. This could be explained in large part because of significant weight loss in linemen only. The only significant morphological field-specific difference in both indexed and non-indexed values was the intra-seasonal change in the RA volume, which augmented more in linemen players. A more pronounced dilatation of the RA cavity compared to the other cardiac chambers has been previously reported in athletes as a compensatory mechanism supporting the predominant involvement of the right side in the exercise-induced cardiac adaptation [23]. In the absence of group differences in RV systolic and diastolic functions, and with comparable left to right atrial and ventricular volume ratios, we do not have a clear explanation to justify the greater increase in the inter-seasonal RA volume among linemen. We hypothesize that linemen having much higher BSA and non-indexed cardiac volumes implied a larger blood volume increase during exercise, which may result in a larger RA increment. Regarding functional parameters, the TAPSE tended to decrease in linemen and increase in non-linemen. We do not consider it of big clinical significance, given the P-value and the fact that other RV regional and global systolic functional indices such as peak S’, RV ejection fraction, and RV longitudinal free wall strain, which are also dependent on the RV shape, did not differ between groups. In the paper of Baggish et al. in 2008 [10], the authors described no seasonal variations in RV fractional area change and basal free wall tissue Doppler indices, without reporting TAPSE measurements.
Our 3D regional volumetric analysis showed that inter-seasonal training led to a more pronounced dilatation of the apex and outlet compared to the inlet, with preserved or augmented systolic ejection fractions. A more round-shape RV apex and improved apical strain were commonly reported among endurance and mixed-trained athletes [8,23,24]. Considering the RV outlet, it was previously demonstrated that this region could be exposed to high wall stress during exercise [25] and that the occurrence of ventricular tachycardia of outflow tract origin could be part of the physiological remodeling process in athletes [26]. Nevertheless, the RV outlet enlargement was inconstantly associated with exercise training [8,24,27,28]. Even when using 3D echocardiography–derived cross-sectional planes, the endocardial border tracings to outline the RV outflow tract and the pulmonary valve position remain challenging, as shown by our reproducibility analysis. In this paper, we applied a new geometrical approach to segment the RV volumes into its three distinct anatomical parts that allowed us to describe the RV regional structural and functional patterns in response to physiological volume-overload induced by chronic mixed exercise. Although our 3D RV segmentation does not correspond to the exact anatomical definition of the RV three sub-units, this method is based on a mathematical model to guarantee the stability of the segmentation in the absence of anatomical landmarks in the mid-ventricle. This fully automated tool for RV regional 3D quantification uses information that can be easily exported using commercial software with no extra manual processing. Our team has shown that this technique is sensitive to detect synthetic regional remodeling [14], and it could be easily applied to clinical datasets to explore geometrical and functional changes that might occur in physiological states and pathological situations. Distinguish RV adaptive remodeling induced by physical exercise from pathological changes such as those observed in arrhythmogenic right ventricular cardiomyopathy (ARVC) which is responsible for juvenile sudden death, is essential in clinical practice when dealing with athletes. A comprehensive evaluation of the athlete’s heart requires an examination of RV segments that can be differently affected by physiological stress induced by chronic exercise. In parallel, the occurrence of regional RV structural modifications could reveal the early signs of ARCV that are challenging to diagnose by currently available echocardiographic tools [12,13]. In future work it would be interesting to study in ARCV patients and athletes the accuracy of the volumetric parcellation method to better differentiate using echocardiography the RV adaptive from maladaptive remodeling phenotypes.
We acknowledge the study cohort was limited. However, we believed that the longitudinal evaluation strengthened our analysis despite the limited number of ASF participants. Another limitation is the absence of a comprehensive assessment of the arterial vascular function to study if the arterial blood pressure response could be related to a divergent vascular remodeling between linemen and non-linemen athletes. More, the 3D RV volumetric parcellation analysis showed significant inter-observer variability, which limits its current applicability to large clinical studies. Due to the instability of the tracing procedure, the variability of the end-systolic measurements, and thus ejection fraction calculations, were higher than end-diastolic quantifications. Given a lower image quality near the outflow, inlet and apical volumes were more reproducible than the outlet. The method is fully automatic, and therefore we expect that this variability will be reduced with technical improvements on automatic RV segmentation and noise reduction.

5. Conclusions

RV dilatation with preserved function is part of the physiological response to prolonged mixed exercise in both linemen and non-linemen athletes when assessed during their inter-seasonal training program. The RV adaptation was global with prominent contributions of the apical and outlet segments. Although the 3D parcellation technique might provide additional information on the physiological RV remodeling, further studies are needed to assess the clinical feasibility of this method in larger cohorts.

Supplementary Materials

The following are available online at https://www.mdpi.com/article/10.3390/app11083357/s1. Supplementary Methods: The inter-seasonal strength and conditioning program, statistical analysis. Supplementary Tables: Table S1: Mixed-effect model results for assessing differences in right ventricular and atrial remodeling due to the field position, Table S2: Univariate and multivariate analysis for prediction of intra-seasonal right ventricular dilatation in the entire cohort, Table S3: Comparison of pre-training (pre-T) and post-training (post-T) left ventricular and atrial parameters, Table S4: Mixed-effect model results for assessing differences in left ventricular and atrial remodeling due to the field position.

Author Contributions

Conceptualization, A.H., G.B., B.B., E.S., F.T.; data curation, A.H., P.G., E.S., F.T.; formal analysis, A.H., G.B., D.L., P.G., E.S., F.T.; funding acquisition, B.B., F.T.; investigation, A.H., G.B., P.G., E.S., F.T.; methodology, A.H., G.B., P.G., M.A.G.B., P.M., H.N., B.B., E.S., F.T.; project administration, F.T.; resources, P.G., M.D.C., M.A.G.B., P.M., H.N., B.B., E.S., F.T.; software, G.B., H.L., M.D.C., M.A.G.B., B.B.; supervision, P.M., H.N., B.B., F.T.; validation, A.H., G.B., D.L., B.B., E.S., F.T.; visualization, A.H., G.B., D.L., P.G., H.L., M.D.C., M.A.G.B., P.M., H.N., B.B., E.S., F.T.; writing—original draft, A.H., G.B.; writing—review and editing, A.H., G.B., D.L., P.G., H.L., M.D.C., M.A.G.B., P.M., H.N., B.B., E.S., F.T. All authors have read and agreed to the published version of the manuscript.

Funding

F.T. is supported by a grant from the Fonds de Recherche du Québec—Santé (FRQS). The methodological part of this study was partly supported by the Spanish Ministry of Economy and Competitiveness (Maria de Maeztu Units of Excellence Programme—MDM-2015-0502) and the European Union under the Horizon 2020 Programme for Research, Innovation (grant agreement No. 642676 CardioFunXion).

Institutional Review Board Statement

All procedures achieved in this study were performed in accordance with the ethical standards as laid down in the 1964 Declaration of Helsinki and its later amendments or comparable ethical standards. The study was approved by the research ethics committee of the Research Center of the CHUM (CRCHUM) (IRB#13.253).

Informed Consent Statement

Informed consent was obtained from all subjects involved in the study.

Data Availability Statement

The authors confirm that the data supporting the findings of this study are available within the article and its Supplementary Materials.

Acknowledgments

The authors thank the University of Montreal Hospital Research Center and the Montreal Carabins USports team.

Conflicts of Interest

The authors declare no conflict of interest.

References

  1. Weiner, R.B.; Wang, F.; Isaacs, S.K.; Malhotra, R.; Berkstresser, B.; Kim, J.H.; Hutter, A.M.; Picard, M.H.; Wang, T.J.; Baggish, A.L. Blood Pressure and Left Ventricular Hypertrophy during American-Style Football Participation. Circulation 2013, 128, 524–531. [Google Scholar] [CrossRef] [Green Version]
  2. Lin, J.; Wang, F.; Weiner, R.B.; DeLuca, J.R.; Wasfy, M.M.; Berkstresser, B.; Lewis, G.D.; Hutter, A.M.; Picard, M.H.; Baggish, A.L. Blood Pressure and LV Remodeling Among American-Style Football Players. JACC Cardiovasc. Imaging 2016, 9, 1367–1376. [Google Scholar] [CrossRef]
  3. Kim, J.H.; Hollowed, C.; Irwin-Weyant, M.; Patel, K.; Hosny, K.; Aida, H.; Gowani, Z.; Sher, S.; Gleason, P.; Shoop, J.L.; et al. Sleep-Disordered Breathing and Cardiovascular Correlates in College Football Players. Am. J. Cardiol. 2017, 120, 1410–1415. [Google Scholar] [CrossRef]
  4. Kim, J.H.; Hollowed, C.; Patel, K.; Hosny, K.; Aida, H.; Gowani, Z.; Sher, S.; Shoop, J.L.; Galante, A.; Clark, C.; et al. Temporal Changes in Cardiovascular Remodeling Associated with Football Participation. Med. Sci. Sports Exerc. 2018, 50, 1892–1898. [Google Scholar] [CrossRef] [PubMed]
  5. Kim, J.H.; Hollowed, C.; Liu, C.; Al-Badri, A.; Alkhoder, A.; Dommisse, M.; Gowani, Z.; Miller, A.; Nguyen, P.; Prabakaran, G.; et al. Weight Gain, Hypertension, and the Emergence of a Maladaptive Cardiovascular Phenotype Among US Football Players. JAMA Cardiol. 2019, 4, 1221–1229. [Google Scholar] [CrossRef] [PubMed]
  6. Kim, J.H.; Zafonte, R.; Pascuale-Leon, A.; Nadler, L.M.; Weisskopf, M.; Speizer, F.E.; Taylor, H.A.; Baggish, A.L. American-Style Football and Cardiovascular Health. J. Am. Heart. Assoc. 2018, 7. [Google Scholar] [CrossRef] [PubMed] [Green Version]
  7. Zaidi, A.; Ghani, S.; Sharma, R.; Oxborough, D.; Panoulas, V.F.; Sheikh, N.; Gati, S.; Papadakis, M.; Sharma, S. Physiological Right Ventricular Adaptation in Elite Athletes of African and Afro-Caribbean Origin. Circulation 2013, 127, 1783–1792. [Google Scholar] [CrossRef] [Green Version]
  8. D’Ascenzi, F.; Pisicchio, C.; Caselli, S.; Di Paolo, F.M.; Spataro, A.; Pelliccia, A. RV Remodeling in Olympic Athletes. JACC Cardiovasc. Imaging 2017, 10, 385–393. [Google Scholar] [CrossRef]
  9. D’Andrea, A.; Riegler, L.; Golia, E.; Cocchia, R.; Scarafile, R.; Salerno, G.; Pezzullo, E.; Nunziata, L.; Citro, R.; Cuomo, S.; et al. Range of Right Heart Measurements in Top-Level Athletes: The Training Impact. Int. J. Cardiol. 2013, 164, 48–57. [Google Scholar] [CrossRef] [PubMed]
  10. Baggish, A.L.; Wang, F.; Weiner, R.B.; Elinoff, J.M.; Tournoux, F.; Boland, A.; Picard, M.H.; Hutter, A.M.; Wood, M.J. Training-Specific Changes in Cardiac Structure and Function: A Prospective and Longitudinal Assessment of Competitive Athletes. J. Appl. Physiol. 2008, 104, 1121–1128. [Google Scholar] [CrossRef] [PubMed]
  11. D’Andrea, A.; Riegler, L.; Morra, S.; Scarafile, R.; Salerno, G.; Cocchia, R.; Golia, E.; Martone, F.; Di Salvo, G.; Limongelli, G.; et al. Right Ventricular Morphology and Function in Top-Level Athletes: A Three-Dimensional Echocardiographic Study. J. Am. Soc. Echocardiogr. 2012, 25, 1268–1276. [Google Scholar] [CrossRef] [PubMed]
  12. D’Ascenzi, F.; Solari, M.; Corrado, D.; Zorzi, A.; Mondillo, S. Diagnostic Differentiation Between Arrhythmogenic Cardiomyopathy and Athlete’s Heart by Using Imaging. JACC Cardiovasc. Imaging 2018, 11, 1327–1339. [Google Scholar] [CrossRef]
  13. Prior, D. Differentiating Athlete’s Heart from Cardiomyopathies—The Right Side. Heart Lung Circ. 2018, 27, 1063–1071. [Google Scholar] [CrossRef] [PubMed]
  14. Bernardino, G.; Hodzic, A.; Langet, H.; Legallois, D.; de Craene, M.; González Ballester, M.A.; Saloux, E.; Bijnens, B. Volumetric parcellation of the cardiac right ventricle for regional geometric and functional assessment. Med. Image Anal. 2021, in press. [Google Scholar] [CrossRef]
  15. Croft, L.B.; Belanger, A.; Miller, M.A.; Roberts, A.; Goldman, M.E. Comparison of National Football League Linemen versus Nonlinemen of Left Ventricular Mass and Left Atrial Size. Am. J. Cardiol. 2008, 102, 343–347. [Google Scholar] [CrossRef]
  16. Mosteller, R.D. Simplified Calculation of Body-Surface Area. N. Engl. J. Med. 1987, 317, 1098. [Google Scholar] [CrossRef] [PubMed]
  17. Lang, R.M.; Badano, L.P.; Mor-Avi, V.; Afilalo, J.; Armstrong, A.; Ernande, L.; Flachskampf, F.A.; Foster, E.; Goldstein, S.A.; Kuznetsova, T.; et al. Recommendations for Cardiac Chamber Quantification by Echocardiography in Adults: An Update from the American Society of Echocardiography and the European Association of Cardiovascular Imaging. J. Am. Soc. Echocardiogr. 2015, 28, 1–39.e14. [Google Scholar] [CrossRef] [Green Version]
  18. Utomi, V.; Oxborough, D.; Whyte, G.P.; Somauroo, J.; Sharma, S.; Shave, R.; Atkinson, G.; George, K. Systematic Review and Meta-Analysis of Training Mode, Imaging Modality and Body Size Influences on the Morphology and Function of the Male Athlete’s Heart. Heart 2013, 99, 1727–1733. [Google Scholar] [CrossRef]
  19. Bohm, P.; Schneider, G.; Linneweber, L.; Rentzsch, A.; Krämer, N.; Abdul-Khaliq, H.; Kindermann, W.; Meyer, T.; Scharhag, J. Right and Left Ventricular Function and Mass in Male Elite Master Athletes: A Controlled Contrast-Enhanced Cardiovascular Magnetic Resonance Study. Circulation 2016, 133, 1927–1935. [Google Scholar] [CrossRef]
  20. D’Ascenzi, F.; Anselmi, F.; Piu, P.; Fiorentini, C.; Carbone, S.F.; Volterrani, L.; Focardi, M.; Bonifazi, M.; Mondillo, S. Cardiac Magnetic Resonance Normal Reference Values of Biventricular Size and Function in Male Athlete’s Heart. JACC Cardiovasc. Imaging 2019, 12, 1755–1765. [Google Scholar] [CrossRef]
  21. Spence, A.L.; Carter, H.H.; Murray, C.P.; Oxborough, D.; Naylor, L.H.; George, K.P.; Green, D.J. Magnetic Resonance Imaging-Derived Right Ventricular Adaptations to Endurance versus Resistance Training. Med. Sci. Sports Exerc. 2013, 45, 534–541. [Google Scholar] [CrossRef]
  22. Fagard, R.H. Athlete’s Heart: A Meta-Analysis of the Echocardiographic Experience. Int. J. Sports Med. 1996, 17 (Suppl. S3), S140–S144. [Google Scholar] [CrossRef] [PubMed]
  23. Sitges, M.; Merino, B.; Butakoff, C.; de la Garza, M.S.; Paré, C.; Montserrat, S.; Vidal, B.; Azqueta, M.; Sarquella, G.; Gutierrez, J.A.; et al. Characterizing the Spectrum of Right Ventricular Remodelling in Response to Chronic Training. Int. J. Cardiovasc. Imaging 2017, 33, 331–339. [Google Scholar] [CrossRef]
  24. D’Ascenzi, F.; Pelliccia, A.; Corrado, D.; Cameli, M.; Curci, V.; Alvino, F.; Natali, B.M.; Focardi, M.; Bonifazi, M.; Mondillo, S. Right Ventricular Remodelling Induced by Exercise Training in Competitive Athletes. Eur. Heart J. Cardiovasc. Imaging 2016, 17, 301–307. [Google Scholar] [CrossRef]
  25. Gülan, U.; Saguner, A.M.; Akdis, D.; Gotschy, A.; Tanner, F.C.; Kozerke, S.; Manka, R.; Brunckhorst, C.; Holzner, M.; Duru, F. Hemodynamic Changes in the Right Ventricle Induced by Variations of Cardiac Output: A Possible Mechanism for Arrhythmia Occurrence in the Outflow Tract. Sci. Rep. 2019, 9, 100. [Google Scholar] [CrossRef] [PubMed]
  26. La Gerche, A.; Robberecht, C.; Kuiperi, C.; Nuyens, D.; Willems, R.; de Ravel, T.; Matthijs, G.; Heidbüchel, H. Lower than Expected Desmosomal Gene Mutation Prevalence in Endurance Athletes with Complex Ventricular Arrhythmias of Right Ventricular Origin. Heart 2010, 96, 1268–1274. [Google Scholar] [CrossRef]
  27. Bernardino, G.; Sanz de la Garza, M.; Domenech-Ximenos, B.; Prat-Gonzàlez, S.; Perea, R.J.; Blanco, I.; Burgos, F.; Sepulveda-Martinez, A.; Rodriguez-Lopez, M.; Crispi, F.; et al. Three-Dimensional Regional Bi-Ventricular Shape Remodeling Is Associated with Exercise Capacity in Endurance Athletes. Eur. J. Appl. Physiol. 2020. [Google Scholar] [CrossRef] [PubMed]
  28. Lewicka-Potocka, Z.; Dąbrowska-Kugacka, A.; Lewicka, E.; Kaleta, A.M.; Dorniak, K.; Daniłowicz-Szymanowicz, L.; Fijałkowski, M.; Nabiałek-Trojanowska, I.; Ratkowski, W.; Potocki, W.; et al. The “Athlete’s Heart” Features in Amateur Male Marathon Runners. Cardiol. J. 2020. [Google Scholar] [CrossRef] [PubMed] [Green Version]
Figure 1. Illustration of different steps to generate the right ventricular volumetric partition. (A) For each point, the geodesic distances to the apex, tricuspid, and pulmonary valves are computed. (B) The geodesic distances to each of the landmarks define a scalar map over the surface mesh. (C) This distance map is extended from the surface to the cavity by tetrahedralising the mesh, and the Laplace equation is used to interpolate values to the interior. (D) The right ventricle is split into the regions by assigning each point of the cavity to the closest landmark. (E,F) Visualization of the RV parcellation over slices of the original 3D images.
Applsci 11 03357 g001
Figure 2. Longitudinal 3D RV regional morphological and functional changes. Abbreviations: EDV: end-diastolic volume, EF: ejection fraction. * p < 0.05, ** p < 0.01, *** p < 0.001 of a paired t-test comparing the variable before and after training.
Applsci 11 03357 g002
Table 1. Comparison of pre-training (pre-T) and post-training (post-T) clinical data.
All Athletes (n = 59)Non-Linemen (n = 39)Linemen (n = 20)
Pre-TPost-TPre-TPost-TPre-TPost-T
Age, y21.9 ± 1.4 21.8 ± 1.4 22 ± 1.5
Caucasian40 (68%) 26 (67%) 14 (70%)
Afro-Caribbean19 (32%) 13 (33%) 6/ (30%)
Prior university ASF seasons1.6 ± 1.1 1.6 ± 1.1 1.7 ± 1.1
Height, cm183.6 ± 7.2 181.2 ± 6.1 188.3 ± 7.1
Weight, kg102.3 ± 22.6101 ± 20.488.7 ± 9.889.3 ± 9.7128.4 ± 16.9 †††123.9 ± 16 ***, †††
BMI, kg/m230.1 ± 5.529 ± 4.827.1 ± 327.2 ± 2.936.1 ± 4.1 †††34.8 ± 3.8 ***, †††
BSA, m22.28 ± 0.282.26 ± 0.252.1 ± 0.12.1 ± 0.12.6 ± 0.2 †††2.5 ± 0.2 ***, †††
Body fat, %19 ± 7.418.2 ± 6.615.3 ± 4.715.2 ± 426.2 ± 6.4 †††24.2 ± 6.7 †††
HR, beats/min58.9 ± 7.960.2 ± 8.157.8 ± 7.860.4 ± 8.4 *60.4 ± 8.259.7 ± 7.7
SBP, mmHg121.6 ± 10.6122.4 ± 9.4118.2 ± 8.8122.5 ±9.5128.2 ± 11.1 †††121.8 ± 9.5 *
DBP, mmHg67 ± 8.373.9 ± 8 ***64.5 ± 7.374.1 ± 7 ***72.2 ± 7.8 †††73.6 ± 9.8
Values are mean ± SD. Abbreviations: BSA: body surface area, BMI: body mass index, HR: heart rate, SBP: systolic blood pressure, DBP: diastolic blood pressure. * p < 0.05, *** p < 0.001 of a paired t-test comparing the variable between pre- and post-training in each group. p < 0.05, ††† p < 0.001 of an independent t-test comparing variable between non-linemen and linemen at each time point.
Table 2. Comparison of pre-training (pre-T) and post-training (post-T) right ventricular (RV) and atrial (RA) parameters.
VariableAll Athletes
(n = 59)
Non-Linemen
(n = 39)
Linemen
(n = 20, 15 for 3D Data)
Pre-TPost-TPre-TPost-TPre-TPost-T
RV Dimensions
3D-RV EDV, mL163.4 ± 31.4174.3 ± 33.7 ***155 ± 28.2164.7 ± 30 ***185.6 ± 29 ††197.7 ± 32 ***, ††
3D-RV EDVi, mL/m272.7 ±1 2.377.8 ± 12.7 ***73.4 ± 13.277.8 ± 13.6 ***71.4 ± 9.677.7 ± 10.6 ***
3D-RV ESV, mL80.1 ± 16.981.8 ± 19.275.4 ± 14.276.8 ± 17.193 ± 18.2 ††93.7 ± 19 ††
3D-RV ESVi, mL/m235.6 ± 6.336.4 ± 7.435.7 ± 6.536.2 ± 7.835.7 ± 6.136.9 ± 6.5
RV basal diameter, mm47.2 ± 4.948.2 ± 4.745.4 ± 4.146.3 ± 450.9 ± 4.1 †††52 ± 3.7 †††
RV basal diameter i, mm/m220.9 ± 2.421.4 ± 221.5 ± 221.9 ± 219.8 ± 2.720.5 ± 1.6
RV mid diameter, mm40 ± 4.641 ± 4.338.8 ± 439.6 ± 3.342.5 ± 4.8 43.7 ± 4.8 ††
RV mid diameter i, mm/m217.8 ± 2.418.3 ± 2.218.4 ± 218.8 ± 1.816.6 ± 2.817.3 ± 2.6
RVOT PLAX diameter, mm31.3 ± 4.831.2 ± 529.7 ± 1.929.5 ± 4.633.7 ± 4.4 33.9 ± 4.4
RVOT PLAX diameter i, mm/m213.7 ± 1.813.6 ± 1.814 ± 213.9 ± 1.913 ± 1.213.3 ± 1.6
RV longitudinal diameter, mm95.4 ± 7.397 ± 62 *93.8 ± 6.795.6 ± 6.2 *99.3 ± 7.1 ††100.5 ± 4.8 ††
RV longitudinal diameter i, mm/m242.9 ± 4.543.8 ± 4.2 *44.6 ± 3.745.3 ± 3.538.5 ± 3.5 ††39.9 ± 3.3 *, ††
RV wall thickness, mm2.7 ± 0.62.6 ± 0.62.5 ± 0.52.4 ± 0.63 ± 0.72.8 ± 0.6
RV Function
3D-RV global EF, %51 ± 453.2 ± 3.7 **51.2 ± 453.6 ± 3.5 **50.1 ± 3.852.3 ± 4.2
3D-RV FW strain, %−27.3 ± 3.6−27.7 ± 2.8−27.4 ± 3.6−28 ± 3−27.5 ± 3.3−27.1 ± 2.3
TDI RV lateral peak s’, cm/s13.9 ± 2.613.8 ± 214 ± 2.614 ± 213.7 ± 2.613.6 ± 2.1
TDI RV lateral peak e’, cm/s13.4 ± 2.112.7 ± 2.913.5 ± 212.7 ± 2.913.5 ± 2.312.5 ± 3
TAPSE, mm25.3 ± 4.425.9 ± 3.524.2 ± 3.725.7 ± 3.527.5 ± 4.526.2 ± 3.4
RA Dimensions
RA ESV volume, mL51.9 ± 13.258.1 ± 14 ***50.3 ± 13.554.6 ± 13 ***55.1 ± 12.565 ± 13.7 ***, †
RA ESV volume i, mL/m223 ± 625.7 ± 5.6 ***23.9 ± 6.625.8 ± 6 ***21.3 ± 4.525.5 ± 4.7 ***
Values are mean ± SD. Abbreviations: EDV: end-diastolic volume, EF: ejection fraction, ESV: end-systolic volume, FW: free wall, i: index, RVOT PLAX: right ventricular outflow tract in parasternal long-axis view, TDI: tissue Doppler imaging. TAPSE: tricuspid annular plane systolic excursion. * p < 0.05, ** p < 0.01, *** p < 0.001 of a paired t-test comparing the variable between pre-and post-training in each group. p < 0.05, †† p < 0.01, ††† p < 0.001 of an independent t-test comparing variable between non-linemen and linemen at each time point.
Table 3. Intra- and inter-observer reproducibility test for right ventricular (RV) global and regional 3D volumetric assessment.
VariableIntra-ObserverInter-Observer
RV global
RV EDV, mL5 (3.3%)11 (7%)
RV ESV, mL4.1 (5.4%)10.6 (15.3%)
RV EF, %2.4 (4.9%)5.2 (10.2%)
RV Inlet
RV inlet EDV, mL3.3 (4.1%)9.3 (12.2%)
RV inlet ESV, mL3.2 (7.8%)6.1 (16.2%)
RV Inlet EF, %3.3 (7%)5.1 (10.6%)
RV Apex
RV apex EDV, mL1.8 (5.3%)3.5 (9%)
RV apex ESV, mL1.8 (12.9%)3.4 (23.7%)
RV apex EF, %5.2 (9.3%)8.7 (14.8%)
RV Outlet
RV outlet EDV, mL3.4 (10%)9 (22.2%)
RV outlet ESV, mL2.1 (10.9%)4.1 (20.4%)
RV outlet EF, %3.2 (7.9%)10.7 (23.3%)
Mean error values, in the format of absolute and the percentual error in parenthesis. Abbreviations: EDV: end-diastolic volume, EF: ejection fraction, ESV: end-systolic volume.
Publisher’s Note: MDPI stays neutral with regard to jurisdictional claims in published maps and institutional affiliations.

