Phytoplankton Growth and Productivity in the Western North Atlantic: Observations of Regional Variability From the NAAMES Field Campaigns
 James Fox1
  Michael J. Behrenfeld2
  Nils Haëntjens3
  Alison Chase3
  Sasha J. Kramer4,5
  Emmanuel Boss3
  Lee Karp-Boss3 Nerissa L. Fisher1
  W. Bryce Penta1
  Toby K. Westberry1
  Kimberly H. Halsey1*
- 1Department of Microbiology, Oregon State University, Corvallis, OR, United States
- 2Department of Botany and Plant Pathology, Oregon State University, Corvallis, OR, United States
- 3School of Marine Sciences, University of Maine, Orono, ME, United States
- 4Department of Geography, University of California, Santa Barbara, Santa Barbara, CA, United States
- 5Earth Research Institute, University of California, Santa Barbara, Santa Barbara, CA, United States
The ability to quantify spatio-temporal variability in phytoplankton growth and productivity is essential to improving our understanding of global carbon dynamics and trophic energy flow. Satellite-based observations offered the first opportunity to estimate depth-integrated net primary production (NPP) at a global scale, but early modeling approaches could not effectively address variability in algal physiology, particularly the effects of photoacclimation on changes in cellular chlorophyll. Here, a previously developed photoacclimation model was used to derive depth-resolved estimates of phytoplankton division rate (μ) and NPP. The new approach predicts NPP values that closely match discrete measurements of 14C-based NPP and effectively captured both spatial and temporal variability observed during the four field campaigns of the North Atlantic Aerosols and Marine Ecosystems Study (NAAMES). We observed favorable growth conditions for phytoplankton throughout the annual cycle in the subtropical western North Atlantic. As a result, high rates of μ are sustained year-round resulting in a strong coupling between growth and loss processes and a more moderate spring bloom compared to the high-latitude subarctic region. Considerable light limitation was observed in the subarctic province during the winter, which resulted in divergent growth dynamics, stronger decoupling from grazing pressure and a taxonomically distinct phytoplankton community. This study demonstrates how detailed knowledge of phytoplankton division rate furthers our understanding of global carbon cycling by providing insight into the resulting influence on phytoplankton taxonomy and the loss processes that dictate the fate of fixed carbon.
Introduction
Despite constituting less than 1% of the earth’s photosynthetic biomass, marine phytoplankton are estimated to be responsible for almost half the global annual net primary production (Field et al., 1998). The vast quantity of organic carbon fixed by phytoplankton in the sunlit layer of the ocean provides the primary source of energy for marine food webs and the global phytoplankton community grows, divides, and expires (to grazing or viral lysis) every few days (Behrenfeld and Falkowski, 1997a; Bidle, 2015). Approximately 85–90% of the carbon fixed through primary production in the euphotic zone will remain within the upper ocean, including the twilight zone, where it is remineralized and recycled. The remaining fraction is exported to the deep ocean (Giering et al., 2014) where the organic carbon turnover rate is on the scale of years (and longer) in the mesopelagic and bathypelagic zones (Rowe et al., 1990). Accurately quantifying the spatial and temporal variability in phytoplankton productivity is therefore paramount to improving our understanding of global carbon dynamics and trophic energy flow (Siegel et al., 2014; Boyd et al., 2019).
Assessments of marine primary production and carbon cycling are made difficult by the extreme plasticity in phytoplankton physiology that allows these organisms to exist ubiquitously throughout the sunlit ocean (Geider et al., 1998; Halsey and Jones, 2015). Phytoplankton photosynthesis is limited by the availability of nutrients and light, leading to suppressed growth and productivity in oligotrophic or light-limited environments (Geider et al., 2001; Arrigo, 2005; Moore et al., 2013). To optimize growth in these resource-limited environments, phytoplankton adjust their light harvesting strategy and reallocate photosynthetic energy to different metabolic pathways (Halsey and Jones, 2015). Collectively, these photoacclimatory processes prime phytoplankton for optimal growth in their extant environment and have been extensively studied in laboratory cultures (Laws and Bannister, 1980; Geider et al., 1997; Halsey et al., 2014). When environmental conditions permit, phytoplankton can divide at rates that exceed losses to top-down pressures, resulting in an accumulation of phytoplankton biomass known as “blooming” (Behrenfeld and Boss, 2014). If sustained for sufficient time, these periods of accumulation can result in substantial CO2 sequestration and organic carbon export, a quintessential example being the large scale springtime blooming event across the subarctic Atlantic ocean (Friedland et al., 2016). Approximately 0.55 to 1.94 Gt C year–1 of the annual global carbon export out of the euphotic zone (∼11 Gt C year–1) originates in the North Atlantic Ocean, with roughly half of this occurring during the spring bloom (Sanders et al., 2014; Siegel et al., 2016).
Optical technologies provide the most effective approach to probe phytoplankton dynamics over large scales of space and time. Mounted on platforms including satellites, ships, gliders, floats, and fixed moorings, optical sensors offer a spatially and temporally cohesive picture of phytoplankton biomass and physiology that in situ sampling approaches cannot fully resolve (O’Reilly et al., 1998; Boss et al., 2008; Briggs et al., 2018). Bulk properties of chlorophyll concentration (Chl) and, more recently, phytoplankton biomass (Cphyto) have been retrieved from space over the past four decades and are routinely implemented into models to provide global estimates of NPP and carbon export (Antoine et al., 1996; Behrenfeld and Falkowski, 1997a; Smyth et al., 2005; Westberry et al., 2008; Uitz et al., 2010; Silsbe et al., 2016). When combined with ship-based field data, these satellite observations are revealing how environmental and biological factors combine to control global and regional variability in phytoplankton physiology and distribution (Behrenfeld et al., 2006, 2009; Blondeau-Patissier et al., 2014). Similar optics-based approaches to assess primary productivity and export using floats (Estapa et al., 2019), ships (Burt et al., 2018) or remotely operated vehicles (Hemsley et al., 2015; Massicotte et al., 2019) are starting to resolve fine-scale dynamics, such as physiological changes occurring on hourly timescales or distributions of stocks at sub-pixel scales that cannot yet be captured using satellite-based approaches (Bracher et al., 2017). These recent studies highlight the potential efficacy of multi-platform approaches to untangle complex dynamics within the marine carbon cycle, while providing an invaluable opportunity to validate and ground truth satellite-based models.
This report utilizes optical data collected during a multi-year study in the western North Atlantic that targeted key phases of the annual bloom cycle (Behrenfeld et al., 2019). These data provide an opportunity to quantify NPP across a large dynamic range of standing stocks and growth conditions, with specific interest in characterizing underlying changes in phytoplankton biomass and physiology. Use of an existing photoacclimation model accounted for a large amount of variability in the ratio of key proxies of phytoplankton Chl and Cphyto, providing new evidence supporting the theory that the depth and duration of the winter mixing period determine the ultimate magnitude of the subsequent spring bloom. We further explore residual variability in optical properties retrievable from space as an avenue for improving remote sensing productivity assessments.
Materials and Methods
Ship-based measurements were made onboard the R/V Atlantis during the field program (2015–2018) of the North Atlantic Aerosols and Marine Ecosystems Study (NAAMES) (Behrenfeld et al., 2019). An overarching objective of NAAMES was to characterize plankton ecosystem dynamics over the course of an annual cycle and determine the environmental conditions required to produce the annual subarctic phytoplankton bloom. The four field campaigns were structured to align with specific phytoplankton bloom phases, based on the framework of the Disturbance-Recovery Hypothesis (Behrenfeld and Boss, 2018): the winter transition (November 2015 campaign) where mixed layer depth (MLD) is deepening and phytoplankton concentration is stable or decreasing, the accumulation phase where the MLD begins shoaling and phytoplankton concentration starts to increase (March 2018 campaign), the bloom climax/transition where a shallow MLD leads to a recoupling of phytoplankton division and loss rates (May 2016 campaign), and an equilibrium phase where deteriorations in mixed layer growth conditions result in a more stable system where phytoplankton loss rates are proportional to division rates (September, 2017 campaign). This experimental design resulted in extensive variability in observations of phytoplankton biomass, productivity, and physiological conditions over time and space, providing an excellent platform to probe our “skill” in modeling these parameters to understand how the environment and biological processes integrate to yield an annual phytoplankton bloom cycle. All data presented in this report were collected along the primary “science intensive” transect, located between ∼400N and ∼550N latitude along the 400W longitude (Figure 1). For each campaign, a number of stations were occupied along this transect to allow for water column profiling and acquisition of discrete samples from depth.
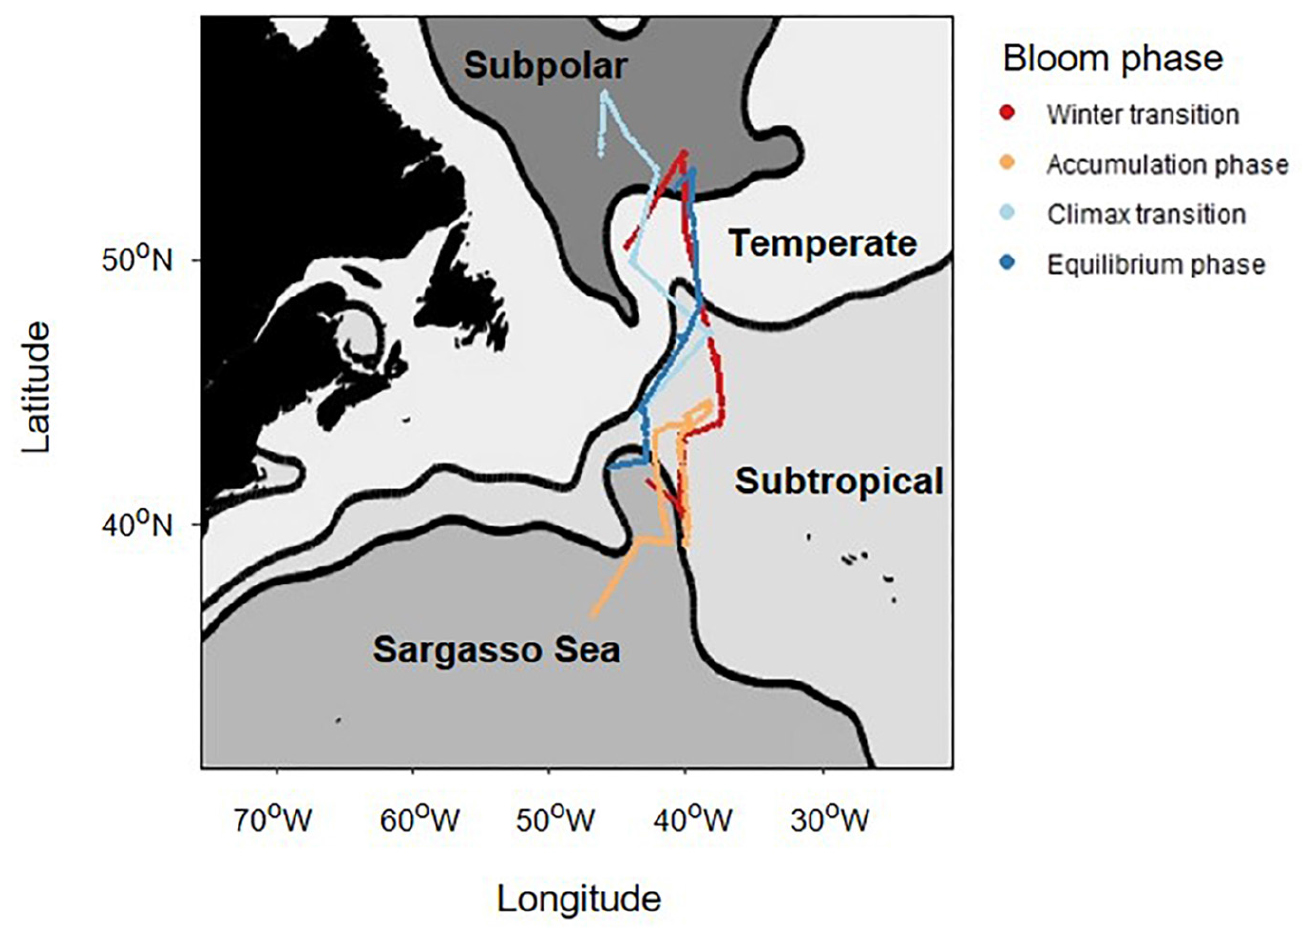
Figure 1. A map of the NAAMES study region showing the North Atlantic sub-regions identified by Della Penna and Gaube (2019) using dynamic topography. The colored lines indicate the cruise track of each field campaign. For the purposes of this report, the northern regions were combined into the “subarctic region,” and the southern regions were combined into the “subtropical region.”
Underway Optical Properties
Temperature, salinity and optical properties were measured continuously on the ship’s clean seawater supply (intake at approximately 5 m depth) during all field campaigns. A flow-through system with a diaphragm pump was employed throughout the NAAMES field campaign to avoid unwanted interference with the sampled plankton populations (Cetinić et al., 2016). The seawater was delivered through a vortex debubbler to various optical instruments. A WetLabs ACS was used to measure hyperspectral particulate attenuation and absorption, optical measurements commonly used to estimate Chl concentration (ChlACS), particulate organic carbon, and particle size index (Boss et al., 2001; Cetinić et al., 2012). The ChlACS concentrations were derived from the line height of the chlorophyll absorption peak in the red (Boss et al., 2007) and tuned using the NAAMES high performance liquid chromatography (HPLC) samples collected underway (Eq. 1). A WetLabs ECO-BB3 was used to measure the angular scatterance at 1 Hz at three wavelengths (470, 532, and 660 nm). The optical measurements use a calibration-independent technique (Slade et al., 2010) by differencing filtered measurements (0.2 μm) from total measurements (no filter).
Optically-derived estimates of phytoplankton biomass were calculated using particulate backscatter at the 470 nm wave band (bbp(470)) following Graff et al. (2015) according to Eq. 2:
Modeling Phytoplankton Growth and Productivity
Phytoplankton acclimate to changing environmental conditions through a number of physiological responses. Laboratory and field observations of Cphyto to Chl ratios (θ; see Table 1 for a full listing of symbols, terms, definitions and units) follow anticipated physiological dependencies on light (photoacclimation), nutrients and temperature, which in turn can be used to estimate phytoplankton growth rate. Phytoplankton communities that encounter a significant decrease in growth irradiance (under nutrient replete conditions) will typically increase cellular Chl resulting in a decrease in θ (Figure 2A), which is paralleled by a decrease in growth rate. The opposite behavior is observed during shallow mixing, where pigmentation often decreases due to the combined influences of high-light acclimation and nutrient limitation (Figure 2B). Through our understanding of the mechanisms of photoacclimation and the environmental drivers that alter θ, it is possible to estimate growth rate and NPP.
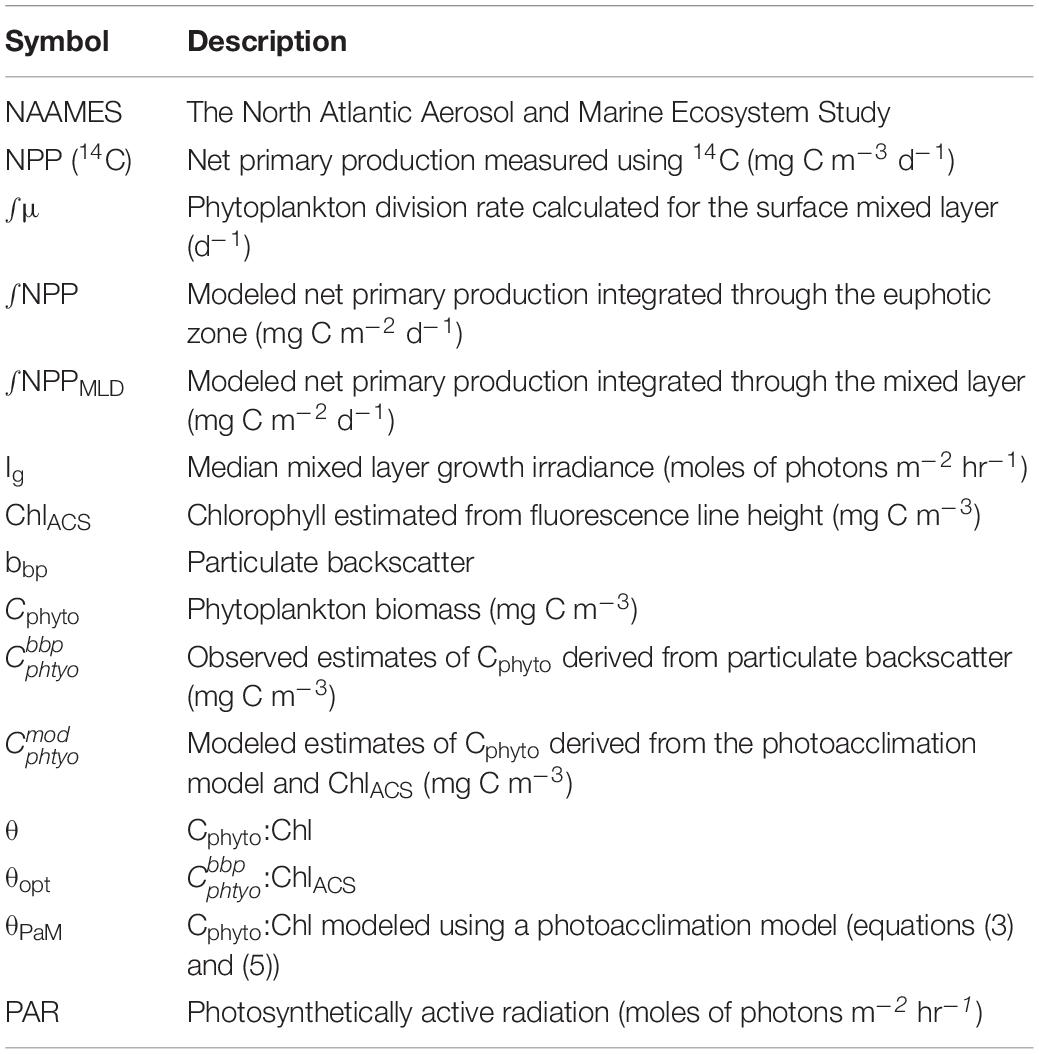
Table 1. Symbols, terms, definitions and units.
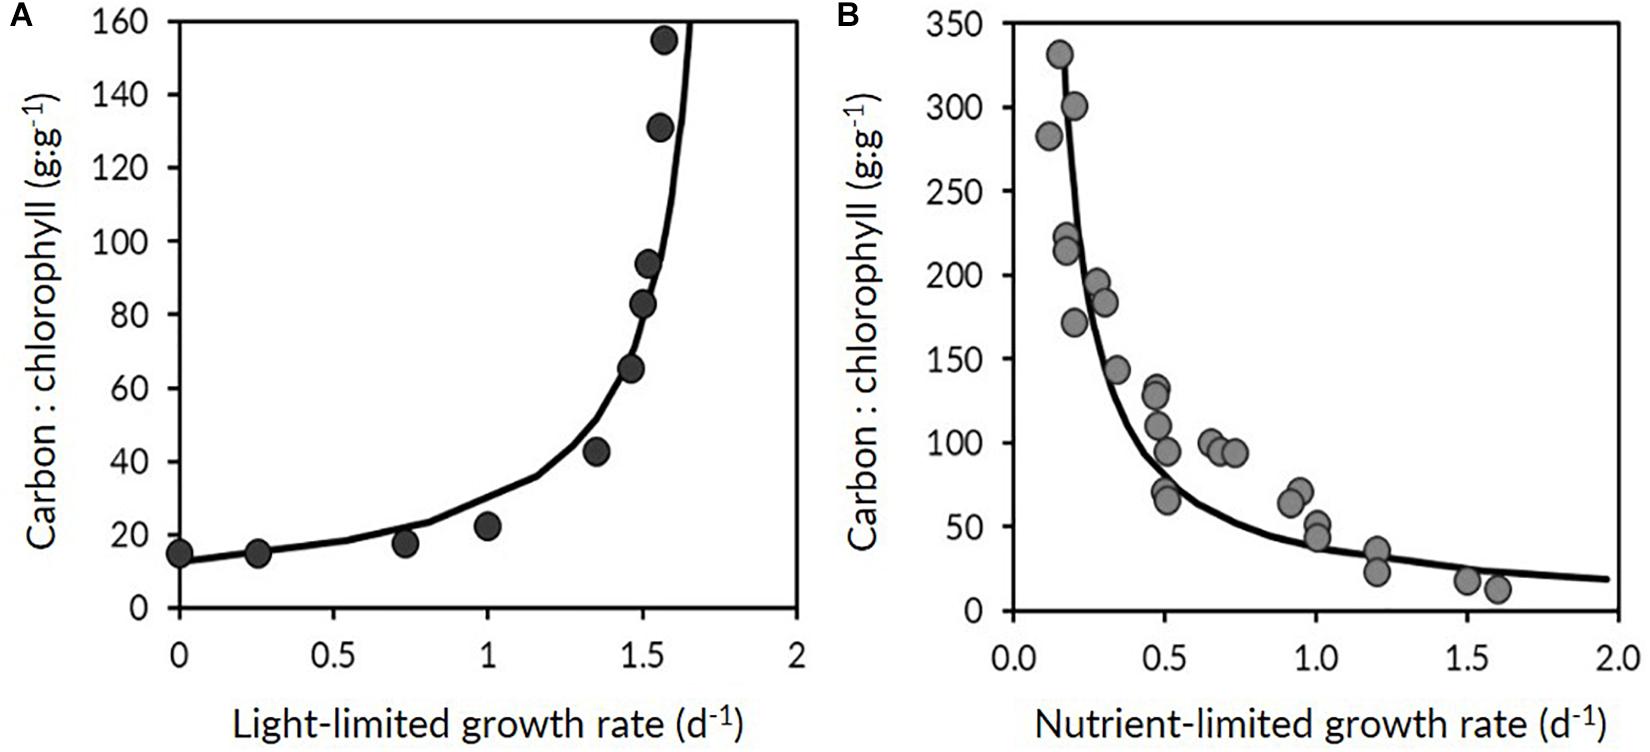
Figure 2. Contrasting relationships between phytoplankton carbon-to-chlorophyll ratios (θ) and growth rate (μ). (A) Relationship between θ and μ as typically observed in nutrient-replete and light-limited phytoplankton. (B) Relationship between θ and μ under steady-state light-sufficient and nutrient-limiting conditions. Adapted from Behrenfeld et al. (2016), data are from Laws and Bannister (1980) and Halsey et al. (2014).
A previously developed photoacclimation model (PaM) (Behrenfeld et al., 2016) is used here to estimate θ along the full science-intensive transect during each of the four NAAMES field campaigns. The PaM is composed of a “baseline” deep-mixing solution (θDM) and a shallow-mixing correction (ΔθSM), such that for any given mixing depth θPaM = θDM ΔθSM. A fundamental concept introduced in the development of the PaM was that molecular signals regulating chlorophyll synthesis are influenced during exposure to darkness, such that chlorophyll synthesis abates. The model assumes that this dark condition occurs at depths greater than six optical depths and that the value of θPaM for all mixing depths greater than this horizon is described by θDM (that is ΔθSM has a value of 1):
where PAR is the photosynthetically active radiation flux (400–700 nm, mol photons m–2 h–1), which for the current study was measured (1 min resolution) using a Licor Model LI-189 cosine sensor, and Kd is the attenuation coefficient for downwelling PAR estimated from ChlACS concentrations (Morel et al., 2007):
For mixed layers less than six optical depths, a shallow mixing correction is added (ΔθSM) and calculated as:
where Ig is the median growth irradiance in the surface mixed layer:
Herein, MLD is estimated using a dynamic threshold method based on Brunt Väisälä frequency (N2). The N2-based estimates of MLD were calculated from CTD profiles (carried out every 1–3 day–1) and defined as the depth (>5 m) at which N2 increased to a value greater than the absolute value of the standard deviation of the unsmoothed (raw) N2 profile. The discrete estimates of MLD were then linearly interpolated between casts to derive MLD for the full science intensive transect. For further details on NAAMES MLD calculations see Graff and Behrenfeld (2018).
Daily averages of θPaM for each station were then derived from the transect data and used to calculate depth-resolved estimates of phytoplankton division rate and NPP. All transect data between stations were omitted from the NPP analysis to remove the variability in model estimates driven by changes in MLD, which were not measurable when in transit. Components of the PaM (Eqs 3 and 5) were used to infer phytoplankton division rate (μ) using published relationships between μ and θ from field and laboratory studies (Figure 2):
here the final term describes the reduction in growth rate as a result of decreasing ambient light estimated iteratively with depth. The decrease reflects the inability of photoacclimation to maintain sufficient light absorption at all light levels. The strength of the light limitation effect on μ is characterized by the exponent (−5) in Eq. 7 (Westberry et al., 2008).
θPaM was multiplied by ChlACS to yield phytoplankton biomass () which is assumed to be uniform throughout the photic layer (Westberry et al., 2008). Depth-resolved NPP was calculated as μ x at each depth increment. Depth-integrated μ (∫μ) for the mixed layer was calculated as:
where ∫NPPMLD and are the values of NPP and modeled Cphyto integrated through the surface mixed layer. Discrete measurements of NPP determined using 24 h 14C-uptake (see below) were used to ground-truth modeled productivity values. Means from different sampling locations and regions were compared using a one-way analysis of variance (ANOVA) and post hoc Tukey-Kramer (T-K) test when necessary (α = 0.05).
Net Primary Production Measurements
NPP was determined using 14C uptake incubations. Water collected pre-dawn from 4 to 5 depths was inoculated with 14C-labeled sodium bicarbonate and incubated in on-deck incubators at light levels corresponding to the collection depths. Following incubation (24 h, dawn-to-dawn), samples were filtered onto 0.2 μm polycarbonate membrane filters, acidified with 1 M HCl and allowed to degas for 24 h. 10 ml of liquid scintillation cocktail were added to each sample before measuring activity with a scintillation counter. Prior to incubations, three 100 μL subsamples were collected immediately following the “14C-spike” to accurately measure total activity of 14C-labeled sodium bicarbonate added to each sample. These samples were mixed with 50 μL of β-phenylethylamine and scintillation cocktail before measurement in the scintillation counter.
Phytoplankton Pigment Composition
Water samples (1–3 L) for phytoplankton pigment composition were collected from surface (5 m) Niskin bottles or the ship’s underway water supply and filtered through 25 mm GF/F filters. Filters were flash-frozen and stored in liquid nitrogen until analysis. Samples were analyzed using HPLC at the NASA Goddard Space Flight Center Ocean Ecology Laboratory following established protocols (Van Heukelem and Thomas, 2001). Degradation products and redundant accessory pigments were removed from the dataset, leaving sixteen pigments for analysis: 19′-hexanoyloxyfucoxanthin, 19′-butanoyloxyfucoxanthin, alloxanthin, fucoxanthin, peridinin, diatoxanthin, diadinoxanthin, zeaxanthin, divinyl chlorophyll a, monovinyl chlorophyll b, divinyl chlorophyll b, chlorophyll c1 + c2, chlorophyll c3, neoxanthin, violaxanthin, and prasinoxanthin. Lutein (an accessory pigment found in green algae) was also removed from the dataset, as it was undetected in >75% of samples. All pigments were normalized to total Chl a concentration before a network-based community detection analysis was performed following the methods of Kramer et al. (in review) to identify the taxonomic community to which each sample was assigned following a data-driven network-based community detection analysis.
Briefly, in the network-based community detection analysis, each sample becomes a node in the network; the edges connecting each sample to all other samples are described by the strength of the correlation between the sites. The HPLC pigment dataset is first transformed into a symmetrical adjacency matrix that describes the Pearson’s correlation coefficient between every set of samples based on the ratios of all sixteen pigments to total Chl a. The edges between samples were weighted following the Weighted Gene Co-Expression Network Analysis (WGCNA; Zhang and Horvath, 2005) before the community detection analysis was performed on the adjacency matrix. The community detection algorithm identified five distinct taxonomic communities based on the concentrations of pigments in each community: cyanobacteria, diatom, dinoflagellate, green algae/mixed population, and haptophyte.
Results
Evaluation of broad scale variability in mean dynamic topography allowed the NAAMES study region to be classified into four defined provinces (Figure 1): subarctic, temperate, subtropical, and Sargasso Sea/Gulf Stream (Della Penna and Gaube, 2019). Based on similarities in physical-chemical properties and highly-defined phytoplankton community composition, we grouped subarctic and temperate provinces together and subtropical and Sargasso Sea provinces together following the approach of Bolanos et al. (in review). These broader groups are hereafter referred to as the subarctic and subtropical regions, respectively.
Water column stratification and upper ocean mixing dynamics showed strong seasonality across the four campaigns. During the winter transition (November), northern stations in the subarctic region exhibited a well-mixed upper layer >60 m (Figure 3A). As the ship progressed further south into the subtropical region, the water column became more stratified with a shallow MLD (<25 m). All stations sampled during the accumulation phase (March) were located south of 45°N in the subtropical region, where the degree of stratification varied extensively and the MLD ranged from 6 to 231 m (Table 2 and Figure 3B). Water column conditions during the climax transition (April–May; Figure 3C) and equilibrium phase (August–September; Figure 3C) were characterized by strong thermal stratification and mixed layers shallower than 35 m, with one exception during the climax transition being a strong physical disturbance where the water column was temporarily homogenized to a depth of ∼200 m immediately before arrival at one of the sampling stations (47°39.360N, 39°11.398W) (Graff and Behrenfeld, 2018).
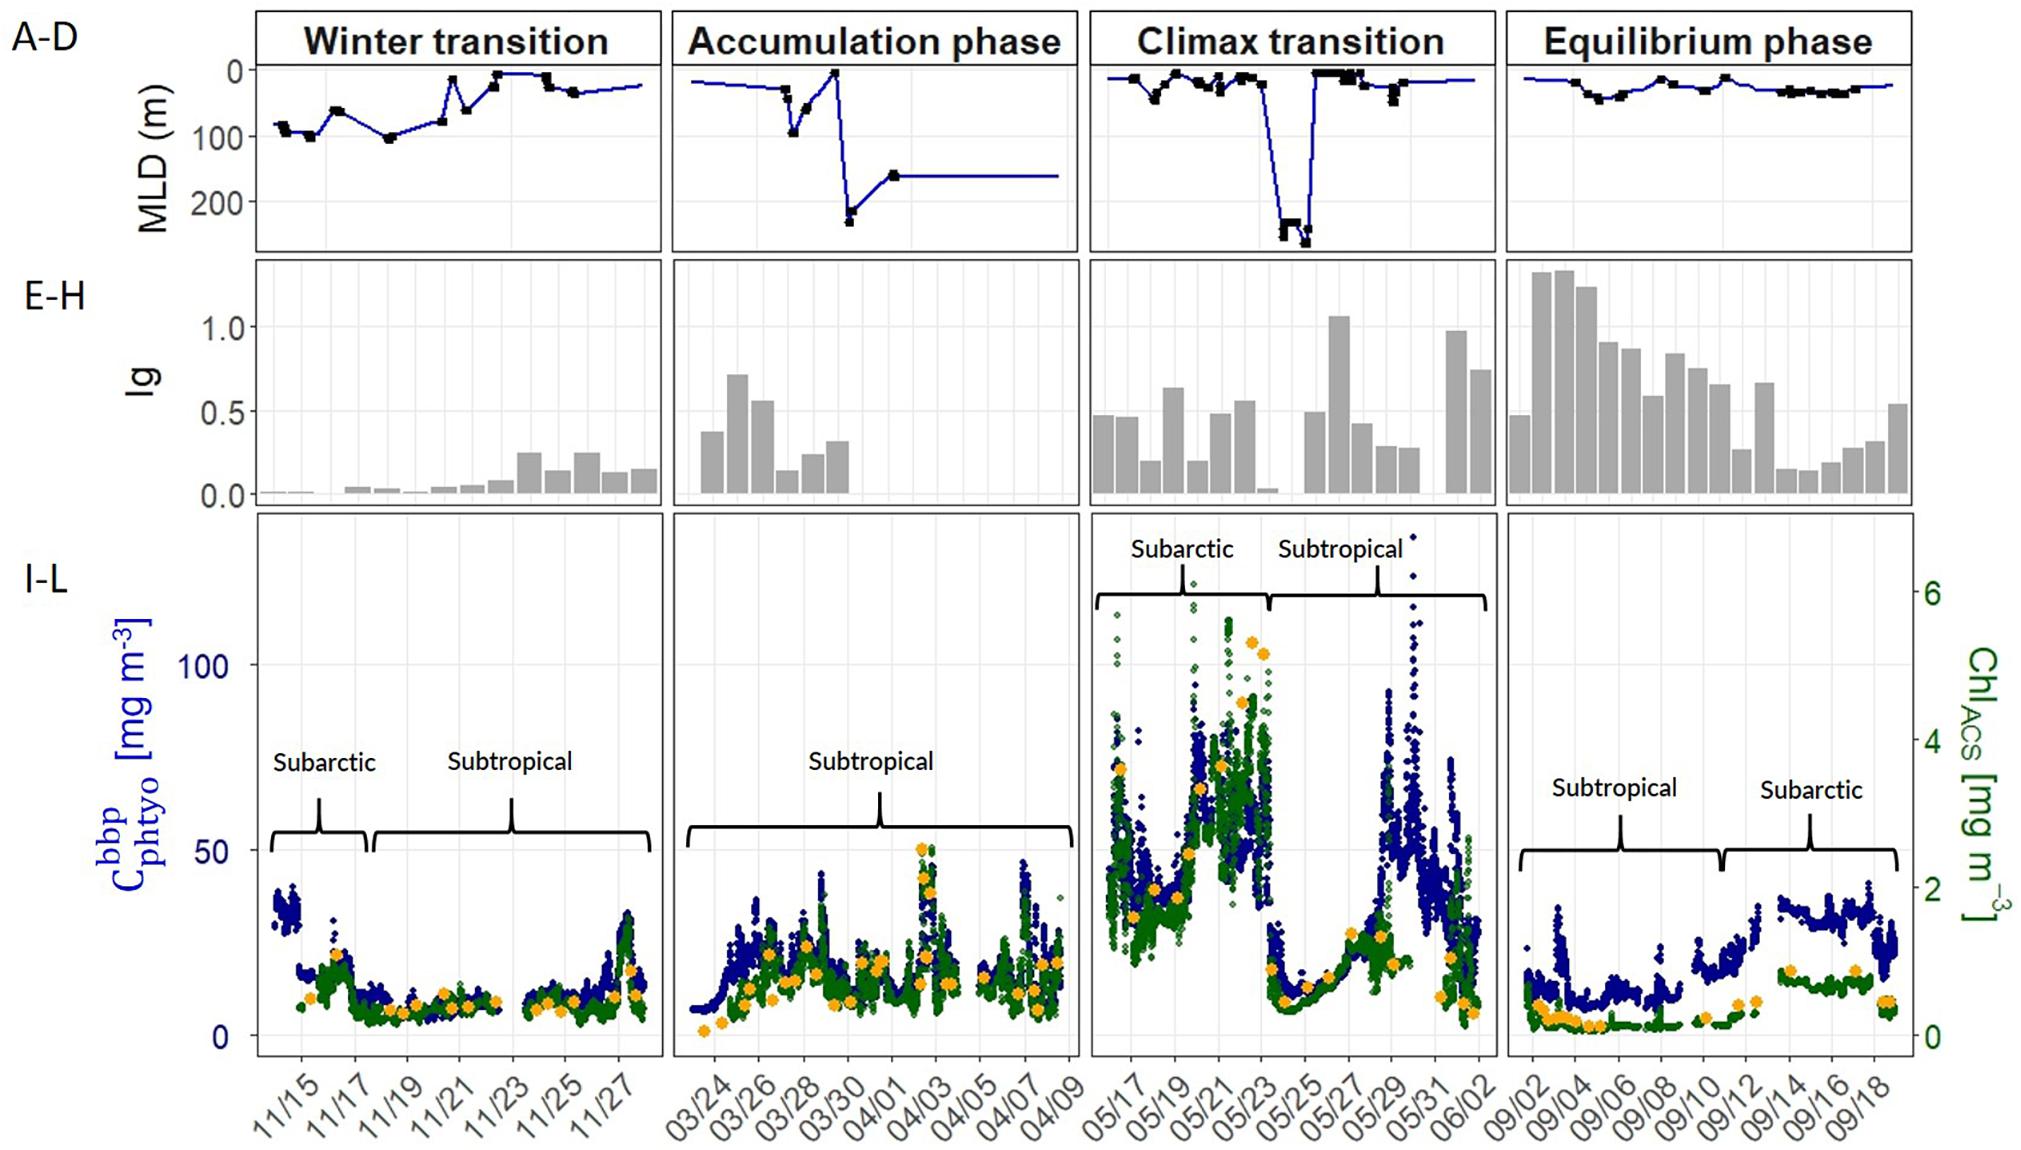
Figure 3. (A–D) Mixed layer depth (MLD) measured during the four NAAMES field campaigns (labeled at top). Blue line indicates interpolated values between casts over the course of the science intensive transect, black circles indicate MLD values estimated from CTD profiles. (E–H) Median mixed layer light levels (Ig, moles of photons m–2 h–1). (I–L) Optically-derived estimates of phytoplankton carbon (, blue circles) and chlorophyll concentration (ChlACS, green circles) binned to 1-minute resolution and plotted along the NAAMES science-intensive transect. Orange circles are HPLC-based estimates of surface chlorophyll concentration. Upper brackets distinguish subarctic and subtropical regions (see section “Spatio-Temporal Variability in Phytoplankton Carbon and Chlorophyll” for information).
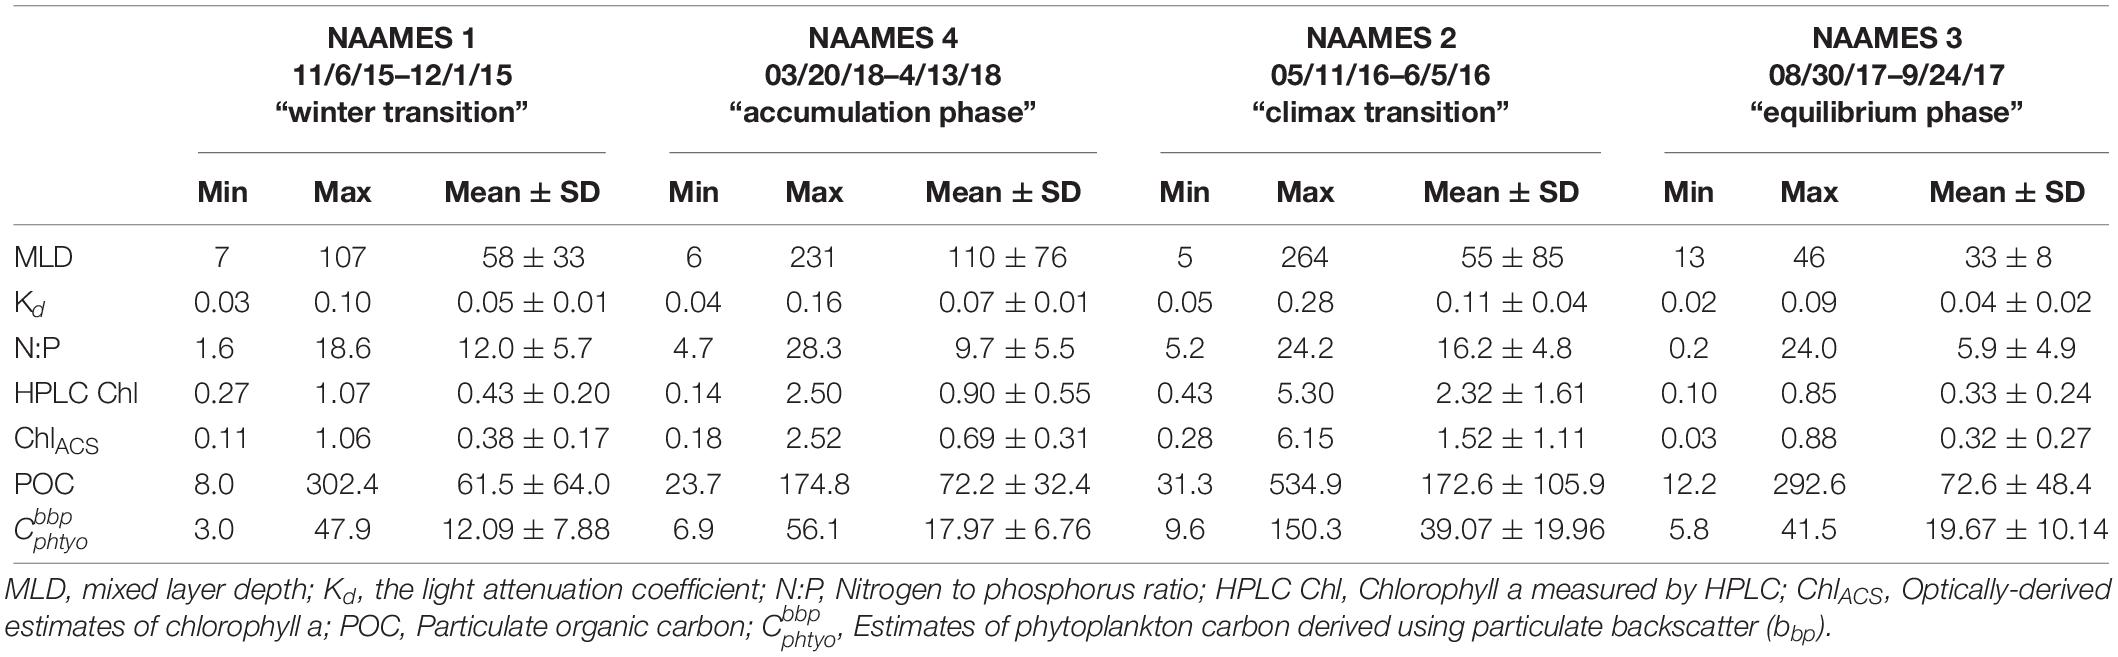
Table 2. Mean and standard deviation, maximum and minimum values of physical, biological and chemical parameters measured during the four NAAMES field campaigns.
Spatio-Temporal Variability in Phytoplankton Carbon and Chlorophyll
Annual cycles of mixing, stratification, and light availability (Figures 3A–H) yielded minimum Cphyto and Chl concentrations in winter, an accumulation of phytoplankton biomass in spring reaching a late spring climax, followed by an autumn decline in both properties in the subarctic and subtropical regions (Figures 3I–L). One difference between the two regions is that the subarctic climax biomass appeared slightly elevated compared to subtropical levels (Figure 3K). Both the optically-derived (ChlACS) and discrete surface measurements of Chl (HPLC from 5 m) effectively captured the spatial and temporal heterogeneity observed during each campaign (Figures 3I–L). The high temporal resolution (1 min bins) of the underway optical instruments revealed tightly coupled patterns in and ChlACS ratios (Figures 3I–L). Nevertheless, measured to ChlACS ratios (θopt) exhibited a 20-fold range in variability (10–235 mg m–3:mg m–3) across the four field campaigns (Figure 4). This large range was dominated by the equilibrium phase (average θopt of 94 ± 43) (Figure 4) when light intensity was at the highest and nitrate (N) concentrations were significantly lower (ANOVA, T-K, p < 0.01) as indicated by N:P (Table 2). Values of θopt during the other three campaigns (winter transition, accumulation phase and climax transition) were substantially lower and remarkably similar (28 ± 11, 27 ± 10, 27 ± 11 mg m–3:mg m–3, respectively), with the low averages indicating growth conditions in the surface mixed layer were predominantly light-limiting and nutrient-replete.
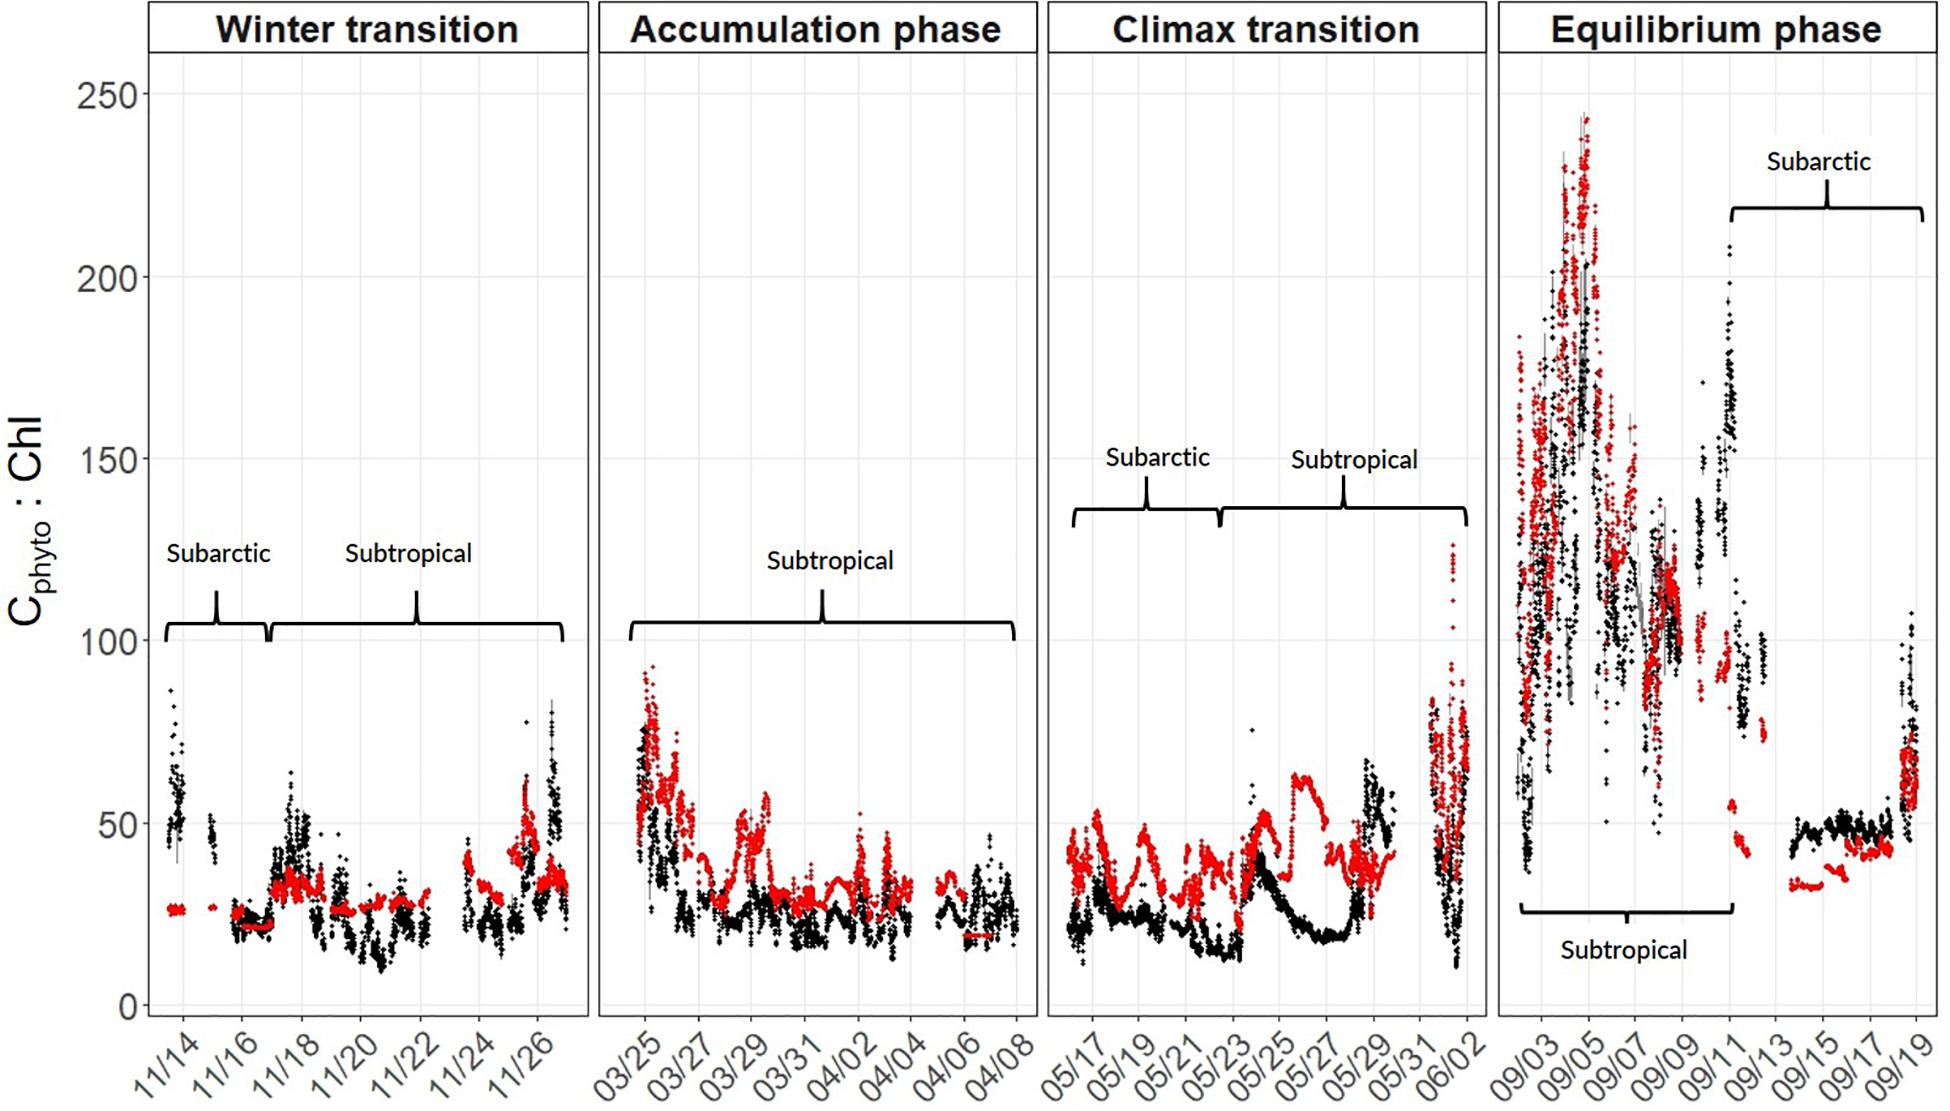
Figure 4. Estimates of the phytoplankton carbon-to-chlorophyll ratio (θ) calculated using PaM (red circles) and measured using underway optics (black circles). Values were binned to 1-minute resolution and plotted along the NAAMES science-intensive transect. Phases of the annual cycle are shown at the top and within-panel brackets distinguish geographical regions (see section “Spatio-Temporal Variability in Phytoplankton Carbon and Chlorophyll” for information).
Field-measured θopt values exhibited good agreement with θPaM for the full science-intensive transect of the four field campaigns (y = 0.85x + 12.34, r2 = 0.72, RMSE = 19.17) (Figure 4 and Supplementary Figure S1). The ability of the PaM, which only accounts for physiological light responses, to reproduce the mixed layer observations suggests that light-driven photoacclimation was the dominant driver of θ variability (Figure 4). To examine secondary drivers of the remaining unexplained θ variance, we explored influences of phytoplankton community composition on particulate backscatter by comparing it against modeled estimates of carbon. Measurements of θPaM and ChlACS both correlated strongly with θopt and HPLC observations, respectively (r2 = 0.72 and 0.95), giving confidence in the values. For NAAMES, comparison of bbp(470) and yielded a linear regression slope (r2 = 0.60, y = 14760x + 0.72) that was similar to previously published values (Behrenfeld et al., 2005; Graff et al., 2015; Figure 5). This finding suggests that variability in phytoplankton community composition, outside of its influence on the particle size distribution, played a significant role in observed θopt variability, particularly during the climax transition when θopt and θPaM showed the poorest match ups (Figure 4).
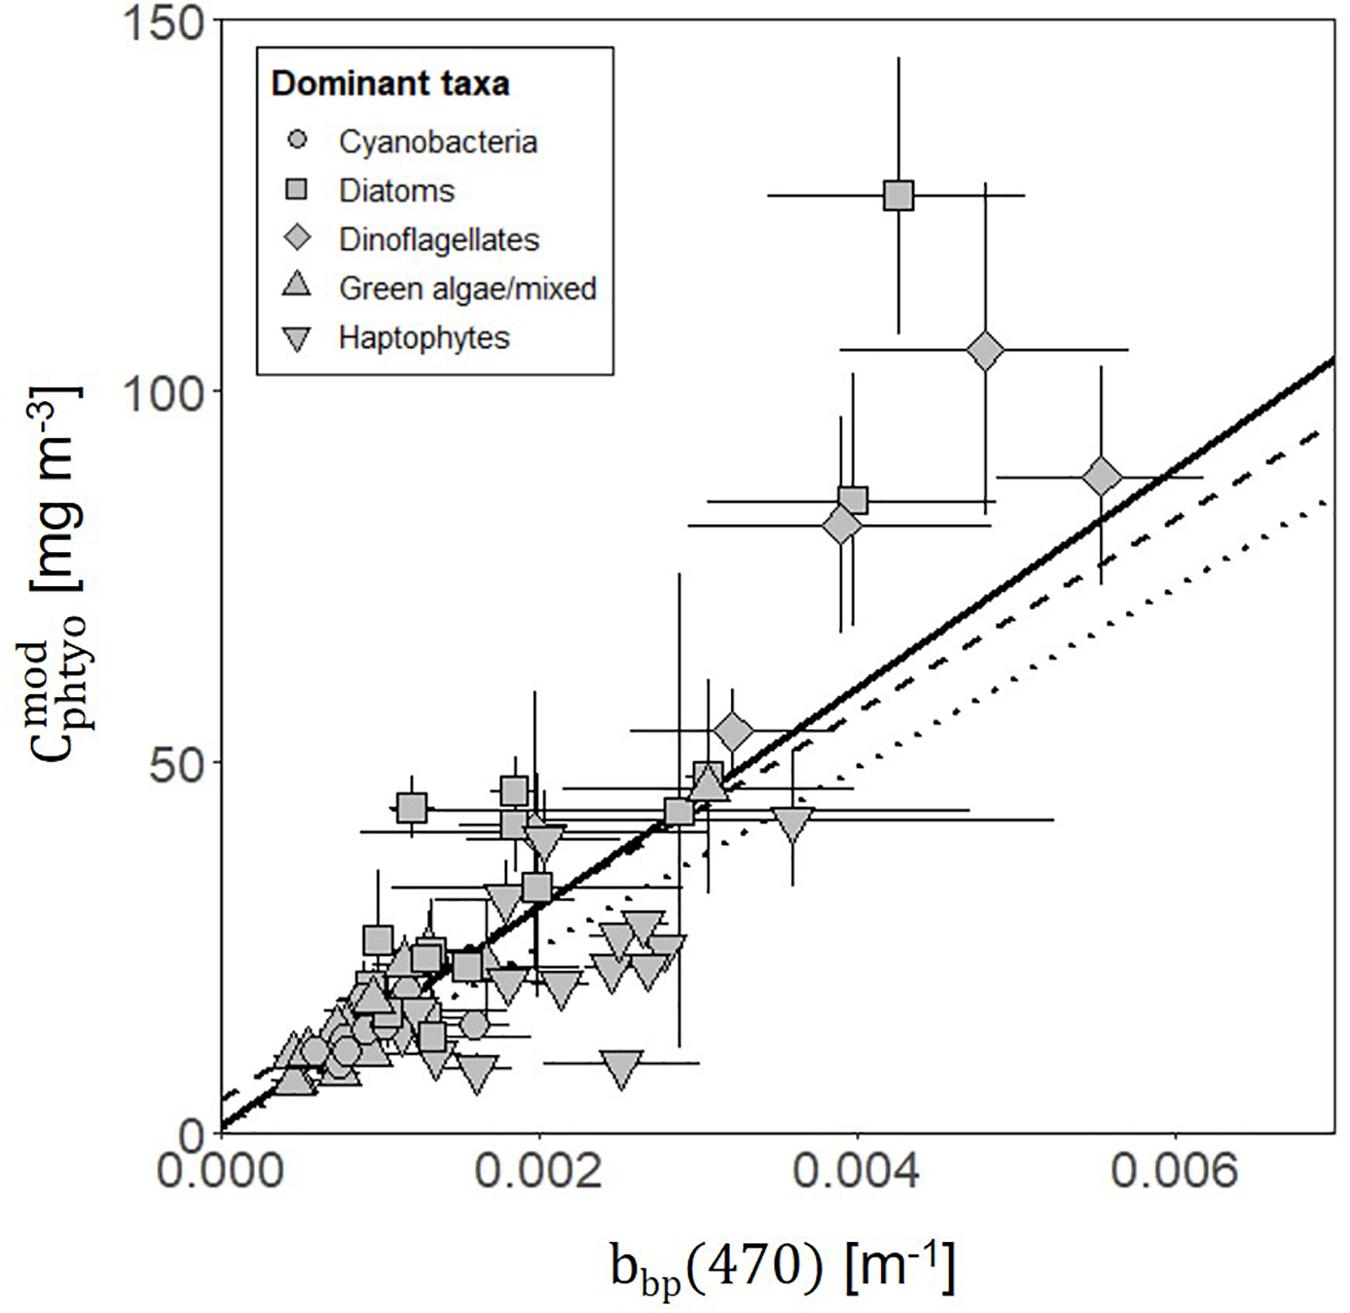
Figure 5. Relationship between modeled phytoplankton carbon () values (derived from θPaM and ChlACS) and measurements of particulate backscatter (bbp(470)) (solid line; y = 14910x + 0.70, r2 = 0.61, RMSE = 16.31) along the full science intensive transect from all four campaigns. Points show daily mean with error bars indicating standard deviations. Symbol shape indicates the dominant phytoplankton within the community, estimated using a community detection algorithm. Previously published relationships are also shown from Behrenfeld et al. (2005) (dashed line; y = 13000x + 4.55) and Graff et al. (2015) (dotted line; y = 12128x + 0.59).
Modeled Phytoplankton Growth and Primary Production
The vast majority of modeled estimates of NPP showed good agreement with measurements from 24 h 14C-uptake bottle incubations (r2 = 0.80, y = 0.99x-1.4, RMSE = 6.03, n = 138; Figure 6). Incubation values from three stations in the subarctic sampled during the climax transition also showed excellent agreement but had a markedly lower slope (r2 = 0.85, y = 0.33x + 2.1, RMSE = 6.43, n = 21; Figure 6). Potential reasons for the apparent offset are discussed below. Nevertheless, modeled NPP consistently predicted measured values from discrete depths throughout the euphotic zone (Figure 7), confirming the ability of the model to capture depth-integrated estimates of NPP (∫NPP).
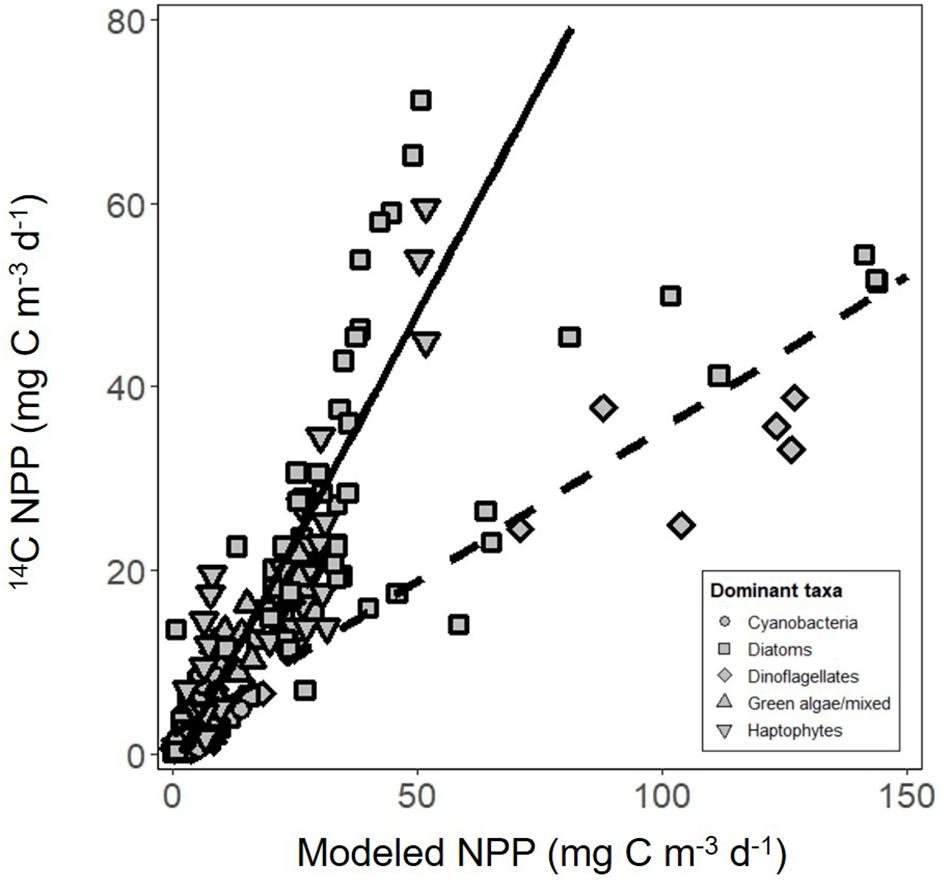
Figure 6. Net primary production (NPP) estimated using carbon uptake (14C) incubations compared with modeled estimates. Solid line is regression of all data except for three stations from the climax transition campaign (y = 0.99x-1.4, r2 = 0.80, RMSE = 6.03, n = 138). Dashed line is the regression of data from the three stations only (y = 0.33x + 2.1, r2 = 0.85, RMSE = 6.43, n = 21). Symbol shape indicates the dominant phytoplankton taxa within the community, estimated using a community detection algorithm.
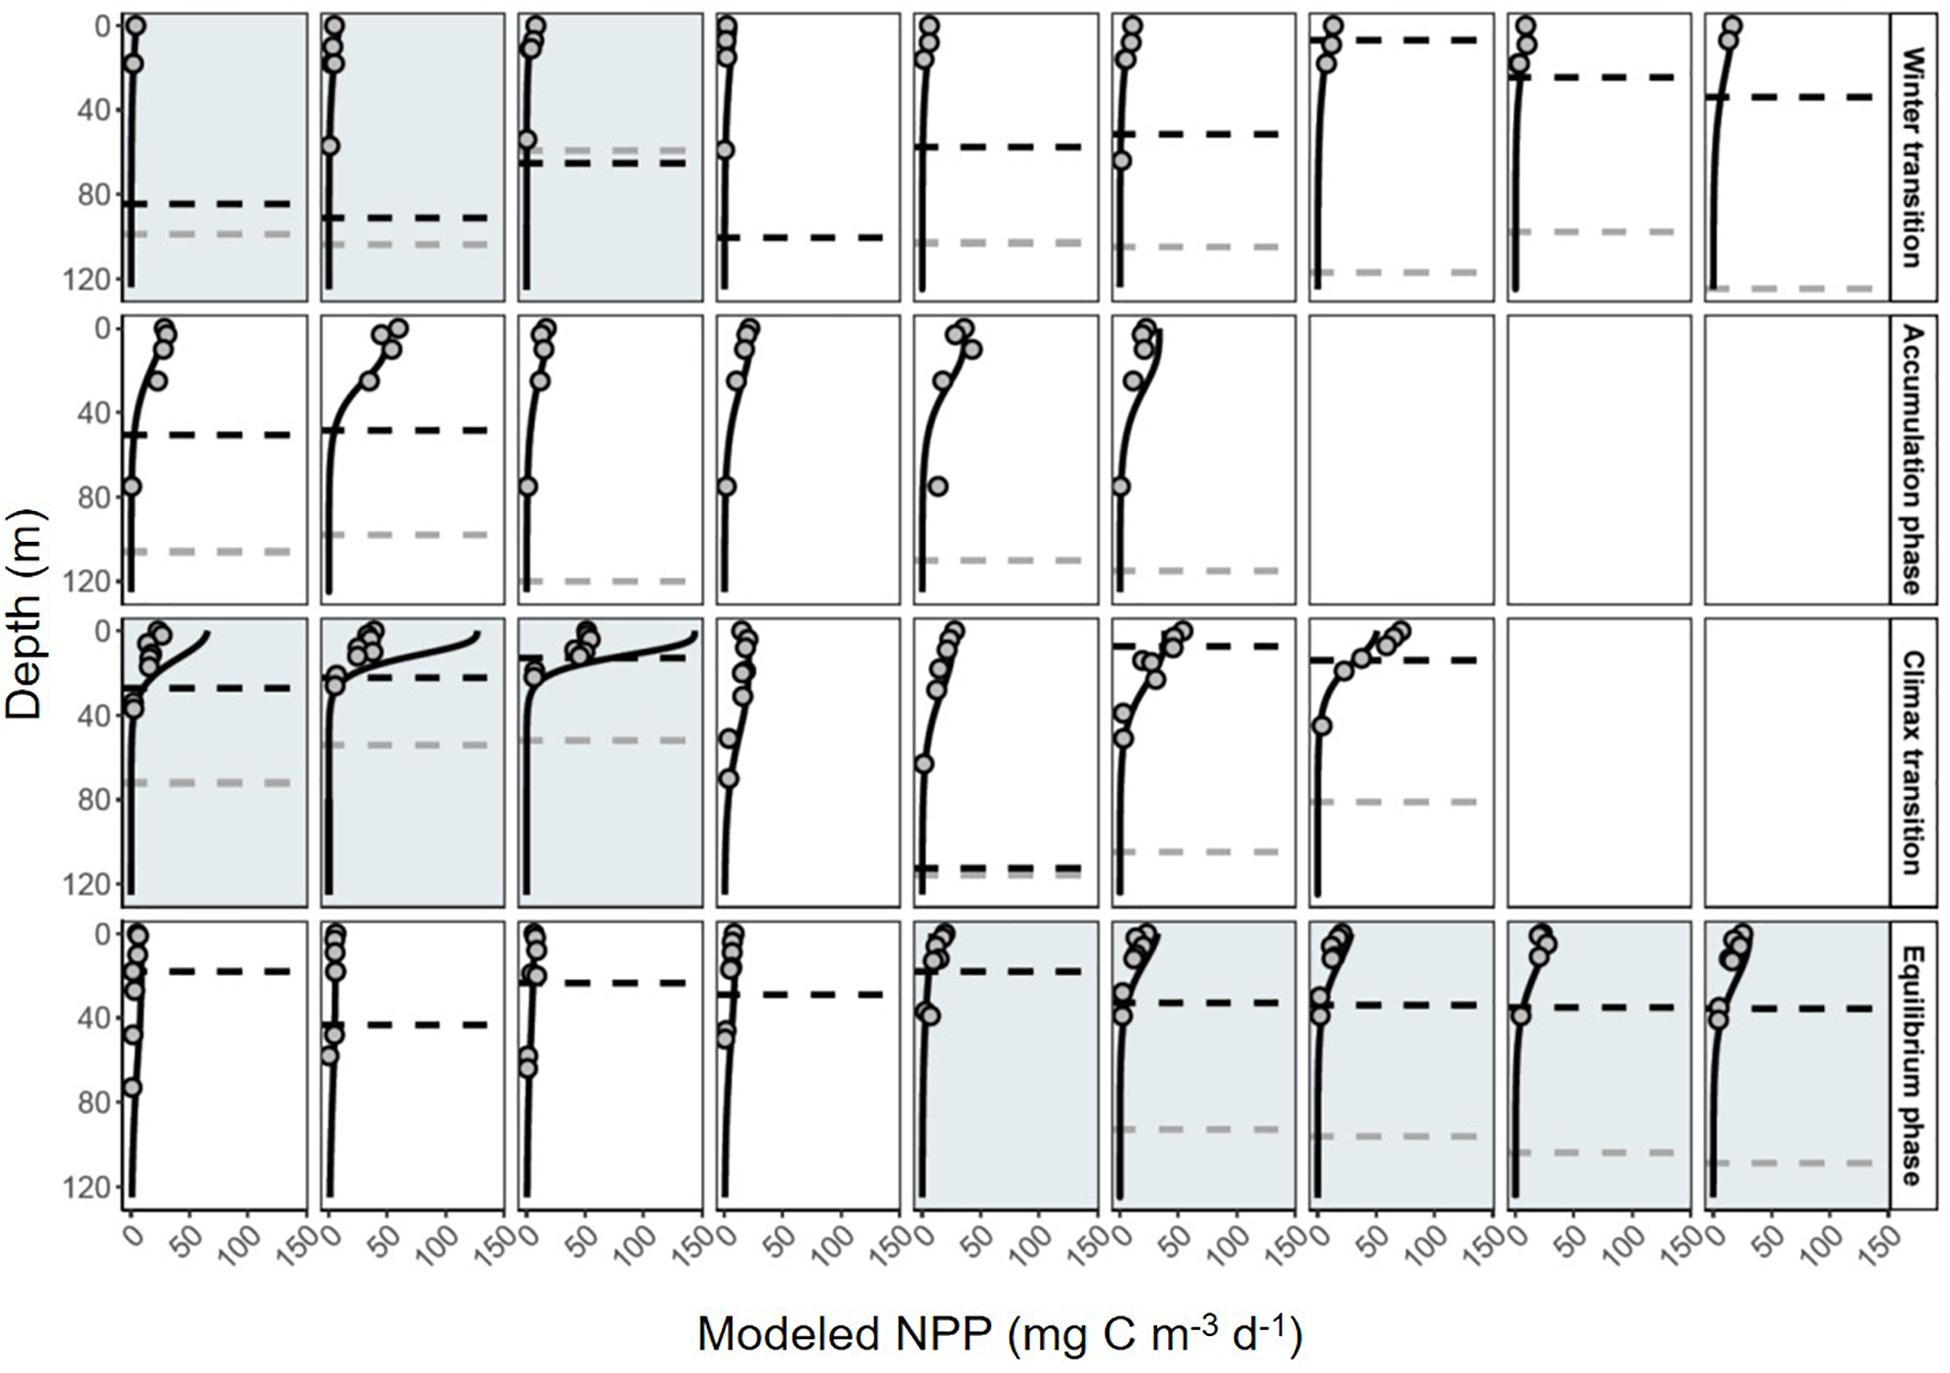
Figure 7. Daily profiles of net primary production (NPP) during the NAAMES field campaign. Black solid line indicates depth-resolved (1 m) model estimates of NPP. Gray circles are discrete estimates of carbon-uptake measured in 24 h 14C bottle incubations. Dashed black line shows the depth of the mixed layer. Dashed gray line shows the depth of the euphotic zone. White boxes indicate the station was in the subtropical region, gray shading indicates stations in the subarctic. Each row is a different phase of the annual cycle (labeled on right).
Our analysis revealed clear trends in ∫NPP and mixed layer μ (∫μ) over the annual bloom cycle and important differences in these properties between the subtropical and subarctic regions (Figure 8 and Table 3). ∫NPP was low during the winter transition in both regions, progressively increased during the accumulation phase, peaked during the climax transition, and declined in the equilibrium phase to values similar, or slightly higher, than the winter transition (Figure 8A). Across both regions and all phases of the annual bloom cycle, ∫NPP was highest in the subarctic region during the climax transition (mean ± s.d = 1464 ± 440, maximum = 2296, units = mg C m–2 day–1). ∫μ in the winter transition was markedly higher in the subtropical region compared to the subarctic (mean 0.57 vs. 0.21; ANOVA, T-K, p < 0.05), but ∫NPP in the winter transition was similar in these regions (Figure 8C). Thus, during winter, growth rate was the primary driver of NPP in the subtropical region, whereas the standing stock of phytoplankton carbon drove NPP in the subarctic region. ∫μ increased ∼1.3-fold between the winter and climax transition phases in the subtropical region but increased ∼4-fold over the same period in the subarctic region, achieving a similar mean of ∼0.75 day–1 in both regions during the climax transition.
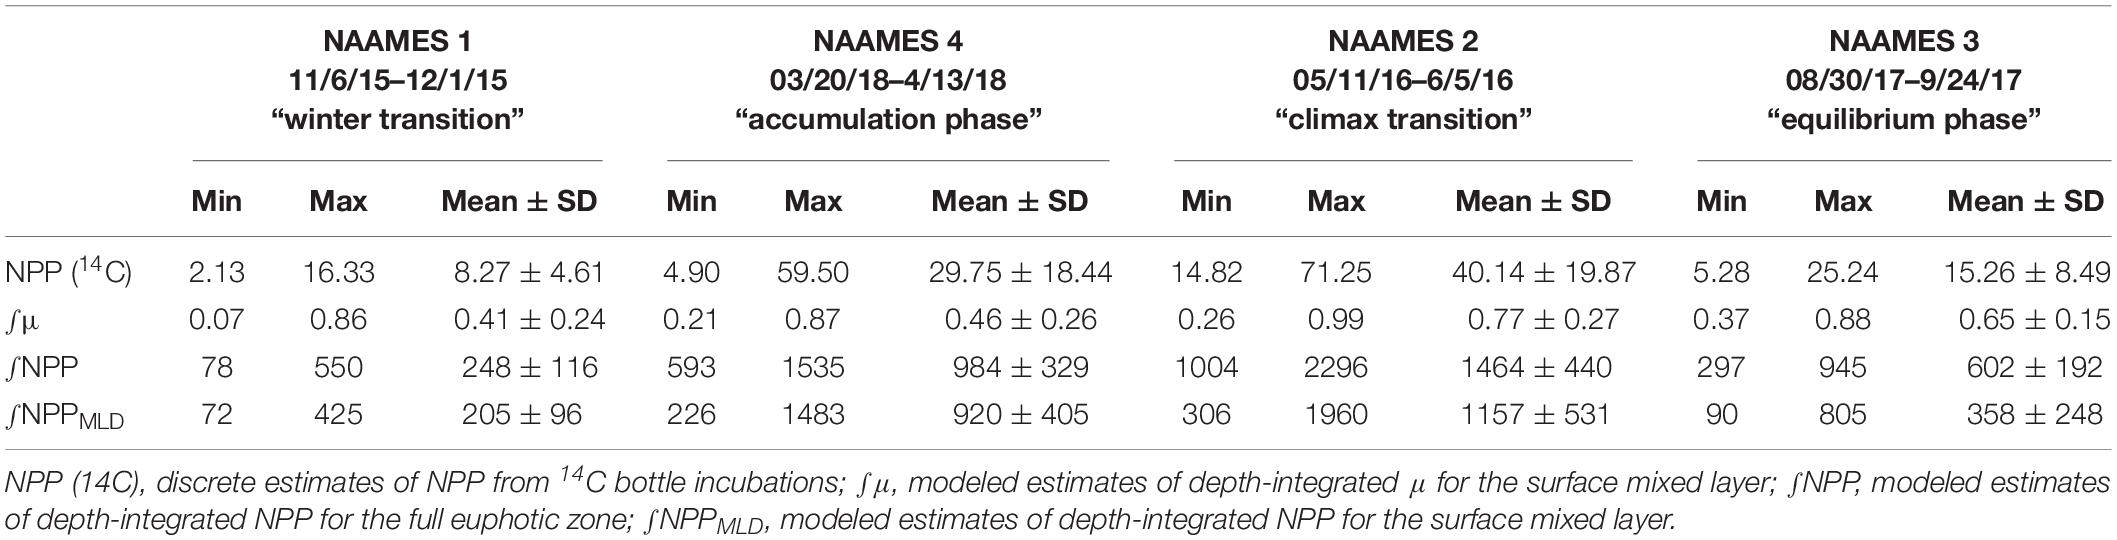
Table 3. Mean and standard deviation, maximum and minimum values of net primary production (NPP) and phytoplankton division rate (μ) measured during the four NAAMES field campaigns.
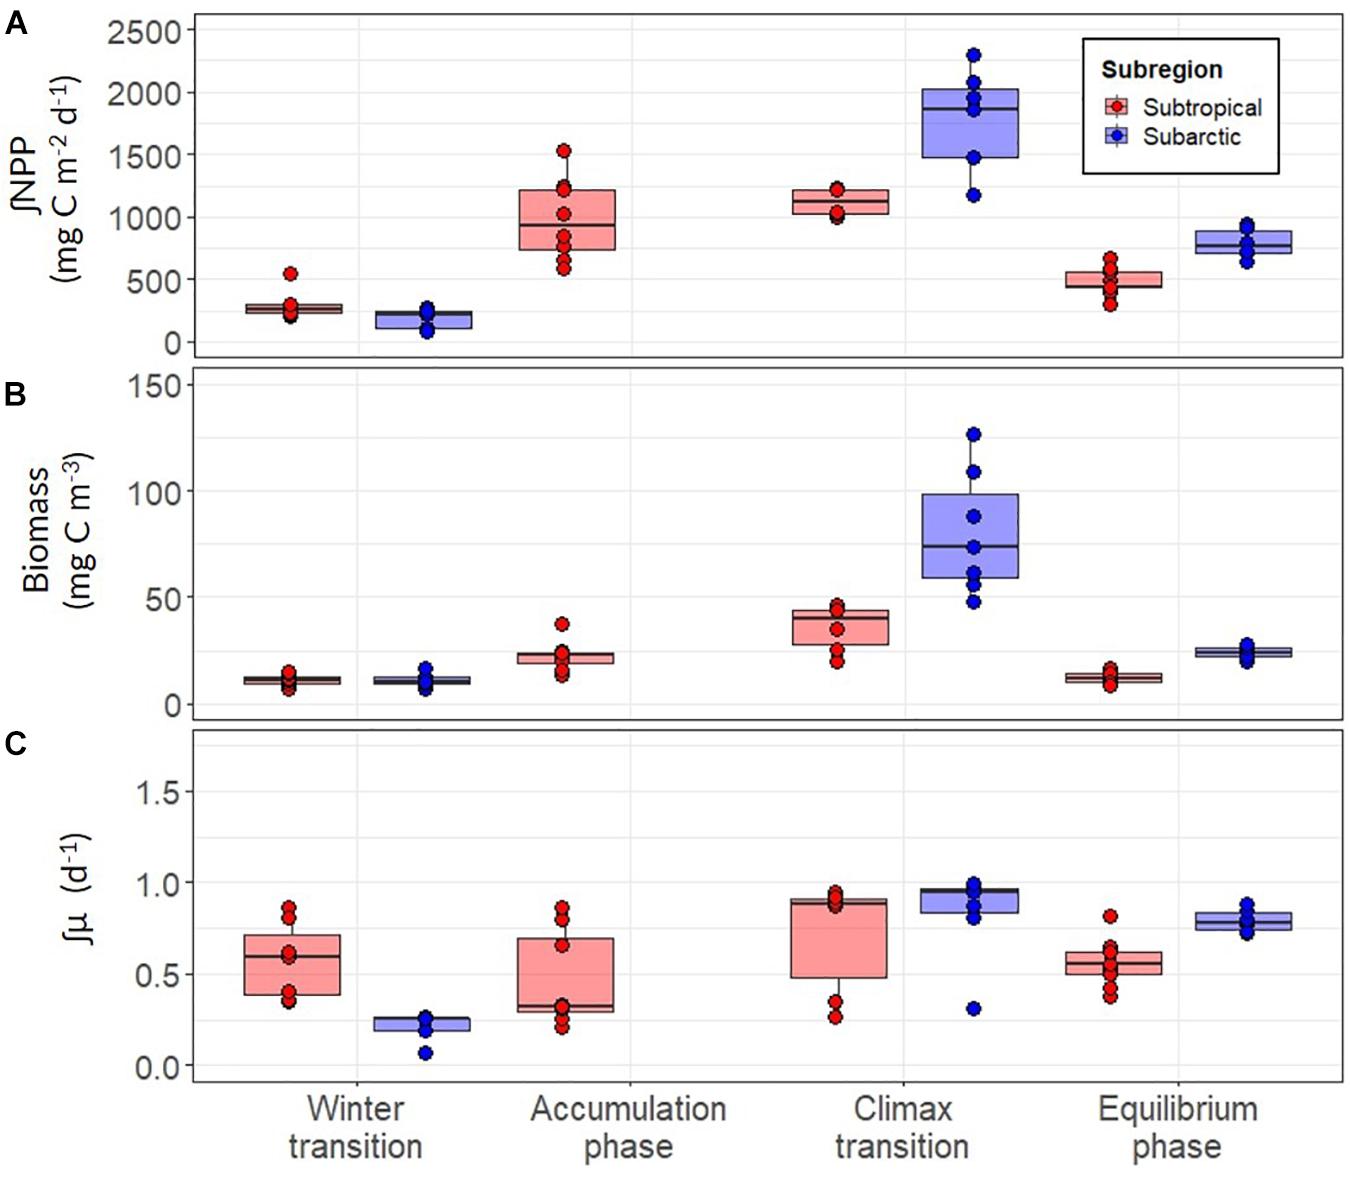
Figure 8. (A) Depth-integrated net primary production (∫NPP) between the surface and depth of the euphotic layer for the subarctic (red) and subtropical (blue) regions. (B) Mean concentration of optically-derived phytoplankton carbon in the mixed layer (C) The depth-integrated phytoplankton division rate (∫μ) estimated using modeled values of ∫NPP and ∫C. Each point represents a daily estimate of data collected while on station. Boxes represent the median, first and third quartiles, whiskers are 1.5 interquartile range.
Discussion
The ability to explain what drives spatio-temporal variability in phytoplankton productivity is essential for improving our understanding of global carbon dynamics. Early satellite-based approaches used Chl and predictive relationships with abiotic factors (e.g., light and temperature or nutrient concentration) to estimate depth-integrated productivity (∫NPP) at a global scale (Platt and Sathyendranath, 1993; Antoine et al., 1996; Behrenfeld and Falkowski, 1997a). Although these approaches could accurately predict ∫NPP, they could not address the sources of variability in physiology when compared to discrete field measurements, particularly the effects of photoacclimation on changes in cellular Chl [see Behrenfeld and Falkowski (1997b) and citations within]. More recently, phytoplankton growth was estimated using changes in Chl and Cphyto as a function of light, temperature, and nutrients (Behrenfeld et al., 2005), and a photoacclimation model (PaM) was developed independently to account for a deeper understanding of how phytoplankton regulate expression of Chl during deep mixing (Behrenfeld et al., 2016). Here, we show that NPP derived from PaM estimates of θ effectively captures both spatial (depth-resolved and regional scale) and temporal variability across the four NAAMES science-intensive campaigns.
Environmental Controls on Phytoplankton Growth and Productivity
In situ estimates of phytoplankton μ and NPP in the North Atlantic bloom study region are relatively sparse. Rarely since the North Atlantic Bloom Experiment (NABE) of the Joint Global Ocean Flux Study (JGOFS) have both measurements been seen as integral to characterizing the annual cycles of phytoplankton bloom dynamics, resulting in a reliance on estimates derived from satellite, floats or models (Westberry et al., 2016; Briggs et al., 2018; Mignot et al., 2018). Although NABE was more limited in both spatial and temporal scope, it did capture the late spring bloom in the western North Atlantic during the same period of time (April/May) as the NAAMES climax transition campaign. Despite a difference of almost 30 years between the two studies, the observations show very similar values. Model estimates of ∫NPP from a comparable (43° W 44° N) site on the NAAMES transect ranged from 1139 to 1214 mg C m–2 d–1, and at the northern (41°W 45°N) NABE station estimates of ∫NPP were 1140 mg C m–2 d–1 (Li et al., 1993). A slightly lower value of 1063 mg C m–2 d–1 was observed at the southern (47° W 40° N) station of NABE. This result conformed to previous findings that the bloom climax in this region (∼45°) in the North Atlantic shows relatively low inter-annual variability either in time or magnitude (Henson et al., 2009; Uitz et al., 2010). Unique to this analysis of the NAAMES campaigns is the ship-based optical assessment of phytoplankton growth rate, which can help discern the abiotic and biological controls on the annual bloom cycle.
Phytoplankton growth, and consequently NPP, is a function of light, temperature and nutrients (Geider et al., 1998). While light harvesting is subject to a variety of strategies that ultimately dictate the maximal rate of division, the scarce availability of nutrients also requires physiological adjustments that involve highly efficient tuning of downstream carbon metabolism (MacIntyre et al., 2002; Halsey et al., 2010; Talmy et al., 2013). Phytoplankton strategies to optimize growth in response to light and nutrient availability appear to be shared by a diverse array of species, with distinct physiologies and evolutionary pathways (Halsey et al., 2013). The contrasting regimes of light and nutrient availability identified in the different regions in NAAMES resulted in distinct growth dynamics over the annual cycle. These behaviors have important implications for phytoplankton taxonomic succession, trophic energy transfer, and carbon export efficiency (the fraction of NPP exported out of the euphotic zone).
Three important differences were observed in the seasonal trends of ∫μ across the two regions that help explain regional differences in the magnitude of NPP. Firstly, ∫μ was substantially higher during the winter transition in the subtropical region compared to the subarctic. Second, median values of ∫μ were very similar across the two regions during the bloom climax phase. Third, the rate of change in ∫μ between the winter transition and climax transition was nearly 4-fold in the subarctic region, compared to 1.3-fold in the subtropical region (Figure 8C). The faster division rate measured in the subtropical region is unsurprising as the growth conditions encountered here during the four field campaigns were highly favorable: higher growth irradiance (Ig), greater physical stability of the water column, and moderate nutrient availability (except for the equilibrium phase; Supplementary Figures S2, S3). Thus, mean ∫μ was relatively stable throughout the annual cycle in the subtropical region and phytoplankton growth was only moderately light-limited during the winter transition (Ig of 0.11 ± 0.01, mean ± s.d; units = moles of photons m–2 hr–1) (Figure 8). In contrast, Ig in the subarctic winter transition was an order of magnitude lower (0.012 ± 0.006 moles of photons m–2 hr–1) than that observed in the subtropical region due to deeper mixing and, to a lesser extent, lower incident light. This appeared to result in severe light limitation, which inhibited growth in the surface layer and concurs with previous findings from this region (Follows and Dutkiewicz, 2001; Henson et al., 2009).
The subtropical region defined in this study falls into a transition zone described by Henson et al. (2009), who concluded that phytoplankton in this region experience light and/or nutrient limitation. We found that ∫μ in the subtropical region remained relatively constant across the annual cycle, even with steadily decreasing N availability (Figure 9), suggesting that light, rather than nitrate or phosphate concentration (Supplementary Figures S2, S3), played the prevailing role in limiting growth. This idea is further supported by an increase in ∫μ during the climax transition when the shallow mixed layer increased light availability (Ig rose to 0.41 ± 0.35 moles of photons m–2 hr–1 in spring). The conditions giving rise to this acceleration were also evident in the subarctic region, and the maximal mean growth rates observed across the two regions were similar (Figure 8). Nutrient availability (mainly N) only approached limiting concentrations in the subtropical region during the equilibrium phase (Figure 9). During this time ∫μ was almost identical to the values observed during periods of light limitation, while in the subarctic ∫μ remained substantially higher than the values observed in winter.
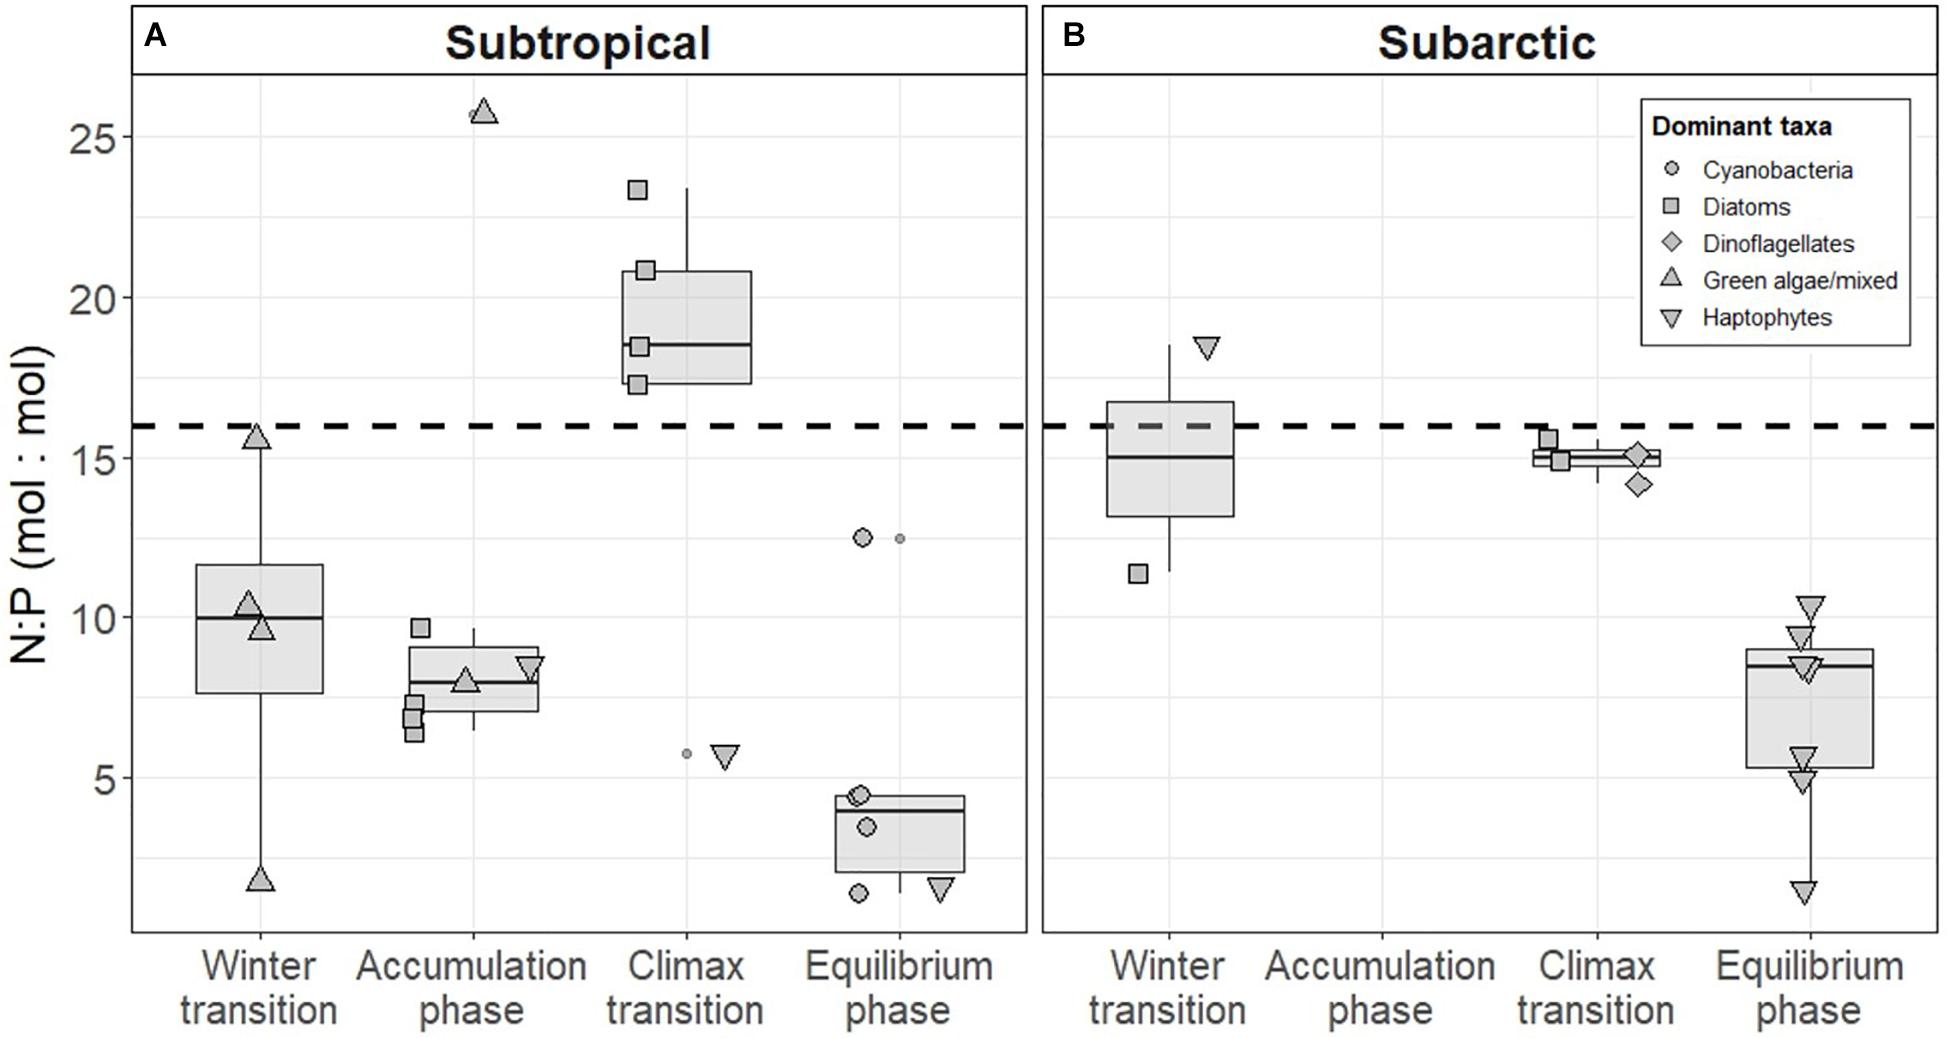
Figure 9. Nitrogen (N) to phosphorus (P) ratios measured in the (A) subtropical and (B) subarctic western North Atlantic. The shape of each point indicates the dominant phytoplankton taxa estimated using a pigment-based community detection analysis. Boxes represent the median, first and third quartiles, whiskers are 1.5 interquartile range. Dashed line indicates the Redfield ratio of N:P (16:1).
Annual Bloom Dynamics in the Western North Atlantic
The stability of an ecosystem can strongly influence the diversity and survival strategy of the resident population (Tilman, 1996). Within the marine environment, stability is quite often a reference to physical properties, such as the strength of stratification which is inversely correlated to the rate of vertical mixing. Seasonal variability in stratification (or stabilization) of the water column is a key feature of many prominent phytoplankton bloom hypotheses (Sverdrup, 1953; Huisman et al., 1999; Behrenfeld and Boss, 2018), whilst “turbulence” is at the core of the current paradigm of taxonomic succession (Margalef, 1978). In the western North Atlantic, it could be argued that the two regions (subtropical and subarctic) offer contrasting regimes of ecosystem stability, which have a profound influence on the taxonomy, growth and productivity of the phytoplankton community, and in turn, carbon export.
The growth dynamics discussed in the previous section provide insight into factors that shape the annual cycle of phytoplankton biomass, particularly the magnitude and termination of a bloom. In the subtropical region, ∫μ varied little over the annual cycle with only a small (1.3-fold) increase between the winter transition and climax transition. During this time, a more substantial (4-fold) change in biomass was observed as phytoplankton growth exceeded losses, leading to accumulation. The extent of accumulation, however, was significantly lower than the 7-fold change in biomass observed in the sub-arctic over the same period, during which the acceleration of growth in this region was much faster. The differences between the two regions could be explained by a tight coupling of growth-loss processes in the subtropics, with significant accumulation quickly curtailed by recoupling of grazer control (amongst other loss processes) following a mild acceleration in phytoplankton growth. Such tight coupling was likely driven by the generally stable growth conditions (high light, shallow mixed layer) in the subtropical region that facilitated consistently high phytoplankton growth rates, which in turn provided a permanent food source for higher trophic levels (Banse, 2002). In contrast, stronger decoupling from these loss processes likely occurred in the subarctic during the winter, when deeper vertical mixing resulted in more extreme light-limited growth conditions. Under such conditions, dilution of phytoplankton standing stocks would have reduced predator–prey encounter rates, resulting in a decline in predator abundance (Behrenfeld, 2014; Mayot et al., 2017). Collectively, these observations support the tenet of the Disturbance-Recoupling Hypothesis of bloom control, namely that the balance of phytoplankton growth and loss by predation determines bloom initiation and termination (Behrenfeld and Boss, 2018). The similar concentrations of biomass observed in the two regions during the winter transition is most likely explained by fewer, larger cells in the subarctic. Such divergent environments can result in very different strategies of survival and growth by the phytoplankton population, which can in turn influence the life cycles of key grazers that ultimately shape the development of a bloom (Friedland et al., 2016).
Regional Differences in Phytoplankton Community and the Implications for Carbon Export
Phytoplankton have evolved a number of growth strategies to increase competitive ability in environments of variable resource (light or nutrient) availability (Litchman and Klausmeier, 2008). Stable, stratified conditions such as those encountered in the subtropical region can often lead to phytoplankton communities dominated by taxonomic groups of smaller cell size (Finkel et al., 2010). Genetic profiling of phytoplankton community composition from NAAMES revealed that this was also the case in the western North Atlantic, with the subtropical community generally dominated by picoeukaryotes and cyanobacteria during the winter transition and climax transition (Bolanos et al. in review). Pigment-based analysis also supports this finding and reveals that significant changes occurred in the subtropical phytoplankton community during different stages of the annual cycle (Figure 9). In the subtropical winter, green algae, potentially the picoeukaryotes identified in Bolanos et al. (in review), were prevalent during the winter transition before the community shifted to haptophytes and cyanobacteria during subsequent seasons. Communities dominated by picoplankton are typically associated with rapid carbon cycling by the microbial loop, a route that leads to lowered carbon export efficiency due to respiration losses incurred as particulate matter is processed through the trophic web of smaller zooplankton, ciliates and bacteria (Worden et al., 2015). In the comparably unstable conditions of the high latitudes, phytoplankton that possess an ability to grow rapidly in highly changeable conditions tend to prosper, leading to a more “classic” food chain (e.g., diatom-copepod-fish) often typical of upwelling and other productive regions (Schmoker et al., 2013). The larger phytoplankton cells that thrive in such conditions allow for more rapid sedimentation of particulate matter and increased export efficiency (Henson et al., 2019). Although only pigment-based composition of phytoplankton was considered in the study presented here, Imaging FlowCytobot data show both seasonal and regional differences in community composition. Nano-size cells (including diatoms <10 μm) dominated both subarctic and subtropical communities during the winter transition, with high relative contributions of small diatoms to the total phytoplankton biovolume in the southernmost stations of the subtropical area of study. Whereas small cells continued to dominate communities in both subarctic and subtropical regions during the climax transition period, median cell size was higher in the subarctic region (Bolanos et al., in review).
A pronounced presence of prymnesiophytes and Euglenida (flagellates) in the subarctic during the climax transition (Bolanos et al., in review) may provide an important clue to explain the divergent slope in the modeled versus measured NPP relationship for the three stations occupied at this time (Figure 6). Bloom termination occurs as a result of recoupled phytoplankton growth and grazing pressure (Behrenfeld and Boss, 2018). It is conceivable that the 24 h dawn-to-dawn 14C-incubations yielded markedly lower NPP values than the model estimates because 14C -labeled Cphyto was rapidly recycled by grazers during the incubation. In fact, short term (2 h) 14C -incubations performed midday on the same days as the 24 h 14C -incubations during the climax transition in the subarctic gave carbon fixation rates that were among the highest measured across all campaigns (data not shown). This contrast between 2 h versus 24 h 14C-incubations suggests that respiration of newly fixed Cphyto by the grazing community during the 24 h incubation caused measured NPP to appear ∼3-fold lower than the actual NPP rate.
Conclusion
The amount of carbon sequestered during a large phytoplankton bloom is ultimately driven by biomass rather than the division rate of the population, emphasized here during the climax transition of NAAMES. However, by examining differences in growth rate we are able to glean important information about the growth conditions and strategies implemented by the phytoplankton community as they adapt to the limitations imposed by their extant environment. If we are to further our understanding of global carbon cycling, more detailed knowledge of the spatial and temporal dynamics of phytoplankton division rate are required. Such an understanding of the physiological behaviors of diverse phytoplankton will not only provide insight into the resulting taxonomic composition of the phytoplankton community but also resolve the grazing population and the predator-prey dynamics that notably dictate the fate of the fixed carbon.
Data Availability Statement
The data presented are available from the SeaBASS data repository at https://seabass.gsfc.nasa.gov/experiment/NAAMES. Information concerning the collection and processing of inorganic nutrient samples are also available from SeaBASS. All scripts generated for this study are available on request from the corresponding author.
Author Contributions
All authors contributed to either data collection, processing, or analysis. JF wrote the manuscript with guidance from KH and MB. All co-authors contributed to editing the manuscript.
Funding
This work was supported by NASA Grants NNX15AAF30G and 80NSSC17K568 to MB and NNX15AE70G to KH.
Conflict of Interest
The authors declare that the research was conducted in the absence of any commercial or financial relationships that could be construed as a potential conflict of interest.
Acknowledgments
We would like to thank the captain and crew of the R/V Atlantis for their support throughout the NAAMES field program. We would also like to thank all those who provided supporting data and Luis Bolanos who offered important insight into community composition dynamics.
Supplementary Material
The Supplementary Material for this article can be found online at: https://www.frontiersin.org/articles/10.3389/fmars.2020.00024/full#supplementary-material
References
Antoine, D., André, J.-M., and Morel, A. (1996). Oceanic primary production: 2. Estimation at global scale from satellite (Coastal Zone Color Scanner) chlorophyll. Glob. Biogeochem. Cycles 10, 57–69. doi: 10.1029/95gb02832
Behrenfeld, M. J. (2014). Climate-mediated dance of the plankton. Nat. Clim. Change 4, 880–887. doi: 10.1038/nclimate2349
Behrenfeld, M. J., and Boss, E. S. (2014). Resurrecting the ecological underpinnings of ocean plankton blooms. Annu. Rev. Mar. Sci. 6, 167–194. doi: 10.1146/annurev-marine-052913-021325
Behrenfeld, M. J., Boss, E., Siegel, D. A., and Shea, D. M. (2005). Carbon-based ocean productivity and phytoplankton physiology from space. Global Biogeochem. Cycles 19, 1–14.
Behrenfeld, M. J., and Boss, E. S. (2018). Student’s tutorial on bloom hypotheses in the context of phytoplankton annual cycles. Glob. Change Biol. 24, 55–77. doi: 10.1111/gcb.13858
Behrenfeld, M. J., and Falkowski, P. G. (1997a). A consumer’s guide to phytoplankton primary productivity models. Limnol. Oceanogr. 42, 1479–1491. doi: 10.4319/lo.1997.42.7.1479
Behrenfeld, M. J., and Falkowski, P. G. (1997b). Photosynthetic rates derived from satellite-based chlorophyll concentration. Limnol. Oceanogr. 42, 1–20. doi: 10.4319/lo.1997.42.1.0001
Behrenfeld, M. J., Moore, R. H., Hostetler, C. A., Graff, J., Gaube, P., Russell, L. M., et al. (2019). The North Atlantic Aerosol and marine ecosystem study (NAAMES): science motive and mission overview. Front. Mar. Sci. 6:122. doi: 10.3389/fmars.2019.00122
Behrenfeld, M. J., O’Malley, R. T., Boss, E. S., Westberry, T. K., Graff, J. R., Halsey, K. H., et al. (2016). Revaluating ocean warming impacts on global phytoplankton. Nat. Clim. Change 6, 323–330. doi: 10.1038/nclimate2838
Behrenfeld, M. J., O’Malley, R. T., Siegel, D. A., McClain, C. R., Sarmiento, J. L., Feldman, G. C., et al. (2006). Climate-driven trends in contemporary ocean productivity. Nature 444, 752–755. doi: 10.1038/nature05317
Behrenfeld, M. J., Westberry, T. K., Boss, E. S., O’Malley, R. T., Siegel, D. A., Wiggert, J. D., et al. (2009). Satellite-detected fluorescence reveals global physiology of ocean phytoplankton. Biogeosciences 6, 779–794. doi: 10.5194/bg-6-779-2009
Bidle, K. D. (2015). The molecular ecophysiology of programmed cell death in marine phytoplankton. Annu. Rev. Mar. Sci. 7, 341–375. doi: 10.1146/annurev-marine-010213-135014
Blondeau-Patissier, D., Gower, J. F. R. R., Dekker, A. G., Phinn, S. R., and Brando, V. E. (2014). A review of ocean color remote sensing methods and statistical techniques for the detection, mapping and analysis of phytoplankton blooms in coastal and open oceans. Prog. Oceanogr. 123, 123–144. doi: 10.1016/j.pocean.2013.12.008
Boss, E., Swift, D., Taylor, L., Brickley, P., Zaneveld, R., Riser, S., et al. (2008). Observations of pigment and particle distributions in the western North Atlantic from an autonomous float and ocean color satellite. Limnol. Oceanogr. 53(5 Pt 2), 2112–2122. doi: 10.4319/lo.2008.53.5_part_2.2112
Boss, E., Twardowski, M. S., and Herring, S. (2001). Shape of the particulate beam attenuation spectrum and its inversion to obtain the shape of the particulate size distribution. Appl. Opt. 40:4885. doi: 10.1364/ao.40.004885
Boss, E. S., Collier, R., Larson, G., Fennel, K., and Pegau, W. S. (2007). Measurements of spectral optical properties and their relation to biogeochemical variables and processes in Crater Lake. Crater Lake National Park, OR. Hydrobiologia 574, 149–159. doi: 10.1007/978-1-4020-5824-0_9
Boyd, P. W., Claustre, H., Levy, M., Siegel, D. A., and Weber, T. (2019). Multi-faceted particle pumps drive carbon sequestration in the ocean. Nature 568, 327–335. doi: 10.1038/s41586-019-1098-2
Bracher, A., Bouman, H. A., Brewin, R. J. W., Bricaud, A., Brotas, V., Ciotti, A. M., et al. (2017). Obtaining phytoplankton diversity from ocean color: a scientific roadmap for future development. Front. Mar. Sci. 4:55. doi: 10.3389/fmars.2017.00055
Briggs, N., Guemundsson, K., Cetinić, I., D’Asaro, E., Rehm, E., Lee, C., et al. (2018). A multi-method autonomous assessment of primary productivity and export efficiency in the springtime North Atlantic. Biogeosciences 15, 4515–4532. doi: 10.5194/bg-15-4515-2018
Burt, W. J., Westberry, T. K., Behrenfeld, M. J., Zeng, C., Izett, R. W., and Tortell, P. D. (2018). Carbon: chlorophyll ratios and net primary productivity of subarctic pacific surface waters derived from autonomous shipboard sensors. Glob. Biogeochem. Cycles 32, 267–288. doi: 10.1002/2017gb005783
Cetinić, I., Perry, M. J., Briggs, N. T., Kallin, E., D’Asaro, E. A., and Lee, C. M. (2012). Particulate organic carbon and inherent optical properties during 2008 North Atlantic bloom experiment. J. Geophys. Res. Oceans 117:C06028.
Cetinić, I., Poulton, N., and Slade, W. H. (2016). Characterizing the phytoplankton soup: pump and plumbing effects on the particle assemblage in underway optical seawater systems. Opt. Express 24:20703. doi: 10.1364/OE.24.020703
Della Penna, A., and Gaube, P. (2019). Overview of (Sub)mesoscale ocean dynamics for the NAAMES field program. Front. Mar. Sci. 6:384. doi: 10.3389/fmars.2019.00384
Estapa, M. L., Feen, M. L., and Breves, E. (2019). Direct observations of biological carbon export from profiling floats in the subtropical North Atlantic. Glob. Biogeochem. Cycles 33, 282–300. doi: 10.1029/2018gb006098
Field, C. B., Behrenfeld, M. J., Randerson, J. T., and Falkowski, P. G. (1998). Primary production of the biosphere: integrating terrestrial and oceanic components. Science 281, 237–240. doi: 10.1126/science.281.5374.237
Finkel, Z. V., Beardall, J., Flynn, K. J., Quigg, A., Rees, T. A. V., and Raven, J. A. (2010). Phytoplankton in a changing world: cell size and elemental stoichiometry. J. Plankton Res. 32, 119–137. doi: 10.1093/plankt/fbp098
Follows, M., and Dutkiewicz, S. (2001). Meteorological modulation of the North Atlantic spring bloom. Deep Sea Res. II Top. Stud. Oceanogr. 49, 321–344. doi: 10.1016/s0967-0645(01)00105-9
Friedland, K. D., Record, N. R., Asch, R. G., Kristiansen, T., Saba, V. S., Drinkwater, K. F., et al. (2016). Seasonal phytoplankton blooms in the North Atlantic linked to the overwintering strategies of copepods. Elementa 4:99.
Geider, R., MacIntyre, H., and Kana, T. (1997). Dynamic model of phytoplankton growth and acclimation:responses of the balanced growth rate and the chlorophyll a:carbon ratio to light, nutrient-limitation and temperature. Mar. Ecol. Prog. Ser. 148, 187–200. doi: 10.3354/meps148187
Geider, R. J., Delucia, E. H., Falkowski, P. G., Finzi, A. C., Grime, J. P., Grace, J., et al. (2001). Primary productivity of planet earth: biological determinants and physical constraints in terrestrial and aquatic habitats. Glob. Change Biol. 7, 849–882. doi: 10.1046/j.1365-2486.2001.00448.x
Geider, R. J., Maclntyre, H. L., and Kana, T. M. (1998). A dynamic regulatory model of phytoplanktonic acclimation to light, nutrients, and temperature. Limnol. Oceanogr. 43, 679–694. doi: 10.4319/lo.1998.43.4.0679
Giering, S. L. C., Sanders, R., Lampitt, R. S., Anderson, T. R., Tamburini, C., Boutrif, M., et al. (2014). Reconciliation of the carbon budget in the ocean’s twilight zone. Nature 507, 480–483. doi: 10.1038/nature13123
Graff, J. R., and Behrenfeld, M. J. (2018). Photoacclimation responses in Subarctic Atlantic phytoplankton following a natural mixing-restratification event. Front. Mar. Sci. 5:209. doi: 10.3389/fmars.2018.00209
Graff, J. R., Westberry, T. K., Milligan, A. J., Brown, M. B., Dall’Olmo, G., van Dongen-Vogels, V., et al. (2015). Analytical phytoplankton carbon measurements spanning diverse ecosystems. Deep Sea Res. I Oceanogr. Res. Pap. 102, 16–25. doi: 10.1016/j.dsr.2015.04.006
Halsey, K., Milligan, A., and Behrenfeld, M. (2014). Contrasting strategies of photosynthetic energy utilization drive lifestyle strategies in ecologically important picoeukaryotes. Metabolites 4, 260–280. doi: 10.3390/metabo4020260
Halsey, K. H., and Jones, B. M. (2015). Phytoplankton strategies for photosynthetic energy allocation. Annu. Rev. Mar. Sci. 7, 265–297. doi: 10.1146/annurev-marine-010814-015813
Halsey, K. H., Milligan, A. J., and Behrenfeld, M. J. (2010). Physiological optimization underlies growth rate-independent chlorophyll-specific gross and net primary production. Photosynth. Res. 103, 125–137. doi: 10.1007/s11120-009-9526-z
Halsey, K. H., O’Malley, R. T., Graff, J. R., Milligan, A. J., and Behrenfeld, M. J. (2013). A common partitioning strategy for photosynthetic products in evolutionarily distinct phytoplankton species. New Phytol. 198, 1030–1038. doi: 10.1111/nph.12209
Hemsley, V. S., Smyth, T. J., Martin, A. P., Frajka-Williams, E., Thompson, A. F., Damerell, G., and Painter, S. C. (2015). Estimating oceanic primary production using vertical irradiance and chlorophyll profiles from ocean gliders in the North Atlantic. Environ. Sci. Technol. 49, 11612–11621. doi: 10.1021/acs.est.5b00608
Henson, S., Le Moigne, F., and Giering, S. (2019). Drivers of carbon export efficiency in the Global Ocean. Glob. Biogeochem. Cycles 33, 891–903. doi: 10.1029/2018gb006158
Henson, S. A., Dunne, J. P., and Sarmiento, J. L. (2009). Decadal variability in North Atlantic phytoplankton blooms. J. Geophys. Res. Oceans 114:C04013.
Huisman, J., van Oostveen, P., and Weissing, F. J. (1999). Critical depth and critical turbulence: two different mechanisms for the development of phytoplankton blooms. Limnol. Oceanogr. 44, 1781–1787. doi: 10.4319/lo.1999.44.7.1781
Laws, E. A., and Bannister, T. T. (1980). Nutrient- and light-limited growth of Thalassiosira fluviatilis in continuous culture, with implications for phytoplankton growth in the ocean. Limnol. Oceanogr. 25, 457–473. doi: 10.4319/lo.1980.25.3.0457
Li, W. K. W., Dickie, P. M., Harrison, W. G., and Irwin, B. D. (1993). Biomass and production of bacteria and phytoplankton during the spring bloom in the western North Atlantic Ocean. Deep Sea Res. II Top. Stud. Oceanogr. 40, 307–327. doi: 10.1016/0967-0645(93)90019-j
Litchman, E., and Klausmeier, C. A. (2008). Trait-based community ecology of phytoplankton. Annu. Rev. Ecol. Evol. Syst. 39, 615–639. doi: 10.1146/annurev.ecolsys.39.110707.173549
MacIntyre, H. L., Kana, T. M., Anning, T., and Geider, R. J. (2002). Photoacclimation of photosynthesis irradiance response curves and photosynthetic pigments in microalgae and cyanobacteria. J. Phycol. 38, 17–38. doi: 10.1046/j.1529-8817.2002.00094.x
Margalef, R. (1978). Life-forms of phytoplankton as survival alternatives in an unstable environment. Oceanol. Acta 1, 493–509.
Massicotte, P., Peeken, I., Katlein, C., Flores, H., Huot, Y., Castellani, G., et al. (2019). Sensitivity of phytoplankton primary production estimates to available irradiance under heterogeneous sea ice conditions. J. Geophys. Res. Oceans 124, 5436–5450. doi: 10.1029/2019jc015007
Mayot, N., D’Ortenzio, F., Uitz, J., Gentili, B., Ras, J., Vellucci, V., et al. (2017). Influence of the phytoplankton community structure on the spring and annual primary production in the Northwestern Mediterranean Sea. J. Geophys. Res. Oceans 122, 9918–9936. doi: 10.1002/2016jc012668
Mignot, A., Ferrari, R., and Claustre, H. (2018). Floats with bio-optical sensors reveal what processes trigger the North Atlantic bloom. Nat. Commun. 9, 1–9.
Moore, C. M., Mills, M. M., Arrigo, K. R., Berman-Frank, I., Bopp, L., Boyd, P. W., et al. (2013). Processes and patterns of oceanic nutrient limitation. Nat. Geosci. 6, 701–710.
Morel, A., Huot, Y., Gentili, B., Werdell, P. J., Hooker, S. B., and Franz, B. A. (2007). Examining the consistency of products derived from various ocean color sensors in open ocean (Case 1) waters in the perspective of a multi-sensor approach. Remote Sens. Environ. 111, 69–88. doi: 10.1016/j.rse.2007.03.012
O’Reilly, J. E., Maritorena, S., Mitchell, B. G., Siegel, D. A., Carder, K. L., Garver, S. A., et al. (1998). Ocean color chlorophyll algorithms for SEAWIFS. J. Geophys. Res. Oceans 103, 24937–24953. doi: 10.1029/98jc02160
Platt, T., and Sathyendranath, S. (1993). Estimators of primary production for interpretation of remotely sensed data on ocean color. J. Geophys. Res. 98, 14561–14576.
Rowe, G. T., Sibuet, M., Deming, J., Tietjen, J., and Khripounoff, A. (1990). Organic carbon turnover time in deep-sea benthos. Prog. Oceanogr. 24, 141–160. doi: 10.1371/journal.pone.0063796
Sanders, R., Henson, S. A., Koski, M., De La Rocha, C. L., Painter, S. C., Poulton, A. J., et al. (2014). The biological carbon pump in the North Atlantic. Prog. Oceanogr. 129, 200–218. doi: 10.1016/j.pocean.2014.05.005
Schmoker, C., Hernández-León, S., and Calbet, A. (2013). Microzooplankton grazing in the oceans: impacts, data variability, knowledge gaps and future directions. J. Plankton Res. 35, 691–706. doi: 10.1093/plankt/fbt023
Siegel, D. A., Buesseler, K. O., Behrenfeld, M. J., Benitez-Nelson, C. R., Boss, E., Brzezinski, M. A., et al. (2016). Prediction of the export and fate of global ocean net primary production: the EXPORTS science plan. Front. Mar. Sci. 3:22. doi: 10.3389/fmars.2016.00022
Siegel, D. A., Buesseler, K. O., Doney, S. C., Sailley, S. F., Behrenfeld, M. J., and Boyd, P. W. (2014). Global assessment of ocean carbon export by combining satellite observations and food-web models. Glob. Biogeochem. Cycles 28, 181–196. doi: 10.1002/2013gb004743
Silsbe, G. M., Behrenfeld, M. J., Halsey, K. H., Milligan, A. J., and Westberry, T. K. (2016). The CAFE model: a net production model for global ocean phytoplankton. Glob. Biogeochem. Cycles 30, 1756–1777. doi: 10.1002/2016gb005521
Slade, W. H., Boss, E., Dall’olmo, G., Langner, M. R., Loftin, J., Behrenfeld, M. J., et al. (2010). Underway and moored methods for improving accuracy in measurement of spectral particulate absorption and attenuation. J. Atmos. Ocean. Technol. 27, 1733–1746. doi: 10.1175/2010jtecho755.1
Smyth, T. J., Tilstone, G. H., and Groom, S. B. (2005). Integration of radiative transfer into satellite models of ocean primary production. J. Geophys. Res. C Oceans 110, 1–11.
Sverdrup, H. U. (1953). On conditions for the vernal blooming of phytoplankton. ICES J. Mar. Sci. 18, 287–295. doi: 10.1093/icesjms/18.3.287
Talmy, D., Blackford, J., Hardman-Mountford, N. J., Dumbrell, A. J., and Geider, R. J. (2013). An optimality model of photoadaptation in contrasting aquatic light regimes. Limnol. Oceanogr. 58, 1802–1818. doi: 10.4319/lo.2013.58.5.1802
Tilman, D. (1996). Biodiversity: population versus ecosystem stability. Ecology 77, 350–363. doi: 10.2307/2265614
Uitz, J., Claustre, H., Gentili, B., and Stramski, D. (2010). Phytoplankton class-specific primary production in the world’s oceans: seasonal and interannual variability from satellite observations. Glob. Biogeochem. Cycles 24, 1–19.
Van Heukelem, L., and Thomas, C. S. (2001). Computer-assisted high-performance liquid chromatography method development with applications to the isolation and analysis of phytoplankton pigments. J. Chromatogr. A 910, 31–49. doi: 10.1016/s0378-4347(00)00603-4
Westberry, T., Behrenfeld, M. J., Siegel, D. A., and Boss, E. (2008). Carbon-based primary productivity modeling with vertically resolved photoacclimation. Glob. Biogeochem. Cycles 22, 1–18.
Westberry, T. K., Schultz, P., Behrenfeld, M. J., Dunne, J. P., Hiscock, M. R., Maritorena, S., et al. (2016). Annual cycles of phytoplankton biomass in the subarctic Atlantic and Pacific Ocean. Glob. Biogeochem. Cycles 30, 175–190. doi: 10.1002/2015gb005276
Worden, A. Z., Follows, M. J., Giovannoni, S. J., Wilken, S., Zimmerman, A. E., and Keeling, P. J. (2015). Rethinking the marine carbon cycle: factoring in the multifarious lifestyles of microbes. Science 347:1257594. doi: 10.1126/science.1257594
Keywords: phytoplankton, NPP, carbon, photoacclimation, modeling, optics, North Atlantic
Citation: Fox J, Behrenfeld MJ, Haëntjens N, Chase A, Kramer SJ, Boss E, Karp-Boss L, Fisher NL, Penta WB, Westberry TK and Halsey KH (2020) Phytoplankton Growth and Productivity in the Western North Atlantic: Observations of Regional Variability From the NAAMES Field Campaigns. Front. Mar. Sci. 7:24. doi: 10.3389/fmars.2020.00024
Received: 06 November 2019; Accepted: 14 January 2020;
Published: 07 February 2020.
Edited by:
Dongyan Liu, East China Normal University, ChinaReviewed by:
Timothy James Smyth, Plymouth Marine Laboratory, United KingdomFang Shen, East China Normal University, China
Copyright © 2020 Fox, Behrenfeld, Haëntjens, Chase, Kramer, Boss, Karp-Boss, Fisher, Penta, Westberry and Halsey. This is an open-access article distributed under the terms of the Creative Commons Attribution License (CC BY). The use, distribution or reproduction in other forums is permitted, provided the original author(s) and the copyright owner(s) are credited and that the original publication in this journal is cited, in accordance with accepted academic practice. No use, distribution or reproduction is permitted which does not comply with these terms.
*Correspondence: Kimberly H. Halsey, halseyk@science.oregonstate.edu