
Understanding Credit Card Usage Behavior of Elderly Korean Consumers for Sustainable Growth: Implications for Korean Credit Card Companies


1
KDI School of Public Policy and Management, 263 Namsejong-ro, Sejong-si 30149, Korea
2
College of Business Administration, Soongsil University, 369 Sangdo-ro, Dongjak-gu, Seoul 06978, Korea
*
Author to whom correspondence should be addressed.
Sustainability 2021, 13(7), 3817; https://doi.org/10.3390/su13073817
Submission received: 23 February 2021
/
Revised: 22 March 2021
/
Accepted: 25 March 2021
/
Published: 30 March 2021
(This article belongs to the Special Issue Sustainable Business Models: Implications for Consumer Marketing)
Abstract
:The Republic of Korea is the fastest aging country in the world, and its silver market, which is the market segment broadly defined as senior citizens, began to emerge in 2008 as Korean baby boomers started to retire. Given that the assets of households headed by individuals 55 years of age and over are much higher than those of average Korean households, it is essential for Korean financial institutions targeting elderly consumer groups to understand their credit card usage behavior, as it can be very attractive and provide the potential to lead to sustainable growth for institutions, while the market targeting for this group has not been well developed yet. This study examined elderly Korean consumers’ credit card usage behavior in terms of key demographic variables. In this study, we found that the number of cards owned was negatively related to age and positively related to income level. In addition, those who were not retired owned more credit cards than those who were. Although the average monthly expenditure by credit cards was positively related to income, it was not significantly different in terms of age or retirement status. The findings from this research provide significant implications for marketers of credit card companies when searching for key target groups, particularly elderly consumers.
1. Introduction
The Republic of Korea (hereafter Korea) is the fastest aging country in the world. Korean population estimates reveal that the senior population over the age of 65 is increasing, while the younger population under the age of 14 is shrinking to more than half of that in the 1960s. The number of elderly persons has already doubled over the last 15 years, and is forecast to double again over the next 15 years [1].
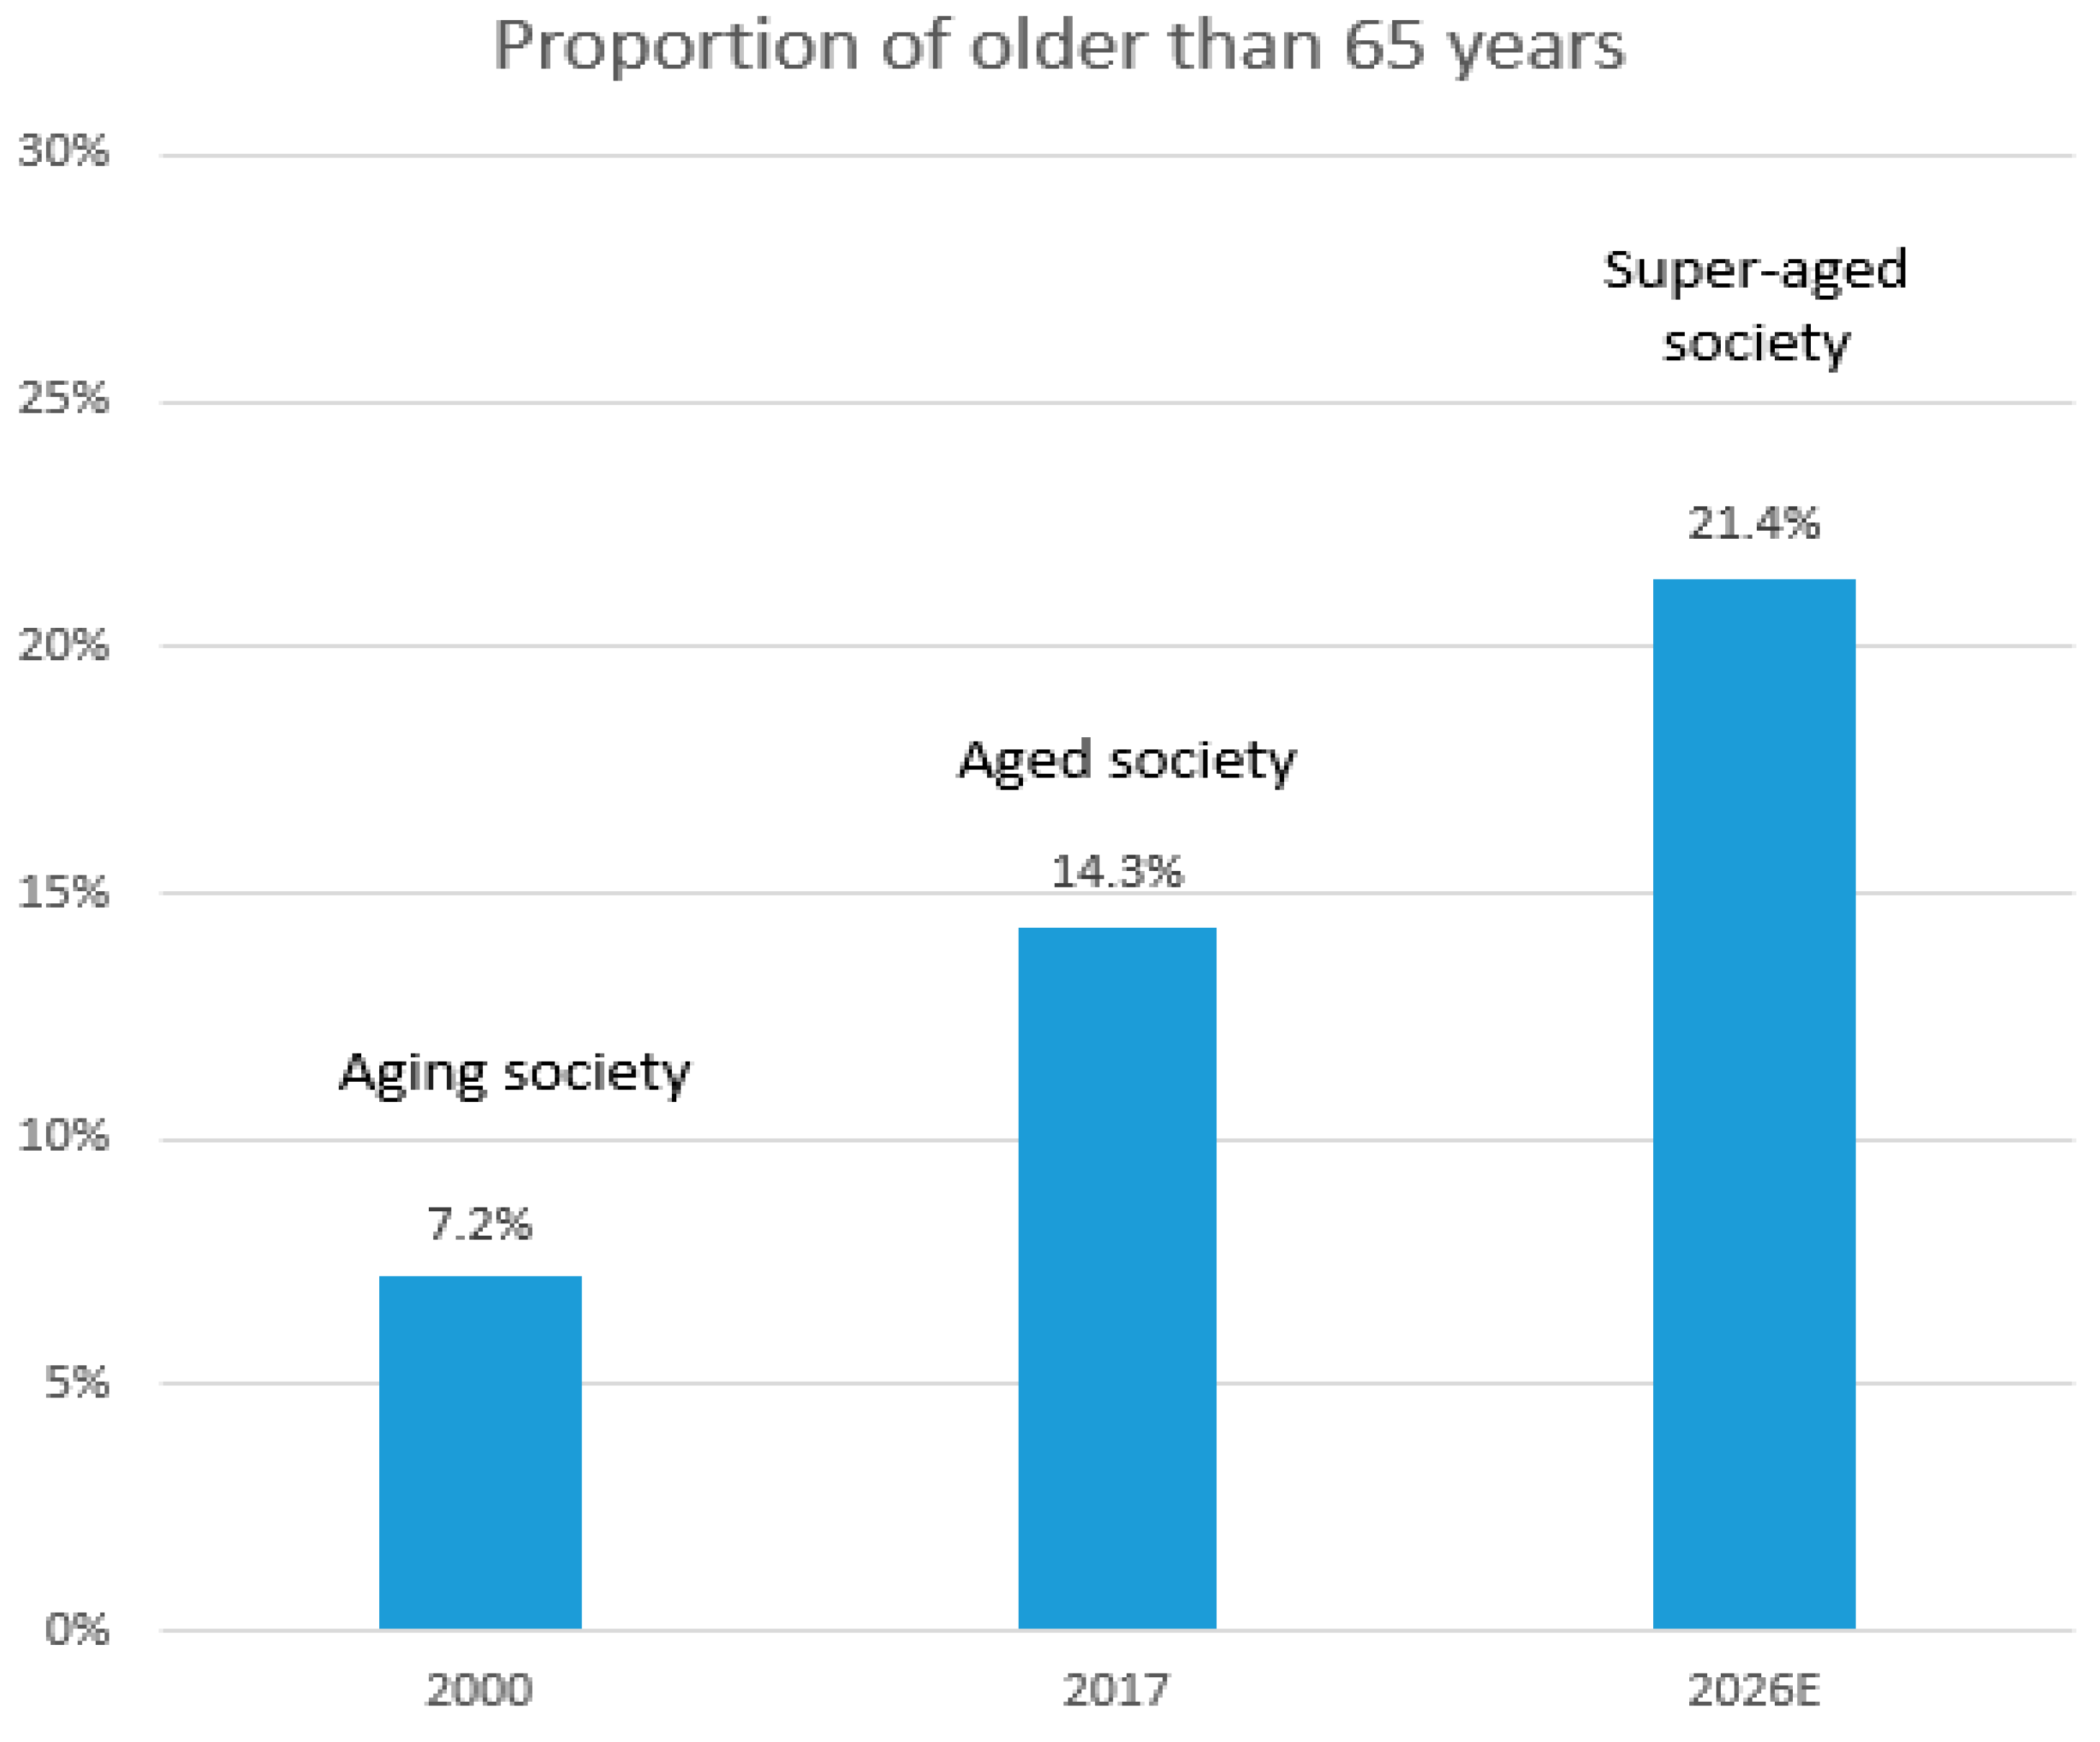
According to the United Nations, a country is classified as an “aging society” when more than 7% of its population is older than 65 years. When the percentage reaches over 14%, it is classified as an “aged society.” When more than 21% of the population is older than 65, the country is referred to as a “super- or hyper-aged society” [2]. According to the Korea National Statistics Office, Korea became an aging country in 2000 by having 7.2% of its population older than 65 years, and then became an aged society in 2017 by having 14.3% of its population older than 65 years. In addition, it is expected to become a super-aged country by 2026 with an estimated 21.4% of its population aged over 65 years [1] as shown in Figure 1.
No other country in the world has aged as quickly as Korea. It took France 115 years, the United States 69 years, and the United Kingdom 45 years to progress from an aging society to an aged society [3]. Korea made this transition in less than 20 years. Therefore, unlike other developed countries, which have had much more time to deal with their aged populations, Korea has to prepare for the issues associated with its aging population (e.g., leading to a smaller consumer base and talent shortage, employment, and income) within a much shorter timeframe [4,5,6].
2. Silver Economy and a Sustainable New Market Segment
From the marketer’s perspective, this population shift means a shift in market power; a bigger piece of the total market indicates higher demand [7,8]. Shifts in the age structure of a society can open new market opportunities due to rising demands for the so-called “silver market,” which targets the mature demographic segment of consumers [9]. According to industry estimates, the silver market in Korea began to emerge in 2008 as Korean baby boomers started to retire. It is estimated that this demographic group will become a 148 trillion KRW (approximately 135 billion USD as approximately 1100 KRW is 1 USD as of February 2021) market by 2020. The expected growth rate of this market is 12.9%, which significantly exceeds the overall consumer market growth rate of 4.7%, and the proportion of the silver market is only 47.7% of total market while the proportions in Japan and Germany reach 85.2% and 59.1%, respectively [10,11].
While this growing senior segment has long been ignored by marketers [12], support for the high growth rate of the silver market is evidenced by the amount of assets held by the mature population. In the United States, people aged 55 and over control more than 70% of the nation’s assets, and more than half of the discretionary income [13,14]. In Korea, the net assets of households headed by individuals aged over 60 years are higher than those of younger generations aged below 40 years [11], while their average annual incomes are not relatively high, as shown in Table 1 [15].
In the meantime, the average propensity to consume (APC) excluding education expenditure of seniors has significantly increased, as shown in Table 2 [16]. In addition, people are living longer; thus, when considering the lifetime value of these consumers, senior consumers spend money for the longest duration at this later-life stage than at any other traditional marketing stage [17]. This means that in terms of sheer size, economic power, creditworthiness, and longevity of demands, the elderly consumer market is increasingly important.
While marketing that targets this elderly consumer group has not been adequately researched nor practiced, it is apparent that among other industries, the financial sector will face abundant market opportunities because of the wealth possessed by this group [18]. Therefore, understanding these elderly consumers’ credit card usage behavior has become vital to financial institutions. In doing so, it is expected that meaningful patterns of their consumption behavior can be identified in order to provide practical implications for marketers of financial institutions for their sustained growth in the upcoming era of a super aged country.
The objective of this study was to examine elderly Korean consumers’ credit card usage behavior in terms of key demographic variables. In this study, we found that the number of cards owned was negatively related to age and positively related to income level. In addition, those who were not retired owned more credit cards than those who were. Although the average monthly expenditure by credit cards was positively related to income, it was not significantly different in terms of age or retirement status. The findings from this research provide significant implications for marketers of credit card companies when searching for key target groups, particularly elderly consumers.
The rest part of this paper is organized as follows: The next section presents the relevant literature and hypotheses. Next, we describe the data collection. Then, we discuss the results from empirical analysis and managerial implications for marketers of credit card companies for their sustainable new market segment.
3. Aging and Credit Card Usage Behavior
Early work in gerontology has focused on explaining the behavior of an aging population in society. Disengagement theory holds that upon retirement, both society and elderly persons are mutually obliged to withdraw from one another, and a new equilibrium is reached that is satisfying to both the elderly and society [19,20,21,22]. With advancing age, elderly people’s social networks shrink, family size decreases, and consumption needs in general decrease, including financial products, such as credit cards [23]. Biophysical changes in various body systems may deter elderly people’s ability to shop around [24,25]. In addition, models of cognition have been explained in the field of consumer behavior to study the development and change in patterns of information-processing and decision-making of an aging population [26]. This change may also contribute to a reduced need for credit cards as people age. Thus, it is predicted that age is inversely related to credit card use among elderly people. Consequently, the following hypothesis is suggested:
Hypothesis 1 (H1).
The older the elderly person, the more likely the person is (a) to have fewer credit cards and (b) to spend less money using those credit cards.
Activity or engagement theory in gerontology holds that an elderly person’s psychological and social wellbeing is based on various types of activities pertinent to a given role (e.g., profession). As they experience exit from their obligatory roles, the elderly engage in compensatory activities to remain socially and psychologically fit [20,21,22]. However, whether an elderly person will maintain a socially and psychologically active lifestyle depends on the availability of resources. Income is expected to enable an elderly person to stay engaged, and therefore affects financial services such as credit card use [27,28]. Income may affect an elderly person’s credit card usage behavior in a number of ways. First, a high level of income may attract many opportunities to obtain various credit cards. Second, the availability of higher credit limits will affect the ability of people with higher incomes to use credit cards on various occasions. Third, a person’s income per se is likely to affect his/her inclination to purchase more products (therefore, more opportunities to use credit cards). Thus, it is expected that those with higher incomes will also be heavier users of credit cards. Therefore, we hypothesize the following:
Hypothesis 2 (H2).
The higher the elderly person’s income, the more likely the person is (a) to have more credit cards and (b) to spend more money using those credit cards.
People tend to experience various events at different ages that affect their behavior in later life [29]. For example, Schau et al. explained retirement as an unwelcome transition [30]. An employed elderly person is likely to experience more occasions where using a credit card is advantageous. For example, companies may require credit card payments as a proof of payment for expense-reporting. In addition, regular income may encourage the use of credit cards. On the contrary, in line with the disengagement theory [19,20,21,22], a person who is no longer employed may not have similar needs or situations as before. Thus, one can expect those who are retired to make less use of credit cards. Therefore, we propose the following hypothesis:
Hypothesis 3 (H3).
Elderly people who are retired are more likely (a) to have fewer credit cards and (b) to spend less money using credit cards.
4. Data Collection
A survey was conducted across four major cities in Korea during a one-month period using a quota sampling approach with the support from a professional market research company. Quotas were set first for the gender and age categories, based on population statistics. Then, they were adjusted to ensure a certain minimum number of respondents for each subcategory. A total of 750 valid responses were collected. Age quotas were set for five age groups with 150 samples for each age quota: (1) 60–64, (2) 65–69, (3) 70–74, (4) 75–79, and (5) 80+. Credit card usage behavior was measured in terms of the number of credit cards owned and the average monthly amount charged using credit cards. A total of 24.1% (n = 181) of the sample owned at least one credit card. Among those who owned credit cards, the average monthly amount charged using credit cards was KRW 260,000 (approximately 236 USD). More detailed statistics regarding the sample are presented in Table 3.
5. Empirical Results
5.1. Main Effects
In order to test the predicted differences in credit card usage among the elderly, chi-square tests were conducted first, because the number of credit cards owned and the average amount charged using credit cards were measured on a categorical scale. Although they were measured using a categorical scale, the response categories were arranged in a continuous manner. Hence, ANOVA (analysis of variance) and t-tests were conducted together by converting them into a continuous scale. The analysis was conducted using SPSS Statistics 21. The test results are summarized in Table 3 and Table 4.
In terms of the number of credit cards owned, both chi-square tests and mean comparison tests support the predicted differences. The number of credit cards owned was found to be negatively related to age (χ2 = 129.4, p < 0.001; Gamma = −0.58, p < 0.001) and positively related to income (χ2 = 112.8, p < 0.001; Gamma = 0.49, p < 0.001). Retired elderly individuals owned fewer credit cards than those not retired (χ2 = 31.7, p < 0.001; Cramer’s V = 0.21, p < 0.001). The comparisons regarding the average number of credit cards owned also confirm the predicted difference in age (F = 31.4, p < 0.001), income (F = 19.7, p < 0.001), and retirement status (F = 21.2, p < 0.001). Thus, hypotheses 1(a), 2(a), and 3(a) are supported.
As for the average monthly amount charged using credit cards, the predicted difference was observed for income only (χ2 = 33.7, p < 0.05; Gamma = 0.31, p < 0.001), thus supporting hypothesis 2(b). No significant difference was found either for age (χ2 = 18.2, p = 0.58; Gamma = –0.08, p = 0.36) or for retirement status (χ2 = 5.1, p = 0.40; Cramer’s V = 0.17, p = 0.40). Thus, hypotheses 1(b) and 3(b) are not supported.
5.2. Exploratory Analysis on the Interaction Effect between Age and Income
The possibility of an interaction effect between age and income was further examined using ANOVA. It was expected that among those with high incomes, credit card ownership and usage would show little variance with age, since income enables the elderly to own more credit cards and to purchase more goods and services. However, among those with lower incomes, variations with age in both credit card ownership and usage were expected, as limited income may suppress credit card ownership and purchases.
To examine this relationship, the bottom two and upper two brackets of age and income groups were combined and compared to maximize the effects due to age, income, and their interaction. The ANOVA results are summarized in Table 5, and the relationship plots are presented in Figure 2 and Figure 3.
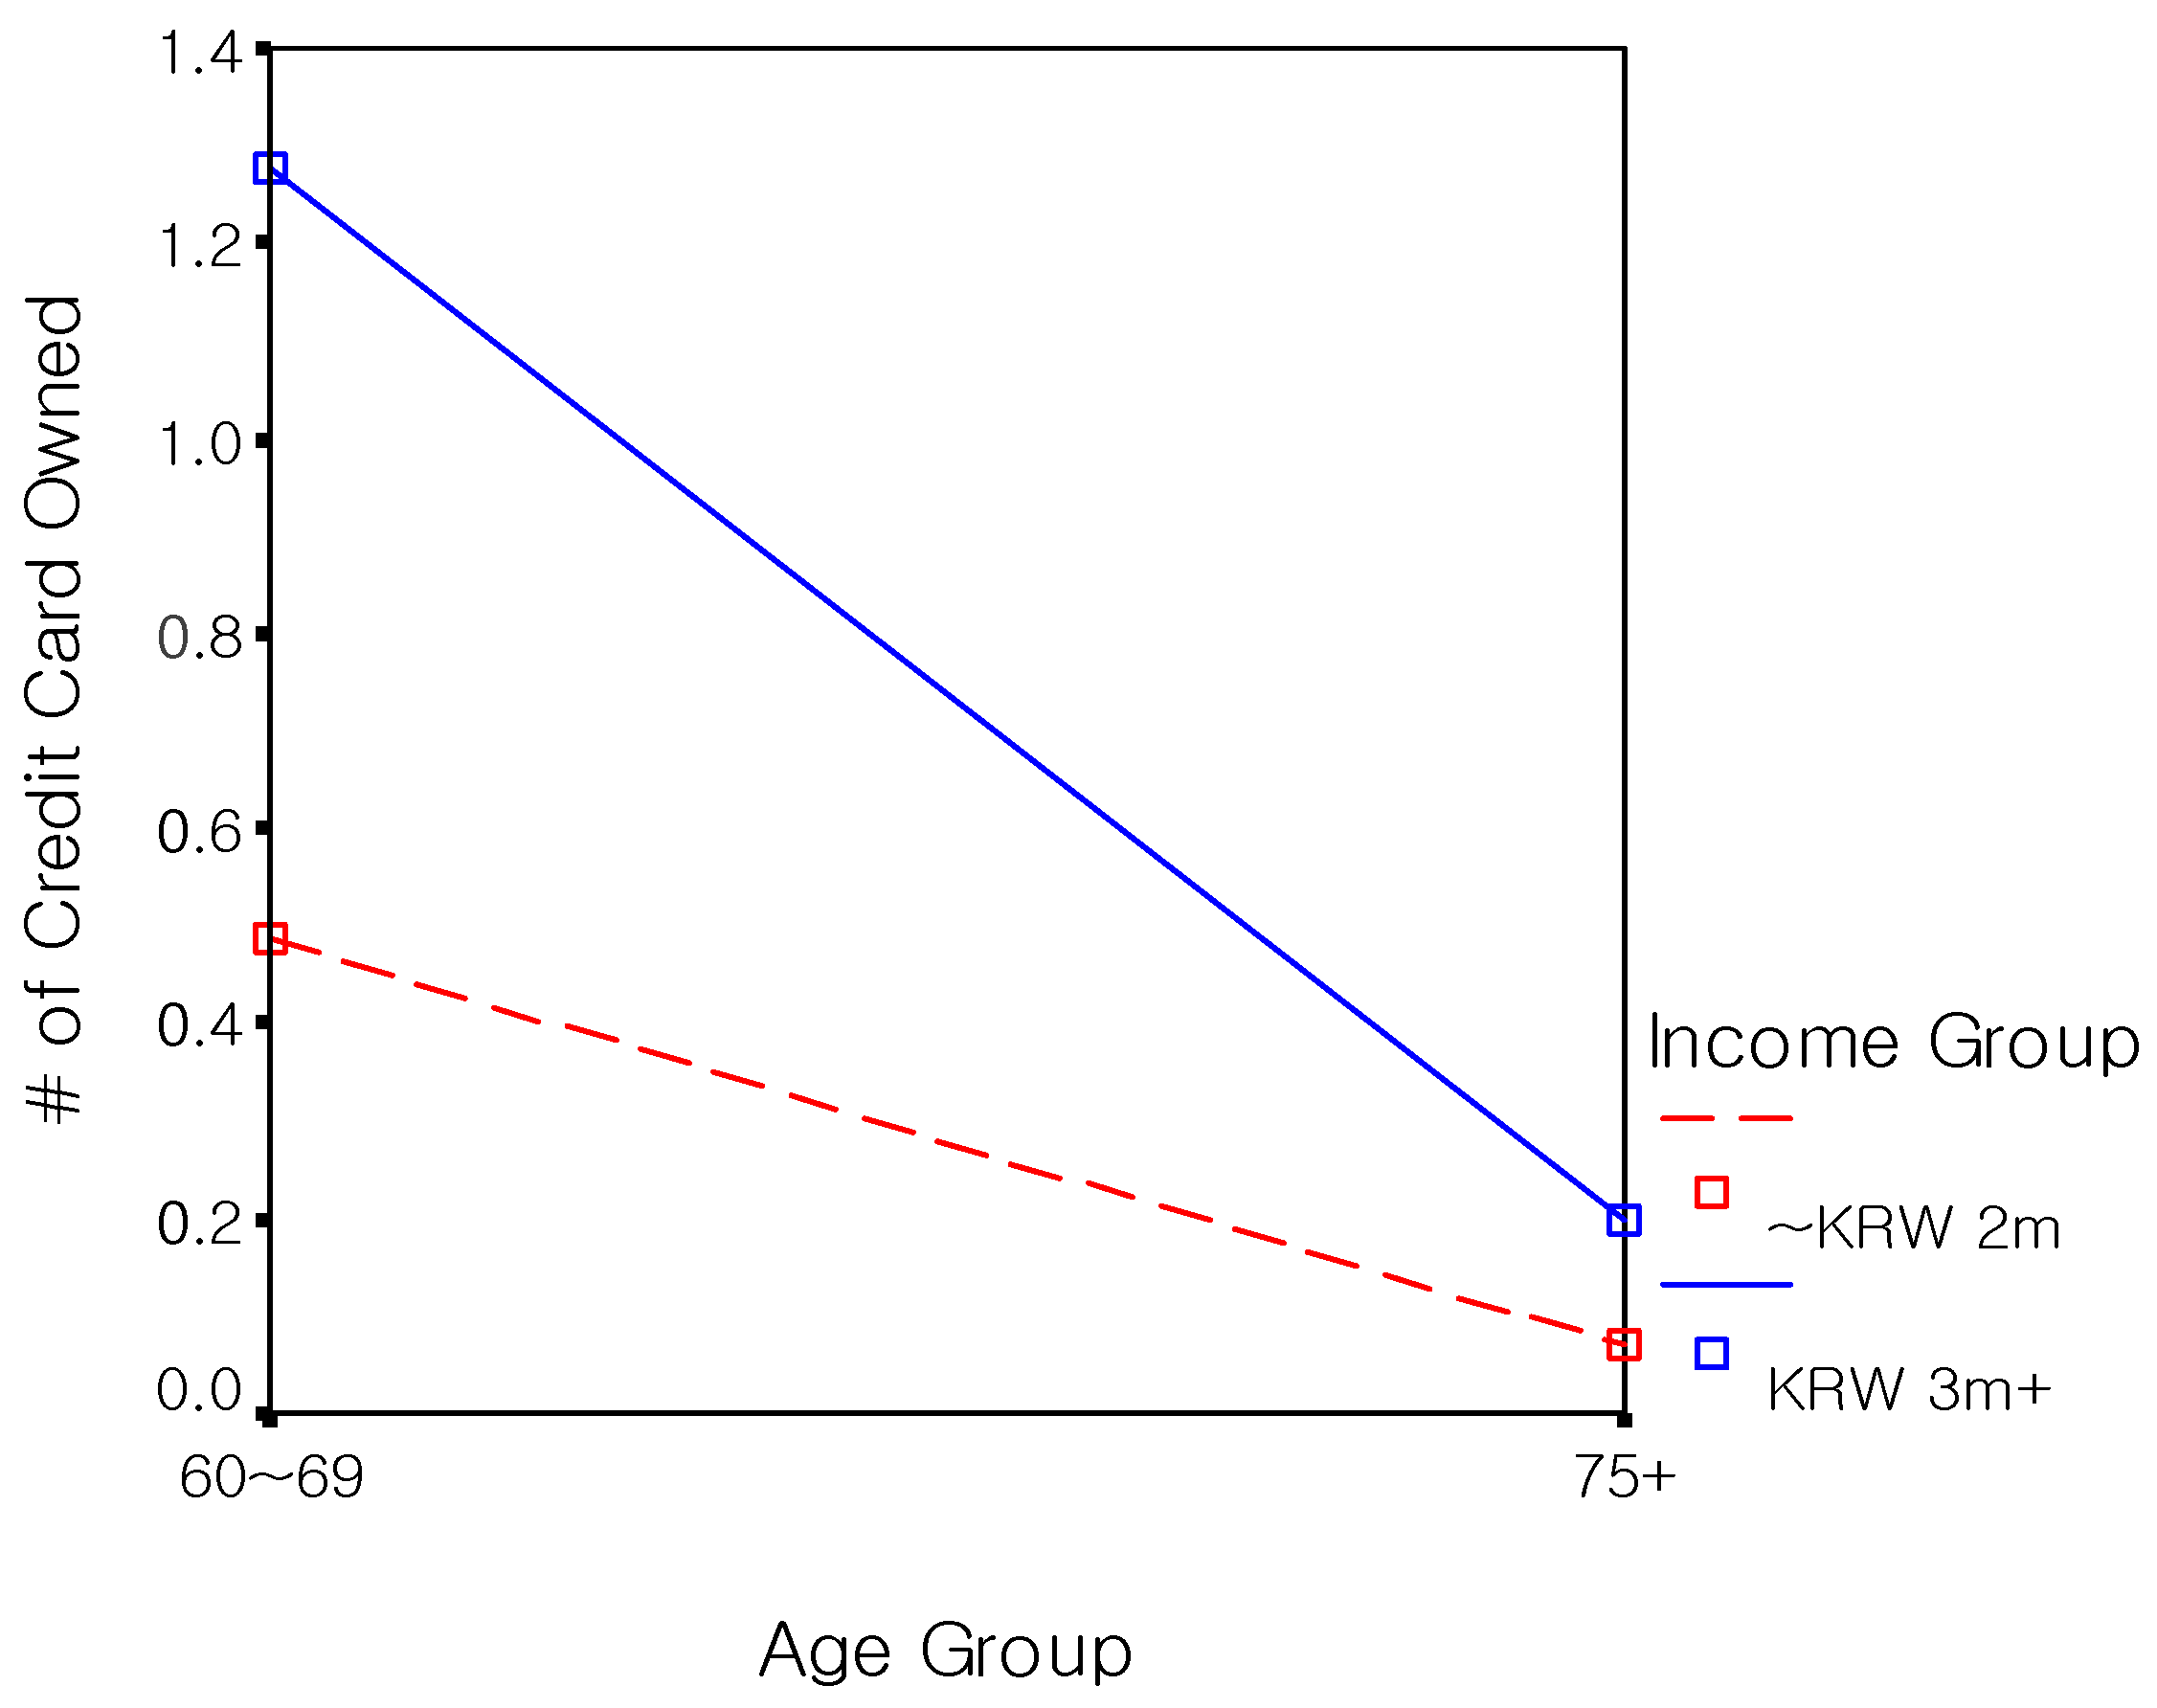
First, the results found significant main effects of age (F = 110.55, p < 0.01) and income (F = 41.43, p < 0.01), and a significant interaction effect of the two on credit card ownership (F = 21.54, p < 0.01). An examination of the response plot in Figure 2 reveals that the pattern of interaction observed on credit card ownership was not consistent with the prediction. Contrary to the expectation predicting a stronger effect of income over age at higher income levels, age seemed to have a stronger effect over income at both high and low levels of income. That is, credit card ownership decreased as age increased, in both the high- and low-income groups. We conjecture that this result may have arisen from the fact that many financial institutions have not sufficiently promoted their credit cards toward this age group as they did not fully perceive the emerging economic power of this group.
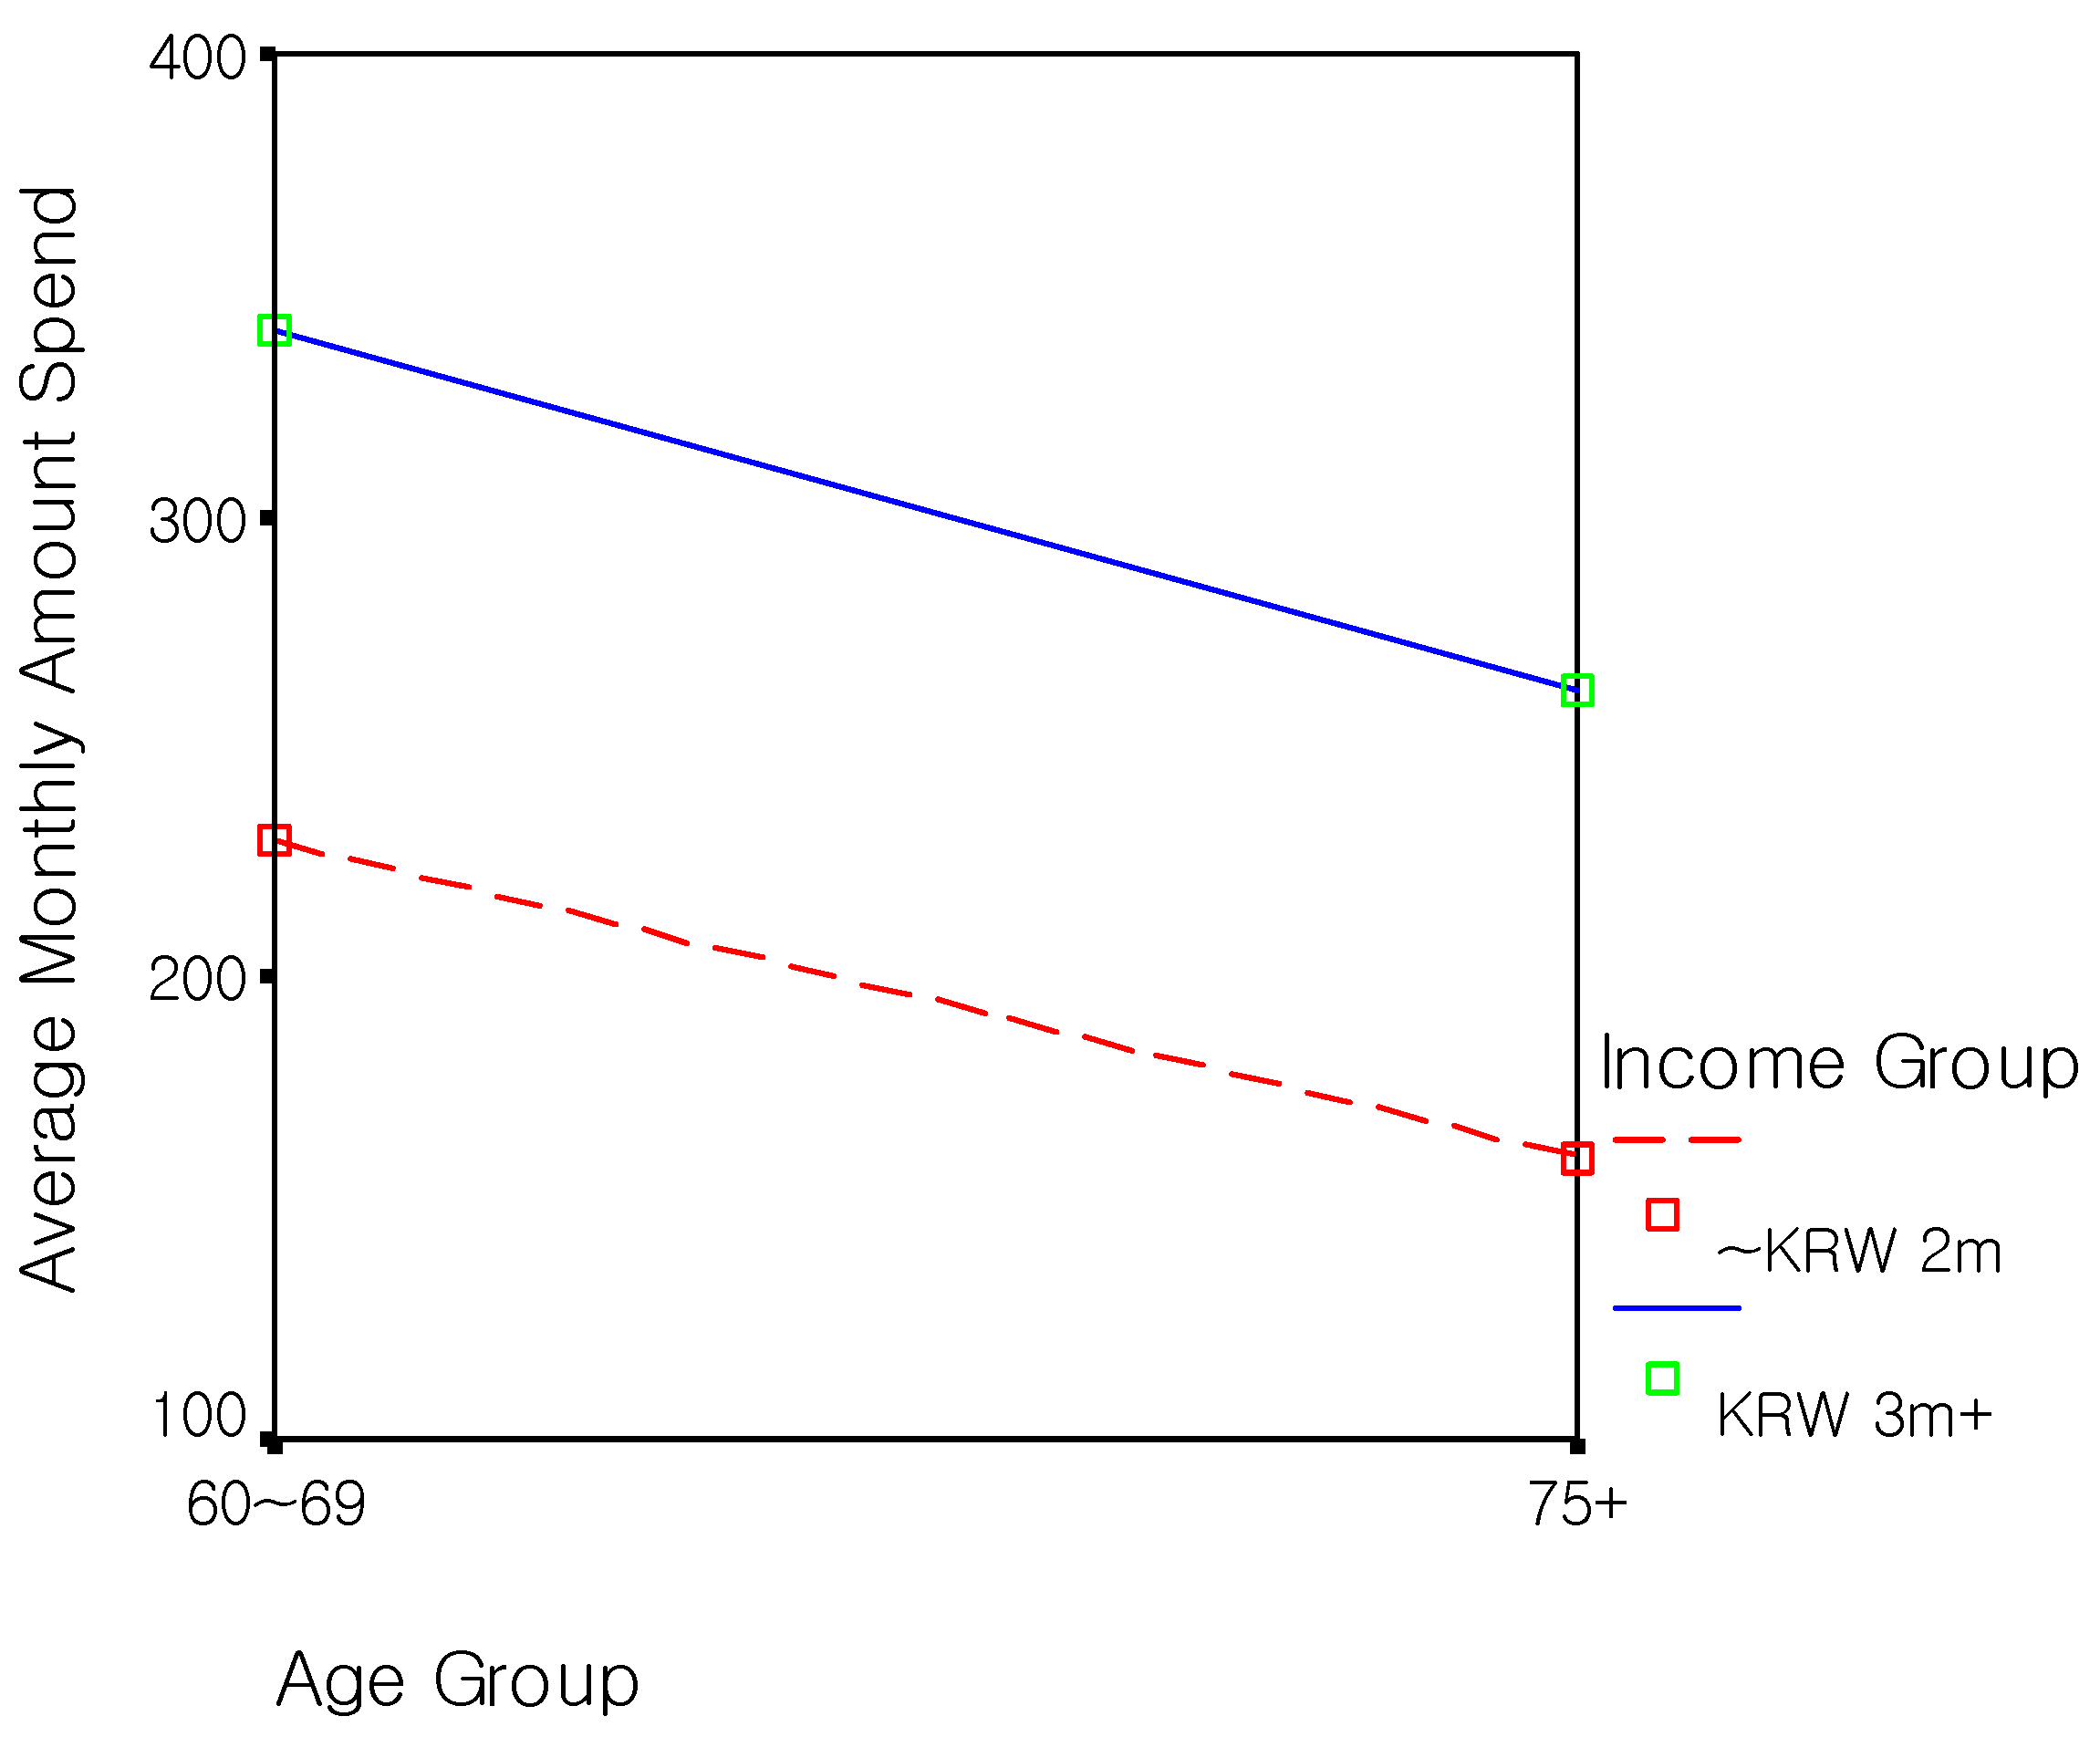
Second, the results of the amounts charged using credit cards showed a significant main effect of income only (F = 6.81, p < 0.05). The main effect of age and the interaction effect were not significant (F = 3.24, p = 0.08 and F = 0.01, p = 0.91, respectively). These findings suggest that income is the main factor that produces differences in the amounts charged using credit cards for elderly consumers.
6. Conclusions
This study examined the credit card usage behavior among elderly consumers in Korea. Credit card usage was predicted to vary according to age, income, and retirement status. The results showed that the number of cards owned was negatively related to age and positively related to income level. Those who were not retired owned more credit cards than those who were. Although the average monthly expenditure by credit card was positively related to income, as predicted, it was not significantly different in terms of age or retirement status.
As silver marketing that refers to marketing’s role in addressing the needs of older adults plays greater importance than ever before [8], the findings from this research provide significant implications for marketers of credit card companies when they are searching for key target groups, particularly elderly consumers. In general, revenues from credit cards come from two main sources: Membership and transaction fees. If a credit card company intends to increase its revenues from membership fees, or if it intends to increase its market share in the number of credit cards owned by elderly consumers, it also must target relatively younger, higher income, and non-retired groups of elderly consumers. Once the company reaches its target market share in the number of credit cards owned, it has to focus on high-income groups to generate revenue from transaction fees, because credit card expenditure among elderly consumers is influenced by their income level.
There are some limitations in conducting this research. While this research focused on investigating credit card usage behavior among elderly consumers in Korea, comparisons with younger consumer groups will be necessary in future research in order to develop a more complete understanding of elderly consumers’ credit card usage behavior. In addition, while our research focused on credit card as the financial sector will face abundant market opportunities with the wealth possessed by elderly consumers, future research can develop an examination and comparison across usage behavior on other financial products, non-financial products, and services.
Author Contributions
Conceptualization, K.J. and M.Y.K.; data collection and analysis, K.J. and M.Y.K.; writing—original draft preparation, K.J. and M.Y.K.; writing—review and editing, K.J. and M.Y.K.; visualization, K.J. and M.Y.K. All authors have read and agreed to the published version of the manuscript.
Funding
This research was supported by the KDI School Research Fund.
Conflicts of Interest
The authors declare no conflict of interest.
References
- Korea National Statistics Office. Population Projections for Korea: 2017~2067. 2019. Available online: http://kosis.kr/statisticsList/statisticsListIndex.do?menuId=M_01_01&vwcd=MT_ZTITLE&parmTabId=M_01_01&parentId=A.1;A41.2;A41_10.3;#SelectStatsBoxDiv (accessed on 10 January 2020).
- United Nations ESCAP. Ageing in Asia and the Pacific: Overview. 2017. Available online: https://www.unescap.org/resources/ageing-asia-and-pacific-overview (accessed on 10 January 2020).
- United Nations. World Population Ageing 2015. Available online: https://www.un.org/en/development/desa/population/publications/pdf/ageing/WPA2015_Report.pdf (accessed on 10 January 2020).
- Chiavacci, D. The social basis of developmental capitalism in Japan: From post-war mobilization to current stress symptoms and future disintegration. Asian Bus. Manag. 2007, 6, 35–55. [Google Scholar] [CrossRef]
- Nakata, Y.; Miyazaki, S. Has lifetime employment become extinct in Japanese enterprise? An empirical analysis of employment adjustment practices in Japanese companies. Asian Bus. Manag. 2007, 6, S33–S56. [Google Scholar] [CrossRef]
- Sekiguchi, T.; Froese, F.J.; Iguchi, C. International human resource management of Japanese multinational corporations: Challenges and future directions. Asian Bus. Manag. 2016, 15, 83–109. [Google Scholar] [CrossRef]
- Dychtwald, M.K. Marketplace 2000: Riding the wave of population change. J. Consum. Mark. 1997, 14, 271–275. [Google Scholar] [CrossRef]
- Nataraajan, R.; Bagozzi, R.P. The year 2000: Looking back. Psychol. Mark. 1999, 16, 631–642. [Google Scholar] [CrossRef]
- Kohlbacher, F.; Herstatt, C. The Silver Market Phenomenon: Marketing and Innovation in the Aging Society; Springer: New York, NY, USA, 2011. [Google Scholar]
- The Korea Chamber of Commerce and Industry. Growth Prospects of Korean Silver Industry; The Korea Chamber of Commerce and Industry: Seoul, Korea, 2006. [Google Scholar]
- The Korea Chamber of Commerce and Industry. Growth Prospects and Managerial Implications of Korean Silver Industry; The Korea Chamber of Commerce and Industry: Seoul, Korea, 2015. [Google Scholar]
- Bartos, R. Over 49: The invisible consumer market. Harv. Bus. Rev. 1980, 58, 140–148. [Google Scholar]
- Linden, F. Spending boom and bust. Am. Demogr. 1986, October, 4–6. [Google Scholar]
- SheerID. How to Market to Seniors. 2018. Available online: https://www.sheerid.com/how-to-market-to-seniors/ (accessed on 10 January 2020).
- Statistics Korea. Survey of Household Finances and Living Conditions. 2019. Available online: http://kostat.go.kr/portal/eng/pressReleases/6/3/index.board (accessed on 10 January 2020).
- Kwon, K.H.; Oh, J.Y. Changes in Consumption Propensity by Age Group and Its Macroeconomic Implications; Development Institute: Seoul, Korea, 2014. [Google Scholar]
- Nielson, J.; Curry, K. Creative strategies for connecting with mature individuals. J. Consum. Mark. 1997, 14, 310–322. [Google Scholar] [CrossRef]
- AARP. The 2017 Financial Innovation Frontiers Report. 2017. Available online: https://thefinancialbrand.com/64855/senior-banking-loyalty-digital-millennial-success/ (accessed on 10 January 2020).
- Atchley, R.C. Aging: Continuity and Change, 2nd ed.; Wadsworth Publishing: Belmont, CA, USA, 1987. [Google Scholar]
- Moschis, G.P. Marketing to Older Consumers; Quorum Books: Westport, CT, USA, 1992. [Google Scholar]
- Moschis, G.P. Marketing Strategies for the Mature Market; Quorum Books: Westport, CT, USA, 1994. [Google Scholar]
- Moschis, G.P. Gerontographics: Life-Stage Segmentation for Marketing Strategy Development; Quorum Books: Westport, CT, USA, 1996. [Google Scholar]
- Hurd, M.; Wise, D. Wealth depletion and life cycle consumption by the elderly. In Topics in the Economics of Aging; Wise, D., Ed.; University of Chicago Press: Chicago, IL, USA, 1989. [Google Scholar]
- Cristofalo, V.J. An overview of the theories of biological aging. In Emergent Theories of Aging; Birren, J.E., Bengston, V., Eds.; Springer: New York, NY, USA, 1988. [Google Scholar]
- Moschis, G.P. Consumer Behavior in Later Life: Multidisciplinary Contributions and Implication for Research; Working Paper; Georgia State University: Atlanta, GA, USA, 1991. [Google Scholar]
- Yoon, C.; Cole, C.A.; Lee, M.P. Consumer decision making and aging: Current knowledge and future directions. J. Consum. Psychol. 2009, 19, 2–16. [Google Scholar] [CrossRef] [Green Version]
- Moschis, G.P. Use of credit cards by older Americans. J. Serv. Mark. 1994, 8, 27–36. [Google Scholar]
- Kennett, P.; Moschis, G.; Bellenger, D. Marketing financial services to mature customers. J. Serv. Mark. 1995, 9, 62–72. [Google Scholar] [CrossRef]
- Elder, G.H., Jr.; George, L.K.; Shanahan, M.J. Psychosocial stress over the life course. In Psychosocial Stress: Perspectives on Structure, Theory, Life Course, and Methods; Kaplan, H.B., Ed.; Academic Press: New York, NY, USA, 1996. [Google Scholar]
- Schau, H.J.; Gilly, M.C.; Wolfinbarger, M. Consumer identity renaissance: The resurgence of identity inspired consumption in retirement. J. Consum. Res. 2009, 36, 255–276. [Google Scholar] [CrossRef]
Figure 1.
Elderly population in Korea.

Figure 2.
Credit card ownership by age and monthly income.

Figure 3.
Average monthly amount by age and income.


Table 1.
Assets and income by age group (unit: Ten thousand KRW).
| Age of Head of Household | Total Assets | Financial Assets | Non-Financial Assets | Annual Income |
|---|---|---|---|---|
| Average | 43,191 | 10,570 | 32,621 | 5828 |
| Below 30 | 10,994 | 6631 | 4363 | 3720 |
| 30–39 | 32,638 | 10,707 | 21,931 | 5982 |
| 40–49 | 46,967 | 12,973 | 33,994 | 7425 |
| 50–59 | 49,345 | 12,643 | 36,702 | 7407 |
| 60 and over | 42,026 | 7912 | 34,114 | 3877 |
Table 2.
Average propensity to consume (APC) excluding education expenditure.
| Year | Age Group | |||||
|---|---|---|---|---|---|---|
| 20–29 | 30–39 | 40–49 | 50–59 | 60–69 | 70 and Over | |
| 2003 | 0.71 | 0.65 | 0.63 | 0.64 | 0.69 | 0.75 |
| 2013 | 0.71 | 0.69 | 0.67 | 0.69 | 0.75 | 0.90 |
Table 3.
Number of credit cards owned.
| Demographics | Total (n = 750) | Number of Credit Card | Chi-Square | Average Number of Credit Cards 1 | F | ||||
|---|---|---|---|---|---|---|---|---|---|
| None (n = 569) | 1 (n = 94) | 2 (n = 61) | 3+ (n = 26) | ||||||
| Total | 100% | 75.9% | 12.5% | 8.1% | 3.5% | 0.39 | |||
| Age | 60~64 | 20.0% | 14.2% | 37.2% | 34.4% | 50.0% | 129.4 ** (Gamma = −0.58 **) | 0.77 a | 31.4 ** |
| 65~69 | 20.0% | 14.9% | 34.0% | 39.3% | 34.6% | 0.71 a | |||
| 70~74 | 20.0% | 22.1% | 13.8% | 13.1% | 11.5% | 0.25 b | |||
| 75~79 | 20.0% | 22.8% | 12.8% | 13.1% | 0% | 0.19 b,c | |||
| 80+ | 20.0% | 25.8% | 2.1% | 0% | 3.8% | 0.03 c | |||
| Income | Less than 1 m | 34.3% | 42.5% | 5.3% | 11.5% | 11.5% | 112.8 ** (Gamma = 0.49 **) | 0.11 a | 19.7 ** |
| 1~1.99 m | 26.4% | 25.3% | 37.2% | 24.6% | 15.4% | 0.39 b | |||
| 2~2.99 m | 15.7% | 13.2% | 30.9% | 21.3% | 3.8% | 0.49 b,c | |||
| 3~4.99 m | 21.1% | 17.0% | 24.5% | 37.7% | 57.7% | 0.72 c,d | |||
| More than 5 m | 2.5% | 1.9% | 2.1% | 4.9% | 11.5% | 0.90 d | |||
| Retired | Yes | 44.7% | 49.7% | 25.5% | 41.0% | 11.5% | 31.7 ** (Cramer’s V = 0.21 **) | 0.25 | 21.2 ** |
| No | 55.3% | 50.3% | 74.5% | 59.0% | 88.5% | 0.51 | |||
| Health status | Bad | 19.5% | 24.1% | 5.4% | 5.2% | 4.0% | 69.0 ** (Gamma = 0.56 **) | ||
| So-so | 39.2% | 42.7% | 32.3% | 22.4% | 28.0% | ||||
| Good | 41.3% | 33.3% | 62.4% | 72.4% | 68.0% | ||||
* p < 0.05, ** p < 0.01. a–d Means with different letters are significantly different (p < 0.05), whereas means that share the same letter are not significantly different (p < 0.05), based on Duncan contrasts. 1 The average number of credit cards was calculated by treating the categorical responses as a continuous scale.
Table 4.
Average monthly amount charged using credit cards.
| Demographics | Total (n = 181) | Monthly Amount Used (KRW) | Chi-Square | Average Amount Used 1 | F | ||||||
|---|---|---|---|---|---|---|---|---|---|---|---|
| ~99 K (n = 26) | 100~199 K (n = 49) | 200~299 K (n = 49) | 300~299 K (n = 22) | 400~499 K (n = 12) | 500 K~ (n = 25) | ||||||
| Total | 100% | 14.4% | 27.1% | 27.1% | 11.0% | 6.6% | 13.8% | 260.0 K | |||
| Age | 60~64 | 38.1% | 42.3% | 34.7% | 34.7% | 50.0% | 16.7% | 48.0% | 18.2 (Gamma = −0.08) | 265.9 K | 0.8 |
| 65~69 | 35.9% | 26.9% | 32.7% | 42.9% | 40.0% | 41.7% | 32.0% | 268.5 K | |||
| 70~74 | 13.3% | 11.5% | 16.3% | 14.3% | 0% | 16.7% | 16.0% | 258.3 K | |||
| 75~79 | 11.0% | 19.2% | 14.3% | 6.1% | 10.0% | 25.0% | 0% | 205.0 K | |||
| 80+ | 1.7% | 0% | 2.0% | 2.0% | 0% | 0% | 4.0% | 316.7 K | |||
| Income | Less than 1 m | 8.3% | 15.4% | 6.1% | 8.2% | 0% | 8.3% | 12.0% | 33.7 * (Gamma = 0.31 **) | 250.0 K a,b | 6.2 ** |
| 1~1.99 m | 29.8% | 30.8% | 42.9% | 32.7% | 20.0% | 8.3% | 16.0% | 214.8 K a | |||
| 2~2.99 m | 23.8% | 30.8% | 26.5% | 26.5% | 25.0% | 33.3% | 0% | 212.8 K a | |||
| 3~4.99 m | 33.7% | 23.1% | 22.4% | 28.6% | 50.0% | 41.7% | 60.0% | 318.9 K b,c | |||
| More than 5 m | 4.4% | 0% | 2.0% | 4.1% | 5.0% | 8.3% | 12.0% | 387.5 K c | |||
| Retired | Yes | 28.7% | 15.4% | 34.7% | 34.7% | 20.0% | 33.3% | 24.0% | 5.1 (Cramer’s V = 0.17) | 259.6 K | 0 |
| No | 71.3% | 84.6% | 65.3% | 65.3% | 80.0% | 66.7% | 76.0% | 260.1 K | |||
* p < 0.05, ** p < 0.01. a–d Means with different letters are significantly different (p < 0.05), whereas means share the same letters are not significantly different (p < 0.05), based on Duncan contrasts. 1 The average amount was calculated by treating the categorical responses as a continuous scale. The middle value of each response category was used.
Table 5.
ANOVA results.
| Source | df | F-Value | |
|---|---|---|---|
| Number of Credit Cards Owned | Average Amount Charged Using Credit Cards | ||
| Main Effects | |||
| Age | 1 | 110.55 ** | 3.24 |
| Income | 1 | 41.43 ** | 6.81 * |
| Interaction | |||
| Age × Income | 1 | 21.54 ** | 0.01 |
* p < 0.05, ** p < 0.01.
Publisher’s Note: MDPI stays neutral with regard to jurisdictional claims in published maps and institutional affiliations. |
© 2021 by the authors. Licensee MDPI, Basel, Switzerland. This article is an open access article distributed under the terms and conditions of the Creative Commons Attribution (CC BY) license (https://creativecommons.org/licenses/by/4.0/).
Share and Cite
MDPI and ACS Style
Jung, K.; Kang, M.Y. Understanding Credit Card Usage Behavior of Elderly Korean Consumers for Sustainable Growth: Implications for Korean Credit Card Companies. Sustainability 2021, 13, 3817. https://doi.org/10.3390/su13073817
AMA Style
Jung K, Kang MY. Understanding Credit Card Usage Behavior of Elderly Korean Consumers for Sustainable Growth: Implications for Korean Credit Card Companies. Sustainability. 2021; 13(7):3817. https://doi.org/10.3390/su13073817
Chicago/Turabian StyleJung, Kwon, and Moon Young Kang. 2021. "Understanding Credit Card Usage Behavior of Elderly Korean Consumers for Sustainable Growth: Implications for Korean Credit Card Companies" Sustainability 13, no. 7: 3817. https://doi.org/10.3390/su13073817
Note that from the first issue of 2016, this journal uses article numbers instead of page numbers. See further details here.