

Abstract
Arctic plant productivity is often limited by low soil N availability. This has been attributed to slow breakdown of N-containing polymers in litter and soil organic matter (SOM) into smaller, available units, and to shallow plant rooting constrained by permafrost and high soil moisture. Using 15N pool dilution assays, we here quantified gross amino acid and ammonium production rates in 97 active layer samples from four sites across the Siberian Arctic. We found that amino acid production in organic layers alone exceeded literature-based estimates of maximum plant N uptake 17-fold and therefore reject the hypothesis that arctic plant N limitation results from slow SOM breakdown. High microbial N use efficiency in organic layers rather suggests strong competition of microorganisms and plants in the dominant rooting zone. Deeper horizons showed lower amino acid production rates per volume, but also lower microbial N use efficiency. Permafrost thaw together with soil drainage might facilitate deeper plant rooting and uptake of previously inaccessible subsoil N, and thereby promote plant productivity in arctic ecosystems. We conclude that changes in microbial decomposer activity, microbial N utilization and plant root density with soil depth interactively control N availability for plants in the Arctic.
Export citation and abstract BibTeX RIS

Original content from this work may be used under the terms of the Creative Commons Attribution 3.0 licence.
Any further distribution of this work must maintain attribution to the author(s) and the title of the work, journal citation and DOI.
Introduction
Arctic plant productivity is limited by low temperatures (Rustad et al 2001, Natali et al 2012, Sistla et al 2013, Leffler et al 2016) and low soil N availability (Haag 1974, Shaver and Chapin 1980, Gough et al 2002, Gough and Hobbie 2003). Plants meet their N demand by taking up small compounds such as oligopeptides, amino acids, ammonium, and nitrate (Hill et al 2011, Kuzyakov and Xu 2013), whereas the polymers that contain most of the soil N—predominantly proteins, but also heterocyclic compounds (Knicker 2011)—are too large for direct uptake. Nitrogen availability for plants consequently depends on microbial depolymerization rates (Schimel and Bennett 2004). Nitrogen limitation of arctic plants has been attributed to slow depolymerization under the cold and moist conditions in arctic soils (Hobbie et al 2002), and an increase in plant productivity with warming to an increase in soil N availability for plant growth (Chapin 1983, Hartley et al 1999, Shaver and Jonasson 1999, Natali et al 2012). This perception is supported by a recent modelling study that suggests a stimulation of plant productivity in a warming Arctic by increased N availability in surface soils (Koven et al 2015).
Nitrogen uptake by arctic plants is mainly confined to the top 30 cm of the soil where 95% of plant roots are located (Schenk and Jackson 2002, see also Iversen et al 2015). Rooting depth is limited by the thickness of the seasonally thawed active layer above the continuously frozen permafrost (Iversen et al 2015), and by high soil moisture in the deep active layer (Gebauer et al 1996, Iversen et al 2015). Permafrost thaw (Vaughan et al 2013) and improving drainage (Natali et al 2015) with global warming might promote deeper plant rooting and N uptake from previously inaccessible subsoil pools. If subsoils contain relevant amounts of available N, deeper rooting could alleviate plant N limitation, and stimulate plant CO2 uptake in the Arctic.
Recent inventories show that subsoils contain a large proportion of N in the top meter of arctic permafrost soils, for instance across Siberia, 66%–76% (horizons below 30 cm; Zubrzycki et al 2013), 65% (horizons below 30 cm; Palmtag et al 2016 and personal communication J. Palmtag), and 81%–89% (Ajj, B, and C horizons; Gentsch et al 2015). Subsoils dominate N storage only due to their mass, whereas N concentration per soil mass decreases with depth (Zubrzycki et al 2013, Gentsch et al 2015), mineral protection of SOM increases (Gentsch et al 2015), and consequently protein depolymerization rates decrease (Wild et al 2013, 2015). While these observations imply a decrease in the release of potentially plant available N with depth, actual availability also depends on competition with soil microorganisms. Like plants, microorganisms can take up small organic and inorganic N forms, and previous tracer studies show that microorganisms by far outcompete plants for both N forms in arctic organic layers (Schimel and Chapin 1996, Nordin et al 2004, Clemmensen et al 2008, Lærkedal Sorensen et al 2008, Larsen et al 2012). With increasing soil depth, however, microbial competition for N might decrease, as indicated by changes in the microbial release of excess N as ammonium into the soil solution ('N mineralization'; Schimel and Bennett 2004). Although gross N mineralization rates typically decrease with soil depth when related to dry soil mass, they have been found to increase when normalized by microbial biomass or microbial N uptake in many systems, including arctic permafrost soils (Mooshammer et al 2014, Wild et al 2015). This pattern points at an increase in microbial N excess with depth that contrasts the decrease in protein depolymerization rates, and has been attributed to an even stronger decrease in C availability that constrains microbial growth and N demand (Mooshammer et al 2014, Wild et al 2015). Subsoil microorganisms might use N-containing organic compounds such as amino acids primarily as C rather than N sources, and release the excess N as ammonium, which thus re-enters the N pool available to plants and microorganisms.
Our study aimed to assess the potential for plant N uptake in different horizons of arctic permafrost soils, and the implications for plant productivity in the case of deeper plant rooting in a future climate. Specifically, we quantified gross production rates of plant available N in different horizons of arctic permafrost soils using 15N pool dilution assays, and related these rates to estimates of plant N uptake. Active layer horizons were sampled from four upland tundra sites across the Siberian Arctic, comprising 97 samples from 27 soil profiles. We measured gross production rates of amino acids by depolymerization of soil proteins ('protein depolymerization'), and gross release rates of excess N as ammonium from microbial cells ('N mineralization'). In contrast to concentrations of available N pools, gross production rates inform about the replenishment of N pools over time, and thus provide a more useful measure of N availability. As proteins represent the largest soil N pool (Knicker 2011), protein depolymerization is thought to dominate the production of small organic N forms available to plants and microorganisms (Schimel and Bennett 2004, Jan et al 2009). We further calculated microbial N use efficiency (NUE) based on gross N transformation rates, as the proportion of N taken up by microorganisms that is used for growth and enzyme synthesis as opposed to mineralization (Mooshammer et al 2014). We hypothesized that (1) gross protein depolymerization per soil mass decreases with depth, following a decline in N concentration per soil mass, and that (2) microbial NUE decreases with depth, reflecting a transition from microbial N limitation to microbial N excess. Using soil profile sketches digitized from photographs, we estimated gross amino acid and ammonium production rates in the total active layer per soil surface area, as well as the contribution of individual horizons to the total rates, and compared these values with literature-based estimates of plant N uptake in arctic ecosystems.
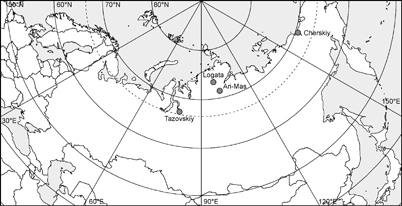
Figure 1. Map of sampling sites in the Siberian Arctic, with the dashed line indicating the Arctic circle. The map was created in R 3.1.3 (R Development Core Team 2015) using the packages rgdal (Bivand et al 2015), rworldmap (South 2011), plotrix (Lemon 2006), and sp (Pebesma and Bivand 2005).
Download figure:
Standard image High-resolution imageTable 1. Characterization of sampling sites across the Siberian Arctic, including vegetation type, dominant plant species, soil type (Soil Survey Staff 2010), and active layer depth.
| Vegetation type | Dominant plant species | Soil type | Active layer | |
|---|---|---|---|---|
| Cherskiy | Shrubby grass tundra | Betula exilis, Salix spenophylla, Carex lugens, Calamagrostis holmii, Aulacomnium turgidum | Ruptic-Histic Aquiturbel | 30–70 cm |
| Shrubby tussock tundra | Eriophorum vaginatum, Carex lugens, Betula exilis, Salix pulchra, Aulacomnium turgidum | Ruptic-Histic Aquiturbel | 35–60 cm | |
| Shrubby lichen tundra | Betula exilis, Vaccinium uliginosum, Flavocetraria nivalis, Flavocetraria cucullata | Typic Aquiturbel | 35–90 cm | |
| Ari-Mas | Shrubby moss tundra | Betula nana, Dryas punctata, Vaccinium uliginosum, Carex arctisibirica, Aulacomnium turgidum | Typic Aquiturbel | 60–85 cm |
| Shrubby moss tundra | Cassiope tetragona, Carex arctisibirica, Aulacomnium turgidum | Typic Aquiturbel | 65–90 cm | |
| Logata | Dryas tundra | Dryas punctata, Rhytidium rugosum, Hylocomium splendens | Typic Aquiturbel | 35–70 cm |
| Grassy moss tundra | Betula nana, Carex arctisibirica, Hylocomium splendens, Tomentypnum nitens | Typic Aquiturbel | 30–65 cm | |
| Tazovskiy | Shrubby lichen tundra | Empetrum nigrum, Ledum palustre, Betula nana, Cladonia rangiferina, Cladonia stellaris | Typic Aquiturbel | 100–120 cm |
| Forest tundra | Larix sibirica, Ledum palustra, Betula nana, Vaccinium uliginosum, Cladonia rangiferina, Cladonia stellaris | Typic Aquiturbel | 130–150 cm |
Material and methods
Sites and soil sampling
Soils were sampled in the late growing season (August 2010, 2011 or 2012) at four sites across the Siberian Arctic, Cherskiy (69.21°N, 161.69°E), Ari-Mas (72.49°N, 101.66°E), Logata (73.43°N, 98.41°E), and Tazovskiy (67.17°N, 78.91°E; figure 1). Sites are described briefly in table 1, and in detail in Gentsch et al (2015). All soils were underlain by continuous permafrost, and described as Typic or Ruptic-Histic Aquiturbels (Soil Survey Staff 2010).
We selected two or three representative upland tundra vegetation types per site and in each excavated three 5 m long soil trenches down to the permafrost table. We described all active layer horizons at high resolution, sampled them individually, and determined their bulk density (for details see Gentsch et al 2015). Living roots were removed immediately and samples were stored at surface soil temperature for a maximum of a few days before analysis. Samples were not sieved, but carefully homogenized by hand.
We categorized samples into four horizon classes as in Wild et al (2016), namely organic layers (O horizons), mineral topsoils (OA, A, and AB horizons), mineral subsoils (B, BC, and C horizons), and subducted topsoils, i.e. pockets of poorly decomposed topsoil material subducted into the subsoil by freeze-thaw processes (Ojj, OAjj, and Ajj horizons; Ping et al 2015). Based on soil profile sketches digitized from photographs, we calculated soil volumes per soil surface area for each pedon and horizon class as described by Gentsch et al (2015). A subset of soil samples that covered all depths and all four sites (n = 97) was used to measure soil C and N pools and gross N transformation rates. pH values were measured in aqueous suspension at a solid:solution ratio of 1:2.5.
Table 2. Characterization of the sampled soil horizons. Values represent means ± standard errors; significant differences between soil horizon categories are indicated by different letters (p < 0.05). 'Depth' refers to mean sample depth for each horizon class.
| Number | Depth (cm) | Organic C (%) | N (%) | C/N (w/w) | δ13C (‰) | δ15N (‰) | pH | |
|---|---|---|---|---|---|---|---|---|
| Org. layer | 19 | 9 ± 1a | 22.98 ± 1.67a | 0.90 ± 0.05a | 25.83 ± 1.34a | −28.11 ± 0.19c | 0.82 ± 0.31c | 5.41 ± 0.15c |
| Min. topsoil | 22 | 16 ± 2b | 4.18 ± 0.47b | 0.26 ± 0.03c | 16.35 ± 0.62b | −27.29 ± 0.18b | 2.78 ± 0.25b | 5.95 ± 0.15b |
| Subd. topsoil | 38 | 43 ± 3c | 6.77 ± 0.66b | 0.40 ± 0.03b | 16.16 ± 0.47b | −27.18 ± 0.12b | 2.69 ± 0.29b | 6.26 ± 0.11ab |
| Min. subsoil | 18 | 49 ± 8c | 1.14 ± 0.18c | 0.09 ± 0.01d | 11.62 ± 0.57c | −25.70 ± 0.30a | 4.99 ± 0.35a | 6.50 ± 0.14a |
Table 3. Microbial C and N, dissolved organic C (DOC), dissolved organic N (DON), ammonium and nitrate concentrations in the sampled soil horizons. Values represent means ± standard errors related to dry soil (d.s.); significant differences between soil horizon categories are indicated by different letters (p < 0.05). Microbial C and N were not analyzed in the Cherskiy samples and are not included here.
| Microbial C (μg C g−1 d. s.) | Microbial N (μg N g−1 d. s.) | DOC (μg C g−1 d. s.) | DON (μg N g−1 d. s.) | Ammonium (μg N g−1 d. s.) | Nitrate (μg N g−1 d. s.) | |
|---|---|---|---|---|---|---|
| Org. layer | 936.8 ± 276.6a | 103.9 ± 19.8a | 546.2 ± 259.8a | 52.77 ± 35.04a | 5.67 ± 1.25a | 2.17 ± 0.68ab |
| Min. topsoil | 401.6 ± 96.1a | 36.5 ± 6.6b | 86.1 ± 12.9b | 5.99 ± 1.74b | 1.30 ± 0.38b | 1.25 ± 0.52b |
| Subd. topsoil | 114.1 ± 18.7b | 10.7 ± 2.1c | 68.6 ± 7.5b | 3.29 ± 0.76c | 1.97 ± 0.33b | 2.25 ± 0.42a |
| Min. subsoil | 47.5 ± 11.7c | 2.9 ± 0.7d | 26.6 ± 4.8c | 0.75 ± 0.32d | 2.60 ± 0.85b | 0.80 ± 0.28b |
Carbon and nitrogen pools
Total soil organic C and N, as well as 13C and 15N content were measured in dried and ground samples using elemental analysis-isotope ratio mass spectrometry (EA-IRMS; Elementar vario MICRO cube EA, Elementar Analysensysteme GmbH, Germany, and Elementar IsoPrime 100 IRMS, IsoPrime Ltd, UK), and C/N ratios were calculated on a mass basis. Data are presented in table 2. Concentrations of dissolved organic C (DOC) and total dissolved N were measured in 0.5 M K2SO4 extracts (Cherskiy, Ari-Mas, Logata) or 1 M KCl extracts (Tazovskiy) using a TOC/TN analyzer (Cherskiy, Ari-Mas, Logata: Elementar LiquicTOC II; Tazovskiy: Shimadzu TOC-VCPH/CPN/TNM-1). Concentrations of ammonium and nitrate were measured photometrically in 1 M KCl extracts following Kandeler and Gerber (1988) and Miranda et al (2001), respectively, and concentrations of dissolved organic N (DON) were calculated by subtracting ammonium and nitrate from total dissolved N. Microbial C and N were estimated using the chloroform fumigation method (Brookes et al 1985). Aliquots of fresh soil were fumigated with ethanol-free chloroform, dissolved organic C and total dissolved N were extracted and analyzed as described above, and microbial C and N were calculated as the difference between fumigated and non-fumigated samples. We did not apply a correction factor to account for incomplete recovery of microbial C and N (Brookes et al 1985). Microbial C and N were not determined in the Cherskiy samples. Data on microbial C and N, DOC, DON, ammonium and nitrate are presented in table 3.
Gross nitrogen transformation rates
Gross rates of protein depolymerization, microbial amino acid uptake, N mineralization, and microbial ammonium uptake were measured using 15N pool dilution assays (Kirkham and Bartholomew 1954). Briefly, we labelled the amino acid (protein depolymerization and amino acid uptake) or ammonium pool (N mineralization and ammonium uptake) with 15N, determined concentration and isotopic composition of the respective pool at two time points (amino acids: 10 and 30 min; ammonium: 4 and 24 h), and calculated the fluxes into and out of the pool from the dilution of 15N and changes in concentration between the two time points.
Gross protein depolymerization and amino acid uptake rates were determined following Wanek et al (2010), as modified by Wild et al (2013). Duplicates of fresh soil (1–4 g depending on SOM content) were amended with 15N labelled amino acids (mixture of 20 amino acids with >98 at% 15N, Spectra and Cambridge Isotope Laboratories, 0.31–2.5 μg per g fresh soil adjusted to the expected amino acid content of the sample). Sample duplicates were extracted after 10 or 30 min, respectively, with 20 ml 10 mM CaSO4 containing 3.7% formaldehyde. Samples were filtered, loaded on pre-cleaned cation exchange cartridges (OnGuard II H 1cc cartridges, Thermo/Dionex), eluted with 3 M NH3, amended with internal standards (nor-valine, nor-leucine, and para-chloro-phenylalanine, 1 μg each per sample, Sigma-Aldrich), dried, derivatized with ethyl-chloroformate (Wanek et al 2010), and analyzed with gas chromatography-mass spectrometry (Thermo Trace GC Ultra with Thermo DSQ II or ISQ mass spectrometer). Blanks and one set of amino acid standards were processed with the samples throughout the procedure to correct for incomplete recovery. A second set of amino acid standards was derivatized with the samples for calibration of alanine, isoleucine, leucine, phenylalanine, proline, valine, aspartate/asparagine, and glutamate/glutamine concentrations. Amino acid 15N contents were calculated from peak areas of light and heavy fragments as described by Wanek et al (2010).
Gross N mineralization and ammonium uptake rates were determined as in Wild et al (2013), by amending duplicates of fresh soil (1–4 g depending on SOM content) with 500 μl of 0.125 mM 15N labelled (NH4)2SO4 (10 at%, Sigma-Aldrich). Sample duplicates were extracted after 4 or 24 h, respectively, with 13 ml 2 M KCl, and filtered through ash free filter paper. Ammonium was converted into ammonia which diffused into acid traps (Sørensen and Jensen 1991), and amount and isotopic composition were measured with EA-IRMS (CE Instrument EA 1110 elemental analyzer, Finnigan MAT ConFlo II interface, Finnigan MAT DeltaPlus IRMS).
The calculation of gross rates based on pool dilution assays requires an enrichment of 15N in the target pool (here: amino acids and ammonium, respectively) at both time points, and a depletion of 15N between them. This was confirmed for all samples. The amino acid pool showed average 15N contents of 26.4 ± 2.5 at% (mean ± standard error) at time point 1 and 15.0 ± 1.8 at% at time point 2 after addition of amino acids with > 98 at% 15N, and the ammonium pool of 2.3 ± 0.2 at% at time point 1 and 1.2 ± 0.1 at% at time point 2 after addition of (NH4)2SO4 with 10 at% 15N. Gross rates of protein depolymerization, microbial amino acid uptake, N mineralization, and microbial ammonium uptake were calculated following Kirkham and Bartholomew (1954), and normalized by dry soil mass, soil N, and soil volume using bulk density values of the respective samples. We then estimated gross N transformation rates per soil surface area, by averaging gross rates per soil volume for each horizon class, and multiplying with the average soil volume per soil surface area of the respective horizon class. Standard errors were calculated following Gaussian error propagation.
We further estimated microbial N use efficiency (NUE) as the proportion of N taken up that was not mineralized, but used for microbial growth and enzyme synthesis. Previous studies on microbial NUE have considered only microbial amino acid uptake as it dominated microbial N uptake in their samples (Wild et al 2013, Mooshammer et al 2014). We extended their equation to include ammonium uptake that especially in mineral subsoils contributed considerably to microbial N uptake. Microbial NUE was calculated from gross rates of microbial amino acid and ammonium uptake as well as N mineralization as:
Given the limited infrastructure at our remote field sites in the Siberian Arctic, we measured all gross N transformation rates at surface soil temperatures, and thereby possibly overestimated rates in the deeper soil. We did not apply a temperature correction to the measured rates, but estimated the magnitude of the temperature effect on gross N transformation rates in the deeper soil. Cherskiy data are partly presented in Wild et al (2013).
Estimate of plant nitrogen uptake
We estimated maximum plant N uptake in arctic ecosystems based on net primary production rates reported in previous studies. For the Canadian Arctic, total net primary production rates from less than 20 g m−2 yr−1 in polar deserts to up to 1000 g m−2 yr−1 in highly productive shrub ecosystems have been suggested (Gould et al 2003), and this range likely applies also to other areas across the Arctic. Total net primary production rates of 200–300 g m−2 yr−1 have been observed in heath tundra in the Scandinavian sub-Arctic (Campioli et al 2009, Jonasson et al 1999), and aboveground net primary production rates of 30–400 g m−2 yr−1 at sites dominated by heath shrubs, tall deciduous shrubs or tussock-forming graminoids in the Alaskan Arctic (Shaver and Chapin 1991, Schuur et al 2007, Natali et al 2012, DeMarco et al 2014). Considering that belowground production likely represents only a small fraction of total production (e.g. 15% in a sub-Arctic heath tundra; Campioli et al 2009), these rates fall well into the range of total net primary production presented above. For our estimate of maximum plant N uptake, we therefore assumed maximum net primary production of 1000 g m−2 yr−1, 1% N content in the new biomass (Jonasson et al 1999, Campioli et al 2009), 120 growing season days (Ernakovich et al 2014), and constant plant N uptake during the growing season (see discussion). We thus arrived at a maximum daily plant N uptake of 83 mg N m−2 d−1 during the growing season (total range 1.7–83 mg N m−2 d−1). Our estimate of maximum plant N uptake by far exceeds previous estimates of actual plant N uptake of 1 g N m−2 yr−1 (8.3 mg N m−2 d−1 assuming 120 growing season days) in a sub-arctic heath tundra (Jonasson et al 1999), and of 0.8 and 1.5 g N m−2 yr−1 (6.3 and 12.2 mg N m−2 d−1) in tussock tundra (only aboveground biomass considered; Chapin et al 1988). We are therefore confident that our maximum value represents a conservative upper limit for plant N uptake, as it might be achieved in the most productive arctic ecosystems.
Statistical analyses
We tested for significant differences (p < 0.05) between horizon classes using ANOVA with Tukey HSD as post hoc test, after rank-transformation where necessary to meet the conditions. Where conditions could not be met even after transformation, we conducted non-parametric Mann-Whitney-U tests. All statistics were performed in R 3.1.3 (R Development Core Team 2015), with the additional package GenABEL (Aulchenko et al 2007).

Figure 2. Gross rates of protein depolymerization and N mineralization in different active layer horizons of arctic permafrost soils, related to soil dry mass (a) and (b), soil N (c) and (d), and soil volume (e) and (f). Bars represent means with standard errors, different letters indicate significant differences between horizons (p < 0.05). Note the differences in scaling.
Download figure:
Standard image High-resolution imageResults
Gross protein depolymerization rates significantly decreased with depth, from organic layers to mineral topsoils and further to subducted topsoils and mineral subsoils (figure 2). This pattern was observed when rates were related to dry soil mass, but also when rates were normalized by soil N content, although less pronounced. In support of hypothesis (1), our data thus suggest that the decrease in protein depolymerization with depth was driven by a combination of decreasing N concentration per soil mass (i.e. substrate availability; table 2), and decreasing microbial depolymerization activity per soil N. Although mineral and subducted topsoils have similar SOM properties (table 2; see also Xu et al 2009), subducted topsoil rates accounted for only 37% of mineral topsoil rates when related to soil N. A deceleration of N transformations by subduction has been previously described (Wild et al 2013) and likely reflects a general deceleration of microbial decomposition processes (Kaiser et al 2007, Čapek et al 2015, Wild et al 2016).
Gross N mineralization rates decreased with depth only when related to dry soil mass, but were in the same range in all horizon classes when normalized by N content. In support of hypothesis (2), the different patterns of protein depolymerization and N mineralization rates were reflected in a significant decrease in microbial NUE with depth, from 0.92 ± 0.02 (mean ± standard error) in organic layers to 0.81 ± 0.03 in mineral topsoils, 0.67 ± 0.04 in subducted topsoils, and 0.61 ± 0.07 in mineral subsoils (figure 3). Microorganisms in organic layers used 92% of the N taken up for growth and enzyme synthesis, and mineralized 8%, whereas microorganisms in mineral subsoils used 61%, and mineralized 39%.

Figure 3. Microbial N use efficiency in different active layer horizons of arctic permafrost soils. Bars represent means with standard errors, different letters indicate significant differences between horizons (p < 0.05).
Download figure:
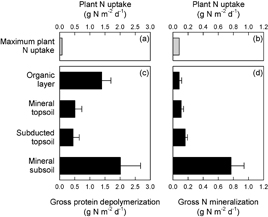
Standard image High-resolution imageUsing bulk density values of the sampled soils, we calculated N transformation rates per soil volume, and thereby normalized the amount of potentially plant available N by the volume plant roots need to occupy for its uptake. Also related to soil volume, gross protein depolymerization rates significantly decreased with depth (figure 2), and gross N mineralization rates were in the same range in all horizons. We then used digitized soil profile sketches to calculate the thickness of different active layer horizons, and their volume within the active layer per soil surface area. Given that mineral subsoils represented 78% of the active layer volume at our study sites, they dominated both protein depolymerization and N mineralization rates per soil surface area, contributing 46% and 68%, respectively, to the total active layer rates (figure 4). Organic layers contributed 32% to protein depolymerization, but only 7% to N mineralization, mineral topsoils 12% and 10%, and subducted topsoils 10% and 14%, respectively.
Figure 4. Estimated maximum of plant N uptake in the Arctic ((a) and (b); total estimated range 1.7–83 mg N m−2 d−1), as well as gross rates of protein depolymerization (c) and N mineralization (d) in different active layer horizons of arctic permafrost soils, related to soil surface area. For gross rates, bars represent means with standard errors.
Download figure:
Standard image High-resolution image
We note that gross rates in deeper soils might be overestimated as they were measured at surface soil temperatures. During our sampling campaigns, soil temperatures decreased from 8.3 °C at the average organic layer depth to 7.1 °C in mineral topsoils, 4.4 °C in subducted topsoils, and 3.8 °C in mineral subsoils. Assuming a Q10 of 2, subducted topsoil rates would be lower by 24% under in situ temperatures, and mineral subsoil rates by 27%. Organic layers would then contribute 38% and 10%, mineral topsoils 13% and 12%, subducted topsoils 9% and 14%, and mineral subsoils 40% and 65% to protein depolymerization and N mineralization, respectively, in the active layer.
Discussion
Arctic plant productivity is often limited by low soil N availability (Haag 1974, Shaver and Chapin 1980, Gough et al 2002, Hobbie et al 2002, Gough and Hobbie 2003). Based on previous reports of net primary production, we estimate that plant N uptake can reach up to 83 mg N m−2 d−1 in the most productive arctic ecosystems during the growing season. Even this maximum value of plant uptake was exceeded by more than an order of magnitude by the release of amino acid N from soil proteins (figure 4). Gross protein depolymerization rates at our study sites amounted to 4.3 ± 0.8 g N m−2 d−1 (mean ± standard error) in the entire active layer, and 1.4 ± 0.3 g N m−2 d−1 in organic layers where most plant roots are located (Schenk and Jackson 2002). Since arctic plants can directly use amino acids as N sources (Schimel and Chapin 1996, Nordin et al 2004, Lærkedal Sorensen et al 2008), our findings contradict the hypothesis that arctic plant N limitation results from slow SOM breakdown.
We estimated maximum daily plant N uptake under the assumption of constant uptake over the growing season because studies at high time resolution are missing, and we measured gross protein depolymerization rates at one time point in the late growing season. Both parameters likely show seasonal variation, as observed also for microbial biomass and extracellular enzyme activities (Weintraub and Schimel 2005, Wallenstein et al 2009, Edwards and Jefferies 2013, Sistla and Schimel 2013, Stark and Väisänen 2014). We expect maximum protein depolymerization rates in the late growing season when soils are warmest, whereas peaks in plant N uptake have been suggested in the late, but also in the early growing season (Olsrud and Christensen 2004, Blume-Werry et al 2016, Sloan et al 2016). A temporal mismatch between N release from SOM polymers and plant N uptake might thus contribute to constraining arctic plant productivity. Furthermore, gross N transformation rates were measured in homogenized soil samples, which likely show some deviation from rates in undisturbed soils. However, given that average amino acid production rates exceeded even the maximum plant N uptake by more than an order of magnitude, and that amino acids represent only part of the available N pool (see e.g. for oligopeptides Hill et al 2011), the discrepancy between soil N availability and plant N uptake seems too large to be attributed to seasonal fluctuations and methodological artefacts alone.
While we did not measure rooting depth at our study sites, previous studies agree that most tundra roots are located in the shallow soil. A meta-analysis reported 50% of tundra roots in the top 9 cm, and 95% in the top 29 cm (Schenk and Jackson 2002), and more recent studies 50% (Alaskan tussock tundra; van Wijk et al 2003) and 68%–100% in the top 10 cm (Alaskan tussock-shrub tundra; Zhu et al 2016), 46%–65% in the top 5 cm (Siberian tussock-shrub tundra; Wang et al 2016), and 78% in the top 2 cm (Svalbard semi-desert; Oulehle et al 2016, see also Iversen et al 2015 for a recent review). These patterns are in line with our personal observations at our study sites.
Comparing microbial N dynamics in different horizons with typical plant rooting depths suggests that arctic plant N limitation is driven by strong competition with microbes for available N in the dominant rooting zone. Protein depolymerization rates in organic layers exceeded maximum plant N uptake by a factor of 17 (figure 4), but our data also show that a large proportion of the N made available by protein depolymerization in organic layers was rapidly sequestrated within the microbial biomass, as microorganisms retained 92% of the N taken up, and released only 8% by mineralization (figure 3). High microbial NUE indicates high microbial N demand compared to N availability (Mooshammer et al 2014), and suggests that under natural conditions, microorganisms compete with plants for available N in organic layers. These conclusions are supported by previous studies in arctic and subarctic ecosystems that reported a by far more efficient incorporation of 15N added to organic layers into microbial than plant biomass (Schimel and Chapin 1996, Nordin et al 2004, Clemmensen et al 2008, Lærkedal Sorensen et al 2008, Larsen et al 2012). A recent global meta-analysis suggests that this pattern might be strongest for organic N (Kuzyakov and Xu 2013) which dominates the available N pool in high latitude organic layers (Jones and Kielland 2002, Larsen et al 2012, Wild et al 2013, 2015).
Mineral subsoils and subducted topsoils together contributed 56% to gross protein depolymerization and 83% to gross N mineralization in the active layer at our sites. In both horizons, microorganisms exhibited lower NUE than in organic layers (figure 3), indicating higher microbial N excess. With plant N uptake from subsoils currently impeded by shallow rooting, available subsoil N might fuel nitrification/denitrification processes that can promote ecosystem N losses by nitrate leaching and outgassing of N2 or N2O (Cameron et al 2013). Although gross nitrification rates per microbial biomass have been found to increase with depth in arctic soils (Wild et al 2015), and nitrate has been identified as the dominant N form in artificial leachates of arctic soil samples (Treat et al 2016), nitrate leaching under natural conditions is likely constrained by the presence of permafrost. In the discontinuous permafrost zone, however, high nitrate concentrations have been observed in rivers (Petrone et al 2006, Cai et al 2008), and the subsoil has been suggested as its source (Petrone et al 2006). An accumulation of inorganic N, as well as high net N mineralization rates upon thaw have also been observed in the current upper permafrost (Keuper et al 2012, Beermann et al 2017).
Subsoil N cycling might be substantially altered by changes in temperature, hydrological regime and vegetation composition in the next decades. Active layer deepening (Vaughan et al 2013) and improving drainage (Natali et al 2015) might permit deeper plant rooting and uptake of subsoil N. Arctic warming could thereby stimulate plant productivity even without accelerating depolymerization or N mineralization rates. However, warmer and drier conditions will likely promote microbial growth and activity in subsoils, consequently stimulate both microbial production and consumption of available N, and enhance competition for N. Increased root density, and thus increased input of plant-derived organic compounds, could additionally stimulate microbial activity and alter microbial N cycling, but also accelerate the mineralization of soil organic C to CO2 ('priming effect'; Bengtson et al 2012, Dijkstra et al 2013, Zhu et al 2014). Mineral subsoils of arctic permafrost soils are particularly susceptible to plant-derived compounds in laboratory experiments (Wild et al 2014, 2016), and we suggest that deeper plant rooting could accelerate soil organic C losses from the deep active layer, and counteract the increased plant CO2 uptake, as indicated also in a long-term tundra warming study (Sistla et al 2013). This effect, however, might be restricted to sites dominated by deep-rooting plants such as graminoids that can take up N from the subsoil (Oulehle et al 2016, Zhu et al 2016). Although graminoid abundance might increase at some, especially colder sites within the tundra biome, most sites are expected to experience a decrease in graminoid, and increase in shrub abundance (Elmendorf et al 2012). Shrubs take up N from shallower depths than graminoids (Oulehle et al 2016, Zhu et al 2016) which could effectively reduce plant N uptake from the subsoil, and promote N losses. Systems in the south of the tundra biome might be particularly affected by nitrate leaching as both increases in shrub abundance (Elmendorf et al 2012) and decreases in permafrost extent (Chadburn et al 2017) have been predicted for these sites.
Conclusions
Comparing N transformations across active layer horizons in the Siberian Arctic, we demonstrate changes in microbial N dynamics with soil depth that, through interactions with plant rooting patterns, might play a crucial role for ecosystem productivity and C storage. We found that production rates of available N greatly exceeded literature-based estimates of plant N uptake. These findings do not contradict previous evidence for N limitation of arctic plant productivity, but show that arctic plant N limitation does not result from slow breakdown of SOM polymers. Instead, we suggest that plant N uptake was constrained by strong microbial N demand in the shallow soil where most plant roots are located. Rising temperatures and improving soil drainage might facilitate plant N uptake from previously inaccessible subsoil horizons, thereby stimulate plant productivity, and reduce N losses in systems with deep-rooting plants. An increasing abundance of shallow-rooting shrubs, as predicted for large areas across the Arctic, could counteract this effect and promote N losses. We conclude that interactions between changes in soil abiotic conditions and vegetation composition could substantially transform C and N cycles in arctic ecosystems, with potential consequences for the global C balance.
Acknowledgments
This study is part of the CryoCARB project (Long-term Carbon Storage in Cryoturbated Arctic Soils), co-funded by the Austrian Science Fund (FWF): I370-B17, the German Federal Ministry of Education and Research (03F0616A), the Czech Ministry of Education, Youth and Sports (MSM 7E10073—CryoCARB), the Russian Ministry of Education and Science (No. 14.В25.31.0031), the Swedish Research Council (824–2009-77357), and the Norwegian Research Fund (NFR): NFR-200411, and was further supported by a JPI Climate Project (COUP-Austria; BMWFW-6.020/0008) awarded to Andreas Richter. Jiři Bárta and Tim Urich received additional funding from the Czech Science Foundation (16–18453S).