

Abstract
The total area with 24 hrs precipitation has shrunk by 7% between 50°S–50°N over the period 1998–2016, according to the satellite-based Tropical Rain Measurement Mission data. A decrease in the daily precipitation area is an indication of profound changes in the hydrological cycle, where the global rate of precipitation is balanced by the global rate of evaporation. This decrease was accompanied by increases in total precipitation, evaporation, and wet-day mean precipitation. If these trends are real, then they suggest increased drought frequencies and more intense rainfall. Satellite records, however, may be inhomogeneous because they are synthesised from a number of individual missions with improved technology over time. A linear dependency was also found between the global mean temperature and the 50°S–50°N daily precipitation area with a slope value of −17 × 106km2∕°C. This dependency was used with climate model simulations to make future projections which suggested a continued decrease that will strengthen in the future. The precipitation area evolves differently when the precipitation is accumulated over short and long time scales, however, and there has been a slight increase in the monthly precipitation area while the daily precipitation area decreased. An increase on monthly scale may indicate more pronounced variations in the rainfall patterns due to migrating rain-producing phenomena.
Export citation and abstract BibTeX RIS

Original content from this work may be used under the terms of the Creative Commons Attribution 3.0 licence.
Any further distribution of this work must maintain attribution to the author(s) and the title of the work, journal citation and DOI.
1. Introduction
The connection between climate change and the hydrological cycle has been discussed in a number of papers [1, 2, 3], and a conclusion from the most recent assessment report by the Intergovernmental Panel on Climate Change (IPCC) is that wet regions get wetter and dry regions get drier with an increased greenhouse effect [4]. Contrasting trends between wet and dry regions complicate the estimation of a simple aggregated index such as the global mean temperature or sea level, although an indicator referred to as the hydroclimatic intensity has been suggested [5] that accounts for the differences between dry and wet regions. The movement of water is related to the flow of energy [6] and the greenhouse effect is entangled with the hydrological cycle [7] where the energy flow involves both radiative transfer as well as a chain of processes that includes evaporation, convection, condensation of water vapour to form clouds, and precipitation (e.g. the Hadley cell and the Walker circulation [8]).

Figure 1. An example showing the rainfall area (blue) for a random day. Source: TRMM.
Download figure:
Standard image High-resolution imageThe dominant terms in the total water budget of the hydrological cycle include the globally accumulated rate of evaporation E and precipitation P, where E is offset by P and E − P = 0 in an equilibrium state with constant atmospheric moisture. The conservation of mass implies that the rate of evaporated water integrated over Earth's surface minus the total precipitation on Earth equal the change in the atmospheric water content:  , where ρH2O is the density of liquid water and vapour in the atmosphere, ∫Aeda is an areal integral, and ∫VρH2Odv is a volume integral. It is only the area with precipitation (p > 0) that contributes to the second integral of the mass balance equation ∫Apda, and the atmospheric moisture content is constant for an equilibrium state where
  , implying that
  where AP is the area of the surface with precipitation and
  is the mean precipitation over this area. This balance can also be expressed as
  where
where  is the mean evaporation over area with evaporation, AE. An increase in the mean rate of evaporation is expected to be accompanied with an increase in
  amplified by AE ∕AP if all else is constant [9], and a reduced area of precipitation and constant or increased rate of evaporation are expected to be associated with increased intensity according to this simple expression. The area of evaporation may vary to some extent, although it is dominated by the oceans which take up approximately 70% of Earth's surface. AP, on the other hand, is directly related to events producing precipitation and is more limited in terms of size (figure 1), and while AE can be assumed to be constant, the precipitation area AP varies from one day to the next depending on rain-producing clouds. The total area AP at any given time reflects both the global mean precipitation frequency and precipitation intensity. It is a vital index for the hydrological cycle because a long-term change implies more or less frequent precipitation with altered mean intensity if the levels of atmospheric water content and rate of evaporation change to a lesser extent.
  can be used as an indicator for the rainfall intensity if the 24 hr precipitation amount approximately follows an exponential distribution [10].
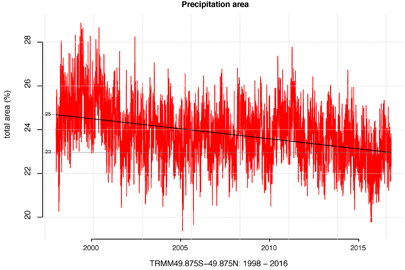
Figure 2. Time series of the rainfall area based on daily TRMM data expressed as the fraction of the total surface area between 50°S–50°N. A linear trend analysis indicates a change in the estimated rainfall area from 25% to 23% over the 1998–2016 period. The trend is statistically significant at the 1% level.
Download figure:
Standard image High-resolution image2. Methods and data
The precipitation area AP and area mean precipitation  were studied through an analysis based on the Tropical Rainfall Measurement Mission (TRMM) [11, 12] to provide a new picture of the ongoing climate change and the consequence for the hydrological cycle, albeit with a number of caveats. The analysis was based on the daily precipitation product referred to as '3B42' which mainly used two sensors: Infrared Scanner and Microwave Imager. The instruments were carried onboard the missions GMS, GOES-E, GOES-W, Meteosat 7, Meteosat 5, and NOAA 12 on a low altitude (~320 km) orbit with a low inclination (30–35°) in order to get a high spatial resolution. The orbit and the instrumentation were designed to sample each location in the tropics twice per day at different hour of the day. The TRMM data was calibrated with rain gauge data over land. The TRMM data has a reasonably high spatial resolution (0.25° × 0.25°) and a near-global coverage over both land and ocean (50°S–50°N), and was used here to provide a tentative estimate for AP. The rainfall area AP was determined by summing up the grid box areas for where the 24 hrs rainfall pi exceeded a threshold x0 (set to 1 mm day−1 for daily TRMM): AP = ∑iaiH(pi − x0) where H(.) is the Heaviside function and ai is the area of grid-box i. It was difficult to determine an objective definition of x0 because it was sensitive to the spatial resolution of the gridded data. Furthermore, the grid boxes represent mean area values and it is expected that it only rains over a fraction of the grid-box area and usually for a shorter duration than 24 hrs.
The analysis based on the TRMM was compared with corresponding, but independent, analysis applied to the ERA-Iterim reanalysis with spatial resolution of 0.75 × 0.75° [13]. It is important to keep in mind that the reanalysis data are not pure 'observations', but are influenced by the underlying assimilation model. In addition, evaporation, moisture, and precipitation were taken from the ERA-Interim which gives a more complete description of the climate system.
A back-of-the-envelope estimate for the fraction of the vertical energy flow from the surface connected to moist convection was based on a consideration of the energy release associated with condensation and subsequent precipitation, and was estimated according to  , where Le is the latent heat of evaporation, rE is the radius of the earth, and A the planetary albedo (not to be confused with the area). The denominator is the total energy flux, assuming that the incoming equals the outgoing energy flow. This, of course, is a gross simplification, as about half of the heat released by the condensation into cloud drops would be radiated downward if all of it were to be in the form of infrared radiation. On the other hand, the net energy flux associated with the downward emission was expected to be small if most of it subsequently also is returned to space as infrared emission.
An ordinary linear regression analysis was used to estimate the dependency of the precipitation area to the global mean temperature, because coarse spatial resolutions of the models precluded a reliable estimate of Ap and because the projections of the global mean temperature are assumed to be more reliable than the precipitation projections on a grid-box basis. The regression was based on the equation ÂP = β0 + β1T + η, where β0 and β1 are regression coefficients, T is the annual global mean temperature from HadCRUT4 [14] (version 4.6), Â P is the estimated annual mean precipitation area derived from daily AP, η is a noise term, and  is the slope value used for scaling the daily precipitation area with the global warming projected with the coupled model intercomparison project phase 5 (CMIP5) global climate models (GCMs) [15].
A supporting material (henceforth referred to as SM) provides further diagnostics, data extracts, and open source code for the analysis. It includes (1) the R-package 'preciparea' (available from github.com/brasmus/preciparea) and an R-markdown script with open code for the analysis presented in this paper (for easy replication of the results) and (2) a PDF-document produced with R-markdown which provides the recipe behind the data processing and additional supporting analysis.
3. Results
Figure 2 shows AP between 50°S and 50° N estimated from the daily TRMM data and indicates a decline in AP from 96 to 89 million km2 over the period 1998–2016, corresponding to 25% and 23% of the total area respectively and a 7% relative change. Most of the trend in AP was connected to maritime precipitation (See the SM). The decline in AP was accompanied by an increase in the mean intensity  from 11 mm day−1 to 13 mm day−1 for the same region and period (table 1), which is consistent with previous analysis of trends in wet-day mean precipitation from rain gauges [16]. There was a reasonable agreement between TRMM and ERA-Interim on the total precipitation amount over 50°S–50°N (table 2), 1100–1300 giga-ton/day, which was of the same order of magnitude as previous estimates [17, 18]. The total atmospheric water content remained approximately constant over 1998–2016 according to the ERA-Interim, whereas the global mean rate of evaporation increased from 1400 to 1500 giga-tons (table 1). The total 50°S–50°N precipitation increased slightly from 1122 giga-ton day−1 to 1152 giga-ton day−1 according to the TRMM data and 1300–1308 giga-tons according to ERA-Interim (table 1).
Table 1. Estimated linear trend in globally accumulated masses of water from the ERA-Interim and TRMM data over 50°S–50°N.
| Statistic | 1998 | 2016 |
|---|---|---|
| AP from daily TRMM (106km2) | 96 | 89 |
| AP from daily TRMM (%) of total area | 25 | 23 |
| AP from daily TRMM over oceans (106km2) | 74 | 68 |
| AP from daily TRMM over land (106km2) | 22 | 21 |
| AP from monthly TRMM (106km2) | 87 | 89 |
| AP from daily ERA-Interim (106km2) | 103.1 | 98.2 |
| AP from monthly ERA-Interim (106km2) | 92.5 | 92.9 |
| P from daily TRMM (giga-ton) | 1122 | 1152 |
| P from ERA-Interim (giga-ton) | 1300 | 1308 |
| P from daily TRMM over oceans (giga-ton) | 857 | 896 |
| P from daily TRMM over land (giga-ton) | 264 | 254 |
 from daily TRMM (mm/day) from daily TRMM (mm/day) |
11.3 | 13.1 |
| Atmospheric H2O from ERA-Interim (106 giga-ton) | 415 | 418 |
| Evaporation from ERA-Interim (giga-ton/day) | −1468 | −1509 |
| Fraction convection from ERA-Interim (%) | 32.8 | 33.0 |
To explore dependencies of the daily AP to the global temperature T, a linear regression was used to estimate the linear rate of change based on the annual mean estimates of the daily AP and the global mean temperature. The global mean temperature was taken from the HadCRUT4 dataset [14], and the regression analysis suggested a reduction inAP by − 17 × 106km2∕°C (statistically significant at the 5% level). This scaling factor was then used together with the multi-model ensemble of CMIP5 GCM simulations (108 members) in a naive extrapolation to estimate future changes (assuming emission scenario 'RCP4.5' [4]). Based on this simple scaling, the future projections suggest a relative reduction in the daily AP by 28% in 2100 (More details in the SM).
The area with precipitation accumulated over longer timescales is not expected to show the same character as the daily precipitation area due to migrating phenomena such as cyclones, the Inter-Tropical Convergence Zone (ITCZ), the Madden-Julian oscillation (MJO), and the monsoon. Furthermore, the threshold defining a wet event if affected by the aggregation over longer time scales. Here, the monthly mean AP estimated from daily estimates for AP was compared with AP derived from monthly mean precipitation (TRMM and ERA-Interim), shown in figure 3. There was no decline in the monthly AP from TRMM (thin grey) as seen in the daily index (thick black). Similar difference in trends was found in the ERA-Interim data. One reason for the different curves may be that the threshold x0 for defining wet or dry conditions had to be calibrated for different spatial resolution (TRMM: 0.25° × 0.25°; ERA-Interim: 0.75° × 0.75°), and there was no a priori objective criterion for defining the threshold for different time scales and spatial resolution. In reality, it only rains over a fraction of a grid box and usually for durations shorter than 24 hrs, and migrating precipitation makes the comparison between different time scales and spatial resolutions complicated.
Monthly precipitation output from the GCMs was also used to estimate the monthly precipitation area, and figure 4 compares AP over 50°S–50°N between different model runs from the CMIP5 RCP4.5 multi-ensemble (105 projections for precipitation, see SM). The different colours on the curves in figure 4 mark different spatial resolution (in degrees along the longitude). The mean level of the precipitation area calculated from monthly precipitation exhibited a weak systematic dependency on the model resolution (statistically significant at the 5% level), and there were substantial inter-model differences in AP, but all suggested a future increase in the monthly mean precipitation area with an average over all model simulations of 2.4% between 2000 and 2100 compared to Earth's surface area.
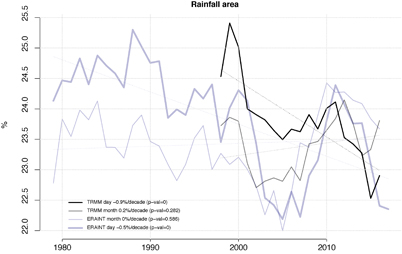
Figure 3. A comparison between the annual mean rain fall area estimated using the TRMM data, and the ERA-Interim reanalysis. The estimates include daily area and monthly area estimated from the monthly mean precipitation. The threshold x0 for defining wet events was set to 1 mm day−1 for the daily data and 3 mm day−1 for the monthly data on 0.25° × 0.25° grid. For ERA-Interim, the value of x0 was tuned through simple testing and trying for the mean value to match the others.
Download figure:
Standard image High-resolution image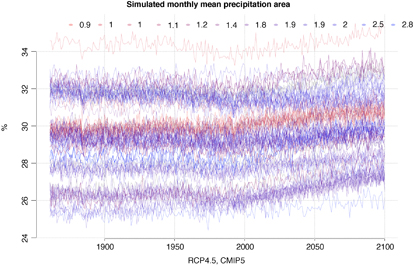
Figure 4. The simulation of the monthly mean precipitation area with 105 different runs from the RCP4.5 CMIP5 experiment taking the threshold x0 to be 4 mm day−1. Differences between models can partially be explained by different resolution.
Download figure:
Standard image High-resolution image
Total global precipitation estimated for the CMIP5 simulations exhibited a scatter over the range 1386–1640 giga-ton per day, but all models indicated an increase over 2000–2100 in the range of 14–90 giga-ton/day. Precipitation can be considered as a by-product of moist convection and connected to the greenhouse effect [7], and an increase in the total precipitation implies a shift in the relative contribution of the forms of heat transport from Earth's surface to higher levels where it is free to escape to space. If the energy input is balanced by the heat loss [7], then the total energy flux is defined by the incoming portion  , where rE is Earth's radius, A the planetary albedo, and S0 the solar constant (SM). Based on this crude and simplistic calculation, the total precipitation estimated from ERA-Interim implies that moist convection accounted for 32.8% of the vertical energy flow in 1979 and 33.0% in 2016. Likewise, trends in the total precipitation from CMIP5 simulations imply an increase of the convective heat transport within the range of 0.3%–2.0% over 2000–2100. The consequence of more precipitation, higher convective energy transport, and decreasing precipitation area is an increase in mean precipitation intensity according to
  .
.
4. Discussion
The study of the precipitation area AP is both scientifically interesting and important in terms of our understanding of the hydrological cycle and climate change. A 7% decrease in AP over two decades is dramatic, especially if it reflects a real ongoing long-term change. The precipitation between 50°S–50°N dominates the water budget of the global hydrological cycle both because it represents 77% of the surface area and because the precipitation is most intense in the tropics (table 2). One plausible physical explanation for the observed decline may be that an increased rate of atmospheric overturning [7] may have resulted in more convection and precipitation from cumulonimbus type clouds rather than more spatially extensive stratonimbus clouds. Such changes will have consequences even if they only are due to slow natural variability. These results are consistent with previous analysis of the mean precipitation intensity [16], but the exact picture of AP depends on whether it was estimated from the TRMM data or reanalysis, as well as the time scale and the choice of threshold value distinguishing between wet and dry conditions. The instantaneous precipitation area is smaller than the area with precipitation accumulated over 24 hrs because it usually only rains for a fraction of the day, and these results are subject to a number of caveats. It has been noted that the quality of the TRMM is not perfect: 'Although the TRMM PR responds directly to precipitation size hydrometeors, it operates with a single attenuating frequency (13.8 GHz) that necessitates significant microphysical assumptions regarding drop size distributions for relating reflectivity, signal attenuation and rainfall, and uncertainties in microphysical assumptions for the primary TRMM algorithm (2A25) remain problematic' [19]. However, the major source of information for TRMM 3B42 is passive microwave and infrared observations, and not the radar-based observations by TRMM PR. Also, it was assumed that the TRMM suffers less from such shortcomings for rainfall area AP than for the rainfall intensity  .
.
Table 2. Estimated globally accumulated masses of water from the ERA-Interim and TRMM data. The mean values were estimated for the entire records: 1998–2016 for TRMM and 1979–2016 for ERA-Interim.
| Statistic | 50°S–50°N | 90°S–50°S | 50°N–90°N |
|---|---|---|---|
| ERA-Interim Atm. H2O (106 giga-ton) | 415 | 15 | 21 |
| ERA-Interim Evaporation (giga-ton/day) | −119 | −4 | −5 |
| ERA-Interim Total precipitation rate (giga-ton) | 1300 | 116 | 107 |
| TRMM mean AP (km2) | 91 | ||
| TRMM mean AP over oceans (km2) | 73 | ||
| TRMM mean AP over land (km2) | 22 | ||
| TRMM P (giga-ton) | 1137 | ||
| TRMM P over oceans (giga-ton) | 876 | ||
| TRMM P over land (giga-ton) | 259 |
Inhomogeneities are expected to be present in data products derived over time with occasional introduction of new instruments with better capacities and higher accuracy, and reanalyses should not be trusted for trend analyses in climate change studies, due to inhomogeneities introduced with a changing observational platform [20]. Furthermore, the precipitation in reanalyses are model-simulated quantities and not as reliable as direct observations. However, a clearer picture may emerge by combining independent sources of information and multiple lines of evidence. Other independent studies provide a consistent picture with a decrease in AP and indicate changes in rainfall patterns and clouds, such as higher cloud tops [21] implying greater precipitation intensities, a widening of the Hadley cell [22, 23], and changes in the ocean salinity [24]. A comparison between P from TRMM, ERA-Interim and similar published statistics suggested a reasonable agreement with independent estimates: There have been a number of attempts to quantify the global rate of precipitation, and Zektser et al (1993) reported an estimate of P of 834 mm year−1 (292 giga-ton day−1), but only for Earth's land surface [25]. Global estimates for both land and ocean are in the range 2.6 mm day−1−3.1 mm day−1 (1329–1585 gigaton day−1) [17] or 2.46–2.90 mm day−1 (1258–1482 gigaton day−1) [18]. These numbers are similar to corresponding estimates from TRMM and ERA-Interim (tables 1 and 2).
The daily precipitation area AP has been little discussed in the literature despite its importance. For instance, there is no reference to AP in the IPCC assessment reports [26, 27, 19, 28, 29, 30]. One reason may be that there has been scarce information about the daily precipitation area on a global scale. The emergence of improved reanalyses and satellite data spanning decades now enables new information which improves our abilities to study AP. The best information presently at hand suggests that the precipitation area is shrinking, but there are still large uncertainties. Further studies based on daily precipitation from high-resolution GCMs are needed to elucidate this further. One important take-home message is that daily and monthly AP should be included in the list of essential climate variables provided by GCMs, in addition to globally aggregated estimates of total precipitation P and evaporation E to provide a global indicator of the simulated climate. These aspects should also be considered when assessing climate change, as traditional climate sensitivity only includes changes in the temperature and does not provide information about changes to the hydrological cycle and rainfall patterns.
The precipitation area is associated with cloudiness and hence connected to the planetary albedo in addition to the vertical energy flow within the planetary system through evaporation, convection, condensation, and precipitation. It has been suggested that galactic cosmic rays (GCR) affect earth's climate though clouds [31], but empirical evidence for such a connection have been absent [32] and the correlation between daily AP and GCR measured by the Climax neutron counter in Colorado [33] was indistinguishable from zero (see the SM for more details).
5. Conclusion
Satellite-based TRMM suggest that the spatial extent of 24 hrs precipitation has declined over the past decades, accompanied by an increase in the precipitation intensity, i.e. falling as more spatially concentrated rain. This trend is still uncertain due to the limitation of the data and the difficulty to calculate the exact value of AP. The estimate of AP was sensitive to both spatial resolution and temporal scale, but the estimate of the global precipitation rate was consistent in the TRMM-based analysis and the ERA-Interim reanalysis, and of the order 1500 giga-ton/day. A regression analysis suggested that the daily precipitation area diminishes with the global mean temperature, and used with global climate model simulations, crude projections for the future suggested a decrease in daily precipitation area by 28% by 2100. For monthly accumulated precipitation, however, the area appears to experience an increase over time, as the area of monthly precipitation is influenced by migratory phenomena and the area is estimated for amounts that are aggregated over longer time scales.
Acknowledgments
I acknowledge the teams at NASA and ECMWF whose efforts have produced the TRMM and ERA-Interim data, CMIP5 and the participating modeling groups, the World Climate Research Programme's Working Group on Coupled Modeling responsible for CMIP, as well as the means for analysis (R-studio and R). The GCMs were downloaded from the KNMI ClimateExplorer (https://climexp.knmi.nl). The HadCRUT4 was developed by the UK MetOffice and the Climate Research Unit at University of East Anglia, UK. This work has been supported by the Norwegian Meteorological Institute. The author has no competing interests, and all data needed to evaluate the conclusions in the paper are present in the paper and/or the supplementary materials available at stacks.iop.org/ERL/13/044022/mmedia. Additional data available from authors upon request.