

Abstract
Better preparedness for summer heatwaves could mitigate their adverse effects on society. This can potentially be attained through an increased understanding of the relationship between heatwaves and one of their main dynamical drivers, atmospheric blocking. In the 1979–2015 period, we find that there is a significant correlation between summer heatwave magnitudes and the number of days influenced by atmospheric blocking in Northern Europe and Western Russia. Using three large global climate model ensembles, we find similar correlations, indicating that these three models are able to represent the relationship between extreme temperature and atmospheric blocking, despite having biases in their simulation of individual climate variables such as temperature or geopotential height. Our results emphasize the need to use large ensembles of different global climate models as single realizations do not always capture this relationship. The three large ensembles further suggest that the relationship between summer heatwaves and atmospheric blocking will not change in the future. This could be used to statistically model heatwaves with atmospheric blocking as a covariate and aid decision-makers in planning disaster risk reduction and adaptation to climate change.
Export citation and abstract BibTeX RIS

Original content from this work may be used under the terms of the Creative Commons Attribution 3.0 licence.
Any further distribution of this work must maintain attribution to the author(s) and the title of the work, journal citation and DOI.
1. Introduction
Summer heatwaves have notoriously large impacts on our societies, some of which may be alleviated through increased preparedness (Field 2012, Perkins 2015). Following the devastating excess mortality during the European heatwave in 2003 (Robine et al 2008), several countries introduced public health plans in an effort to reduce adverse health effects of heatwaves (Vicedo-Cabrera et al 2016). Consequently, the heatwave of 2006 in France caused significantly less excess mortality than occurred in 2003 (Fouillet et al 2006, Fouillet et al 2008). Similar outcomes could be observed in Rome and Athens (de'Donato et al 2015), as well as in England (Green et al 2016).
Table 1. Description of the three model ensembles.
| Abbreviation used | Model name | Number of ensemble members | Spatial resolution | Scenarios | Reference |
|---|---|---|---|---|---|
| CanESM2 | CanESM2 | 50 | 2.5° × 2.5° | Historical+RCP8.5 | Arora et al (2011), Fyfe et al (2016) |
| CESM-CAM4 | NCAR CESM with CAM4 | 21 | 1.9° × 2.5° | Historical+RCP8.5 | Fischer and Knutti (2013a) |
| CESM-CAM5 | NCAR CESM with CAM5 | 40 | 1° × 1° | Historical+RCP8.5 | Kay et al (2016) |
A better understanding of the drivers of heatwaves could potentially lead to better predictability and higher level of preparedness. Usually, heatwaves are associated with a previously advected anomalously warm and dry air mass co-located with a high pressure system (Perkins 2015). Land-surface processes (e.g. Fischer et al 2007, Zampieri et al 2009), adiabatic warming of sinking air and anomalous clear-sky radiative forcing in regions affected by atmospheric blocking are believed to be the dominant mechanisms to maintain and amplify a heatwave (e.g. Bieli et al 2015). Particularly, in the Northern Europe-Western Russia region, most summer heatwaves are indeed associated with atmospheric blocking (in the following simply referred to as blocking) (Della-Marta et al 2007, Pfahl and Wernli 2012). Blocking is a meteorological situation in which the usual westerly flow at mid-latitudes is diverted for a period ranging from a few days to several weeks by a persistent and stationary high pressure system (Rex 1950, Tibaldi and Molteni 1990). The physical processes involved in blocking are currently still under discussion (e.g. Pfahl et al 2015).
There is a well-known relationship between blocking and temperature extremes, which has been studied widely for winter (Buehler et al 2011, Sillmann et al 2011, Sillmann and Croci-Maspoli 2009) and spring (Brunner et al 2017, Cassou et al 2005). Summer blocking over the North Atlantic-European region however has been more difficult to investigate up to now because it occurs less often than winter blocking (Stefanon et al 2012). Therefore, the link between summer heatwaves and blocking is difficult to assess from the observational record only, but large climate model ensembles are useful to obtain a more robust understanding. Looking at the recent decades, Pfahl and Wernli (2012) show that up to 80% of summer warm extremes are collocated with blocking. This suggests that there is potential to improve our preparedness for summer heatwaves if we are able to better understand their link with blocking and if predictions of blocking can be improved, for example in monthly to seasonal forecasts. Cassou et al (2005) found that European heatwaves are partly associated with tropical Atlantic diabatic heating anomalies and given their predictability, there are encouraging prospects for seasonal forecasting. Weisheimer et al (2011) also showed that with appropriate land surface hydrology and improved formulations of radiative and convective parametrizations, seasonal forecast models are able to predict the atmospheric conditions of the 2003 heatwave in Europe.
While previous studies have considered the summer blocking-heatwave relationship, it has been mostly done for individual events in the reanalysis period. Here we investigate the robustness of the relationship between blocking and heatwaves in summer in present and in future climate using three newly-available large ensembles of climate model integrations. Zscheischler and Seneviratne (2017) point out that climate models need to be validated also on their ability to represent the relationship between variables, in our case, blocking and heatwaves. By using three large model ensembles we can obtain robust statistics about such rare events and quantify model structural uncertainty as well as uncertainty due to internally generated climate variability. Further, instead of using a moderate temperature threshold to identify heatwaves as in Pfahl and Wernli (2012) or an absolute index as in Sillmann et al (2011), we apply a more comprehensive heatwave index to capture extreme and multi-day events. We focus on northern Europe and western Russia; two regions having experienced an extreme heatwave in the recent past and where blocking occurrence is high. The datasets and metrics are described in detail in section 2, followed by the statistical methods in section 3. The results and their discussion are presented in section 4 and we provide conclusions in section 5.
2. Datasets and metrics
The analysis described in this study is based on three large Earth System model (ESM) ensembles performed with the CanESM2 model (referred to as CanESM2), the NCAR CESM model using CAM4 (referred to as CESM-CAM4) and the NCAR CESM model using CAM5 (referred to as CESM-CAM5) (see table 1 for more information). We use the ERA-Interim reanalysis (Dee et al 2011) for the period 1979–2015 at 0.75° × 0.75° spatial resolution as reference dataset (referred to as ERAI in the following). Only the boreal summer season (June−July−August) and land grid points are considered throughout the paper.
We apply two metrics to describe the two weather phenomena of interest here, blocking and heatwaves.
2.1. Atmospheric blocking
Blocking is diagnosed using a two-dimensional (2D) blocking index derived from daily 500 hPa geopotential height (Z500) according the method of (Tibaldi and Molteni 1990), butgeneralized to vary in both latitude and longitude by (Scherrer et al 2006). An additional spatio-temporal filtering following (Woollings et al 2008) is applied to select events of desired spatial scale and duration (see Anstey et al (2013) and supplementary information section B for further details available at stacks.iop.org/ERL/13/054015/mmedia). The Z500-based blocking index used here is convenient because daily Z500 data are readily available from the three different model ensembles and it can accommodate model biases in the sense that it does not presuppose the latitudes at which blocking should occur. A disadvantage of a 2D blocking index is that it may identify events at low latitudes that do not represent persistent Z500 anomalies associated with jet stream displacements (such as the climatological reversal of the Z500 gradient in low latitudes). For this reason, we restrict our area of study to 45°−75°N (see figure S2) and define a European region as 0°E–30°E and a Russian region as 30°E–60°E (see figure 1).
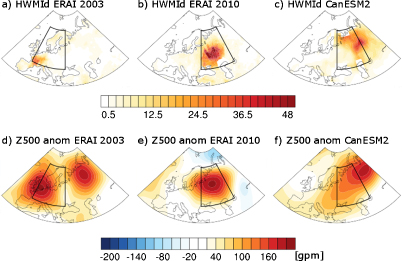
Figure 1. Maps of the HWMId (shaded, dimensionless) and associated Z500 anomalies (shaded in gpm) averaged over the 8 days following the start of the summer's maximum heatwave at each grid point for (a) and (d) the 2003 European heatwave, (b) and (e) the 2010 Russian heatwave and (c) and (f) an event similar to the 2010 Russian heatwave in the CanESM2 ensemble (labelled with an orange cross in figure 2(b)). The black boxes indicate the regions for computing area-weighted average of blocked days and the area-weighted average of heatwave magnitudes (see section 3).
Download figure:
Standard image High-resolution image2.2. Heatwaves
A heatwave is defined as a period of at least three consecutive days for which daily maximum temperature on each day exceeds a specified threshold. This threshold is defined as the 90th percentile of climatological daily maximum temperatures, centered on a 31 day window, for the base period 1981–2010. The magnitude of each individual heatwave within each summer (Mhw) is defined as the sum of the daily magnitudes Md of the consecutive days composing a heatwave. The daily magnitude Md at each grid point is calculated, for each day within a heat wave, as follows:
Figure 2. Relationship between the area-weighted average of blocked days and the area-weighted average of heatwave magnitudes for the period 1979–2015 in the ERA-Interim reanalysis (ERAI) and the three model ensembles, CESM-CAM4, CanESM2 and CESM-CAM5 for (a) the European region and (b) the Russian region. The points for ERAI are labelled for the six most extreme years in the respective region. In (b) the most extreme case in CanESM2 is shown as an orange cross. Download figure:

where Td is the daily maximum temperature on the d'th day of the heatwave. T30y25p and T30y75p are the 25th and 75th percentiles of the distribution (30 values) of maximum Td of each year in 1981–2010. The maximum value of Mhw occurring within a given summer, which we take to represent the largest heat wave in that summer, is then defined as the heatwave index at that grid point for that summer. This index is referred to as the Heatwave Magnitude Index daily (HWMId) (Russo et al 2015, 2016), and the start date and duration of the largest heatwave in each summer are also recorded. The HWMId is an integrated standardized measure of heat wave intensity that allows the comparison of heatwave intensity between different climatic regions (see Russo et al (2014, 2015, 2016)), and is therefore particularly useful to compare heatwaves with other variables as done in this study. As discussed in the first version of the HWMId (called HWMI, see Russo et al (2014)), other heatwave indices, like the Warm Spell Duration Index or the average of temperature during fixed number of consecutive hot days (e.g. mean temperature of three consecutive hot days) take into account only one aspect of a heatwave, such as duration or average temperature with fixed duration. The HWMId takes into account both temperature anomaly and duration during consecutive hot days. Note that, as suggested for other climate indices by the Expert Team on Climate Change Detection and Indices (ETCCDI), to avoid possible inhomogeneity of the HWMId values inside and outside of the base period (1981–2010), the HWMId calculation for the base period is done by using a bootstrap procedure. Details are described in Zhang et al (2005) and Sippel et al (2015). Russo et al (2015) showed that this index captures the top ten European heatwaves in the recent past, as reported in newspapers. As an illustration, figure 1(a) and (b) show the HWMId of summer 2003 and 2010 in ERAI along with the corresponding European and Russian regions.
3. Methods
As a preliminary analysis, we assess the relationship between strong heatwaves (HWMId≥10) and the 7 leading weather regimes over Europe, and find, as expected, that 70% of the grid points experiencing a strong heatwave occur during either a European, Scandinavian or Greenland blocking regime (see supplementary information section A and figure S1 for more information). To further quantify the way in which heatwaves in Europe and Russia are associated with blocking, we condition our analysis on the presence of a heatwave in summer in the European and Russian region. There are cases when, for a given summer, more than one heatwave is identified in a given region and they occur at different times. We then only retain the strongest heat wave: For each summer, and at each grid point, if a heatwave has occurred according to the definition given in section 2.2 then the HWMId is the magnitude of the strongest heatwave at that grid point (and as noted in section 2.2, the start date and the length of that heatwave are also retained).
To ensure that a heatwave identified by the HWMId is associated with a given blocking event, we perform the analysis grid point by grid point. This is a reasonable approach but still a stringent criterion as exact co-location cannot be expected for all cases. The relationship captured in our study can thus be considered as rather conservative, given that Pfahl and Wernli (2012) found that around 20% of the heatwaves in the considered regions will not be exactly co-located with a blocking.
For each summer and grid point with HWMId>0, we count how many days were blocked at that grid point during a nine day period starting one day before the onset of the heatwave. Choosing the length of the heatwave instead of a fixed period gives higher correlations but the higher correlations are due to the fact that heatwaves of larger magnitudes last longer (not shown), which is not a process we want to capture in this study. A fixed nine day period represents a good balance between a period that is too short (we have defined heatwaves as being at least three days long; section 2.2) and a period that is too long, during which it could be possible for a blocking event to end and a new event, unrelated to the heatwave, to start. The exact definition of the period does not affect the results, as shown in table S1. Having obtained the heatwave magnitude and blocked days count at each grid point per summer, we compute their area-weighted average for each of the two regions (Europe and Russia, as defined in section 2.1; see also figure 1). We refer to these two numbers as area-weighted average of blocked days (ABD) and area-weighted average of heatwave magnitudes (AHM).
Table 2. Spearman's rank correlation coefficients (values in italic are not significant at the 5% level) for the period 1979–2015 in ERAI and the three climate model ensembles considered. For Russia in ERAI, the value in brackets is obtained when 2010 is excluded. For the three climate model ensembles, the median correlation coefficient obtained for any ensemble member is shown, along with the minimum and maximum correlation coefficients in brackets.
| ERAI | CanESM2 | CESM-CAM4 | CESM-CAM5 | |
|---|---|---|---|---|
| Europe | 0.54 | 0.7 (0.45−0.83) | 0.67 (0.47−0.83) | 0.64 (0.06−0.81) |
| Russia | 0.79 (0.78) | 0.72 (0.41−0.87) | 0.6 (0.43−0.81) | 0.64 (0.33−0.81) |
4. Results and discussion
We first calculate the Spearman's rank correlation coefficient between the ABD and AHM in ERAI for the period 1979–2015. For both regions, we find significant correlations at the 1% level of ρ = 0.54 in Northern Europe and ρ = 0.79 in Western Russia (see table 2). If we instead use the original Scherrer et al (2006) blocking index, slightly lower but still significant correlations, and lower ABD, are obtained, as shown in figure S4. Overlaying the data from the three model ensembles shows that they encompass the ERAI data well (figure 2). This is an important result since it shows that even if models underestimate the number of blocked days in the considered regions (figure S3), when looking at the relationship between blocking and heatwaves, the model ensembles show a similar relationship as the reanalysis (table 2). Brunner et al (submitted) further show that these significant correlations in ERAI and CanESM2 do not depend on the exact definition of the region. While it might be difficult to justify the use of models to project the future for variables or indicators with known biases like blocking, we may be more confident in such projections when the relationship between two variables of interest is represented correctly. CanESM2 and CESM-CAM4 show a range of positive and significant correlations, and the value obtained with ERAI falls within this range, but the CESM-CAM5 also has 3 out of 40 ensemble members in Europe and 1 out of 40 in Russia with no significant Spearman's rank correlation at the 5% level (table 2).
The famous heatwaves of 2003 in Europe and 2010 in Russia stand out in figure 2, but the extremeness of these two events with respect to the distributions provided by the large ensembles is very different. The 2003 heatwave, although the strongest heatwave in ERAI, was by far not as extreme as what we could expect based on the three ensembles. This outcome emphasizes the importance of considering large ensembles along with the single observed realization to get a clear picture of the rarity of extreme events. Russo et al (2014) indeed showed that none of the CMIP5 models were able to capture the 2010 heatwaves when only one of their ensemble members was considered. On the other hand, the Russian event in 2010 is outside the present-day simulations of CESM-CAM5 and CESM-CAM4, but is within the simulated range of CanESM2.
To investigate this further, we also show maps of the HWMId and Z500 anomalies in the most extreme CanESM2 ensemble member (identified by an orange cross in figure 2(b)) in figure 1(c)−(f). This heatwave in CanESM2 appears to be slightly weaker but on a larger scale than the 2010 heatwave in ERAI (see figure 1(c)). It is worth noting that the model with lowest resolution, CanESM2, is the one able to simulate the magnitude of the most extreme heatwave event in the reanalysis. This may be consistent with the expectation that horizontal resolution seems to play a minor role for summer blocking (Schiemann et al 2017), although figure S3 indicates that CESM-CAM5, with the highest horizontal resolution (table 1), has the smallest bias in summer blocking in both the European and Russian regions. It should also be noted that the standardization with the climatological 25%–75% quantiles used in the HWMId calculation (section 2.2) corrects for model biases in temperature, and hence corroborates the usefulness of using such a complex index to characterize heatwaves.
While we found a significant relationship between strong heatwaves and the number of blocked days in the two regions in the present climate in both ERAI and the three large model ensembles, we are now interested to quantify if this relationship holds in the future. With continuing emissions of CO2 from human activities and the consequent increase in global mean temperature, heatwaves are expected to become stronger in the future (IPCC 2013, Seneviratne et al 2012). Unsurprisingly, this is seen in the evolution of the HWMId (captured through the AHM in this study) during the course of the 21st century in all three ensembles (compare blue and red distributions in figure S5; note that both present-day and future HWMId for this figure were calculated using the present-day base period as described in section 2.2). Following Schaller et al (2016), we apply a simple statistical method to quantify whether this increase in AHM is mainly due to dynamics, here quantified by the ABD, thermodynamics or a combination of thermodynamics and dynamics (see supplementary information, section C, for more information). We find that for the 1-in-20 year heatwave (as approximated by the AHM) the increase is driven primarily by thermodynamics (see figure S5), which is in line with no significant trend in the number of blocked days during summer in any of the models (figure S3). This is however a first order estimation and assumes that blocking is the only dynamical process influencing a heatwave.
To allow for a fair comparison of the relationship between heatwaves and blocking in the present and future climate, the HWMId for the future climate is recomputed with the base period 2070–2099. Figure 3 compares the heatwave-blocking relationship in the present and future periods. There is no significant change (according to either a two-sided Kolmogorov-Smirnov or Student's t-test) between present and future for any ABD category, which indicates that the relationship does not change in the future (given that the heatwaves are calculated relative to the respective climate).

Figure 3. Similar as figure 2 but with the data binned according to the area-weighted average of blocked days. Light colors represent the 1981–2010 period (with 1981–2010 used as reference period to calculate the HWMId), and dark colors the 2070–2099 period (with 2070–2099 used as reference period to calculate the HWMId); orange for CanESM2, blue for CESM-CAM4 and green for CESM-CAM5. The box and whisker plots show the median, interquartile range and 1.5 times the interquartile range, and circles show outliers.
Download figure:
Standard image High-resolution image
5. Conclusion
Our analysis revealed that extreme heatwaves are mostly associated with blocking, as has been shown in previous studies (Cassou et al 2005, Pfahl and Wernli 2012). However, the novel aspect here is that by using large climate model ensembles we can show a robust relationship between heatwaves and blocking compared to a reanalysis for both study regions, Northern Europe and Western Russia, despite the known difficulties they have in simulating blocking frequency over the North Atlantic (Davini and D'Andrea 2016). The three model ensembles suggest that under present-day climate conditions we could experience even larger heatwaves, as defined with the HWMId index, than the one observed in 2003 in Central Europe. Only one ensemble realization of the CanESM2 model was able to simulate a case similar to the Russian heatwave in 2010, which was the most severe heatwave in the 1950–2015 period in Europe (Russo et al 2015), suggesting that this event is the most extreme both in the observations and in the model simulations. None of the realizations of the ensembles based on the CESM model, regardless of their resolution or version of the atmospheric component, were able to simulate such a case. This indicates that some current ESMs may have biases that prevent them from simulating some types of heatwaves, and underlines the need to use large ensembles of multiple ESMs when assessing the likelihood and associated uncertainties of very extreme events.
The analysis of short time periods or small model ensembles can lead to misleading results and is associated with large uncertainties. As pointed out, for instance, in Kendon et al (2008) and Fischer et al (2013b), large ensembles of climate simulations are needed to realistically represent internally generated climate variability and its manifestation in terms of climate extremes.
Sillmann et al (2017) recently stressed the need to better understand both the thermodynamic and dynamic processes leading to a heatwave. In this vein, accounting for blocking in influencing the magnitude of particular heatwave events in the future will remain highly relevant as it is a primary factor in explaining the year-to-year variability in heatwave occurrence. The three model ensembles clearly indicate that the relationship between blocking and relative heatwave magnitudes does not change in the future. This allows for conditional statements—for instance, using blocking as covariate in the statistical modeling of heatwaves (e.g. Sillmann et al (2011)).
An improved understanding of the relationship between blocking and heatwaves and its representation in decision support tools could aid planners and decision-makers to make better informed decisions for disaster risk reduction and adaptation to climate change. Based on our findings, and if blocking events or their probability of occurrence could be more skillfully predicted in monthly to seasonal forecasts, this information would be particularly useful to increase our preparedness for extreme heatwaves in the future. However, the summer blocking frequency itself is not expected to change significantly in the future, and thus would not affect to the overall intensification and more frequent occurrence of heatwaves due to global warming (see e.g. Russo et al (2014)).
Acknowledgments
NS and JS are supported by ClimateXL (project no. 243953) funded through the Norwegian Research Council. CMG acknowledges funding by the Swiss National Science Foundation (SNSF) grant PZ00P2_148177/1.