

Abstract
Discriminating climate impacts between 1.5 °C and 2 °C warming levels is particularly important for Central Africa, a vulnerable region where multiple biophysical, political, and socioeconomic stresses interact to constrain the region's adaptive capacity. This study uses an ensemble of 25 transient Regional Climate Model (RCM) simulations from the CORDEX initiative, forced with the Representative Concentration Pathway (RCP) 8.5, to investigate the potential temperature and precipitation changes in Central Africa corresponding to 1.5 °C and 2 °C global warming levels. Global climate model simulations from the Coupled Model Intercomparison Project phase 5 (CMIP5) are used to drive the RCMs and determine timing of the targeted global warming levels. The regional warming differs over Central Africa between 1.5 °C and 2 °C global warming levels. Whilst there are large uncertainties associated with projections at 1.5 °C and 2 °C, the 0.5 °C increase in global temperature is associated with larger regional warming response. Compared to changes in temperature, changes in precipitation are more heterogeneous and climate model simulations indicate a lack of consensus across the region, though there is a tendency towards decreasing seasonal precipitation in March–May, and a reduction of consecutive wet days. As a drought indicator, a significant increase in consecutive dry days was found. Consistent changes of maximum 5 day rainfall are also detected between 1.5 °C vs. 2 °C global warming levels.
Export citation and abstract BibTeX RIS

Original content from this work may be used under the terms of the Creative Commons Attribution 3.0 licence.
Any further distribution of this work must maintain attribution to the author(s) and the title of the work, journal citation and DOI.
1. Introduction
The COP21 Paris Agreement is arguably a defining moment in the quest to stabilize greenhouse gas concentrations in the atmosphere at a level that would prevent dangerous anthropogenic interference with the climate system and reduce the risks and impacts of climate change (Jacquet and Jamieson 2016, Peters 2016, Schellnhuber et al 2016). The agreement's aim is 'holding the increase in global average temperature to well below 2 °C above pre-industrial levels and pursuing efforts to limit the temperature increase to 1.5 °C'. For that purpose, it also seeks to achieve a balance between anthropogenic emissions by sources and removals by sinks of greenhouse gases in the second half of this century, on the basis of equity, and in the context of sustainable development and efforts to eradicate poverty. Nationally determined contributions will be evaluated on a 5 year cycle through a global stocktaking mechanism being established by the United Nations Framework Convention on Climate Change (UNFCCC), supported by a facilitative dialogue in 2018, and a first formal review in 2023. The Paris Agreement issued an invitation to the Intergovernmental Panel on Climate Change (IPCC) to provide a special report in 2018 on the impacts of global warming of 1.5 °C above pre-industrial levels and related global greenhouse gas emission pathways. This has opened the debate on the need to sharpen climate science research, from discussing the drivers of climate change, to assessing climate influence on the habitability of the Earth and its regions (Hulme 2016, Marotzke et al 2017, Schleussner et al 2017). The IPCC accepted the invitation at its 43rd Session (11–13 April 2016, Nairobi, Kenya), noting the context of strengthening the global response to the threat of climate change, sustainable development and efforts to eradicate poverty.
Investigating the differential climate impacts between 1.5 °C and 2 °C warming levels is particularly important for Central Africa, a vulnerable region which may be sensitive to warming, and where multiple biophysical, political, and socioeconomic stresses interact to increase the region's susceptibility and constrain its adaptive capacity. Much of vulnerability to climate change lies in the fact that its agricultural systems remain largely rain-fed and underdeveloped, as the majority of farmers are small-scale farmers with few financial resources, limited access to infrastructure, and disparate access to information. From the geophysical standpoint Central Africa is a complex climatic zone, occupied in its southern flank by the Congo basin rainforest and in the northern flank by savannah, which marks a transition towards the Sahel. This is also one of the three main convective regions of the planet, which encompasses the second largest rainforest on Earth, the largest river basin in Africa and plays a significant role in planetary circulation. Due to a lack of conventional monitoring data and the tendency to treat separately East (Williams and Funk 2011) and West (Redelsperger et al 2006, Schubert et al 2016) Africa, little attention has been devoted to understanding climate drivers over Central Africa. Rainfall maxima occur during the rainy seasons of March–April–May (MAM) and September–October–November (SON), and are associated with the meridional migration of the inter-tropical convergence zone and the life cycle of mesoscale convective systems (Jackson et al 2009, Kamsu-Tamo et al 2014). Eastward propagating signals (convectively coupled equatorial Kelvin wave and Madden-Julian oscillations) are highly dominant in the precipitation variability modes during northern spring (MAM). So, while individual rain-producing systems are moving westward, their activities are highly modulated by sub-regional and regional scale envelopes moving to the east.
The IPCC fifth assessment report (AR5) assesses the scientific, technical and socio-economic information relevant to understanding the risks of human-induced climate change, its potential impacts and options for adaptation and mitigation (Aalst et al 2014, IPCC 2014, IPCC 2013). The report concludes that anthropogenic influence on the climate system is clear, and recent anthropogenic emissions of greenhouse gases are the highest in history. The AR5 finds the increase in the global temperature has reached approximately 1 °C above pre-industrial levels, but recent data suggests that 2016 was 1 °C greater than the baseline period (WMO, https://library.wmo.int/opac/doc_num.php?explnum_id=3414). There is also growing evidence of warming over Africa, consistent with anthropogenic climate change, and the potential for climate change to affect ecosystems and exacerbate existing stress on water availability in the future (Christensen et al 2013). Most of Sub-Saharan Africa is insufficiently well sampled in observational datasets to allow for a robust likelihood statement at the continental scale, but sub-regions for which data are available exhibit a warming in temperature extremes (SREX: IPCC 2012). There has been limited attention in previous research, and IPCC reports, on climate change over Central Africa. Recent observational (Aguilar et al 2009, Hua et al 2016) and numerical (Haensler et al 2013, Fotso-Nguemo et al 2018) studies have demonstrated some changes in the thermal and hydrological cycle over Central Africa; however this warrants further research, particularly with regard to the potential implications of 1.5 °C and 2 °C of global warming.
The use of dynamical downscaling with regional climate models (RCMs) is the conventional approach to perform affordable high resolution climate simulations at the regional-to-local scale and assess the response of regional climate to future global change of forcings (van den Hurk and van Meijgaard 2010, Feser et al 2011, Diallo et al 2014, Evans et al 2014, Omrani et al 2015, Zou et al 2016, Scinocca et al 2016, Black et al 2016). RCMs are forced by time-variable atmospheric conditions along their lateral boundaries. These constraints are provided either through global climate model (GCM) scenarios or quasi-observed conditions from global reanalyses which provide realistic representation of the large-scale atmospheric conditions over the region, as well as remote influences on these. RCMs are therefore constructed for limited areas with a higher resolution to describe regional-scale climate variability and change. RCMs, because of their significantly higher spatial resolution, provide an improved physical representation of the mesoscale processes, which are often poorly captured by coarse spatial resolution GCMs.
The Coordinated Regional climate Downscaling Experiment (CORDEX), sponsored by the World Climate Research Programme, provides a platform for a joint evaluation of model performance, along with a solid scientific basis for impact assessments and other uses of downscaled climate change information worldwide (Giorgi et al 2009, Gutowski et al 2016). CORDEX is organized in a similar way to the Coupled Model Intercomparison Project phase 5 (CMIP5) for global model simulations, with predefined model regions, grids, experiment design, output variables, and output format.
This work uses the CORDEX simulations and framework to investigate the multi-model response of precipitation and temperature changes over Central Africa, under 1.5 °C and 2 °C global warming levels. The aim is to explore the uncertainty and consensus among regional climate model projections. This is the first time a large ensemble of 25 RCMs' simulations is used over Central Africa, and the first paper focusing on 1.5 °C and 2 °C changes over this region. In section 2 we describe the study area, methodology and datasets used. Section 3 starts with brief assessment of RCM performance over Central Africa, followed by examination of the projected changes in climatology and in some climate extremes indices. Summary and conclusions are provided in section 4.
2. Methods
2.1. Study area
We define Central Africa as the region located approximately between latitudes 15° S and 15° N, and longitudes 5° E and 35° E. The region's climate is complex and varies spatially. While coastal and central areas experience an equatorial climate (with two rainy seasons), the northern parts undergo a semi-arid climate regime (with a single rainy season). Precipitation is strongly variable in space and time due to its convective nature. The length of the rainy season varies with latitudes. Annual average temperature ranges from 26 °C–30 °C.
2.2. Model data
This study is based on daily temperature and precipitation output data from the CORDEX-Africa multi-RCMs ensemble of transient simulations described in Nikulin et al (2018, table 2S). The ensemble consists of 25 RCM simulations including 10 simulations from the Swedish agency for weather, climate, hydrology, and oceanography, all used to downscale large-scale driving fields from a set of 13 CMIP5 GCMs (Taylor et al 2012) over a Pan-African numerical domain, using a grid-spacing of 0.44° (approximately 50 km). The control simulations, forced by observed natural and anthropogenic atmospheric composition (CO2 and non-CO2 greenhouse gases, aerosols, and land cover), cover the period from 1950–2005, whereas climate projections (2006–2100) are forced with emissions from the Representative Concentration Pathways (Moss et al 2010, van Vuuren et al 2011). AR5 uses four RCPs to describe scenarios for future emissions, concentrations, and land-use, ending with radiative forcing levels of 2.6, 4.5, 6.0, and 8.5 W m−2 by 2100. RCP 2.6 assumes that strong mitigation policies result in a low forcing level and a peak between 2010–2020 for global annual GHG emissions (measured in CO2-equivalents), with emissions declining substantially thereafter. Emissions in RCP 4.5 peak around 2040, then decline. In RCP 6.0, emissions peak around 2080, then decline. In RCP 8.5, emissions continue to rise throughout the 21st century. RCPs are not fully integrated scenarios i.e. a complete package of socioeconomic, emissions and climate projections. RCPs are only consistent with components of radiative forcing that meant to serve as input for climate modelling, pattern scaling and atmospheric chemistry modelling.
RCP8.5 combines assumptions about high population and relatively slow income growth with modest rates of technological change and energy intensity improvements, leading in the long term to high energy demand and GHG emissions in absence of climate change policies (Riahi et al 2011). Compared to the total set of RCPs, RCP8.5 receives more attention in the climate modelling community and corresponds to the pathway with the highest greenhouse gas emissions. It is technically possible to limit radiative forcing from RCP8.5 to lower levels comparable to other RCPs (2.6–6 W m−2). CMIP5 RCPs were not designed to address GWL concerns, nor to analyze difference between the effects of 1.5 °C and 2 °C of global warming (James et al 2017). Of the existing RCP2.6 GCM simulations, which can be considered as the most appropriate proxy for holding GWL below 2 °C, only ten CORDEX-Africa simulations have been generated by only two RCMs (see for detail Nikulin et al 2018, table 2S). In this study, therefore, we utilise the CORDEX-Africa runs driven by the RCP8.5 scenario, as, first, it comprises the largest ensemble (25 runs) and, second, may be considered as the most realistic business-as-usual scenario given the current trajectory of greenhouse gases emissions.
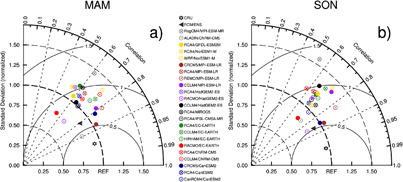
Figure 1. Seasonal Taylor diagrams showing the spatial comparison between the observed and simulated Central Africa mean precipitation over land for the control period in (a) MAM and (b) SON. GPCC was taken as reference dataset. The multi-model ensemble mean and the CRU are also shown for comparison.
Download figure:
Standard image High-resolution image2.3. Metrics and definition of 1.5 °C and 2 °C global warming levels
There are several approaches to simulate 1.5 °C and 2 °C global warming above preindustrial levels, with different pathways, as well as range of methods for identifying regional climate signals associated with global temperature limits (James et al 2017). Each of these methods shows strengths and weaknesses. In this paper, we use GCMs' transient climate simulations to define a 1.5 °C or 2 °C warming period. We take 1861–1890 to define the pre-industrial (PI) period as it is available across all CMIP5 historical simulations. Then for each GCM downscaled the timing of the relevant GWL is defined as the first time the 30 year moving average (centre year) of global temperature is above 1.5 °C or 2 °C compared to pre-industrial. The corresponding 30 year period is then extracted from the downscaling RCM for analysis using 1971–2000 as a control period. It is worth highlighting that the computed changes in regional climate do not therefore represent the total change induced by 1.5 °C or 2 °C of global warming, as significant global temperature increase had already been experienced by 1971–2000 Rather, the changes computed here represent the difference between the late 20th century climate and the climate projected in a 1.5 °C or 2 °C world. Further details about the methodology, definition of warming levels, models and experimental design are described in a companion paper (see for detail Nikulin et al 2018, table 1S).
The analysis of climate change in Central Africa focuses on seasonal mean precipitation and temperature, together with drought and flood indices: consecutive dry days (CDD), for quantifying drought risk, and three indices for flood risk including the consecutive wet days (CWD), total wet day precipitation (PRCPTOT) and maximum consecutive five day precipitation (rx5day). We examine the range of modelled responses, and then present the multi-model response. There are also many methodologies used to determine the robustness of a climate change signal (see Collins et al 2013). We consider a climate change signal robust if the following two conditions are fulfilled (i) more than 80% of model simulations agree on the sign of the change, (ii) the signal to noise ratio, i.e. the ratio of the mean to the standard deviation of the ensemble of climate change signals, is equal to or larger than one. The first criterion considers model agreement and the second is a measure of the strength of the climate change signal (with respect to the inter-model variability in that signal). We use both in defining robustness because the first criterion may be fulfilled even in the case of a very small, close to zero change.

Download figure:
Standard image High-resolution image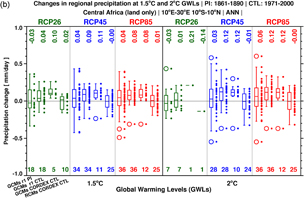
Figure 2. Projected changes in annual mean (a) temperature and (b) precipitation, averaged over Central Africa (10°E–30°E, 10°S–10°N, land only) for the 1.5 °C and 2 °C GWLs under three RCPs for (i) the first member GCM ensemble relative to the preindustrial 1861–1890 (GCM r1 PI), (ii) relative to the control 1971–2000 (GCMs r1 CTL), (iii) GCMs used to downscale CORDEX-Africa RCMs (GCMs CORDEX CTL) and (iv) CORDEX RCM ensemble relative to the control period (RCMs CORDEX CTL). Numbers at the bottom show the number of GCM simulations reaching the 1.5 °C and 2 °C GWLs for each of (i)–(iv) and numbers at the top show the median temperature (a) or precipitation (b) increase in Central Africa. Individual simulations are represented by dots while ensemble statistics by whisker boxes. The boxes enclose the median and interquartile range (IQR: the 25th to 75th quartiles of the data). The whiskers extend out to largest and smallest value within 1.5 times the IQR. Outliers are identified with empty circles.
Download figure:
Standard image High-resolution image3. Results
3.1. Evaluation of RCMs
We use Taylor diagrams to assess RCMs' performance in simulating rainfall variability at a monthly time scale (Taylor 2001). Figure 1 summarizes the root-mean-square difference (RMSD), pattern correlation (r), and the standard deviation (STD) of seasonal mean rainfall of each models' ensemble mean, with respect to the reference field (GPCC) for SON and MAM rainy seasons in 1971–2000 CRU data (Harris et al 2014) is also compared to GPCC (Schneider et al 2011), to provide a measure of observational uncertainty. The performance of RCMs' control simulations shows a wide spread and varies across seasons. In MAM, figure 1(a) indicates r values between 0.6 (RACMO/EC-EARTH) and 0.9 (ALADIN/CNRM-CM5), RMSD ranging from 0.5 (CRCM5/MPI-ESM-LR) to about 1 (e.g. RCA4/EC-EARTH), and STD from 0.75 (RACMO/EC-EARTH) to 1.5 (RegCM4/MPI-ESM-MR). In SON, models' performances are more clustered and indicate slight improvement relative to MAM.
3.2. Projected temperature and precipitation changes
We start by translating the regional scale response of global warming for the two GWLs, using global and regional climate models. Figure 2 shows projected changes in annual mean temperature and precipitation over Central Africa for 1.5 °C and 2 °C warmer worlds. Since CORDEX simulations are integrated from 1950 through 2100, a direct assessment of projected climate changes relative to the preindustrial period (PI) is only appropriate for the CMIP5 GCMs ensemble simulations referred to as 'GCM r1 PI'. In addition, we assess the regional changes relative to the control period 1971–2000 for CMIP5 (GCMs r1 CTL), for the CMIP5 GCMS used to force the CORDEX RCM ensemble (GCM CORDEX CTL), and the CORDEX RCM ensemble (RCMs CORDEX CTL). As would be expected, projected changes are larger when computed relative to the preindustrial (in GCM r1 PI), than when computed relative to the late 20th century (in GCM r1 CTL). This provides important context for interpreting the CORDEX results: these are calculated relative to the late 20th century, and if regional changes were calculated relative to the preindustrial, they would very likely be larger.

Figure 3. Projected mean seasonal March–May (MAM) temperature and precipitation during 1970–2000 (column 1), changes at 1.5 °C GWL (column 2), changes at 2 °C GWL (column 3), difference between 2 °C and 1.5 °C levels of global warming (column 4).
Download figure:
Standard image High-resolution imageFigure 2 also shows a comparison between 1.5 °C (and 2 °C) changes calculated from RCP8.5, RCP 4.5, and RCP2.6. Since each RCP has a different pathway towards 1.5 °C (and 2 °C), with differences in both the rate of warming and the mix of anthropogenic forcings, there could be differences between RCPs in the regional change associated with 1.5 °C and 2 °C. In terms of annual mean temperature and precipitation, figure 2 suggests that the uncertainty ranges are reasonably consistent between RCPs, although this may be different if calculated for seasonal means or extremes (Pendergrass et al 2015, and Mitchell et al 2016). All datasets show warming of Central Africa associated with 1.5 °C and 2 °C worlds (figure 2(a)). When calculated relative to the preindustrial, the regional warming is larger than the global mean in the majority of models (GCM r1 PI). Whilst there is variation between models in the magnitude of the warming, the range of responses is markedly warmer at 2 °C than 1.5 °C. With respect to the period 1971–2000 the range of mean regional warming of CORDEX RCM CTL resembles that of GCM r1 PI and GCMs r1 CTL, although the number of simulation varies across the different ensembles. However, the interquartile range of CORDEX RCM CTL projected warming is narrower than that of the driving GCM across RCPs, except for RCP 2.6. This illustrates that the uncertainty in regional change is different depending on which dataset is employed, this should be considered when assessing projected responses from only one dataset.
This need for careful assessment of uncertainty is perhaps even more relevant for precipitation. Figure 2(b) shows projected changes in annual mean precipitation for the 1.5 °C and 2 °C GWLs, revealing uncertainty in the sign as well as the magnitude of precipitation change. Relative to 1971–2000, GCMs r1 CTL and GCMs CORDEX CTL responses remain similar across RCPs and indicate a clear increase in precipitation changes. In contrast, CORDEX RCM CTL projections tend to be more uncertain showing equally positive and negative changes. Differences in the mean response between 1.5 °C and 2 °C appear to be small, however, the uncertainty ranges at 2 °C are larger, with some of the models projecting changes in precipitation of a magnitude not seen at 1.5 °C. This could indicate an increase in risk associated with 2 °C.
Now the focus is placed on the spatial distribution of the multi-model climate change response from the CORDEX RCMs in the SON and MAM seasons, which correspond to the peaks in climatological precipitation. Several studies indicate that SON is wetter than MAM in most observational datasets (Dezfuli 2011, Washington et al 2013, Dezfuli and Nicholson 2013, Badr et al 2016).
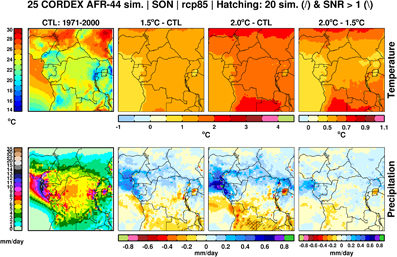
Figure 4. Projected mean seasonal September–November (SON) temperature and precipitation during 1970–2000 (column 1), changes at 1.5 °C GWL (column 2), changes at 2 °C GWL (column 3), difference between 2 °C and 1.5 °C levels of global warming (column 4). Areas where at least 80% of the simulations (20 of 25) agree on the sign of the change are marked by positively sloped hatching ('/'). Areas where the signal to noise ratio (SNR) is equal or more than 1 are marked by negatively sloped hatching ('\'). For temperature all grid boxes satisfy the two criteria (the agreement and signal to noise ratio) and the hatching is shown. Note that colour scales for the 2 °C–1.5 °C plots are different from the 1.5 °C—CTL and 2 °C—CTL ones.
Download figure:
Standard image High-resolution imageThe mean MAM temperature for the control period (1971–2000) as simulated by RCMs exhibits a meridional gradient with high values in the northern part (greater than 25 °C) and low values in the southern flank (figure 3). Projected changes in temperature show differences in warming rates between 2 °C and 1.5 °C GWL. The 0.5 °C increase in global temperature (from 1.5 °C–2 °C) is associated with larger increases in regional temperature, on average 0.6 °C for Central Africa, but even larger for parts of central DRC and northern Central Africa (up to 0.7 °C). It is also worth noting that this is an average across the models and some models show larger change. Temperature change in SON exhibits a reduced intrusion of warming along coastal areas in the west (figure 3). Higher warming is projected in the northern and southern parts of the study area with temperature increase greater than 1 °C between the 1.5 °C and 2 °C levels, whereas future changes of temperature will be less than 0.5 °C over Atlantic ocean (relative to the late 20th century).
There is a decrease in precipitation over much of inland Central Africa during MAM for the 1.5 °C GWL (figure 3), while coastal areas experience a slight increase in precipitation. Precipitation increase over the equatorial coastal region is projected to strengthen under 2 °C GWL. However, there is a slightly decrease in precipitation over southern coastal region from 1.5 °C–2 °C level of warming. Broadly, reinforcement of dry condition inland is expected under 2 °C level of warming. However, there is little agreement between regional models in these multi-model mean responses: this season is characterized by high uncertainty in projected rainfall change.
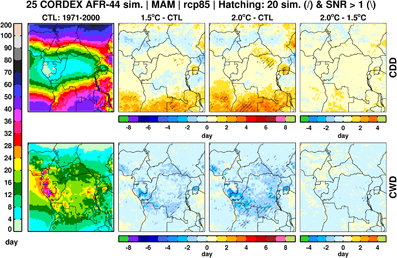
Figure 5. Projected mean seasonal March–May (MAM) CDD and CWD during 1970–2000 (column 1), changes at 1.5 °C GWL (column 2), changes at 2 °C GWL (column 3), difference between 2 °C and 1.5 °C levels of global warming (column 4).Areas where at least 80% of the simulations (20 of 25) agree on the sign of the change are marked by positively sloped hatching ('/'). Areas where the SNR is equal or more than 1 are marked by negatively sloped hatching ('\'). For temperature all grid boxes satisfy the two criteria (the agreement and signal to noise ratio) and the hatching is shown. Note that colour scales for the 2 °C–1.5 °C plots are different from the 1.5 °C—CTL and 2 °C—CTL ones.
Download figure:
Standard image High-resolution imageThe pattern of projected rainfall changes in SON is associated with a marked dipole distribution (figure 4). Northern Central Africa is expected to moisten while southern regions are projected to dry. Broadly, this pattern is reinforced from 1.5 °C–2 °C GWLs, although over eastern Central Africa the decrease in precipitation is less pronounced under 2 °C GWL. The increase of precipitation is larger in coastal areas in the two rainy seasons (figures 3 and 4). Model consensus is large for the 2 °C global warming level over southern Central Africa, with some areas indicating more than 80% of agreement across models with respect to the sign of the change. Model results show consensus in projected rainfall decrease only over a small region, encompassing parts of Angola and Zambia. This supports previous results from Dosio and Panitz (2016).

Figure 6. As figure 5 but for SON.
Download figure:
Standard image High-resolution image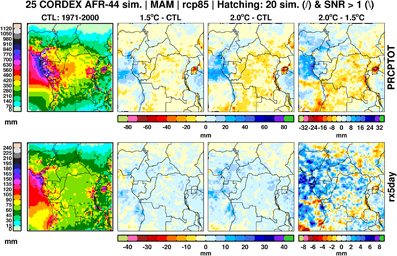
Figure 7. Projected seasonal March–May (MAM) total wet day precipitation (PRCPTOT) and maximum consecutive five days precipitation (rx5day) during 1970–2000 (column 1), changes at 1.5 °C GWL(column 2), changes at 2 °C GWL (column 3), difference between 2 °C and 1.5 °C levels of global warming (column 4). Areas where at least 80% of the simulations (20 of 25) agree on the sign of the change are marked by positively sloped hatching ('/'). Areas where the SNR is equal or more than 1 are marked by negatively sloped hatching ('\'). For temperature all grid boxes satisfy the two criteria (the agreement and signal to noise ratio) and the hatching is shown. Note that colour scales for the 2 °C–1.5 °C plots are different from the 1.5 °C—CTL and 2 °C—CTL ones.
Download figure:
Standard image High-resolution image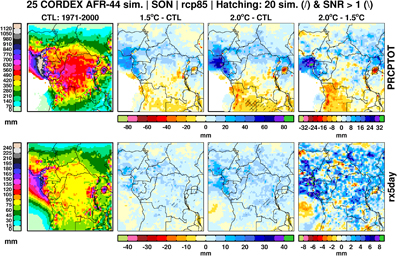
Figure 8. As figure 7, but for SON.
Download figure:
Standard image High-resolution image
3.3. Extremes rainfall
This section focuses on the change of rainfall extremes under 1.5 °C and 2 °C global warming levels. We use a subset of widely used rainfall indices coordinated internationally, which allows the results of studies from different parts of the world to fit together seamlessly. These include the maximum length of dry spell (CDD) and maximum length of wet spell (CWD).
The situation is more contrasted for SON (figure 6), with clear delineation of CDD change in the south and north parts. Broadly, there is a clear increase in CDD over southern Central Africa in SON, with good agreement between models (figure 6). CDD is projected to increase faster in a 2 °C warmer world than for the 1.5 °C global warming level in the southern part of Central Africa in SON. CDD change tend be smaller in the central parts of the Congo basin.
Under either the 1.5 °C or 2 °C global warming scenario, there is significant decrease of CWD relative to today's climate despite localised hotspots of increase depicted in SON (figure 6). There are strong local changes. The area influenced by changes grows somewhat with increasing warming level. The decrease in CWD would be weakened by more than 2 days under the 2 °C threshold compared to the 1.5° level of global warming over most of the Central African region, particularly over Congo basin in both MAM and SON seasons.
Figure 7 shows the spatial distribution of precipitation indices (PRCPTOT and rx5day) and their projected changes during MAM. There is weakening of PRCPTOT is prominent over the continent, with a reduction lesser than 50 mm; in contrast, PRCPTOT tends to intensify in oceanic region exceeding 40 mm and have more consistent geographical patterns of the change precipitation. Differences between the warming levels are easy to discern, PRCPTOT at 2 °C warming is clearly higher and changes more robust than at 1.5 °C in most of continental Central Africa. For the two levels of warming, the changes are strongest in SON (figure 8). At 2 °C warming, southern part of the study area is subject to robust changes this season. Examination of rx5day reveals a contrast in pattern of change for 1.5 °C and 2 °C global warming levels (figure 8). A clear increasing pattern emerges over much Central Africa with more than 15 mm, with some localised hotspots in northern region showing decrease (figure 8). This increase in rx5day is an important element with respect to flood hazards, thus the increase in rx5day obtained under these global warning levels is likely to amplify the probability for these risks. Difference in change of rx5day between 2 °C and 1.5 °C GWLs is uncertain and shows a complex spatial structure. Additionally, models have better agreement in the sign of projected changes in PRCPTOT than in rx5day during SON in the south.
4. Discussion and conclusions
In this study, we have assessed projected changes in precipitation and temperature that are based on daily temperature and precipitation data in Central Africa as simulated in the framework CORDEX-Africa project under RCPs forcing scenarios. Examination of the modification of precipitation climate extremes under 1.5 °C and 2 °C of global warming is done. The robustness of the results is assessed using models' agreement on the sign of the change and the signal to noise ratio. Robust signal is associated to agreement of more that 80% (20 of 25 RCMs) of model in the sign of the change and the signal to ratio greater than one.
Global warming at 2 °C will be associated with regional scale changes of temperature larger than what is obtained for the 1.5 °C GWL. Overall, the regional warming over Central Africa is expected to be greater than the mean planetary warming. The rate of warming is larger at regional than at global scale. The warming is not expected to be spatially uniform over Central Africa. For precipitation, RCMs projected regional changes are less sensitive when moving from 1.5 °C–2 °C GWLs However, the uncertainty ranges at 2 °C are larger. This could indicate an increase in risk associated with 2 °C. Precipitation changes are less prominent, except in very localised area in the southern Central Africa. These uncertainties are related to complex, but not well understood climate mechanisms driving the spatial and temporal variability of precipitation across Central Africa (Fotso-Nguemo et al 2017, Washington et al 2013, Pokam et al 2014).
There is consistency in the direction of changes of extreme indices. Over southern Central Africa during SON, RCMs' projected decrease in total precipitation is associated with the increase of temperature and number of consecutive dry days. This behaviour strengthens between 1.5 °C–2 °C global warming levels. Central Africa is expected to be predominantly under decrease of precipitation for the two targeted global warming levels. In the Atlantic region, signal is going to be towards more rainfall although there are uncertainties on precipitation (Dosio and Panitz 2016). Continental Central Africa will suffer from an increased number of dry days and reduction of rainy days. This can perturb future water resources, agricultural production and food security. With the increasing of maximum consecutive five day precipitation, it is expected that Central Africa will considerably be affected by heavy precipitation events. There are obvious advantages to reduce global warming to 1.5 °C relative to 2 °C in regard of the reduced frequency and magnitude of precipitation extremes.
This article bears some caveats. First, it defines the increase in global average temperature above pre–industrial levels at a given point in time as the global average of combined land surface air and sea surface temperatures for a 30-year period centred on that time, excluding the impact of any short–term natural forcing fluctuations and assuming that the trend continues throughout that 30-year period. Second, it is assumed that the RCM climate change responses is independent of the temperature pathway used to reach 1.5 °C and 2 °C, and remain comparable for RCP2.6, RCP4.5, RCP6.0 and RCP8.5.
Figure 5 shows simulated seasonal mean of CDD and CWD average between 1971 and 2000 and projected changes. Areas with observed minimum CDD are associated with maximum rainfall, and observed maximum CWD is also broadly collocated with maximum rainfall. Central Africa shows a seasonal dependence in CDD changes with limited levels of model agreement. There is a weak increase in the number of CDD (less than 4 days) in southern parts of the domain for the 2 °C global warming level in MAM, compared to 1.5 °C global warming level. A decrease in occurrence of CDD with global warming is noticed over northern Congo Basin, northern Cameroon, southern Chad and Sudan, though with limited consensus amongst RCMs. Although the direction of the change in CDD between GWLs are consistent in the northern and southern Central Africa, in the centre of the region there is an opposite response in the direction of the change from decrease in CDD to increase respectively under 1.5 °C and 2 °C (figure 5).
Acknowledgments
The authors would like to acknowledge support from the Swedish Government through the Swedish International Development Cooperation Agency (SIDA). We also acknowledge logistical support from the CORDEX International Project Office, the Swedish Meteorological Institute and the Climate System Analysis Group at the University of Cape Town. The CORDEX-Africa data used in this work were obtained from the Earth System Grid Federation server. We are grateful to all the modeling groups that performed the simulations and made their data available.