

Abstract
The Renewable Fuel Standard (RFS) initially set ambitious goals for US cellulosic biofuel production and, although the total renewable fuel volume reached 80% of the established target for 2017, the cellulosic fuel volume reached just 5% of the original goal. This shortfall has, in part, been ascribed to the hesitance of farmers to plant the high-yielding, low-input perennial biomass crops identified as otherwise ideal feedstocks. Policy and market uncertainty also hinder investment in capital-intensive new cellulosic biorefineries. This study combines remote sensing land use data, yield predictions, a fine-resolution geospatial modeling framework, and a novel facility siting algorithm to evaluate the potential for near-term scale-up of cellulosic fuel production using a combination of lower-risk annual feedstocks more familiar to US farmers: corn stover and biomass sorghum. Potential strategies include expansion or retrofitting of existing corn ethanol facilities and targeted construction of new facilities in resource-rich areas. The results indicate that, with a maximum 10% conversion of pastureland and cropland to sorghum in suitable regions, more than 80 of the 214 existing corn ethanol biorefineries could be retrofitted or expanded to accept cellulosic feedstocks and an additional 71 new biorefineries could be built. The resulting land conversion for bioenergy sorghum totals to 4.5% of US cropland and 3.7% of pastureland. If this biomass is converted to ethanol, the total increase in annual production could be 17 billion gallons, just over the original RFS 2022 cellulosic biofuel production target and equivalent to 12% of US gasoline consumption.
Export citation and abstract BibTeX RIS
Introduction
Renewable energy production in the US is at an all-time high and biomass-derived energy represents about 43% of the total, with biofuels accounting for about half of that [1, 2]. However, the US is falling far short of the advanced and cellulosic biofuel production goals originally established in the Renewable Fuel Standard (RFS), and targets for cellulosic biofuels have been revised down by an order of magnitude due to serious shortfalls in qualifying biofuel availability [3]. The RFS, as part of the Energy Security Independence Act of 2007, requires an increase in renewable fuel use from 9 to 36 billion gallons by 2022 [3]. This volume is split into categories that each have specific volume targets, and even after significant adjustments in cellulosic biofuel category targets, the majority of qualifying fuels produced in that category are either renewable compressed natural gas or renewable liquefied natural gas [3]. Lade et al [4] explore the numerous reasons why the RFS has, in some respects, failed to realize its potential. In this paper, we focus on addressing two dimensions of near-term cellulosic biofuel scale-up: lignocellulosic feedstock availability and construction of biorefineries.
The US Department of Energy and Department of Agriculture published an extensive update in their Billion-Ton series of reports, including a set of detailed county-level scenarios for the future of biomass production for bioenergy [5]. Perennial feedstocks in particular have been characterized as ideal for bioenergy in part due to their high yields, low inputs, ability to restore soil carbon on degraded/erosion-prone lands, and the resulting favorable GHG emissions [5, 6]. The Billion-Ton scenarios assume that farmers will adopt these crops in the short-term and, only after land is no longer locked into 15–20-year lifespan perennials, begin planting high-yielding annuals including sorghum [5]. This outcome is highly dependent on farmers' risk-aversion. Farmer adoption modeling and survey data suggests that the large upfront investment and limited flexibility in terms of alternative markets for perennial biomass crops are significant barriers to increasing production [7, 8]. A high-yielding annual crop like sorghum, with established farming practices and an alternative market as animal feed, is a less risky investment in an uncertain market and policy environment. Also present in the Billion-Ton scenarios are crop residues, of which corn stover comprises the majority. However, this supply is limited and, because of the lower per-hectare availability relative to dedicated biomass crops, a reliance on residues alone results in higher average transportation distances from farm-to-biorefinery.
We hypothesize that the emphasis on dedicated perennial crops for bioenergy may be counter-productive, and instead focusing on strategies that minimize risks to farmers and investors may provide a viable path to meeting near-term scale-up of cellulosic biofuel production. To probe this hypothesis, we developed feedstock production and biorefinery scale-up scenarios based on a combination of corn stover, as the dominant crop residue in the US, and forage sorghum as a promising high-yielding annual crop that could serve as a dedicated bioenergy feedstock. There is no formal definition for biomass/bioenergy sorghum, so we will use the term forage sorghum to denote typical high-yielding, photoperiod sensitive (delayed-flowering) varieties that are potentially ideal as bioenergy feedstocks. Building facilities to accept lignocellulosic biomass, including corn stover and forage sorghum, is the other component of what has been described as a 'chicken and egg' problem between securing biomass resources and capital investment for new facilities [9]. Retrofitting existing facilities to utilize more than one feedstock has already been proposed [5] and can be an important first step toward increasing lignocellulosic biofuel production in the near-term. A growing and stable market will hopefully reduce the perceived risk associated with investing in new dedicated cellulosic fuel production facilities.
To evaluate the potential for near-term scale-up of lignocellulosic biofuel production using sorghum and corn stover at existing biorefineries and potential new facilities, we developed a fine-resolution modeling framework for evaluating feedstock availability and allocating biomass to facilities in the US The resulting model can support a range of analyses from national-scale scenario development to facility-level evaluation of available resources. The model utilizes national raster datasets, created from remote-sensing data to estimate locations of current and potential future feedstock production/collection. Given the projected biomass availability, we analyzed the ability to meet minimum commercial scales at existing biorefineries (if retrofitted or expanded to accept lignocellulosic feedstocks), assessed the potential for new facility construction, and determined the net impact on cellulosic fuel production and land use.
Methods
Developing scenarios that make use of crop residues and potential dedicated bioenergy feedstock production requires detailed data on current land use patterns, costs, and locations of crops from which residues can be harvested (in this case, corn). Translating those scenarios to facility locations necessitates the addition of road network modeling and details about feasible facility scales. Geographic Information Systems bring all of these datasets together in a single modeling framework [10]. Very few studies have attempted to quantify biomass resources and potential biorefinery locations at the sub-county level. Mueller-Warrant et al used the USDA Cropland Data Layer (CDL) for a Pacific Northwestern US case study to compare two methods for identifying potential biorefinery locations based on biomass availability: k-means clustering and their own Series of Sequentially Approximated Optimizations algorithm [11]. Holder et al produced a farm-scale database of feedstock-to-bioethanol production for the central US utilizing a top-down approach for estimating the corn farm locations and their corresponding production [12]. Holder et al reduced computational complexity by merging neighboring pixels of the same crop type to form contiguous polygons. Our study uses the same underlying raster data, but instead employs statistical machine learning (k-means clustering algorithm) to provide a more flexible means of aggregating pixels relative to past studies. Pixel centroids are then combined with county-level biomass yield values, land use conversion estimates, and road networks to determine which biorefineries can be retrofitted and where new facilities are justified.
Generating feedstock supply points (FSPs)
The feedstock assessment model presented here relies on high-resolution (30 × 30 m) raster data, including the National Land Cover Database (NLCD) [13] and USDA's CDL [14]. Both datasets were generated by applying classification algorithms to remote sensing data, including Landsat and Advanced Wide Field Sensor. Each pixel in the CDL corresponds to a specific agricultural crop, and each pixel in the NLCD corresponds to a land cover type (e.g. pasture, forest, developed). For the purposes of this paper, there are three relevant pixel classifications: cropland (NLCD), pastureland (NLCD), and corn land (CDL). Conducting logistics optimization using the original high-resolution datasets would be far too computationally-intensive, so we use Hartigan and Wong's (1979) k-means algorithm [15] to generate clusters of pixels for each crop, specifying 20 clusters to be generated per county. Counties are relatively uniform in size and shape across the Midwestern US, where the vast majority of crop residues and suitable land are located for our analysis. In locations where counties are irregular in size, using other boundaries (such as a grid) to define clusters may be more appropriate. The cluster centroids serve as potential points of feedstock production. These centroids will be referred to as FSPs (figure S2 is available online at stacks.iop.org/ERL/13/124002/mmedia). Further details on the modeling steps are outlined in the supporting information (SI) (section 1) and figure S1 shows an example of the k-means cluster analysis and figure S2 shows the cluster centroids generated for corn land, cropland, and pastureland.
Developing biomass production scenarios
To translate FSPs generated from the original raster data into potential biomass tonnages, we developed a set of biomass supply scenarios. These scenarios rely on county-level sorghum yield estimates and corn stover availability data from the DOE Billion-Ton Report [5]. Corn stover tonnages are assigned to cluster centroids based on the assumption that yield is uniform within each county (no finer-resolution yield data exists for the whole US). To determine the area and locations of land that could be converted for the production of biomass (forage) sorghum, we analyze two potential cases: (1) a maximum of 10% of cropland in every county may be converted to sorghum. (2) A maximum of 10% of cropland and 10% of pastureland in every county may be converted. The cap on cropland conversion is based on Billion-Ton Report and supporting POLYSYS modeling [5, 16]. Although pastureland has been deemed suitable for perennial crops, a limited fraction may be suitable for annuals such as sorghum because the land may be too sloped or poorly drained, for example. For this reason, we run a conservative scenario utilizing no pastureland, and a second scenario in which 10% can be converted. This 10% fraction represents the portion of land growing sorghum in any given year, but the specific farms growing sorghum in each year will likely shift slightly as a result of crop rotations. We assume the rotations will be random from farm-to-farm and thus biomass production will remain evenly distributed and constant year-to-year. Simulated county-level sorghum yields are applied to converted land areas to estimate sorghum biomass production at each FSP.
We only consider land viable for conversion if sorghum biomass can be produced for a farm gate price less than or equal to $75/dry ton (dt) (based on additional data used for the Billion-Ton Report), assuming no irrigation. This precludes much of the Western US from participating in production because non-irrigated yields are too low to achieve prices below this threshold. All of our input data is anchored to the year 2020, based on the assumption that this is when possible retrofits and new facility construction could commence; lignocellulosic facilities would likely not be fully operational by that year. To capture uncertainty around future corn stover yields and harvest rates, we model current yields (base case) and 2%–4% yield increases as well as varying maximum allowable farm gate price points (40–60 $/dt for corn stover, 50–75 $/dt for sorghum). We also vary the maximum allowable driving distances from fields to the nearest biorefinery (see table 1), which will be discussed further in subsequent sections.
Table 1. Scenario parameter ranges.
| Parameter | Corn stover | Sorghum |
|---|---|---|
| Yield (increase) | Base case, 2%, 3%, 4% | Base case |
| Price ($/dt) | 40, 50, 60 | 50, 60, 75 |
| Driving Range (miles) | 40, 50, 60 | 40, 50, 60 |
Current and potential biorefinery locations and biosheds
The locations of the current biorefineries are based on data from the Renewable Fuels Association [17]. In total there are 213 refineries in the US and the majority are located in the Midwest (figure 2), where most of the corn production takes place (figure S2(a)). In our siting algorithm, current biorefineries are given priority, so potential new sites are identified based only on biomass that is outside the maximum driving range of any existing facility. Candidate locations are selected from a larger set of possible points made up of the agriculture and pasture land-weighted centroids for each county (meaning, if a county is partially urban and part rural, the candidate facility location will be in the centroid of the county's pasture and agricultural lands). If any two or more candidate locations are closer than 40 miles to one another (the shortest maximum biomass diving distance in our scenarios), a single new location is recomputed using the average (centroid) of those nearby locations. Using this method, we identified 697 locations for potential biorefineries in the US (figure 2(b)).
Using each current biorefinery and candidate location, we must then identify all the FSPs that are within the established maximum driving distance of a given location (this is referred to as the 'bioshed'). Driving distances are calculated based on the primary and secondary roads of the US, obtained from the US Census Bureau Department of Commerce [18]. The network analysis treats roads as the edges of the network and nodes are comprised of biorefineries (current and candidate) and FSPs. To limit the computational intensity of the network analysis, we employ a two-step process: (1) apply a circular buffer equal to the maximum driving distance around each biorefinery location to limit the search space of all possible FSPs, (2) calculate shortest-path driving distances between all FSPs and corresponding biorefinery location(s). Section 2 of the supplementary information (SI) provides a simple visual example of this process.
If a given FSP is within only one biorefinery location's bioshed, it is allocated to that facility. In cases where an FSP is located within the overlapping biosheds of two or more biorefineries, we use an iterative approach to eliminate double-counting. This approach is meant to minimize the number of new facilities and/or retrofits, and simulate likely patterns of real-world development, by favoring locations with the greatest biomass availability. Sorghum and corn stover availability within each bioshed are first calculated for each biorefinery without concern for double-counting in overlapping biosheds. The biorefinery with the largest biomass availability is then identified and assigned all the biomass that is remaining inside its bioshed. This process is repeated until all the FSPs are assigned to a single biorefinery. Finally, the total biomass production allocated to each biorefinery is summed to determine the feasible intake. The minimum intake we consider is 800 000 dt/year [19], with our sensitivity analysis spanning 800–1600 thousand dt/year minimum size. More information can be found in the SI (sections 3 and 4).
Results
Biorefinery feedstock intake potential
Our scenarios provide a sharp contrast to the Billion Ton Report, which estimated a biomass sorghum supply of less than 1 million tons by 2040 [5]. Using the 10% cap on conversion of cropland and pastureland, we estimate a potential of over 75.4 million tons of biomass sorghum being available by 2020 within the biosheds of current biorefineries (assuming they can be retrofitted to process lignocellulosic material). Accounting for the future biorefineries developed, this number can be increased by and additional 85 million tons of biomass sorghum. Figure 1 shows all the FSP points for 3 categories of biomass supply (corn stover, sorghum grown on converted cropland, and sorghum grown on converted pastureland) available for the existing and potential future biorefineries, color coded by tonnage. As illustrated in figure 1, the two most important feedstocks for existing biorefineries are likely to be corn stover and sorghum grown on cropland. The pastureland available for conversion in that region is sparser. Conversely, both cropland and pastureland conversion to sorghum offer significant opportunities for potential new biorefineries, even at a maximum per-county 10% conversion.
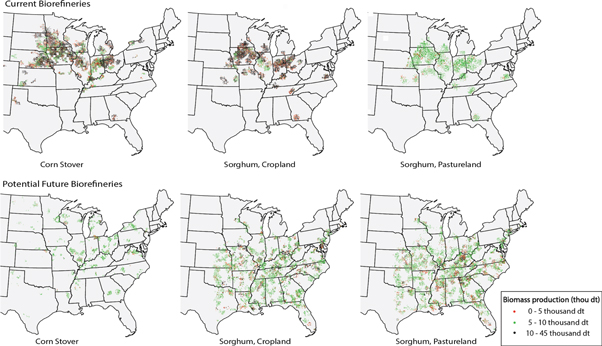
Figure 1. Biomass production inside the biosheds of existing biorefineries and potential future biorefineries. Biomass production is in units of thousand dry tons.
Download figure:
Standard image High-resolution imageBased on the modeled biomass mix available, we classify each current and potential facility based on whether it can achieve the minimum tonnage intake with a sole feedstock or if it must rely on some combination of corn stover and sorghum biomass. Facilities with sufficient supply of corn stover or sorghum are classified as stover-only. This hierarchy is based on the assumption that a single feedstock is preferable to relying on mixed feedstocks, and crop residues are preferable to a dedicated annual feedstock because they are generally lower-cost and do not require farmers to convert their land.
Figure 2 maps existing biorefineries and potential new locations, binned by tonnage intake and feedstock type (either, stover, sorghum, or mixed). The results are based on a driving distance constraint of 50 miles, a maximum farm gate price of $60/dt and $75/dt for corn stover and sorghum, respectively. Similar results for other scenarios are shown in the SI (section 4). The contrast between figures 2(a) and (b) clearly indicates that the majority of available corn stover will be within the biosheds of existing biorefineries, whereas new facility construction will be driven by availability of dedicated feedstocks (biomass sorghum, in this case). Most of the corn stover and sorghum available to the current biorefineries is in the 800–1600 thousand dt range, while only 6 biorefineries have the potential to receive more than 2400 dt of either biomass (2 for corn stover and 4 for sorghum).

Figure 2. Biomass availability at each biorefinery for (a) current biorefineries and (b) potential biorefineries based on 10% conversion of cropland and pastureland to biomass sorghum.
Download figure:
Standard image High-resolution imageThe locations of the existing biorefineries are geographically concentrated near corn grain production, so the potential for new facilities in those regions is limited. Sorghum supply potential is largely south of the Corn Belt and does require substantial new biorefinery construction (figure 2(b)). This is because a uniform 10% conversion of croplands and pasturelands within suitable regions (not requiring irrigation) results in far more distributed production. There is a notable lack of large mixed-feedstock biorefineries in these initial results. On a mass basis, most of the cellulosic fuel production modeled in this scenario can be accomplished using a single feedstock. Because corn (or corn-soy rotations) are dominant in the Midwest, our analysis calls into question the likelihood that biorefineries will blend corn stover with other feedstocks. However, this may not hold true if larger fractions of cropland are converted, in which case blends of corn stover and dedicated feedstocks will be more relevant. Although not as significant in terms of tonnage, the inclusion of other residues such as wheat straw could also result in an increase in the number of feasible biorefinery locations relying on mixed feedstocks.
Figure 3 presents the number of biorefineries with access to sufficient biomass to justify a retrofit or new construction. With a retrofitting threshold of 800 000 dt biomass/year and a maximum driving distance of 50 miles, there are 9 current biorefineries with sufficient corn stover and biomass sorghum to use either as the sole feedstock supply. An additional 23 biorefineries could reach the minimum supply with corn stover, and 42 have access to sufficient biomass sorghum if 10% of croplands and 10% of pasturelands are converted (the number drops to 34 if only 10% of cropland is converted). There are 8 biorefineries that do not have enough of either biomass type, but could rely on a combined supply (mixed feedstock). In total, there are currently 82 biorefineries (of 213 total in the US) that can be retrofitted to accept corn stover, biomass sorghum, or a combination of the two as an alternative feedstock for biofuel production. Converting pasturelands to sorghum is not critical for a strategy focused on retrofitting existing biorefineries—it adds 9 biorefineries to the total. However, converting 10% of pasturelands to sorghum makes an enormous difference in potential new biorefinery construction, resulting in an increase from 31 to a total of 71 new facilities (table 2).
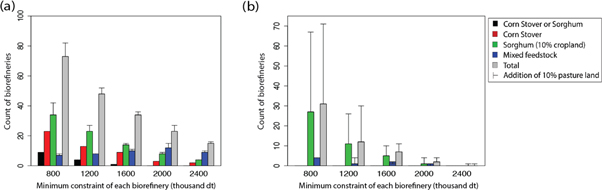
Figure 3. Number of biorefineries with sufficient biomass available to justify retrofit/expansion or new construction by type (a) current biorefineries, (b) potential new biorefineries. Results correspond to 50-mile max driving distance. Sensitivity bars indicate the addition of 10% pastureland conversion.
Download figure:
Standard image High-resolution imageTable 2. Summary of the biomass potential for current and future biorefineries. The results refer to the driving distance scenario of 50 miles. The results for other driving distances are shown in the SI (table S3 and S4).
| Either feedstock | Corn stover | Biomass sorghum | Mixed feedstocks | Total | ||
|---|---|---|---|---|---|---|
| Current biorefineries | Biorefinery counts | 9 | 23 | 42 | 8 | 82 |
| Total available biomass (Million dt) | 26.6 | 31.9 | 61.9 | 8.5 | 128.9 | |
| Mass fraction (%) | 7 | 8 | 16 | 2 | 33 | |
| Cropland (Million acres) | 1.45 | 0 | 5.49 | 0.5 | 7.44 | |
| Pastureland (Million acres) | 0.05 | 0 | 1.01 | 0.08 | 1.13 | |
| Future biorefineries | Biorefinery counts | 0 | 0 | 67 | 4 | 71 |
| Total available biomass (Million dt) | 0 | 0 | 82 | 3 | 85 | |
| Mass fraction (%) | 0 | 0 | 21 | 1 | 23 | |
| Cropland (Million acres) | 0 | 0 | 4.70 | 0.26 | 4.96 | |
| Pastureland (Million acres) | 0 | 0 | 3.40 | 0.09 | 3.49 |
As the minimum threshold of available biomass for a biorefinery retrofit increases, the number of eligible existing and new facilities decreases, as would be expected (figure 3). The only exception is the mixed feedstock type biorefineries, which increase in number along with the decline in the number of biorefineries capable of relying on a single feedstock. However, mixed feedstock approaches do little to compensate for the decline in potential retrofits and new construction as the minimum allowable facility scale increases. As expected, most of the new potential biorefineries would rely either solely on sorghum, or on a mixed corn stover-sorghum intake, as the majority of corn stover availability is concentrated in locations where biorefineries already exist (figure 3(b)). Variations in these results for driving ranges of 40 and 60 miles are shown in the SI (section 4).
The impact of adding sorghum to the national feedstock mix demonstrates the importance of scaling up a dedicated biomass crop in the near-term for both facility retrofit/expansion and new construction (table 2). The total available biomass refers to the amount of biomass that the biorefineries have access to within each classification. For instance, for the baseline scenario (50-mile maximum driving distance) the total biomass availability for fuel production increases from 45.0 million dt to 128.9 million dt with the addition of 75.4 million dt utilized at sorghum-only biorefineries and 8.5 million dt that could be utilized only at mixed-feedstock biorefineries. The mass fraction indicates the amount of biomass that could be utilized by biorefineries in each category out of the total potential corn stover and sorghum production in the US based on a maximum 10% conversion of cropland and pastureland to sorghum. The addition of sorghum increases the total biomass resource utilization to 33% (by mass), a significant increase from the corn stover-only option, which results in 11% mass utilization. Building new biorefineries to utilize the new sorghum production can lead to a further increase of 23% of total biomass utilization (for a total of 56% utilization). Similar results for the rest of the scenarios assessed can be found in the SI (tables S1–S4). It should be noted that we are not suggesting land should be converted to sorghum if that biomass cannot be utilized at a nearby biorefinery. Thus, the 10% cap should be thought of as a county-level limit on the fraction of land converted, rather than a strategy to convert exactly 10% of all cropland and pastureland in the US Actual land conversion totals for cropland and pastureland are included in table 2, which total to 4.5% of US cropland and 3.7% of US pastureland.
Sensitivity analysis
Figure 4 presents the sensitivity analysis results for all scenarios assessed. The maximum allowable corn stover price is found to have the largest effect on the total available biomass resources. A maximum allowable farm gate corn stover price increase of 50% (40 $/dt to 60 $/dt) can result in a corn stover availability increase of 45%, equating to 39 million tons of additional biomass in 2020 (for a driving distance of 50 miles). A similar increase in the maximum allowable farm gate sorghum price (50$/dt to 75 $/dt) can result in a total biomass increase of 170% resulting in an additional 102 million tons in 2020. Driving ranges can also significantly contribute impact available biomass, resulting in up to a 150% increase in biomass if the maximum distance is increased from 40 miles to 60 miles. In contrast, increases in yield (tied to harvestable fraction) by 4% compared to the base case yield would only increase the total supply of corn stover to biorefineries by 9%, which translates to an increase of 3 million tons. This study does not include biomass sorghum yield increase projections, as the harvestable biomass is not subject to the same uncertainty as for crop residues. Detailed data for the sensitivity analysis can be found in the SI (tables S5–S7).

Figure 4. Sensitivity analysis of biomass availability.
Download figure:
Standard image High-resolution image
The allowable driving distance impacts not just total tonnage, but also the number of potential biorefinery retrofits. For example, if the driving distance is set to 40 miles instead of 50 miles, the existing biorefineries that can be retrofitted drop to 67; if the driving distance is increased to 60 miles, there exist 84 biorefineries that can be effectively retrofitted to accept corn stover and/or sorghum (table 3). With a maximum driving distance of 40 miles, the total biomass available to biorefineries decreases to 81 million dt (37% decrease). Biomass that can be utilized increases to 162 million dt if the driving distance is 60 miles (26% increase compared to 50 miles threshold).
Table 3. The effect of allowable driving distance on the number of current biorefineries to be retrofitted.
| Driving distance | Either feedstock | Corn stover | Biomass sorghum | Mixed feedstocks | Total |
|---|---|---|---|---|---|
| 40 miles | 5 | 15 | 28 | 19 | 67 |
| 50 miles | 9 | 23 | 42 | 8 | 82 |
| 60 miles | 9 | 22 | 47 | 6 | 84 |
Conclusions
This study has demonstrated one potential path to scaling up cellulosic biofuel production in the near-term, using a combination of currently-available crop residues (corn stover) and a high-yielding, drought-tolerant annual crop (biomass sorghum). Converting a limited fraction of croplands and pasturelands to cellulosic biofuel production can significantly boost biofuel production relative to a corn stover-only scenario. Our results indicate that conversion of no more than 10% of cropland and 10% of pastureland within lands accessible by existing biorefineries to dedicated sorghum production can increase biofuel production potential by 22% compared to utilizing only corn stover (if maximum driving distance is 50 miles). Further investing in building new refineries where the biomass availability is sufficient can increase biofuel production potential by an additional 23%. Although low-input perennial grasses may have an important role to play in the longer-term bioeconomy, targeted conversion of land to an annual bioenergy crop that is more familiar and less risky for farmers, and retrofitting a fraction of existing corn ethanol facilities, may be a viable strategy for meeting some of the RFS targets.
Any feedstock, sorghum or otherwise, selected for use in biorefineries must enable the final fuel to meet the GHG reduction targets associated with the relevant RFS category. The advanced biofuel and cellulosic biofuel categories require net GHG emissions reductions of 50% and 60% relative to petroleum fuels, respectively. Liquid biofuels from crop residues can far exceed these requirements, achieving GHG reductions of up to 90%, although this is dependent on allocation methods applied as part of the life-cycle assessment [20–24]. Forage sorghum-to-ethanol can meet the 50% GHG reduction needed to meet the advanced biofuel requirements and sweet sorghum systems have the potential to achieve reductions well beyond the 60% requirement for cellulosic biofuels [25]. Because biomass sorghum is not a widely-used bioenergy feedstock, the direct and indirect land use change impacts of increasing sorghum production have not been well-studied.
To develop a more complete understanding of these scenarios and develop alternative strategies, the results of our biomass production scenarios can be integrated with biogeochemical models and downscaled climate models to generate improved results for impacts on soils, climate, water resources, and the effects of environmental stressors such as drought and pests. Further research is needed to fully understand the soil organic carbon (SOC) impacts of different sorghum varieties, as these deep-rooted plants may result in net sequestration when planted on land that has previously been used to grow tilled annual crops [5]. The environmental impacts of converting pasture are more difficult to estimate, in part because of the wide variation in pastureland management practices [26]. If the pastureland is well managed, converting this land to sorghum is likely to result in short-term net losses in SOC, whereas poorly managed pastureland may not release significant carbon when tilled.
Acknowledgments
This work was part of the DOE Joint BioEnergy Institute (http://www.jbei.org) supported by the US Department of Energy, Office of Science, Office of Biological and Environmental Research, through contract DE-AC02-05CH11231 between Lawrence Berkeley National Laboratory and the US Department of Energy. The United States Government retains and the publisher, by accepting the article for publication, acknowledges that the United States Government retains a non-exclusive, paid-up, irrevocable, world-wide license to publish or reproduce the published form of this manuscript, or allow others to do so, for United States Government purposes. We would like to thank Daniel Putnam for his valuable input in the early stages of our analysis.