

Abstract
Since 2015 the greater Cape Town area (∼3.7 million people) has been experiencing the worst drought of the last century. The combined effect of this prolonged dry period with an ever-growing demand for water culminated in the widely publicized 'Day Zero' water crisis. Here we show how: (i) consecutive significant decreases in rainfall during the last three winters led to the current water crisis; (ii) the 2015–2017 record breaking drought was driven by a poleward shift of the Southern Hemisphere moisture corridor; (iii) a displacement of the jet-stream and South Atlantic storm-track has imposed significantly drier conditions to this region. Decreasing local rainfall trends are consistent with an expansion of the semi-permanent South Atlantic high pressure, and reflected in the prevalence of the positive phase of the Southern Annular Mode. Large-scale forcing mechanisms reveal the intensification and migration of subtropical anticyclones towards the mid-latitudes, highlighting the link between these circulation responses and the record warm years during 2015–2017 at the global scale.
Export citation and abstract BibTeX RIS

Original content from this work may be used under the terms of the Creative Commons Attribution 3.0 licence. Any further distribution of this work must maintain attribution to the author(s) and the title of the work, journal citation and DOI.
1. Context of the 2015–2017 drought
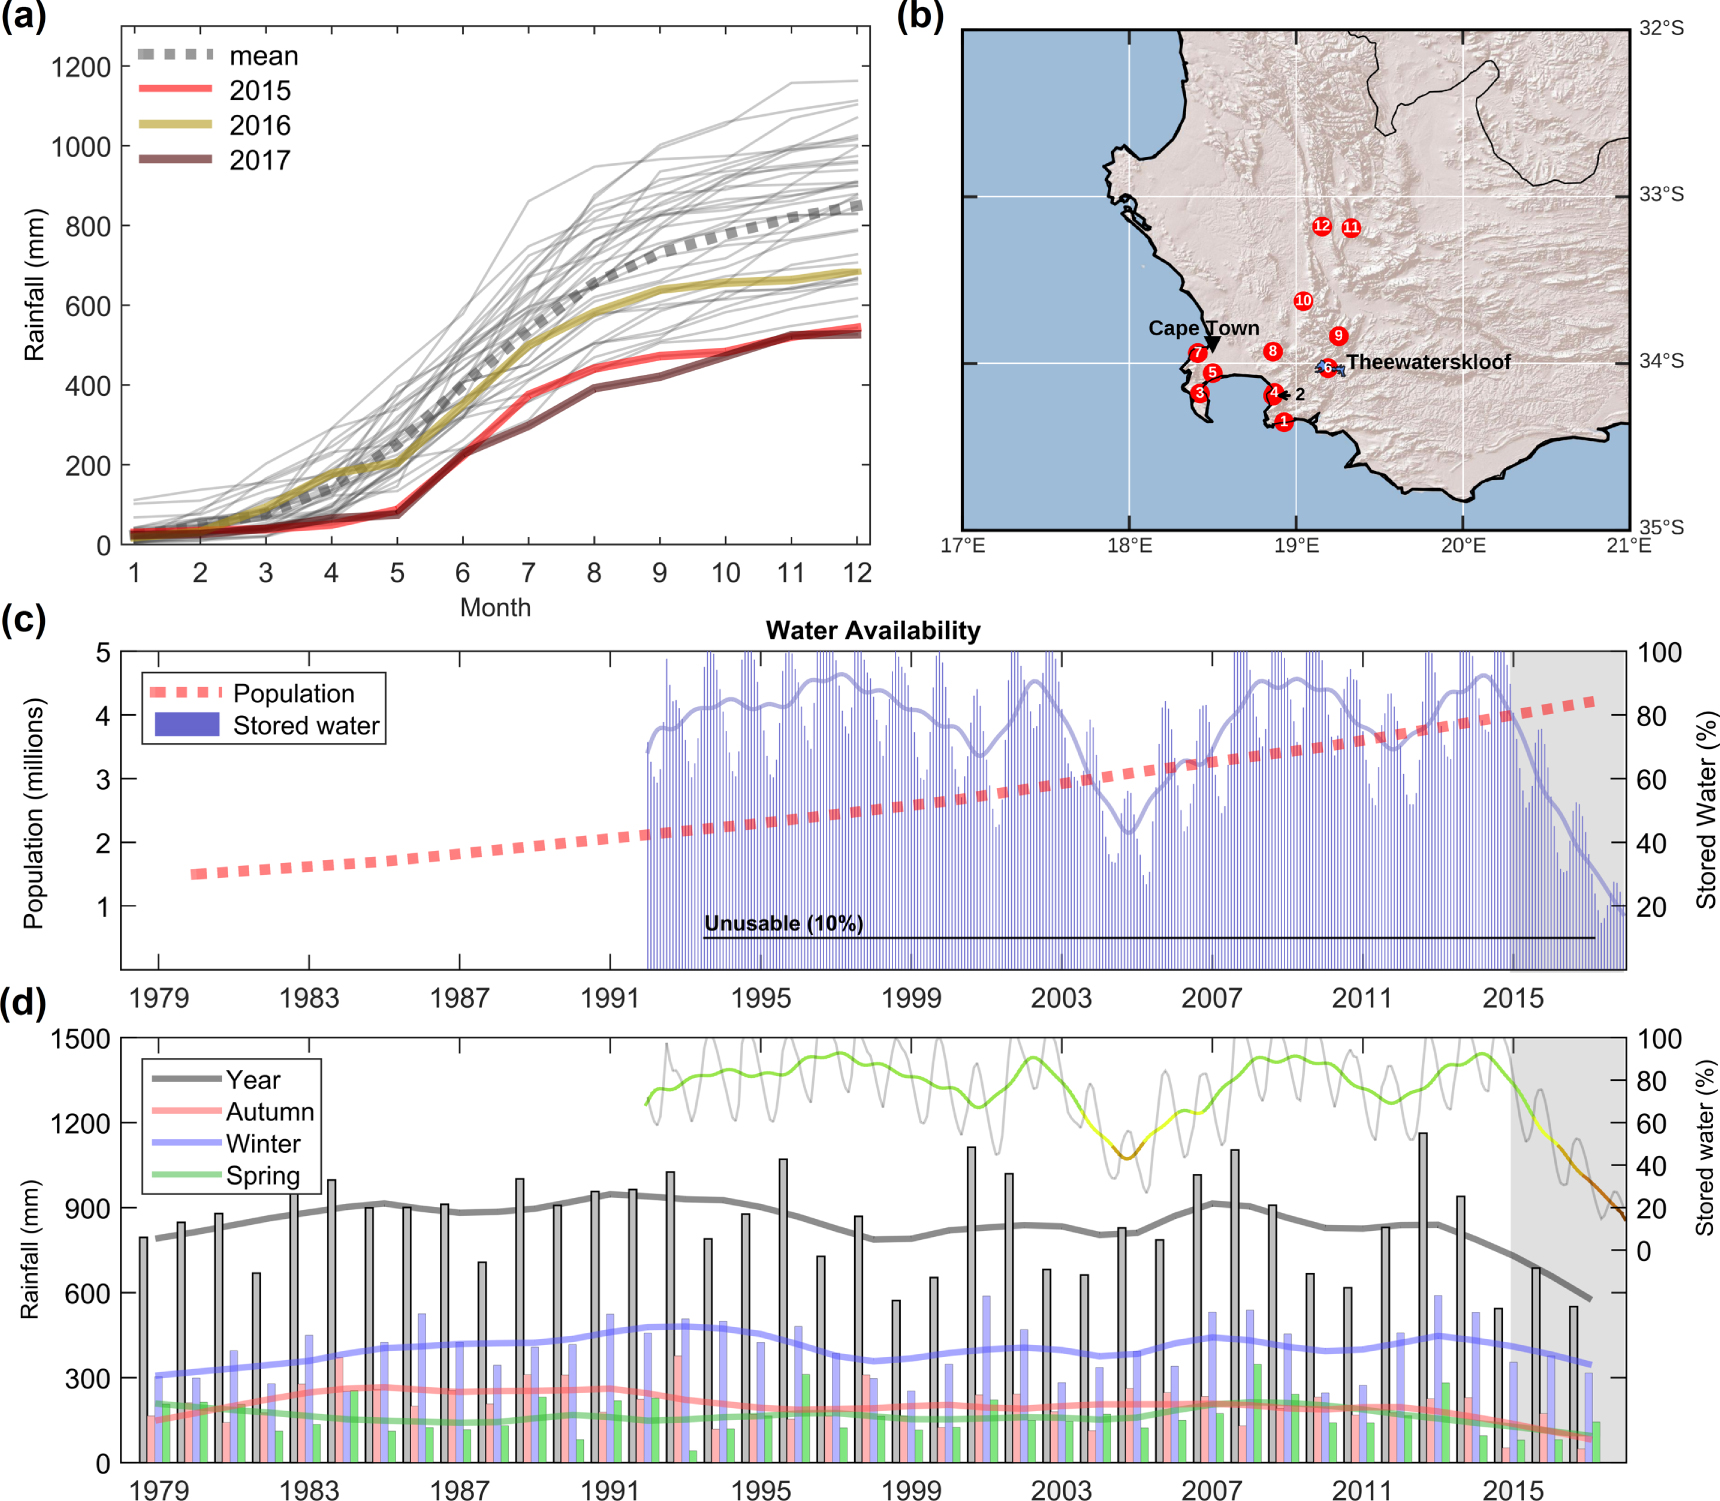
Significant social and media alarm erupted following the driest year in recent record in the Cape Town area in 2017 (figures 1(a), (b), see also figure S1 is available online at stacks.iop.org/ERL/13/124025/mmedia of supplementary information). The city, and the neighbouring southwestern Cape region (SW Cape) of South Africa, experiences a Mediterranean climate (warm dry summers and mild wet winters) whereas the rest of the country receives most of its rainfall during summer (Tyson and Preston-Whyte 2000, Reason and Jagadheesha 2005). In fact, 2017 was the third consecutive very dry year in the greater Cape Town area, and rainfall deficits since 2015 have been estimated to correspond to a return interval of centennial scale (Wolski 2018). These deficits were not homogenous at the seasonal scale, being more noticeable during the transition seasons (spring and autumn, figure 1(d)). Nevertheless, the persistent nature of this severe drought culminated in very low water levels in key storage facilities by the end of 2017 (figures 1(c), (d)).
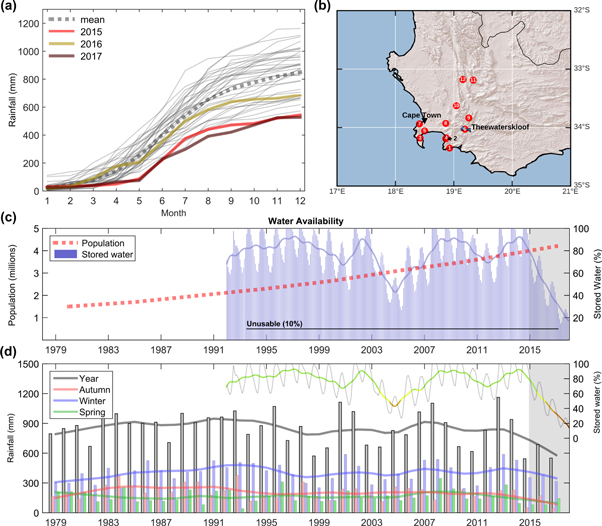
Figure 1. Water availability in the Cape Town area: (a) intra-annual evolution of cumulative rainfall for the mean of 12 South African Weather Service (SAWS) meteorological stations in the Cape Town area. Thin grey lines represent all individual years spanning 1979–2017, the dashed thick line shows the climatological average, and colored solid lines show the evolution for the years 2015, 2016 and 2017. (b) The location of the 12 meteorological stations represented by red circles, and the location of the Theewaterskloof dam, which is the largest dam serving the Cape Town metropolitan area. (c) Evolution of the monthly percentage of water stored in the Theewaterskloof dam since 1992 (light blue bars) with the solid curve representing the 12 month smoothed series; also represented is the population growth in the Cape Town metropolitan area (dashed red curve). (d) Bars representing annual (grey), autumn (pink), winter (blue) and spring (green) mean rainfall totals for the 12 meteorological stations in the Cape Town area, with the solid lines representing smoothed series (LOWESS algorithm with smoothing parameter = 0.2), and the upper thinner line showing dam water storage as in (b).
Download figure:
Standard image High-resolution imageAfter consecutive years of increasing water demand due to rapid population growth, and expanded agricultural and tourism activities, in January 2018, city authorities issued an alert for 'Day Zero' to occur in mid-April when dam levels were expected to drop to 10% and taps in residential areas would be turned off. A restriction of only 50 l of water per day was imposed on all inhabitants, and the total daily consumption in the city dropped to about 500 million litres per day (∼25% decrease). As usage was reduced, and large-scale irrigation by commercial farmers ended in February, 'Day Zero' was pushed back later, and not expected to occur during 2018, provided the daily consumption remained near 500 million litres per day. The balance between the roles attributable to humans, such as the evident very poor planning behind increasing urban water shortages (Muller 2018), and uncontrollable factors such as regional meteorology, has become a matter of wide discussion concerning the prospects for upcoming drought severity and water availability in South Africa. In fact, and despite the existence of very strict water restriction policies imposed by the city, closer to average rainfall totals during 2018 or in upcoming years may not be sufficient to mitigate the adverse impacts of this very severe drought, given the very parched soil in the catchment areas which limits the amount of surface water run-off into the reservoirs. Thus, the possibility of reaching a 'Day Zero' remains a threat given the prospect of recurring dry conditions in Mediterranean climates (Indian Ocean Climate Initiative IOCI 2012, Kelley 2012, Mariotti et al 2015, Boisier et al 2016). In this sense, Otto et al (2018) have estimated the likelihood of an extreme meteorological drought, such as the 2015–2017 in Cape Town, to have increased by about a factor of three at the present rate of atmospheric warming associated to anthropogenic causes.
As for most Mediterranean climates, the Cape Town area is located on the western margins of a landmass and its winter rainfall is highly dependent on the transport of moisture from oceanic regions to its west. Most of the rainfall comes from cold fronts with cut-off lows sometimes making substantial contributions (Reason et al 2002, Singleton and Reason 2007). Although there is intrinsically high inter-annual variability in these latitudes, severe and prolonged droughts in Mediterranean climate regions are associated with large and persistent disruptions of the westerly flow and the resulting anomalies in the storm-track. Previous work has related rainfall variability in the greater Cape Town area to anomalies in South Atlantic sea surface temperature (SST) and sea ice (Reason et al 2002, Reason and Jagadheesha 2005, Blamey and Reason 2007), the Southern Annular Mode (SAM) (Reason and Rouault 2005, Gillet et al 2006) and the El Niño-Southern Oscillation (ENSO) (Reason et al 2000, Phillippon et al 2012). While SW Cape climate is evidently sensitive to a range of large-scale drivers, the common thread in all of these is the shift of the westerly storm-track and associated moisture fluxes towards the region. In this study, we show how a poleward shift in the moisture corridor across the South Atlantic was predominantly responsible for the ongoing drought. We also illustrate how this shift is linked to a poleward expansion of the subtropical anticyclones in the South Atlantic and South Indian Oceans.
2. Data and methods
2.1. Observational rainfall and water storage data
Monthly rainfall data between January 1979 and December 2017 were obtained for 12 meteorological stations in the greater Cape Town area. The data were provided by the South African Weather Service (SAWS). The stations, represented in figure 1(b) (red circles), are primarily located in the mountains to the east of the city of Cape Town, the key water source region.
The stored water levels presented here correspond to the Theewaterskloof dam (location presented in figure 1(b)), which is the largest capacity dam serving the Cape Town region, and was provided by the Department of Water Affairs, South Africa. Monthly levels of stored water, from the early 1990s to 2017, are presented in percentage of total capacity, and the 10% level is considered as the minimum threshold for potable water usage, as it corresponds to level of the outlet pipe. Stored water levels falling below this threshold are considered as 'unusable'.
2.2. Reanalysis data
Daily climatological data from the ERA-Interim reanalysis dataset during 1979–2017 (Dee et al 2011) were used to evaluate global and regional circulation. These data are provided on a horizontal grid with a resolution of 0.75° × 0.75°, and the following variables were considered: 2 m temperature; zonal wind component (u); meridional wind component (v); specific humidity (q); mean sea level pressure (MSLP); vertical velocity (ω). Some of the previous variables were post-processed in order to obtain the following derived variables:
2.3. IVT and atmospheric rivers (ARs)
Moisture availability and transport were evaluated using the vertically integrated water vapor transport (IVT), which is defined as the horizontal transport of the specific humidity, integrated for a vertical column of the troposphere (between 1000 and 300 hPa):
where q is the specific humidity, u and v the zonal and meridional layer averaged wind, dp is the pressure difference between two adjacent levels and g is the acceleration due to gravity.
ARs are relatively narrow plumes of moisture greater than 2000 km in length and less than 1000 km in width, usually transporting high water vapor content from the tropics towards higher latitudes, and have been associated with most heavy winter rainfall events over the SW Cape (Blamey et al 2018). Only ARs making landfall along (or just to the south of) the west coast of South Africa (between 27.75°S and 35.25°S, along the reference meridian at 15°E) were considered and were identified using the 85th percentile threshold of the maximum IVT (327 kg m−1 s−1, Blamey et al 2018).
2.4. Subtropical anticyclones
The central positions and intensity of the South Atlantic high pressure (SAHP) and South Indian Ocean high pressure (SIHP) were defined by finding the maxima of the MSLP field (after applying a 5 × 5 grid-point spatial smoothing filter). For visualization purposes, the extent of the SAHP and SIHP was defined by considering the 1020 hPa isobar. The mean location and extension during the extended austral winter have been computed for the climatological (1979–2017) and anomalous (2015–2017) periods along with the sea level pressure anomalies for 2015–2017. The location and intensity (maximum MSLP value) were also determined for each extended winter period (as departures from the mean) and for each individual month during the anomalous years.
2.5. Jet-streams
The polar and subtropical jet-streams have been detected using the horizontal wind (u and v) at the 300 hPa level, identifying areas with mean wind velocity above 20 ms−1. The mean climatological jet locations were compared against the 2015–2017 anomalous jets, at both inter-annual, and intra-annual scales.
2.6. Cyclonic activity
A simple algorithm for instantaneous cyclone detection was applied, identifying cyclones as minima of the MSLP and subject to the following criteria: (i) central pressure below 1010 hPa; (ii) minimum horizontal gradient of 5 hPa /500 km. These instantaneous cyclones were computed to address changes in their frequency of occurrence during the extended winters of 2015–2017 (compared to 1979–2017) in boxes 4.5° × 4.5° wide. Increases (decreases) in their frequency of occurrence are represented for boxes where at least 1 cyclone per season occurs during the 1979–2017 climatology and a relative change of at least 25% occurred during the 2015–2017 drought.
2.7. Southern annular mode
The SAM, also known as the Antarctic Oscillation is the leading mode of climate variability in the extra-tropical Southern Hemisphere (Kidson 1988, Thompson and Wallace 2000). The SAM index used here is that of Gong and Wang (1999):

where P*40°S and P*65°S are the normalized monthly zonal MSLP at 40°S and 65°S, respectively. The zonal MSLP means at 40°S and 65°S used to create the index here are based on station data (see Marshall 2003) over the period 1979–2017. Only data for the extended austral winter months were considered.
2.8. Circulation weather types (CWTs)
CWTs, as defined by Lamb (1972), are composite averaged characteristics of the synoptic scale patterns of circulation occurring over a given region of the globe, estimated using a set of indices associated with the direction and vorticity of the geostrophic flow. CWTs centered over the Cape Town area were computed using a previously developed algorithm (Trigo and DaCamara 2000) and adapted for this particular region. The algorithm relies on the mean daily MSLP fields from the ERA-Interim reanalysis dataset. The geostrophic approximation was used to attribute a circulation type to each day, depending on the direction and strength of airflow, and on the degree of cyclonicity. To facilitate the interpretation, CWTs were equally distributed into the respective pure directional and cyclonic/anticyclonic types, resulting in a total of 10 CWTs: N, NE, E, SE, S, SW, W, NW, C and A. These have been classified as wet/dry types according to their positive (negative) correlation with precipitation anomalies for the rainfall stations in the Cape Town area.
2.9. Trend estimation
Trends in the different time series for the period 1979–2017 were evaluated using the Theil-Sen slope estimator (Theil 1950, Sen 1968) and the non-parametric Mann–Kendall test (Mann 1945, Kendall 1975). The advantage of using such methods is that they are relatively insensitive to outliers. Furthermore, the Mann–Kendell test makes no assumption about the distribution of the underlying data. The significance level was set here at 5%, such that if the probability estimate was less than 0.05, the trend was evaluated to be significant.
3. Moisture availability in a warmer atmosphere
The very warm period spanning 2015–2017 corresponds to the warmest three years in terms of global average surface temperature (NOAA 2018). The 2 m mean global temperature series from the ERA-interim reanalysis dataset clearly reflect this recent apparent 'jump' in the record (figure 2(b)), which stands out from the already very warm period occurring since the turn of the century by a large margin (circa 2 standard deviations). This recent rise in surface temperature increased the capacity of the lower troposphere to retain water vapor (also ∼2 standard deviations during 2015–2017), in accordance with the Clausius–Clapeyron relation (O'Gorman and Muller 2010), a fact which is notable by the dominance of positive anomalies in the vertically IVT field (figure 2(a)). Although this overall increase in moisture content in a warmer atmosphere is reflected at the global and hemispherical scales (figures 2(a) and 2(b)), it does not occur everywhere. The band around ∼30°S–40°S does not follow the general trend of increase in moisture content with some areas even showing a decrease. In this sense, large-scale dynamics play an important role, as discussed below, by either amplifying or damping the increase in IVT imposed by thermodynamics (the Clausius–Clapeyron relation, e.g. Pfahl et al 2017).
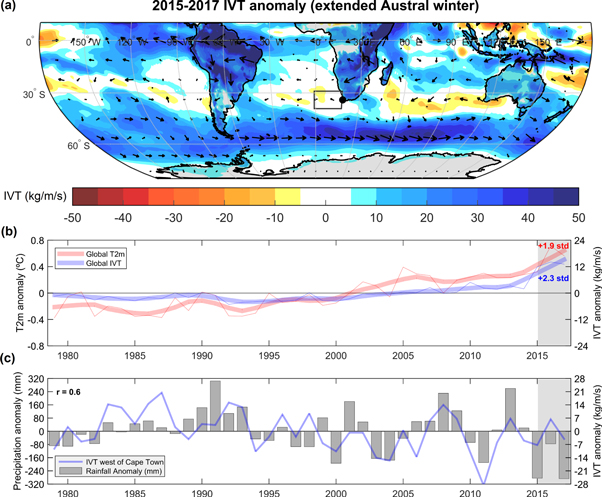
Figure 2. Changes in moisture fluxes: (a) anomalies of the vertically integrated water vapor transport (IVT) intensity (shaded) and direction (vectors) during the 2015–2017 extended austral winter (April–September), in kg m−1 s−1. (b) Anomalies for the global annual 2 m temperature (red) and global IVT (blue), with the thick line representing smoothed series (LOWESS algorithm with smoothing parameter = 0.2). Values in the top right corner represent the anomalies during 2015–2017 in terms of standard deviations. (c) Extended austral winter IVT (blue solid line) in the oceanic area located west of Cape Town averaged over the black box depicted in panel (a), compared against rainfall anomalies in the Cape Town area (grey bars).
Download figure:
Standard image High-resolution imageTo quantify the inter-annual variability and long-term change in IVT we considered a regional box located over the South Atlantic, in the vicinity of Cape Town (figures 2(a)/(c)). Precipitation anomaly series for Cape Town show a significant correlation value with the IVT anomaly series in that regional box (r = 0.6, p < 0.001), highlighting the contribution of the main South Atlantic moisture corridors towards South Africa for the country's rainfall variability (Blamey et al 2018). In fact, the IVT has been frequently used to address the variability and the occurrence of rainfall events in west-facing coastlines (Gimeno et al 2016, Lavers et al 2016). As shown here, in spite of the enhanced moisture content of a warmer troposphere, decreases in important mid-latitude moisture source and transport areas are a first indicator of how significant large-scale anomalous dynamics have contributed to the 2015–2017 drought.
4. Recent southern hemisphere atmospheric dynamics
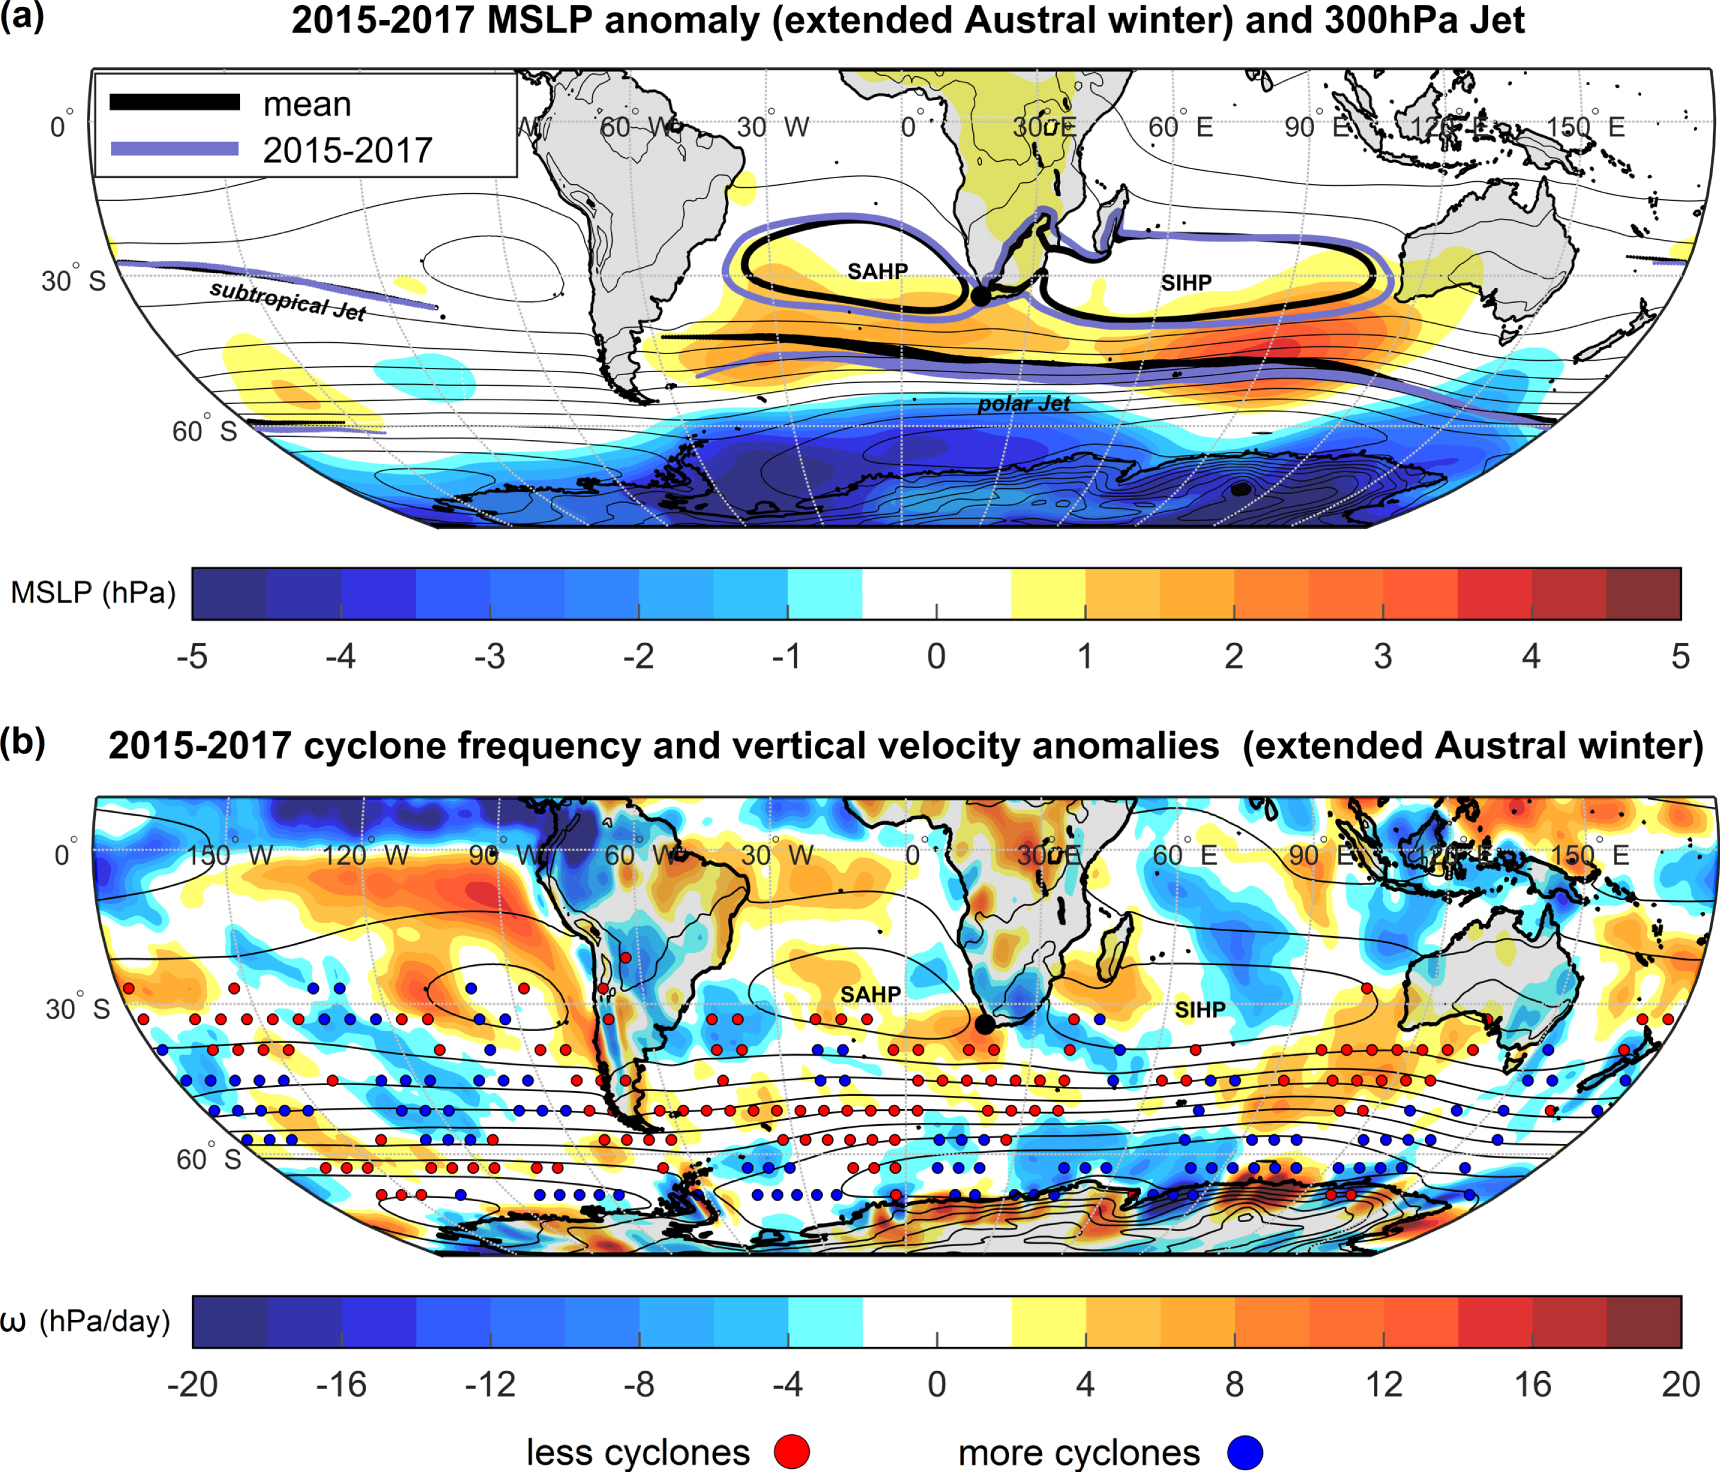
At the hemispherical scale, the 2015–2017 years were characterized by a clear expansion of the quasi-stationary high-pressure features in the South Atlantic and South Indian Oceans with a shift towards higher latitudes (figure 3(a)). This significant increase in surface pressure occurs considerably further south than the mean climatological central position of the SAHP and SIHP systems. Thus, while these subtropical semi-permanent anticyclones are generally centered around 30°S during the extended austral winter (April–September), the striking MSLP anomalies found during 2015–2017 suggest an increased ridging activity throughout all the mid-latitude belt spanning these two oceans. This result fits well with the observed tendency for the poleward expansion of the tropics detected in recent decades (Lu et al 2009, Lucas et al 2014) and expected to be enhanced further coupled with atmospheric and oceanic warming (Lu et al 2007, Staten et al 2012). Planetary wave patterns which support persistent poleward migrations of the subtropical high pressure belt are usually termed subtropical ridges, and have been linked with exceptional dry and warm spells in the Iberian Peninsula (Santos et al 2009, Sousa et al 2018), California (Wang et al 2014, Mann and Gleick 2015), Australia (Timbal and Drosdowsky 2013) and Chile (Center for Climate and Resilience Research CR2 2015).

Figure 3. Large-scale circulation: (a) climatology of the mean sea level pressure (MSLP) for the 1979–2017 period (black thin lines, 4 hPa interval) with the mean central position of the Southern Atlantic high pressure (SAHP) and the Southern Indian high pressure (SIHP) and mean extension (considering the 1020 hPa isobar). The MSLP anomalies during 2015–2017 are also depicted (shaded areas). The position of the 300 hPa jet-stream and the extension of the SAHP and SIHP are portrayed by the thicker lines, with black and lilac representing the climatological and anomalous (2015–2017), respectively. Areas where MSLP anomalies are not statistically significant at the 90% level were rejected. (b) Anomalies in the vertical velocity (ω) at the 700 hPa pressure level (shaded areas) during 2015–2017, and blue (red) circles represent areas with positive (negative) anomalies in the frequencies of cyclone centers within 4.5° × 4.5° boxes during the same period. The thin black lines are as in panel (a). Areas where ω anomalies are not statistically significant at the 90% level were rejected.
Download figure:
Standard image High-resolution imageAs a consequence of this anomalous large-scale atmospheric circulation, the mean position of the polar branch of the Southern Hemisphere jet-stream underwent a poleward shift during 2015–2017 (figure 3(a)). While the strongest branch in the South Atlantic usually initiates in the area of confluence between the Southern Pacific polar jet and the subtropical jet located downstream of the Andes, the anomalous 2015–2017 jet-stream over the South Atlantic appears detached from the subtropical jet, while also being located a few degrees southwards. Consequently, fewer extratropical cyclones occurred near South Africa during 2015–2017 (figure 3(b), red circles), while increased cyclonic frequency was detected close to Antarctica (blue circles). Frontal activity in South Africa is largely dependent on cyclogenesis occurring upstream (near the southern coast of South America), that in turn is controlled by regional variations of the South American low level jet (SALLJ). In fact, tropical and subtropical circulation patterns in South America have been shown to be associated with South African rainfall anomalies by modulating the Walker cell and extra-tropical Rossby wave trains (Grimm and Reason 2011, Grimm and Reason 2015). Furthermore, higher surface pressure in the South Atlantic is associated with the meridional strengthening of the SALLJ south of 25°S (usually named as a Chaco Jet Event, Seluchi and Marengo 2000), leading to the jet exit area and associated moisture corridor moving further south (as shown in figure 2(a)). Thus, changes in large-scale circulation features during 2015–2017 might have severely hampered moisture transport from important regional remote sources, both local and remote (such as the Amazon area, Ramos et al 2018) towards SW Cape. In addition to these changes in the South Atlantic storm-track, our results also show an important increase in subsidence with a maximum located precisely over the Cape Town area and adjacent oceanic areas (figure 3(b), shaded), adding yet another rainfall inhibiting mechanism. Slight increases in upward motion found over the southern African interior plateau (which is typically very dry during winter) are unlikely to significantly impact the Cape Town catchment area since this region is well downstream of where the westerly disturbances impact on the catchment.
On the other hand, the increased cyclonic frequency closer to Antarctica is also reflected in the negative MSLP anomalies observed at higher latitudes. This enhanced meridional pressure gradient indicates a stronger positive phase of the SAM, and the associated intensification of the westerly flow encircling the polar cap. Changes in strength and sign in the annular modes can explain a large part of the inter-annual variability of rainfall in mid-latitude climates, and wet years in the Cape Town region have been shown to relate well with negative phases of the SAM (Reason and Rouault 2005, Gillet et al 2006).
The long-term rainfall decrease in the Cape Town area (figure 4(a)), particularly aggravated since 2015, is consistent with the one obtained for the SAHP central latitude (figure 4(b), left axis), emphasizing the effect of recent increased subtropical ridging on the deviation of storms further south from the Cape Town area, and the concurrent aggravation of the drought. Also, the positive trend in the central maximum pressure of the SAHP (figure 4(b), right axis) reinforces the clear fingerprint of enhanced subsidence (see figure 3(b)) associated with the expanded South Atlantic anticyclone observed during the 2015–2017 drought period. This tendency is visible in the increased prevalence of the positive SAM phase, as shown by its long-term trend (figure 4(c)), also consistent with the decreased rainfall. On the other hand, no significant correlation is found between the Niño 3.4 series and rainfall anomalies, indicating that a direct link between a positive ENSO phase and winter rainfall in CT is difficult to establish. In summary, all these factors highlight a regional pattern of drying and increased atmospheric stability driven by the larger-scale forcing which has dominated since 2015. This substantial change in dominant weather regimes over the region is also expressed by a decrease (increase) of rainy (dry) weather types affecting the SW Cape (see supplementary information figure S3).
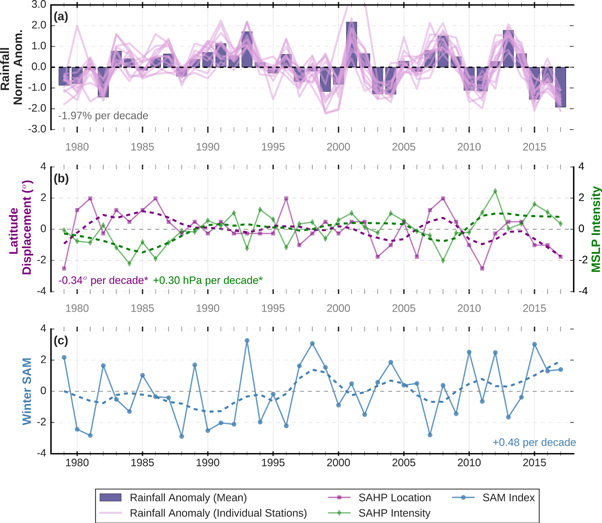
Figure 4. Long-term trends: (a) normalised anomalies of the extended winter (April–September) rainfall with the pink lines representing individual stations (see figure 1) and the bars being the mean across the stations. (b) The north/south displacement of the SAHP (solid purple line) and the normalised anomaly of the intensity of the SAHP (solid green line) during each winter were calculated based on the MSLP at the centre of the SAHP. Dashed lines represent smoothed curves using a LOWESS algorithm (with smoothing parameter = 0.2). (c) The extended winter SAM index (solid blue line) and the smoothed series (as in panel (b)). Trends of each variable are placed at the bottom of each panel, with trends that are statistically significant at the 95% level denoted with a '*'.
Download figure:
Standard image High-resolution image5. Regional fingerprint on available moisture
To evaluate regional responses associated with the anomalous large-scale dynamics discussed in the previous section, the intra-annual variability of the mean latitude (between 30°W and 30°E) where the jet-stream and the maximum IVT were located is presented in figure 5, and compared against the rainfall seasonality during the 2015–2017 drought. The noticeable southward shift of the jet-stream mean position is also evident during the extended winter period (figure 5(a)), except for June. In some months this remarkable deviation reaches around 5°, when compared to the 1979–2017 climatology. Regarding the latitude where the maximum IVT is found, there is also a poleward shift, although with a smaller magnitude (∼2°), and occurring mainly during the core winter months (JJA). As a combined result of these regional shifts in the mean zonal flow and moisture transport, it is possible to account for precipitation losses in almost all months (figure 5(b)). The rainfall decrease was least striking in June when the 2015–2017 jet was not located well south of its mean unlike the case for the other months. As shown in figure 1, the lack of appreciable rainfall was most notable during the transition seasons. In particular, May, which is the fourth wettest month in the region on average, received rainfall totals ∼1/3 of the climatological mean for all the anomalous years. These results demonstrate how large-scale mechanisms led to a drastic shortening and delay of the rainy season, strongly contributing to the unprecedented drought.

Figure 5. Intra-annual variability: (a) intra-annual variability of the jet-stream (solid thick lines) and maximum IVT (thin dashed lines) location, in terms of latitude, during the 2015–2017 drought (blue) against the mean climatology (black), after zonally averaging between 30°W and 30°E. Anomalies that are statistically significant at the 90% level are marked with a cross. (b) Intra-annual variability of rainfall series (the mean of the 12 stations presented in figure 1(b)) weighted for the whole 2015–2017 drought (blue bars) against the climatological mean (black bars). Individual years during the drought are represented by the thinner lines.
Download figure:
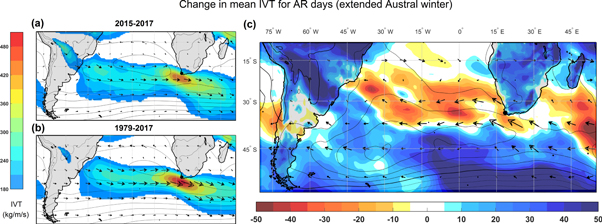
Standard image High-resolution imageThe influence of large-scale circulation changes on regional climate is further demonstrated by the change in moisture associated with ARs. AR events have been shown to be associated with heavy rainfall events over the SW Cape and contribute significantly to annual rainfall totals (Blamey et al 2018). ARs transport moisture across subtropical oceans towards land areas (on time scales of one to a few days) where they then precipitate. The IVT composite for AR days that occurred during the 2015–2017 extended winters (figure 6(a)) was compared to the 1979–2017 climatology (figure 6(b)). A decrease in the mean intensity of ARs and of the zonal flow, as well as a deflection of the maximum IVT corridors towards higher latitudes, i.e. further away from the Cape Town area, occurred during 2015–2017 (figure 6(c)). This pattern agrees with the large-scale anomalies identified for mid-latitude cyclone frequencies and the atypical mean jet-stream position, driven by the anomalous location and intensity of the SAHP (see supplementary information figure S2) and SIHP.
Figure 6. Atmospheric rivers: (a) mean IVT intensity and direction (in kg m−1 s−1) during atmospheric river (AR) days for the drought period (2015–2017). (b) Same as in (a), but for AR days during the climatological period (1979–2017) drought. (c) Difference between (b) and (a).
Download figure:
Standard image High-resolution image
6. Discussion and summary
Preliminary SAWS data suggests that although early winter 2018 was relatively wet in the catchment area, the mid-winter (particularly July) and part of the late winter received below average rainfall. As of mid-October 2018, the Cape Town supply dams have recovered to about 75% and, so long as consumption remains at not much more than 70 l per person per day, the city should manage until the next significant rains occur in austral winter 2019. However, this situation is not sustainable in the long-term, and the need to effectively 'crisis-manage' water usage is detrimental to human welfare, ecosystems health and the regional economy. Unfortunately, most studies have found evidence of Mediterranean climates, such as the Cape Town region, being more susceptible to adverse impacts of climate change. Regions within the 30°−40° latitude bands are projected to suffer the largest drying trends (Scheff and Frierson 2012, IPCC 2013), as the expected dynamically driven drying contribution overwhelms the spatially homogeneous moisture increase (Pfahl et al 2017), and subtropical arid climates are expected to expand poleward (Seager et al 2015, Heffernan 2016). The shortening of the winter rainy season has also been pointed to as a key factor for the expected drying trends in these climates (IPCC 2013). Our results show that during the exceptionally dry period of 2015–2017, near-normal large-scale circulation, and consequently near-normal rainfall, has been restricted to mid-winter months, with a significant disruption of the midlatitude South Atlantic westerly flow associated with a noticeable drying during transition seasons (spring and autumn).
Furthermore, within the context of global warming, at the current rate of change in mid-latitude climates, to what extent are these projected changes in the climate actually occurring now? While a recent analysis has put the region's rainfall scarcity into context within global warming trends (Otto et al 2018), our results clearly show the dynamical features that drove large-scale austral circulation changes during this exceptionality warm period occurring at the planetary scale. We demonstrate how a poleward shift of the large-scale synoptic features that dominate the Southern Hemisphere midlatitude meteorological variability (in particular the jet-stream and storm-tracks) imposed a dramatic rainfall shortage in SW South Africa. Although the very strong 2015–2016 El Niño event occurred during the ongoing drought in the Cape Town area, and may therefore have contributed to the exceptional increase in global and regional temperatures during these three years, the feedback between SSTs and atmospheric dynamics (particularly ENSO) on winter rainfall in the region is far less clear than for the summer rainfall region of South Africa (Reason et al 2002, Philippon et al 2012, Zhang et al 2018). Results here show a strong SAM influence together with an expansion of the semi-permanent subtropical anticyclones in the South Atlantic and South Indian Oceans as key factors for a poleward deviation of moisture corridors, and consequently for the regional drying trend which culminated in the 'Day Zero' water crisis. In fact, Vera and Osman (2018) have shown a decoupling of a previously strong link between El Niño and the negative phase of SAM since 2015. Given that the subtropical anticyclones are expected to expand further poleward under climate change (despite disparate observational-based rates of expansion—e.g. Lu et al 2007, Johanson and Fu 2009, Staten et al 2018), and the SAM is projected to increase (Lim et al 2016) with an associated robust poleward shift of the jet-stream (Chavaillaz et al 2013, Ceppi et al 2014), our results suggest that very severe droughts like 2015–2017 can be expected to occur more often in the Cape Town region in the future. Furthermore, similar rainfall declines found in other Mediterranean-like climates of the southern hemisphere (e.g. southwestern Australia—Smith et al 2000; Chile—Garreaud et al 2017) have also been attributed to analogous changes in large-scale drivers in the South Indian Ocean and the South Pacific Ocean. This reinforces the need for further studies regarding the magnitude of anthropogenic driven impacts on large-scale atmospheric circulation changes.
Contributions
All authors designed the study. PMS, RCB and AMR conducted the experiments; PMS and RCB produced the figures; PMS wrote the initial manuscript draft; RCB, RMT and CJCR organized, revised and edited the manuscript. All authors contributed to the interpretation of the results and improvement of the paper.
Acknowledgments
Pedro M Sousa, Chris J C Reason and Alexandre M Ramos were supported by the project Improving Drought and Flood Early Warning, Forecasting and Mitigation using real-time hydroclimatic indicators (IMDROFLOOD) funded by Fundação para a Ciência e a Tecnologia, Portugal (FCT, WaterJPI/0004/2014). Ross C Blamey and Chris J C Reason were also supported by the Natural Environment Research Council (NERC) Future Climate for Africa (FCFA) regional consortium project UMFULA (NE/M020223/1). Alexandre M Ramos was also supported by a postdoctoral grant (SFRH/BPD/84328/2012) by Fundação para a Ciência e a Tecnologia (FCT).
The SAM data used here is available at: https://legacy.bas.ac.uk/met/gjma/sam.html.