
Analysis of Financial Problems of Wind Farms in Poland


1
Institute of Finance, Cracow University of Economics, 27 Rakowicka Street, 31-510 Cracow, Poland
2
Faculty of Economics and Management, University of Zielona Góra, Licealna Street 9, 65-417 Zielona Góra, Poland
*
Author to whom correspondence should be addressed.
Energies 2021, 14(5), 1239; https://doi.org/10.3390/en14051239
Submission received: 13 January 2021
/
Revised: 13 February 2021
/
Accepted: 15 February 2021
/
Published: 24 February 2021
(This article belongs to the Special Issue Economic Aspects of Low Carbon Development)
Abstract
:Wind energy has been operating in Poland for over 20 years, but many opinions on its profitability are based on publications from other countries and simulations prepared by manufacturers. However, the truth is that the climatic specificity of various countries and price relationships, especially energy prices and subsidies, significantly differentiate this profitability depending on the country. The publication aimed to look at the profitability of wind farms in Poland from three perspectives: financial analysis, NPV (Net Present Value) calculation for older wind farms (2006–2014), and break-even price of energy for these farms (for a non-negative NPV). The research hypothesis set out in the publication stated that wind farms from this period require higher energy prices than current market prices in Poland to achieve a return on invested capital. An element of novelty was calculating the energy price range that would provide an opportunity for at least some of the older farms operating in the green certificates scheme to achieve a positive NPV. We also attempted to demonstrate that the loss of control over the prices of green certificates, which took place in 2014–2017, led to such a decrease in energy prices that the 2006–2014 wind farms suffered a net loss.
1. Introduction
In recent years, the European Union has actively promoted renewable energy sources, including wind energy [1]. It was a major element of low-carbon development, which was also very important for countries such as Poland [2]. This subject has been considered in many publications, in which the authors not only pointed to the economic aspects of low-emission development, but also the potential of using various renewable energy sources [3,4,5,6,7]. Wind farms are said to be financially profitable investments simultaneously serving environmental protection. However, in recent years, many older wind farms have recorded financial losses. In this publication, we want to examine the extent to which these losses resulted from too low renewable energy prices.
This article focuses on wind farms created in the years 2006–2014 in Poland, where at this time there was no auction system for contracting energy, but only a system of green certificates. We calculated the NPV (Net Present Value) break-even prices of energy (together with prices of green certificates) for wind farms established in 2006–2014 and compared them with the current price levels of energy. Assuming the absence of other forms of government assistance other than green certificates, we will demonstrate that in many years, these market prices were lower than the minimum necessary for these farms to maintain a presence on the market (which was partially caused by the changes of the legal system). It was due to the lack of proper oversight and corrections to the green certificates quotas (in other words, the situation required modifications in the legal regulations governing the renewable energy market).
Wind energy has been operating in Poland for over 20 years, but its profitability has shifted over time for various reasons, including due to changing legal regulations. Another problem is that opinions about its profitability are often based on publications from other countries and simulations drafted by manufacturers. The publication aimed to look at the profitability of wind farms in Poland from three perspectives: financial analysis, the NPV calculation for older wind farms (2006–2014), and break-even prices of energy for these farms (for a non-negative NPV). The research hypothesis set out in the publication stated that wind farms from this period require higher energy prices than current market prices in Poland to achieve a return on invested capital. An element of novelty was calculating the energy price range that would provide an opportunity for at least some of the older farms operating under the green certificates scheme to achieve a positive NPV. We also attempted to demonstrate that the loss of control over the prices of green certificates, which took place in the period 2014–2017, led to such a decrease in energy prices that the 2006–2014 wind farms suffered net losses.
The structure of the article is as follows. The first subsection discusses the reasons for the financial problems of older wind farms in Poland (with references to Europe). The second subchapter describes the results of previous research on wind energy prices sufficient to allow wind farms obtain a positive NPV (for various years and countries). The research method is discussed in the third section. The results of our calculations are presented in the fourth section, while the fifth section provides a discussion and conclusions for renewable energy policies.
2. Economic, Political, and Social Problems of Wind Farms in Poland
Prices of energy are dropping due to rapid technological development in the field of wind energy [3,4,8,9]. This can be best illustrated with the changes in capacity factors and installation costs. Research shows that between 2009 and 2017, capacity factors (efficiency at which farms use the wind to generate power) increased on average from 30% to 35% [10,11,12]. This means that a newer wind turbine (which has higher capacity factors due to higher hubs and rotor diameters) can now generate 16.67% more energy than 10 years ago in the same location. Table 1 shows the improvement in Poland’s capacity factors; calculations were based on all new wind farms built in 2005–2019. Table 1 illustrates the median theoretical (assumed by manufacturers of wind turbines) capacity factors for new wind turbines installed in Poland in a given year. For example, the values for 2017 represent the median theoretical capacity factors (for different wind speeds) for turbines at farms launched in 2017. It can be calculated that the capacity factors between 2005 and 2017 increased (depending on the wind speed) by 19 to 30% (percentage increase between the years 2005 and 2019 for different assumed wind speeds).
At the same time, the average investment costs per kW of power dropped from 1470.17 EURO/kW in 2010 to 1315.77 EURO/kW in 2019 [at constant prices from the year 2019] [13]. The high financial efficiency of new wind energy installations (which achieve a positive NPV for much lower energy prices than older wind farms) reduced the wind energy prices from 0.065 EURO/kWh in 2010 to 0.047 EURO/kWh (in constant 2019 prices) [10,12,14]. In other words, new wind turbines can produce electricity much cheaper than older technology because they transform wind power into electricity much more efficiently. As a result, newly opened, more modern wind farms sell their energy at low prices, which in effect decreases the market prices of wind energy (the additional supply of cheaper energy affects the average market prices).
In Poland, the decrease in revenues from the sale of energy received by wind farms (operating under the green certificate scheme) in 2012–2017 resulted not only from the technological changes described in the previous paragraph but also the oversupply of green certificates.
The green certificate system has been in force in Poland since 1 October 2005. In the initial period of the system’s operation, i.e., in 2006–2011, there was a structural shortage of green certificates on the market. As a result, the prices of green certificates grew (denominated in the Polish currency), which triggered an investment boom—there appeared a lot of new wind farms, which increased the supply of green certificates on the market after starting operation (more or less from 2012). The increased supply caused a drop in the prices of green certificates from 2012.
As demonstrated in Table 2, there was a drop in market prices of green certificates in Poland from a relatively stable level of 69.95 EURO/MWh in 2009 to 9.48 EURO /MWh in 2017 (in constant 2019 prices), and only after changes in the quotas started to increase and in the year 2019 reached 30.75 EURO/MWh (in 2019 prices). As a result, the sum of the market energy price plus the price of green certificates (that is, the potential sum that would be received by wind farms provided they were selling their energy at market prices) decreased from 123.24 EUR/MWh in 2009 to 49.43 EURO/MWh in 2017 and only the last two years have seen a return of these prices to 87.84 EURO/MWh in 2019.
On top of this, in 2016, the Polish government introduced the Distance Act [16,17], which required wind turbines to be located at least 10 times their height from the nearest households. The Distance Act limited the number of plots available for wind farms, especially new and large turbines. In turn, the new act increased the rental prices of such parcels for new wind farms and almost stopped the development of wind technology in Poland [18,19].
As a result (mainly due to the oversupply of green certificates), 70% of Poland’s wind farms in 2017 ended the fiscal year with a net loss. In 2019, the government adopted a looser stance (it adjusted the quotas for green certificates and lessened distance requirements), which immediately impacted market trends. Nevertheless, many wind farms in Poland still generate losses (the oversupply of green certificates decreased, but it still existed in 2019).
Not only Poland is experiencing such problems. Numerous publications describe the presence of the same issues, i.e., declining prices, shrinking government support [20], and harsh legal regulations all over Europe—for example, the suspension of support schemes for large installations by Cyprus and Portugal, the suspension of the existing support schemes for promoting (only) new energy installations in Spain, the abolishment of the Feed-in Tariffs scheme in the Czech Republic, the adoption of special taxes over the new and existing wind turbines in Wallonia, limitation of the maximum power generation of wind farms in Bulgaria, imposition of a levy on the gross income of all operating RES projects in Greece, slashing mandatory quotas for green certificates in Romania [21]. The year 2018 was the lowest year for new installations since 2008 [22], and the situation did not improve in 2019 [23].
As if falling prices, political infighting, and faulty government support systems [24] were not enough, there is still a resistance against wind power (popularly called the NIMBY syndrome—Not In My Back Yard) [25,26,27,28]. Political reluctance towards wind turbines is believed to stem from the ties to conventional energy interests and fears of grid stability if conventional power plants are put at a disadvantageous position. As a consequence, countries all over Europe want (and try) to get rid of subsidies for renewable energy.
Government support is not only shrinking, but the weak sides of every support system are becoming more and more evident. Green certificates systems did not consider the possibility of excess supply, which reduced their prices to deficient levels (power plants burn straw and coconut shells and produce cheap renewable energy, so they do not need green certificates). Feed-in-tariffs (FIT) guarantee the selling price, but it is tough to set this price (or premium) right (although many researchers argue that FIT encourages small entrants to participate in auctions (all they need to do is bid honestly to avoid losses)). They also have a slow reaction time. With feed-in-premiums, similarly to FIT, there is a risk of over- or under-compensation in FIP schemes since they are set by an administrative decision of adequate authorities. The same problem arises if the FIP scheme involves setting a minimum and maximum remuneration level or regression mechanism [28]. FIP schemes work best with dispatchable RES such as biomass or geothermal farms or RES that allow for energy storage, with the wind energy FIP scheme requiring the procurement of balancing services [29]. Auction systems [30] guarantee the winner a fixed energy price for 15 or 20 years. Still, they are often based on government-specified large baskets of energy and technology requirements, which must be offered by the energy producers (and if the market energy prices exceed the auction price, the wind farm pays back the difference). Usually, large corporations find it much easier to meet these criteria than prosumers or small local companies [31]. Tax incentives, which were the first system of government support, also failed: they often led to the construction of poorly designed and inefficient wind farms, many of which did not operate. Capital grants made all involved parties (manufacturers and wind farms) lose interest in efficiency and market usefulness [32].
Wind farms also suffer from a social aversion towards wind turbines [33]. Local communities are afraid of infrasound [34] and the possible negative environmental impact that wind turbines are perceived to have on the immediate local environment (such as the deaths of birds [35,36] and bats [37]) and how rural spaces generally should be [38]. Even the authors who do not find physical evidence of infrasound affecting nearby houses confirm that wind turbine noise elicits annoyance that may affect health [39]. Surveys among villagers confirm that fear of wind turbines may impact land availability for installations and significantly increase land rental prices [40,41]. The Polish Distance Act reflects the importance of this argument. Introduced in 2016, the Distance Act in Poland requires any wind turbines to be located at least 10 times their length from the nearest household (Wind Farm Investments Act of 20 May 2016 [16]; this condition is difficult to meet in Poland for onshore wind farms). Windfarm aversion increases the costs of new installations, especially with large turbines.
If we look at the data provided by the WindEurope 2018 report [22] for 12 EU countries, in 2018, there were no new wind turbines installed in: Bulgaria, Croatia, Cyprus, Estonia, Finland, Hungary, Latvia, Luxembourg, Malta, Romania, Slovakia, and Slovenia. Less than a 5% increase in capacity was encountered in Poland, Lithuania, and the Czech Republic. As can be seen, most emerging economies in the EU had none or minimal investments in wind energy in 2018. Low investment expenses are accompanied by the low profitability of wind farms all over Europe. The situation improved in 2019, but general trends are not optimistic [42].
Table A1 (in Appendix C) shows the number of wind farms analyzed in this study. We downloaded financial statements from the Orbis database. Table A2 (in Appendix C) illustrates the average return on equity for the analyzed financial statements (relation of net financial result to own capital).
Table A2 illustrates an important fact: the average return on equity for the analyzed sample every year was negative. In Hungary, Finland, France, Italy, Latvia, the Netherlands, Poland, Romania, Slovenia, and Sweden, the average return on equity was negative for almost the entire period 2009–2017.
To find out how many farms ended the accounting year with net losses, we calculated the percentage of farms with a negative financial result as a percentage of all wind farm reports for a given year that have been examined in this study (broken down by years and by country). Table 3 presents the percentage of investigated wind farms that ended the accounting year with net losses. As shown in Table 3, in countries such as Croatia, Estonia, Germany, Greece, Hungary, Italy, Latvia, Poland, Romania, Slovenia, and Sweden, it is not uncommon for half of the analyzed sample of companies to generate net accounting losses at the end of the year. Extreme, unprofitable wind energy cases can be observed for France, Hungary, Italy, Latvia, Poland, Slovenia, and Sweden.
It seems that despite the progress in wind turbine technology [44], many wind farms did not break even in recent years. Among emerging economies, only the Czech Republic and Estonia were doing relatively well. One of the extreme cases of negative profitability of wind farms was Poland.
The main reason for the low profitability of wind farms in Poland was a significant decrease in renewable energy prices. Simultaneously, there are numerous publications claiming that wind farms in 2018 could do with very little government support, but this applies to new technology being currently developed, not the wind farms created in the years 2006–2014. Their assumed total prices of energy (in their business plans) fell in the range of 96–109 EURO/MWh (in 2019 prices), which was meant to be the fixed price for the entire exploitation period.
3. Review of Previous Studies
A standard measure of RES financial self-sufficiency is the so-called Levelized Cost of Electricity (LCOE), calculated as the quotient of the sum of costs throughout the investment (power plants) divided by the amount of electricity received at that time. The sum of the cash flows generated by a power plant is calculated as the discounted sum of investment outlays, operating and maintenance costs of the power plant, and the energy needed to generate new electricity. The same discount rate as for nominator (we assumed a discount rate of 10% [45] but also considered 5% and 7%) is also applied to the denominator’s values representing the energy quantities produced in all the years of the plant’s life as costs and inputs [46]. Comparing the LCOE of wind farms with that of a conventional power plant, it is evident which technology is cheaper.
The LCOE equation has many drawbacks. Firstly, it can include the value of additional payments, RES subsidies, and carbon emission penalties, making the calculus include political attitudes towards various energy sources [47]. Therefore, it should be carefully checked what costs and revenues were included in the calculation of the LCOE and which were not:
where I (t)—capital expenditures in year t, M (t)—operating and maintenance costs of the power plant in year t, F (t)—energy expenditure needed for the operation of the power plant in year t, D (t)—subsidies in year t, G (t)—the price of emission certificates in year t, P (t)—carbon emission penalties, E (t)—electricity generated in year t, and n—expected number of years of operation of the power plant in years.
The second problem with the LCOE formula is that it is simplified. According to Shah and Bazilian [48], the levelized cost of electricity masks regional variability when used as the average LCOE across different countries. According to Burenstam-Linder, the LCOE may lead to misleading comparisons due to the possible high variation of projected utilization rates, the existing resource mix, and capacity values across regions [49]. According to Aldersey-Williams and Rubert [50], problems with the LCOE “center on the discount rate, inflation effects and the sensitivity of results to uncertainty in future commodity cost.” According to Branker et al. [51], “LCOE may be providing an incorrect reflection of the time effects associated with matching electricity production to demand.” According to Gonzales et al., the LCOE approach also does not allow the non-linear behavior of variables [40,52].
All mentioned above reasons do not make the LCOE a recommended method for determining the profitability of a concrete plant. For this purpose, we must calculate the NPV of the project or create a real-life simulation. Very often, it is not clearly stated whether the costs and revenues of government intervention were included in the calculation. Different calculation formulas and projections lead to varying results concerning the costs of various sources of energy (all calculations in this paper for LCOE for coal energy plants include the CO2 emission penalties).
For example, in 2018, the Institute for Solar Energy Systems ISE (in Germany) published a report [53] in which the LCOE was estimated for new coal-fired power stations in a price range of (in 2019 prices) 64.45–101.27 EUR/MWh (brown and hard coal range, for 5350–7450 FLH [in hours/year]), for onshore wind power 40.92–83.87 EUR/MWh, and offshore wind power 76.73–141.17 EUR/1 MWh (according to authors, heat offtake was not taken into account in order to preserve the basis for comparison with the LCOE of other technologies, so the given prices only concern electricity sales, MWhe).
In 2015, the Department for Business, Energy & Industrial Strategy in the UK [54] gave the following LCOE ranges for new power plants: the cost of energy from hard coal should fall in the ranges of 157.99–217.87 EURO/MWh (in 2019 prices), while the cost of onshore and offshore wind energy, respectively, in the ranges: 59.88–96.83 (onshore) and 114.67–146.52 EURO/MWh (offshore) (in this study, the authors assumed that the heat-to-power ratios were adequate for every technology and that power plants have continuous heat offtake agreements at prices based on the avoided boiler cost approach and included such revenues in the calculation of the LCOE [55,56]).
The US government’s Office of Energy Analysis (EIA) reported that in 2022, new coal-fired power plants will have an LCOE at the level (in 2019 prices) of 86.28–164.17 EURO/MWh, and onshore and offshore wind power, respectively, of 36–70.33 EURO/MWh and 114.76–178.41 EURO/MWh (in the report [57], the authors indicated that they did not include heat offtake agreements in the calculations for new coal power plants).
Nevertheless, all the LCOE calculations suggest that the financial results of wind farms should be outstanding because they can produce energy cheaper than coal-fired power plants (but only if a decent carbon price is included). However, this applies to power plants to be created in the future, not the existing power stations, and it is rather an estimate than a correct calculation of the costs and prices of a wind farm.
Another evidence suggesting that wind energy might still be more expensive compared to carbon power plants is the level of subsidies and tax credits offered to investors who decide to build a wind farm. A study by the University of Texas [31] projected that U.S. energy subsidies per megawatt-hour in 2019 (in 2019 prices) would be 0.45 EURO for coal, 0.89–1.79 EURO for oil and natural gas, 13.4–50.92 EURO for wind, and 38.41–285.84 EURO for solar energy (on top of the market price of energy). Another evidence suggesting that the wind industry continues to be unable to operate without government support is the simple fact that US experience shows that when temporary tax credits on wind energy expired, installations nearly ground to a halt [44,58,59]. Shrinking government support in the EU in 2017 and 2018, resulting in low investment in wind farms, also proves this point. In Poland, in 2017, there were complaints reported by wind farms that they might be forced to bankruptcy if the prices of green certificates remain at the historically lowest levels (in 2017).
4. Materials and Methods
In order to look at the profitability of wind farms in Poland, we performed three types of analyses. The first consisted of comparing the profitability ratios already presented during the initial discussion between countries and over time. As demonstrated by those ratios, a large part of wind farms in Poland suffered losses in the analyzed period. The second analysis calculates the wind farm NPV [60] based on the average daily readings of wind force from meteorological stations. Unfortunately, we did not have detailed hourly data; hence, we estimated electricity production using a simplified formula based on the average wind force. We chose this solution after consultations with practitioners because the application of the average daily wind speed (instead of hourly wind speed) allows to estimate the Weibull distribution [61], since: “although it produces correct average wind speed, [it] underestimates standard deviation” [62]. Therefore, we used a simplified approach (presented in the following subchapter) which, according to practitioners, can produce an error in the range of 10–15% of total energy output.
The simulation used average energy prices in Poland and extrapolated costs (from the available business plans and the financial statements of wind farms). Admittedly, in theory, there is usually a correlation between the amount of energy produced by wind farms and energy prices (that is, a correlation between the time of a day of wind and prices of energy), but we assumed that it is not very high as the daily production pattern is unclear and also because seasonal patterns are reflected by the average daily prices. That is why we decided that we would not introduce a big error in the calculations using the average daily prices. For the given location of the station, the simulation produced the overall NPV if there was truly a wind farm there.
The third and final part of the research consisted of using information about the type of wind turbines in various wind farms in Poland and the estimated energy generated daily by these farms (data from thewindpower.net for 2016) to calculate at which energy sale prices these farms would have a positive NPV (we took the load factors for these farms for the year 2016 and multiplied them by the farm’s nominal power, which gave us the annual energy production of every analyzed farm—we used the load factors for the year 2016 as it was a good representation of the load factors of these farms). All calculations were estimates, i.e., they were based on the average wind strength, average investment outlays, or average operating costs for a given year, but they coincide with publications in the press regarding the minimum transaction prices of energy necessary for wind farms. Our goal was to make such estimates credible using calculations. We are aware of the imperfections of our calculations. Still, in our opinion, even an approximate calculation is better than providing the amounts without any justification or informing that they were in fact calculated, without explaining how [63].
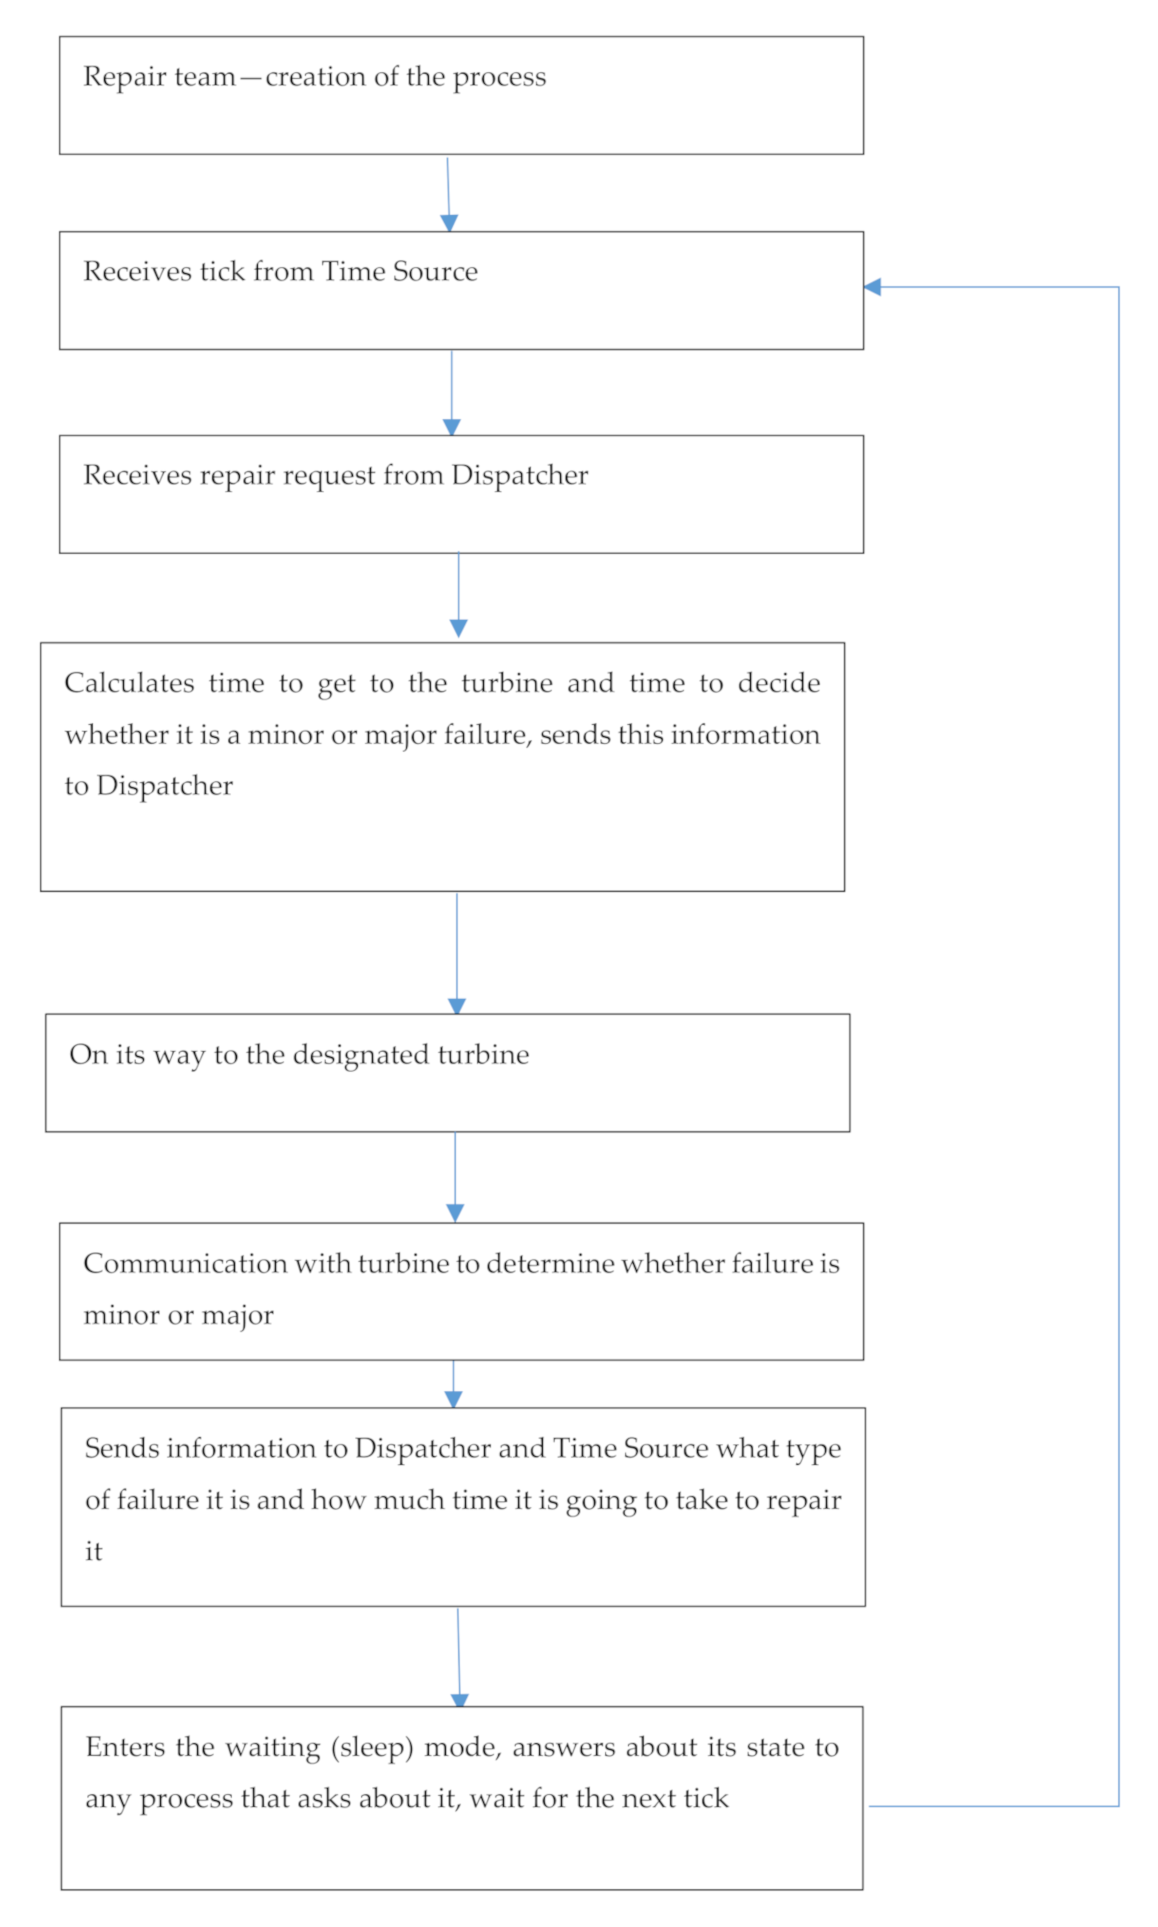
Erlang’s simulation took 20 years of data from a weather station (if these data were unavailable, the simulation filled the missing years with the available data) on the average wind force for a given day. Then, using the formulas presented below, the farm generated sales revenues and costs for each site. The simulation allowed us to analyze any number of turbines and the differences in wind strength between them. We assumed these differences at the level of 20%. The simulation also moved the repair teams and randomized which turbines were damaged (two types of damage were possible—large failure and small failure; the amounts and frequencies of failures were estimated based on statistics available on manufacturers’ websites). Ultimately, the simulation computed the overall NPV of the simulated farm [64]. States diagrams and description of processes used in simulation are presented in Appendix A and Appendix B.
4.1. The Simplified Approach Used in the Erlang Simulation
The purpose of the simulation was to give a reliable estimate of the energy production costs generated by a wind farm constructed in 2006–2014. We also wanted to calculate the NPV of such a project for the energy prices (total, with green certificates) that these farms assumed in their original business plans (0.065 EURO/kWh, 2019 prices).
4.1.1. Calculation of the Wind Energy Generated by the Turbine
Since the available wind data were limited to daily averages (no other information was useful), the energy calculation was based on simplifying the formula. The variable W represents the wind speed at the height of the wind turbine. It must be calculated based on the wind measurement, which was done at the height of 10 m (h). Formula (2) calculates the average wind speed at the height H:
where W—wind speed at height H [m], A—wind speed at the measurement height h [m], and alpha—terrain area factor; alpha = 0.143 (default value; it could be changed in the configuration file: for an undeveloped area α = 0.143, built-up area α = 0.27 and urban α = 0.35).
W = A*(H/h)^alpha
Formula (3) calculates the height of the wind turbine’s rotor (the height at which the rotor is located on the wind turbine tower):
where H—height of rotor, radius_of_rotor—radius of the rotor, and w—height coefficient, default value = 2.5 (the usual coefficient used when constructing wind turbines).
H = radius_of_rotor * w
Formula (4) shows how to calculate the wind’s power in Watts based on the wind speed W [in m/s]:
where P—wind power in Watts, Ro—air density ratio = 1.23 [kg/m3], Pi = 3.14, and R—radius of the rotor.
P = 0.5 * Ro * W^3 * Pi * R * R
Formula (5) shows the calculation of wind power in kWh:
where Pf—wind power in kWh.
Pf = P * 24/1000
Formula (6) shows how to calculate R, which is the average performance ratio (it is the product of the Betz limit and yield losses):
where B—Betz limit = 16/27 = 0.59 (default value), Yl—yield losses = 50% (default value), and the default value of Rt = 0.3 (as a product of B*Yl).
Rt = B * Yl
Formula (7) shows the calculation of the generated power, which includes losses (due to technical imperfections of the wind turbine):
where L—power with included losses [kWh], Pf—wind power [kWh], and R—performance ratio.
L = Pf * Rt
Formula (8) shows the calculation of the power generated by the wind turbine (it is the product of the capacity factor and a turbine’s maximum power, including losses):
where C—capacity factor (in relation to angles of attack, turbulences, annual wind distribution, cut in, cut out) = 50% (default value) and Pt—the power which can be generated by a turbine with kWh = L * C.
Pt = L * C
Formula (9) shows the calculation of the revenue from the sale of energy. For the third part of the analysis (break-even prices of onshore wind energy), we used a different approach. The power produced by turbines (wind farms) was calculated as the product of empirical load factors multiplied by the nominal power of these turbines (we used empirical load factors from the year 2016 as an approximation for the analyzed period). In other words, for break-even prices estimation we used Formulas (8)–(27):
where price—the average price assumed in the business plans of wind farms analyzed by us: 0.065 EURO/kWh (1000 × 0.065 EURO/MWh), calculated as the original business plans’ market price + green certificate price. For the third part of the analysis, we calculated the price (break-even price) for which the overall NPV of the wind farm is equal to zero.
Revenues1turbine = Pt/1000 × price
4.1.2. Calculation of the Present Value of the Initial Investment in the Wind Farm
Values used in the simulation concerning the length of the wind farm’s productive life are based on manufacturers’ expected life of wind turbines: 20 years. We assumed that the construction period lasts for another five years (before the wind farm becomes operational):
AverageLifeOfAWindFarm = 20 years (depreciation of turbines)
InvestmentPeriod = the first five years in equal parts of the initial investment
Based on the parameters of wind turbines used in the years 2006–2014 in Poland and the available business plans, we estimated the total investment cost per kW of maximum turbine capacity (for turbines above 1 MW of power, smaller turbines cost approximately 33% less). This approach is used by the International Renewable Energy Agency (IRENA), which provides the annual investment costs per kW of wind energy. Our estimated investment costs were similar to the averages provided by IRENA; however, they were, on average, 23% lower. Table 4 shows IRENA estimates; for our simulation, we took these values decreased by 23% (for wind farms with the power of 1 turbine above 1 MW, for small turbines, we took 67% of the investment cost for large turbines).
Formulas (12)–(14) were used to estimate the depreciation of the wind turbines (the investment period assumed in the calculations lasted five years, which means that we took that the construction of a wind farm lasted on average five years):
DepreciationPeriod = (AverageLifeOfaWindFarm − InvestmentPeriod)
AnnualInvestment1Turbine = Investment1turbine/InvestmentPeriod
DailyDepreciation1turbine = (Investment1turbine/AverageLifeOfAWindFarm)/365
4.1.3. Annual Costs Calculation
Operating costs were estimated based on business plans of wind farms currently operating in Poland and their financial statements. Formula (15) shows how we estimated the tenancy costs (the formula is based on business plans that were available). Based on the data of wind farms, we assumed that tenancy costs were equal to 1000 USD per acre of land, and the area needed is calculated as rotor area × 49/10,000 (square meters required for one turbine and appropriate distance from the next turbine):
AnnualLandTenancy1Turbine = 1000 × (2 × radius_of_rotor × 7) × (2 × radius_of_rotor × 7)/10 000
Formula (16) shows the calculation of the daily local taxes (the formula is based on business plans that were available):
DailyTaxes1Turbine =1% × Investment1Turbine/365
Formula (17) shows the definition of the annual maintenance costs. The model also assumed repair teams that fixed random minor and major failures of wind turbines on top of scheduled maintenance (the formula is based on business plans that were available)
where t—the year of the wind farm’s operation; t = 1, …., 20.
Maintenance(Year1) = 10% of the initial investment.
Maintenance (t + 1) = Maintenance(t) + 1.5%
Random failures of wind turbines were estimated using the data from publications dedicated to running wind farms [1,65] and producer’s data sheets for wind turbines (and business plans of wind farms from this period).
Table 5 shows the estimated probabilities and costs of the 2 MW turbine (for larger turbines, these costs were proportionally higher to the turbine power). Based on the presented data (only type 4 and 5 failures require intervention of the repair team), we assumed that the probability of a minor failure for each turbine is 100%, and its value is 18,800 EURO. For a significant failure, the probability is 10%, and the cost of such a repair is 188,245 EURO.
Formula (18) shows the calculation of the daily management and supervision costs. All the estimates represent values from the financial statement and agree with other publications and business plans analyzed by us (median) [52,53,54,66,67,68,69]. In the same way, we calculated daily insurance costs and daily energy balancing costs:
where ManagRate—estimated rate of supervision costs as a function of energy produced in kWh, assumed to be 0.6 [EURO/MWh] (constant 2019 prices).
where InsuRate = 1.0 EURO/MWh (default value), which is the estimated rate of insurance costs [USD/kWh].
where EnergyBalaRate = 4.25 EURO/MWh.
DailyManagementAndSupervisionCost1Turbine = Pt/1000 × ManagRate/365
DailyInsuranceCost1Turbine = Pt/1000 × InsuRate/365
DailyEnergyBala = Pt/1000 × EnergyBalaRate/365
Formula (21) presents how a subtotal of the daily costs of a wind farm should be calculated. It is a sum of all previous daily costs:
SubtotalDailyCosts1Turbine = AnnualLandTenancy1Turbine/365 + DailyTaxes1Turbine + DailyRepairs1Turbine + DailyManagementAndSupervisionCost1Turbine + DailyInsuranceCost1Turbine + DailyEnergyBalancingCost1Turbine
Formula (22) shows the calculation of daily own energy consumption of one turbine (based on business plans):
DailyOwnEnergyConsumptionCost1Turbine = SubtotalDailyCosts1Turbine × 2.7%
Formula (23) shows the formula for other operating costs of a wind farm. We calculated it as a percentage of the total operating costs from Equation (21) (we used business plans to estimate this percentage factor of 3%):
OtherCosts1Turbine = SubtotalDailyCosts1Turbine × 3%
Total daily costs of one turbine were calculated as the sum of all operating costs. The net financial result (DailyResult1Turbine) is the difference between daily revenues and total operating costs. Finally, Equation (24) shows the calculation of the free cash flows:
where IncomeTaxRate = 19% (default value).
FCFFon1Turbine = DailyResult1Turbine × (1 − IncomeTaxRate) + DailyDepreciation1Turbine
4.1.4. Calculation of the Net Present Value
The calculation included costs of maintenance and all necessary repairs. We distinguished between two cases—a small failure and a big failure. Costs depended on the size of the wind turbine. They were calculated based on the producer’s statistics and costs of parts (the costs of repair teams were estimated based on labor hours; we took twice the average salary in Poland). To calculate the net present value of cash flows, we used the FCFF approach; we applied adjusted discount factors for daily values. The discount formula is as follows:
where currentYear—he year for which wind is simulated, baseYear—the initial year of the simulation, and annualCostOfCapitalInRealTerms—the cost of capital = 10%.
The present value calculation method for the investment outlays assumed a five-year construction period, and it is given in Formula (26). It is the formula for the present value of the investment outlays:
PV (InvestmentOutlays) = (−1) × Investment1Turbine/InvestmentPeriod × (1 − 1/(1 + AnnualCostofCapitalinRealTerms)^InvestmentPeriod)/(AnnualCostOfCapitalinRealTerms)/(1 + AnnualCostOfCapitalInRealTerms)^(AverageLifeOfaWindFarm − InvestmentPeriod)
Finally, Formula (27) shows the net present value calculation for every wind turbine:
NPV = PV (InvestmentOutlays) + sum of all PV (CFI)
4.2. Estimation for the Break-Even Price of Energy for the Existing Wind Farms in Poland Established in 2006–2014
For the calculations, we used the Formulas (6)–(21) presented earlier. The amount of energy produced was obtained from daily data for one year published at https://www.thewindpower.net/ (accessed on 10 January 2021) (where the exact types of turbines used in a given location are also given). Then, we calculated for which level of NPV energy prices for these farms would be 0.
5. Results
We illustrated the results of the simulation in Table 6. Every row represented results for a different meteorological measurement point in Poland. We simulated the wind farm for 5, 10, and 15 wind turbines. All turbines were assumed to run on default values described in the paper. The columns of Table 6 include the average and median wind force in the analyzed period, the standard deviation of the wind force from the average value, the name of the city and province where the measuring point is located, and three NPV values measuring the profitability of the potential farm if it were to be built in the area covered by the wind force measurement. The NPV1 column shows the investment result for a farm of five turbines, the NPV2 column shows the investment result for a wind farm with 10 turbines, and the NPV3 column shows the investment result for a farm with 15 turbines. Calculations were repeated for the real cost of capital of 5%, 7%, and 10%.
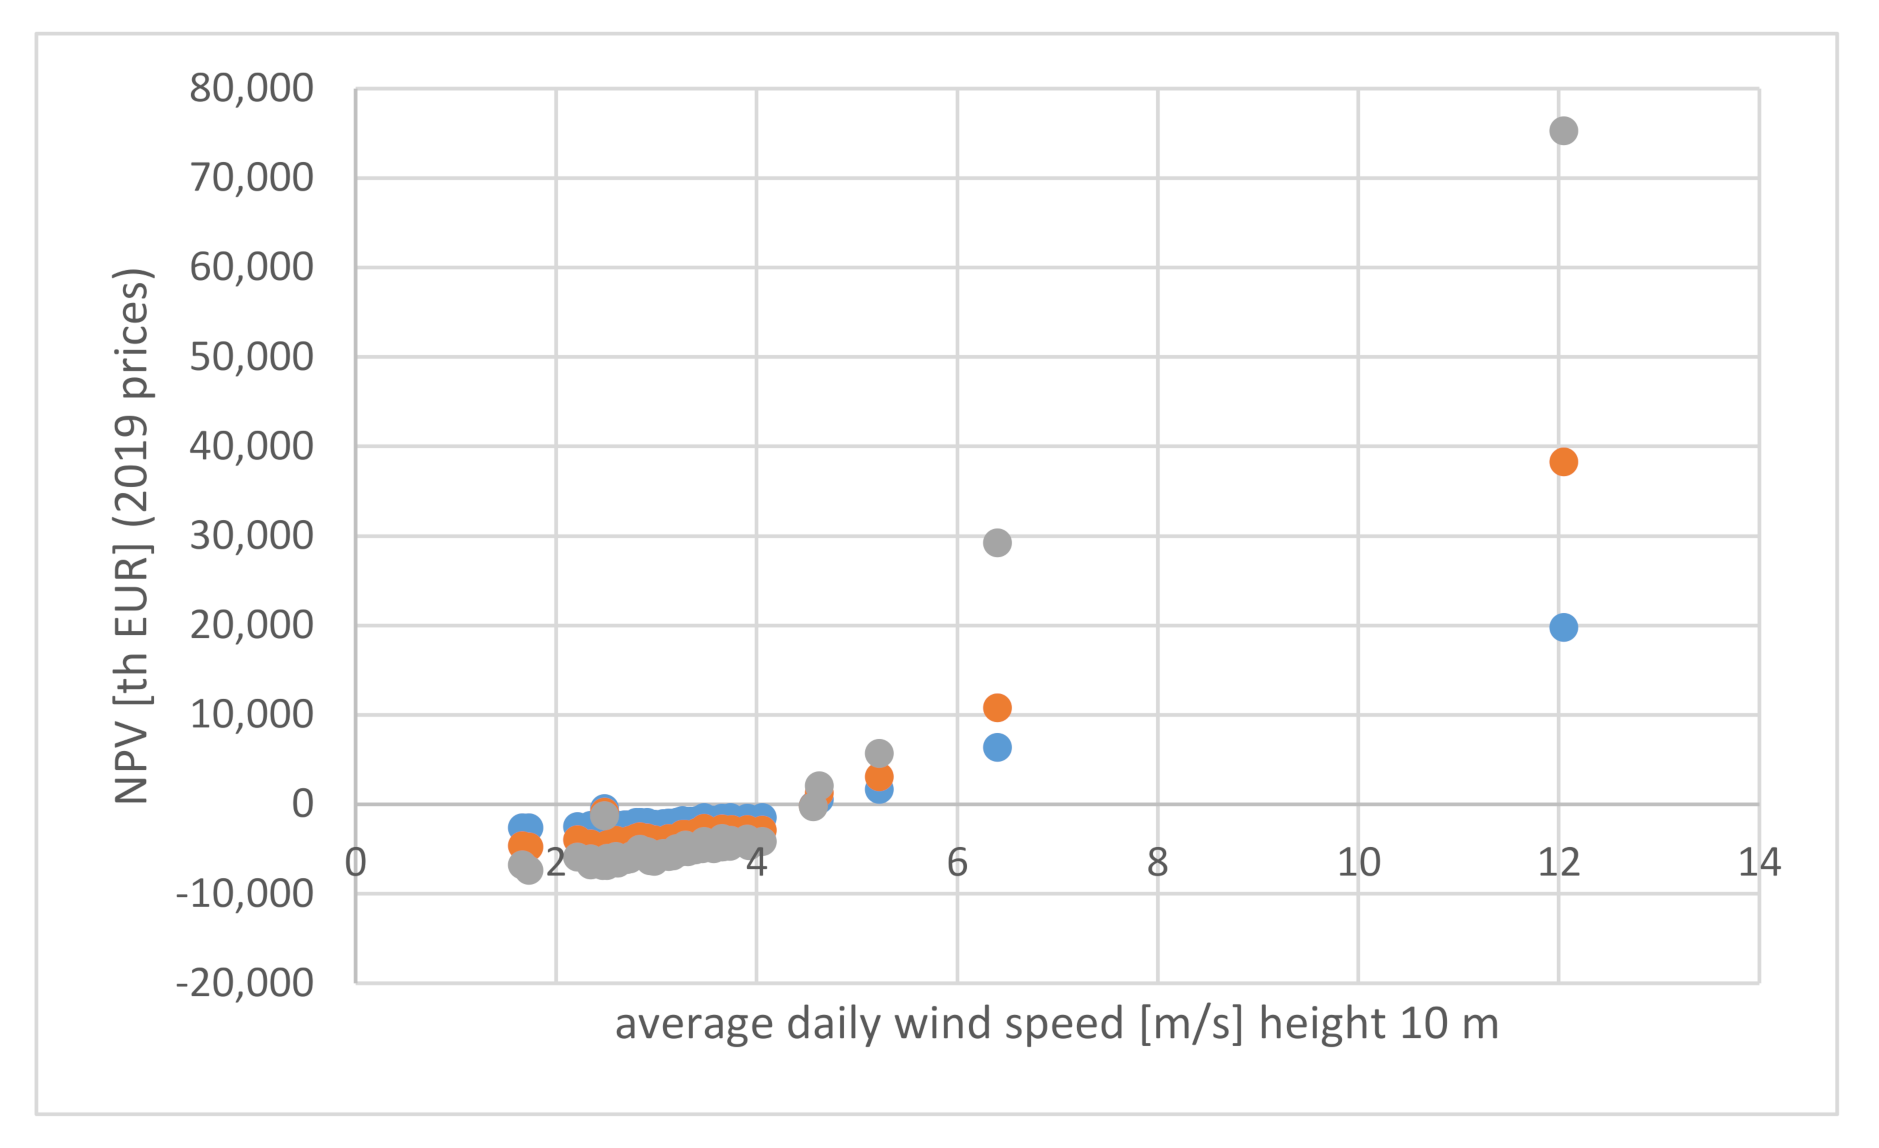
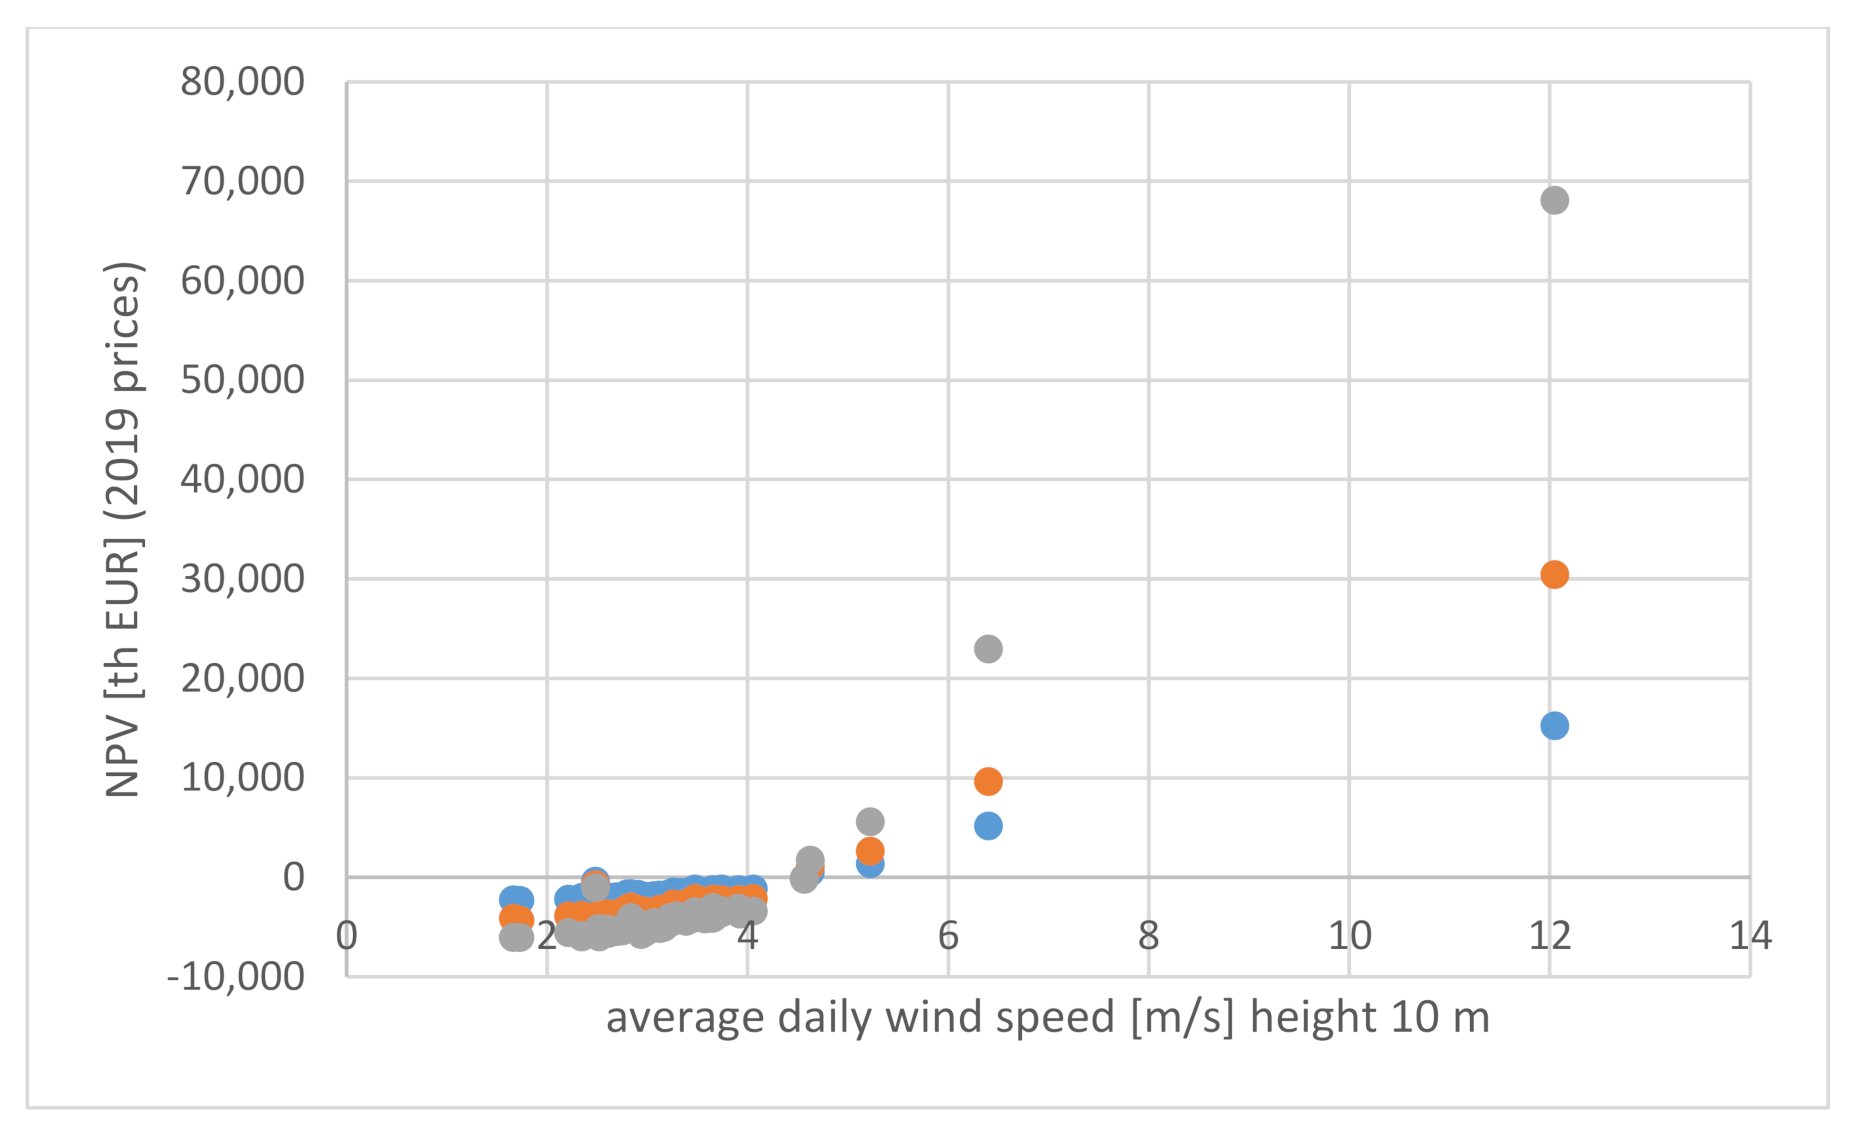
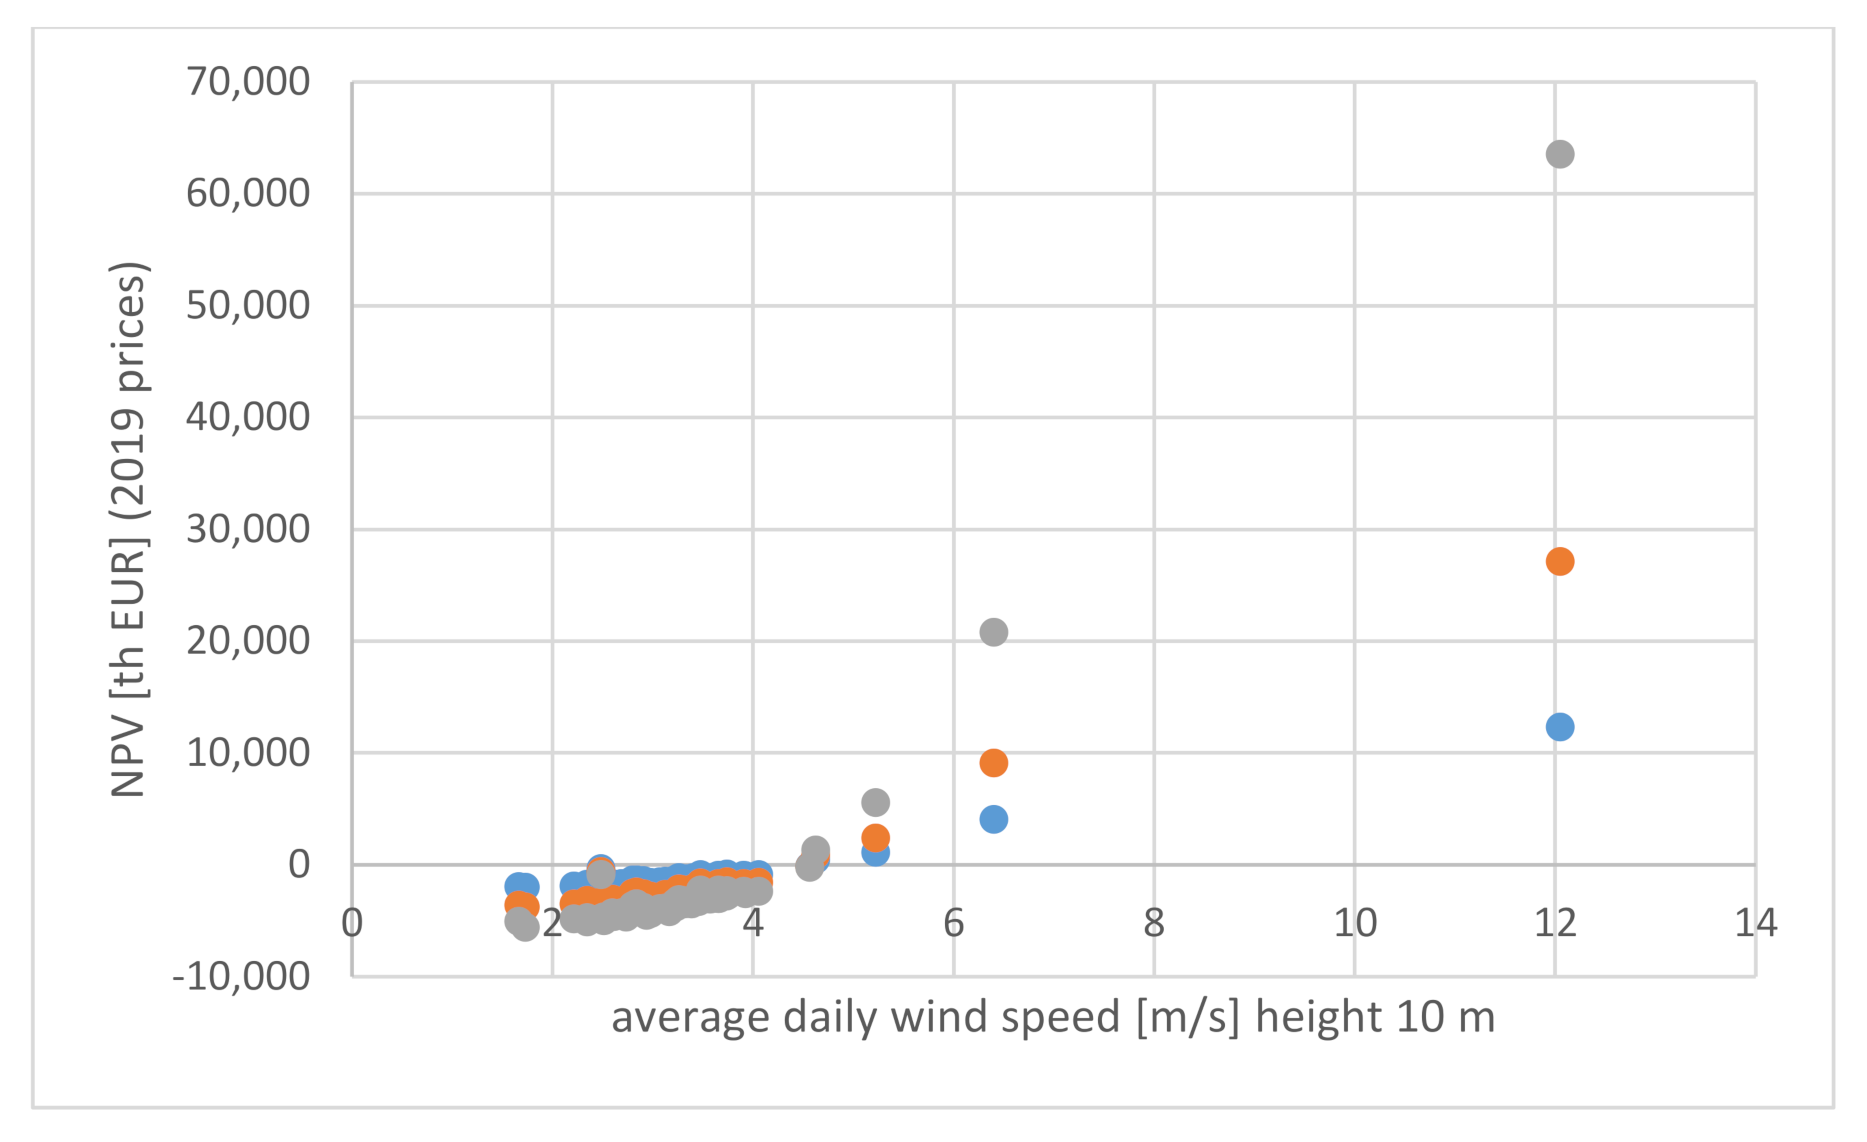
As illustrated in Figure 1, Figure 2 and Figure 3, at energy prices of 0.065 EURO/kWh (total price of green energy) assumed in business plans of the analyzed wind farms, the minimum average wind speed necessary for a wind farm to pay back on its initial investment was 4.3 m/s at the height of 10 m. After the recalculation to 100 m towers, the average wind speed is equal to 6 m/s. In reality, in recent years, the problem has been that green energy prices fell significantly below this limit (see Table 2). Table 7, Table 8 and Table 9 show the final results of the simulation for 3 different discount rates: 5%, 7% and 10%. Figure 4, Figure 5, Figure 6, Figure 7, Figure 8 and Figure 9 illustrate graphically the results presented in Table 7, Table 8 and Table 9.
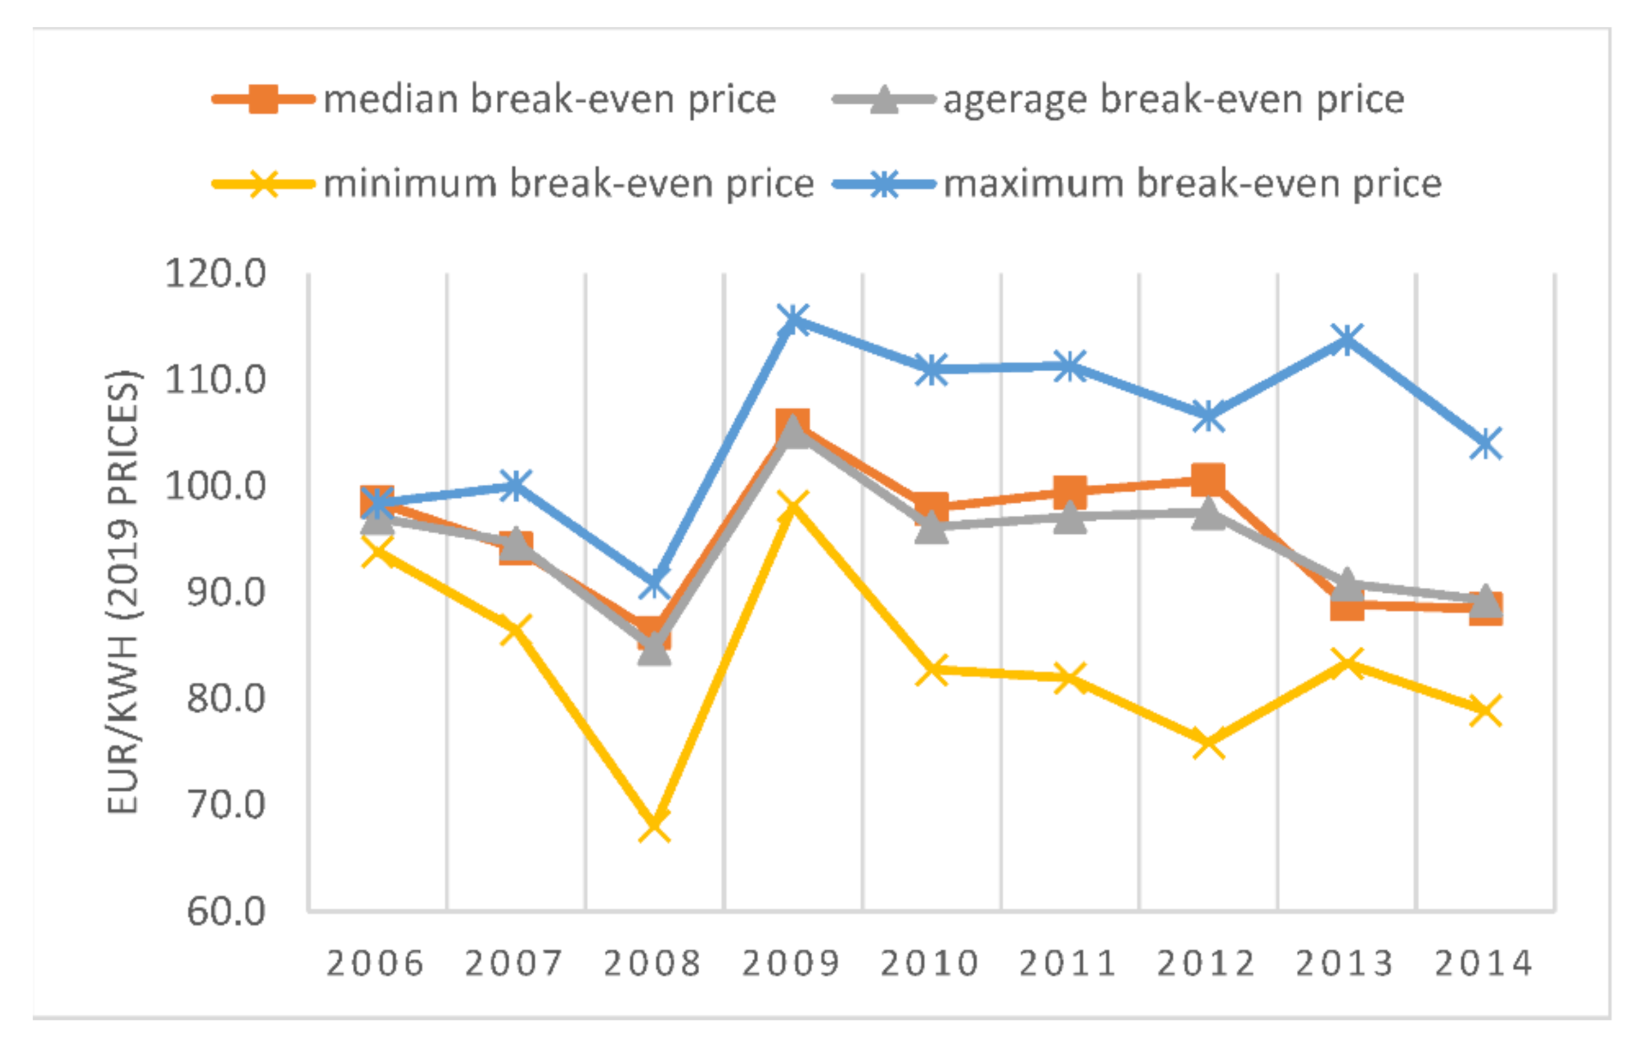
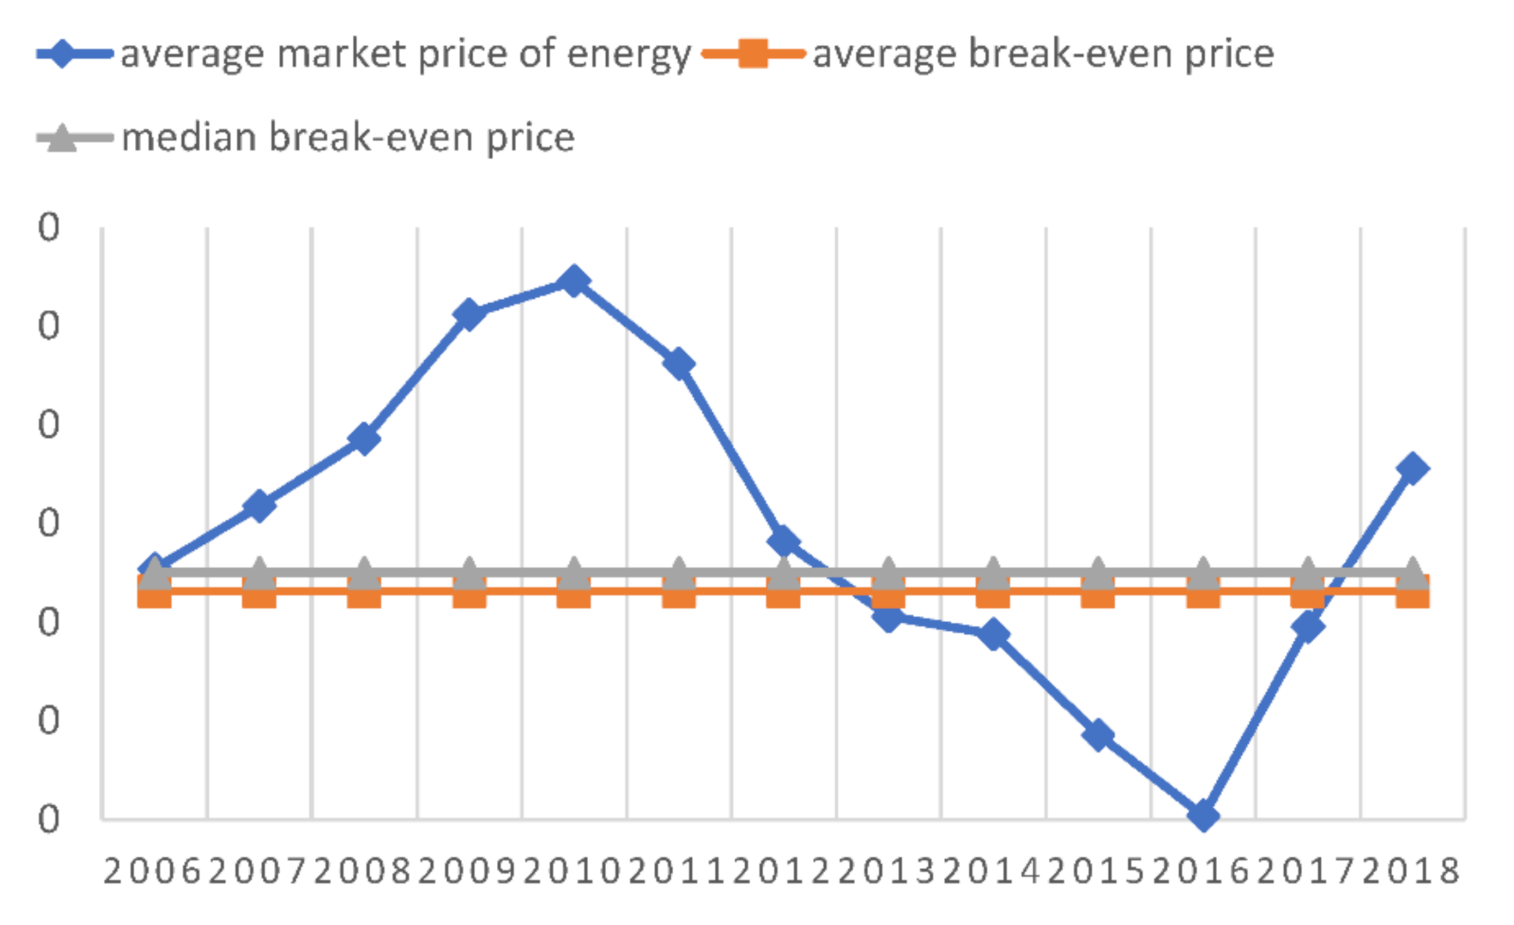
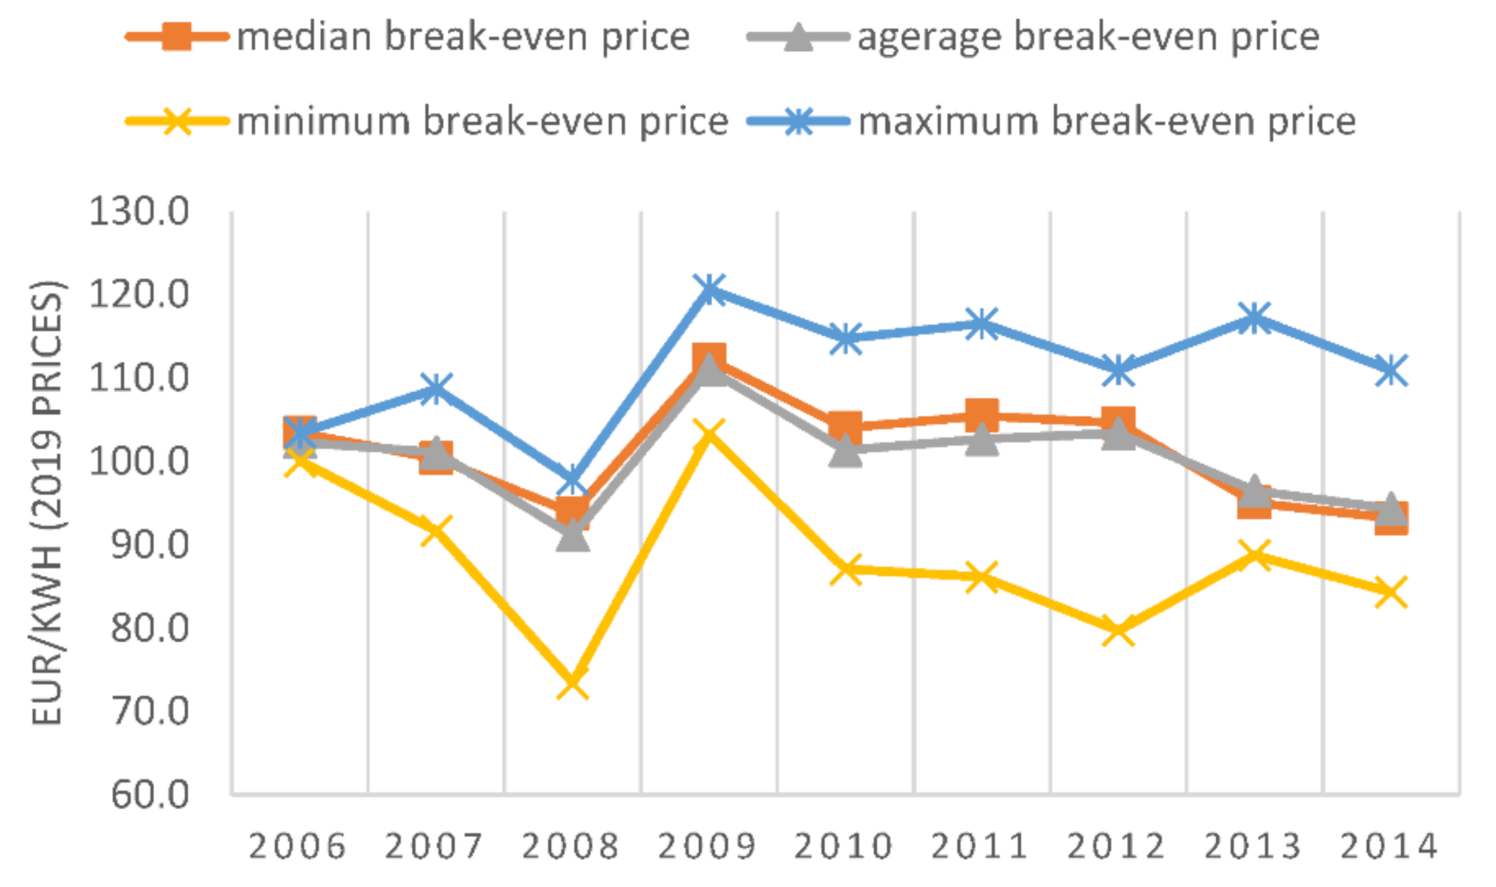
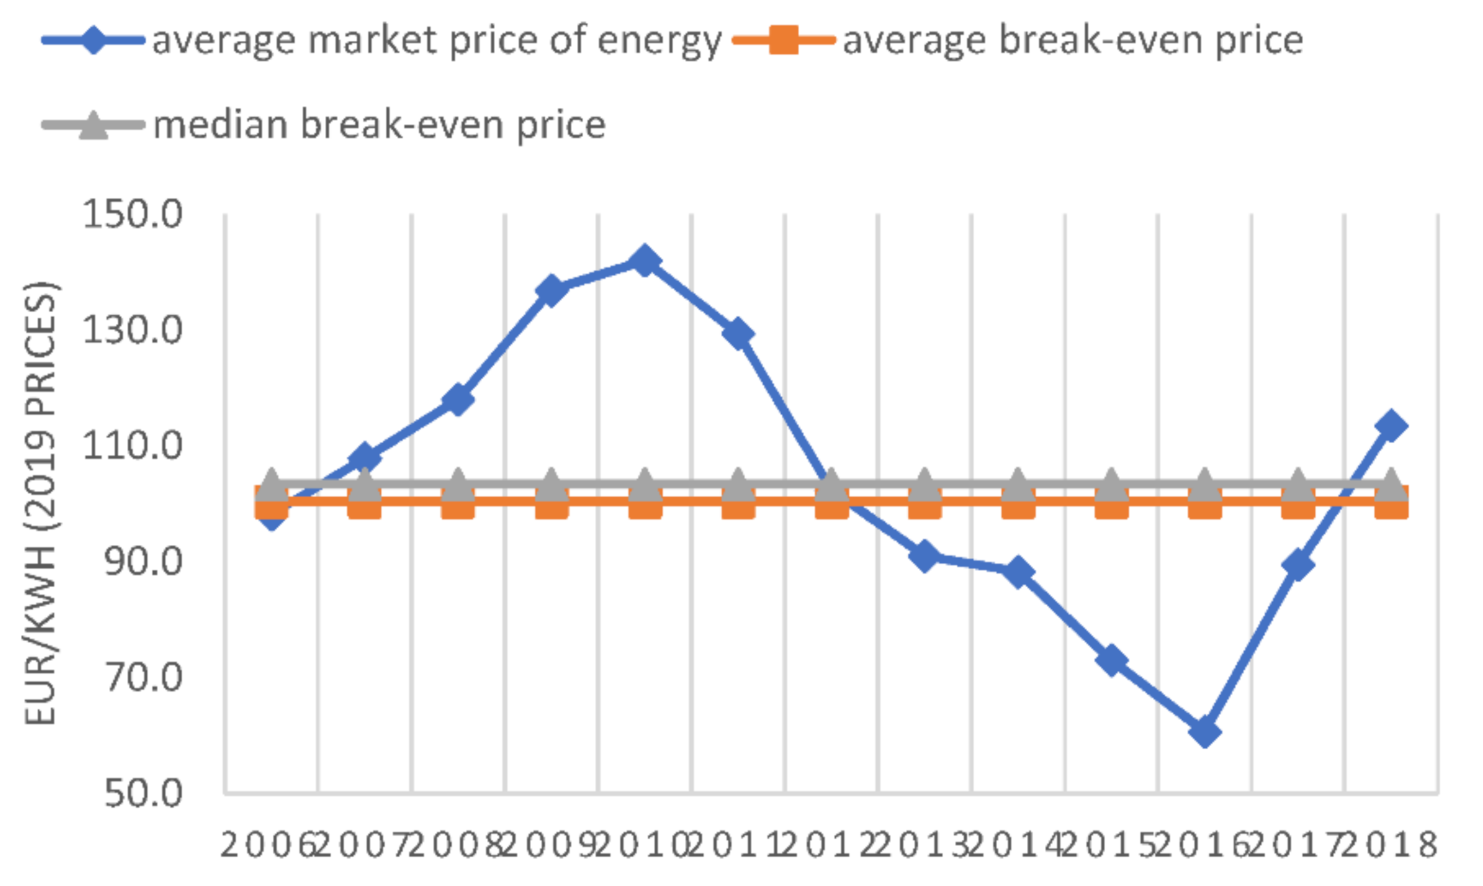
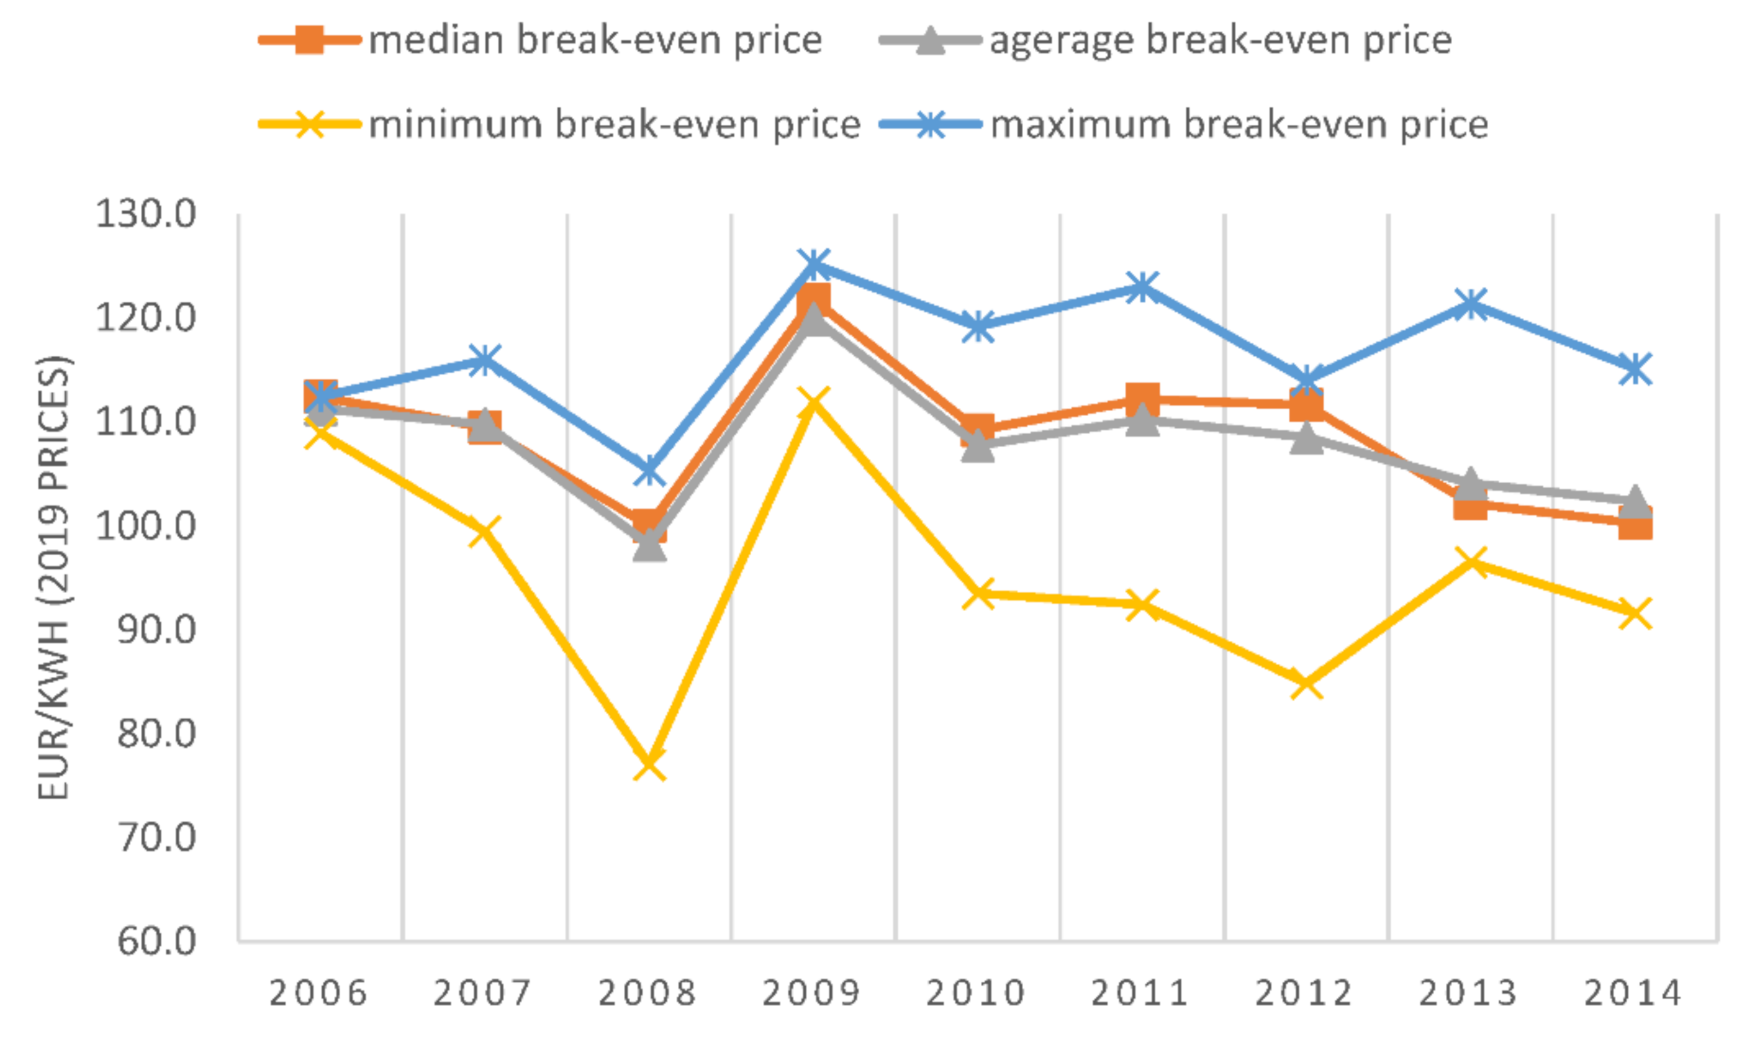
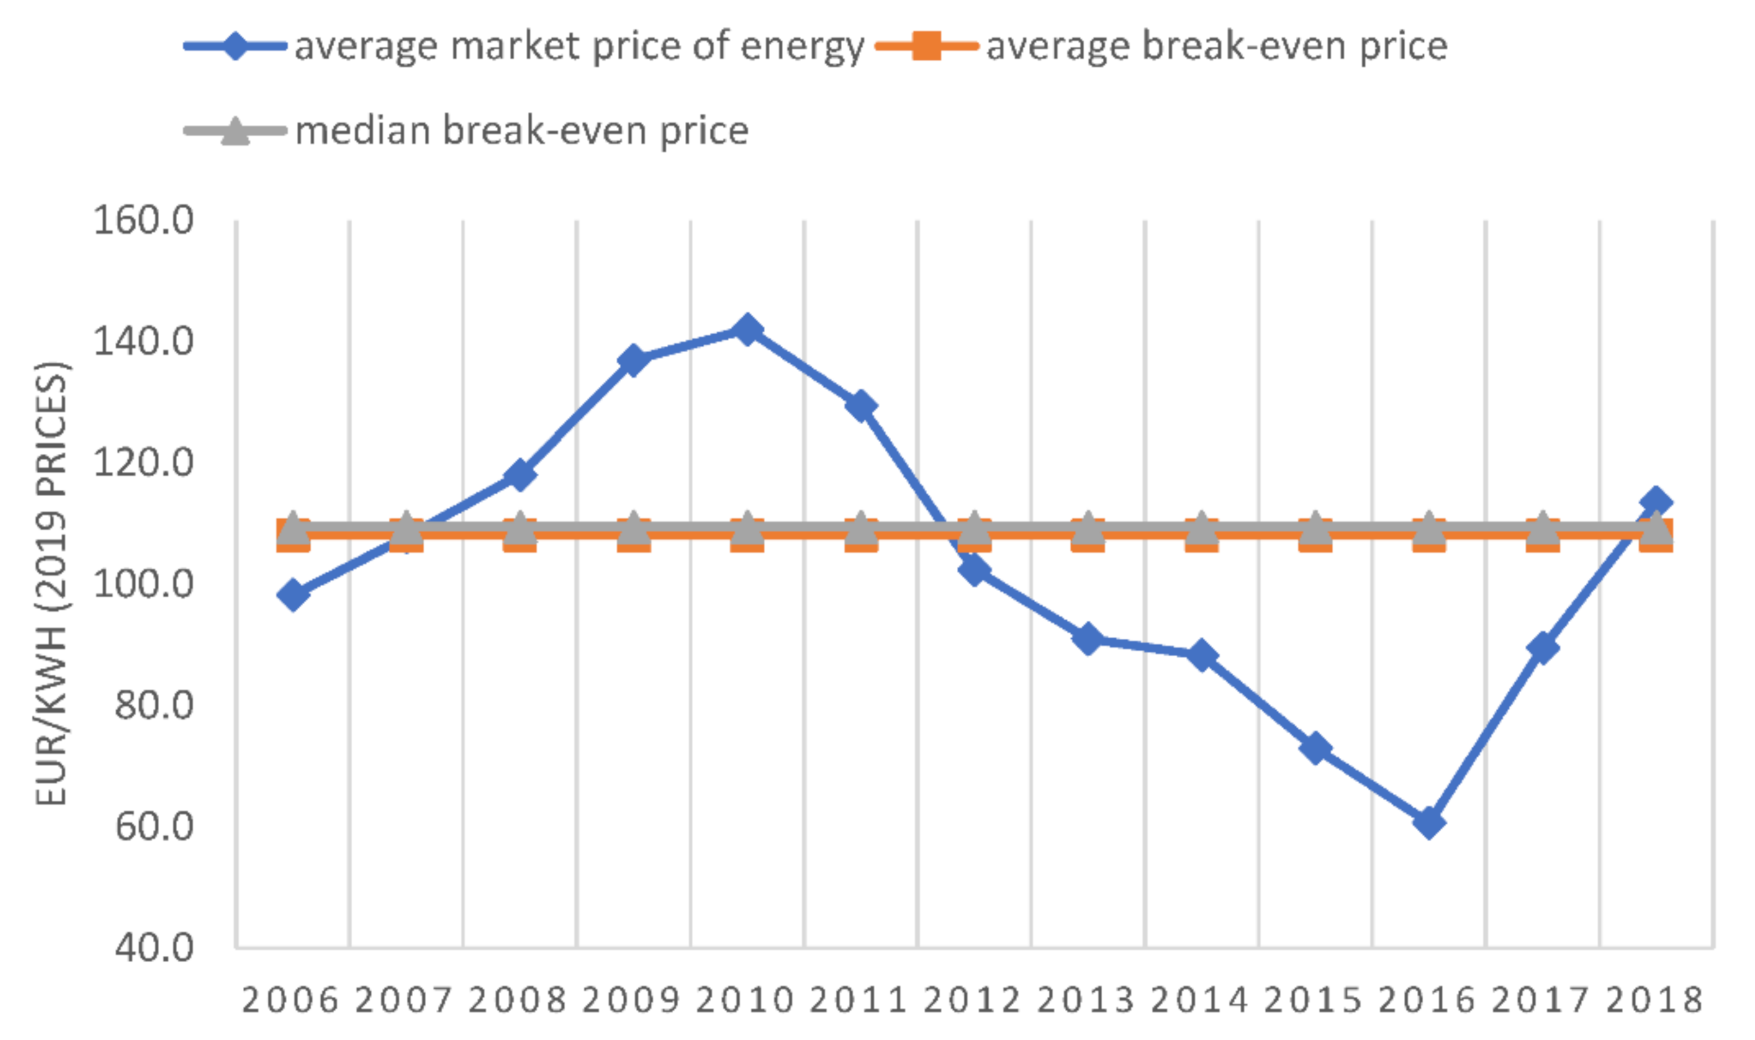
As it can be seen from Table 7, Table 8 and Table 9and Figure 4, Figure 6, and Figure 8, the average NPV break-even price for all analyzed years fell in the range of 94.7–108.4 EURO/MWh—(2019 prices, depending on the discount rate). The median break-even price was found to range from 94.7 to 109.75 EURO/MWh (depending on the discount rate). Let us compare these prices with Figure 5, Figure 7, and Figure 9. It is evident that starting from 2012, the average break-even prices of the analyzed farms were higher than the average market prices of energy (including green certificates). This may explain the poor financial performance of wind farms in Poland.
6. Discussion and Conclusions
In Poland, similarly to other emerging markets (and developed economies) in the EU, there is an extensive discussion about the level of government support that should be offered to wind farms. The results of this simulation demonstrate that for the majority of locations in Poland for which we accessed data, energy prices in recent years (including green certificates) were not sufficient to achieve payback on the initial investment for the currently operating wind farms established in 2006–2014. After introducing the auction system in 2015 [69], 1/3 of the farms which initially participated in the green certificates scheme won the auctions, left the green certificates system, and received price guarantees for the next 15 years, but 2/3 of them will remain on the green certificates scheme.
Practitioners indicate that these farms assumed in their business plans energy prices (including green certificates) at levels in the range 96–109 EURO/MWh (in 2019 prices). This is confirmed by our simulation, as the bare break-even prices (but for the entire investment project, not only for non-negative operating profit, for a very long period of 20 years) that we derived were in the range of 68–125.4 EUR/MWh (in 2019 prices).
In our calculations, we assumed that wind farms did not receive any financial support except for green certificates and that they did not have contracted prices with any power plant (we did not find any information on how many farms participating in the green certificate scheme had contracts with a fixed price for the sale of energy and certificates to electricity suppliers, in the case of a lack of such contracts, the legal system in Poland at the time did mandate the mandatory purchase of renewable energy, but at prices set by the President of the ERO based on market prices). In general, the simulation confirmed that old wind farms operating in the green certificates scheme might have financial problems if the average market energy prices decrease below 108.25 EUR/MWh (0.065 EURO/kWh, 2019 prices).
The Polish government has solved the problem of bankruptcy risk of old wind farms by adjusting the green certificates quotas, which (at least partially, because this process of reducing oversupply continued in 2019) removed the oversupply from the market and eventually increased the prices of wind energy. However, the continuing oversupply shows that the supervision over this market is rather ineffective.
The paper concludes that, perhaps, wind technology achieved a point where its LCOE is lower than that of conventional power plants [70], but this does not apply to old-generation wind farms, as we showed in the paper. We also doubt whether small prosumer wind turbines can break even without receiving support (no economies of scale or scope effects, inferior technology, poorer access to energy auctions, etc.). Therefore, constant supervision of their financial situation and regulations on this market are necessary [71].
Our simulation suggests that no one could have expected 15 years ago how much the energy costs would drop in the future. Now, we have to expect the same situation to be repeated in the future. IRENA [12] projections show that by 2030, the initial investment for onshore farms will drop to (in 2019 prices) 1070 EURO/kW, and the energy prices from the current 0.065 EURO/kWh will decline to 0.04 EURO/kWh in 2030. Theoretically, the auction system guarantees the financial safety of new wind farms. Still, dramatic changes in the legal procedures, foreign exchange rates, and technology require supervision to determine whether financial support is adequate.
Author Contributions
Conceptualization, J.W., Ł.P., and M.D.; methodology, J.W., Ł.P., and M.D.; formal analysis, J.W. and Ł.P.; investigation J.W., Ł.P., and M.D.; resources, J.W. and Ł.P.; data curation, J.W., Ł.P., and M.D.; writing—original draft preparation, J.W., Ł.P., and M.D.; writing—review and editing, J.W., Ł.P., and M.D.; visualization, J.W.; supervision, J.W. and M.D.; project administration, J.W., Ł.P., and M.D.; funding acquisition, M.D. All authors have read and agreed to the published version of the manuscript.
Funding
This research was funded by the National Science Centre, Poland. Program OPUS, grant No. 2018/31/B/HS4/00485 (Economic aspects of low carbon development in the countries of the Visegrad Group) and the Ministry of Science and Higher Education within the subsidy awarded to the Cracow University of Economics (Poland).
Institutional Review Board Statement
Not applicable.
Informed Consent Statement
Not applicable.
Data Availability Statement
The datasets used and analyzed during the current study are available from the corresponding author on reasonable request.
Conflicts of Interest
The authors declare no conflict of interest.
Appendix A
State Diagrams for the Behavior of Different Processes.
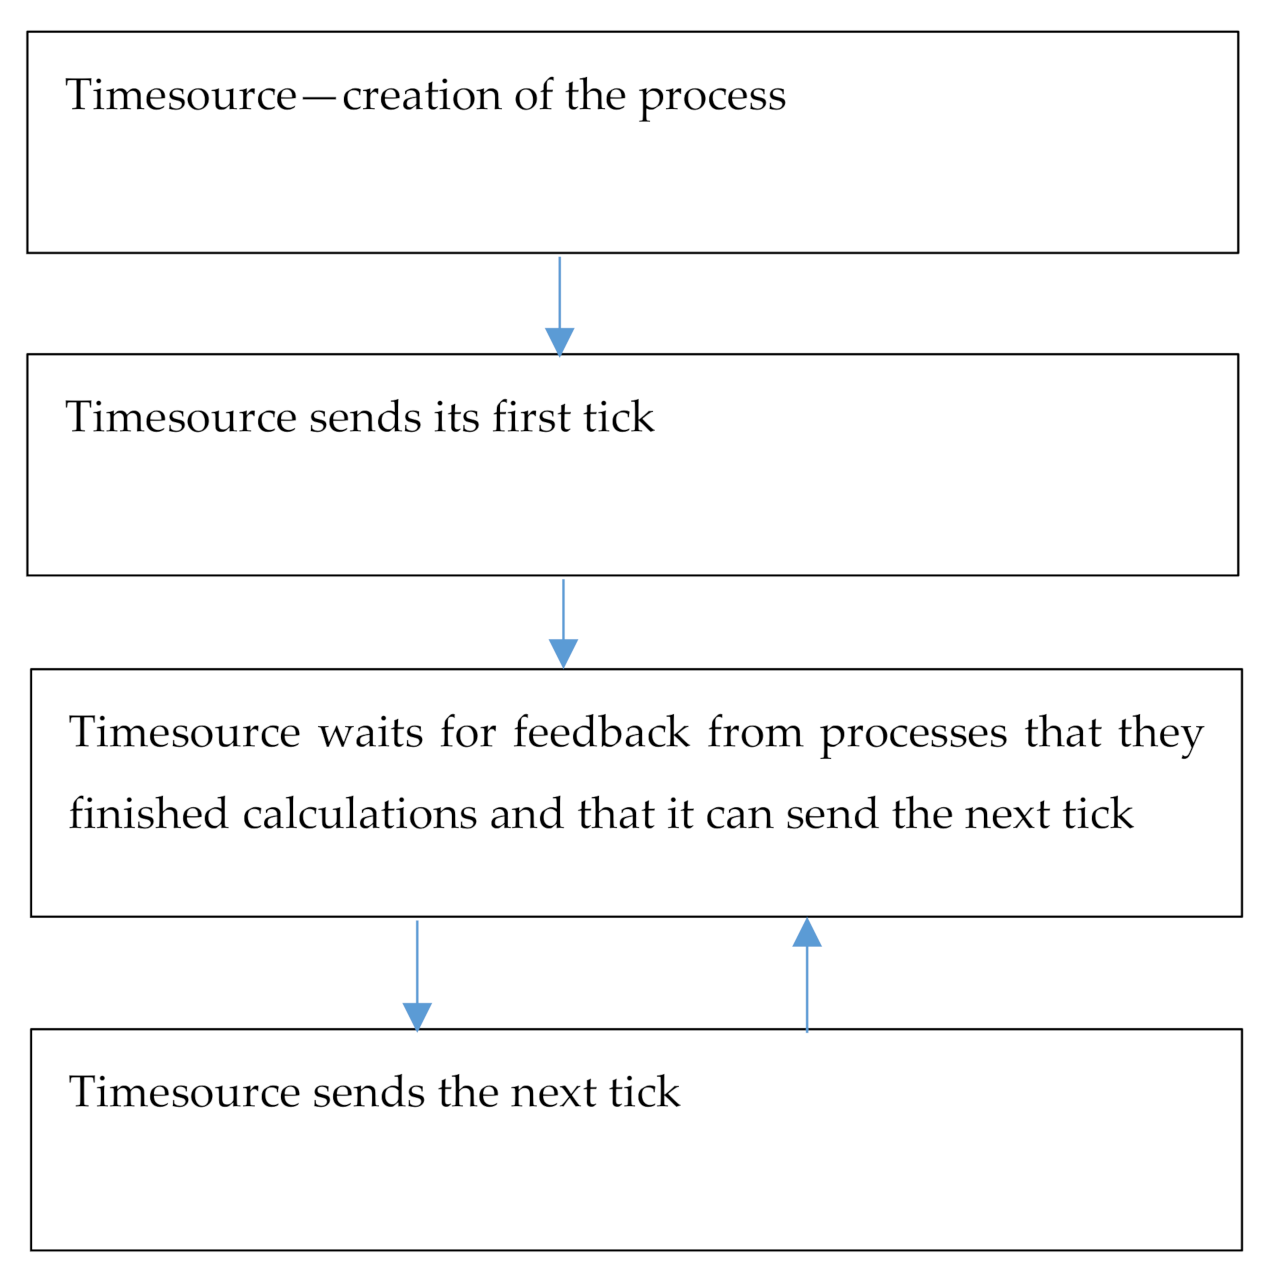
Figure A1.
Diagram of statuses for the “TimeSource” process.

Figure A2.
Diagram of statuses for the “Dispatcher” process.

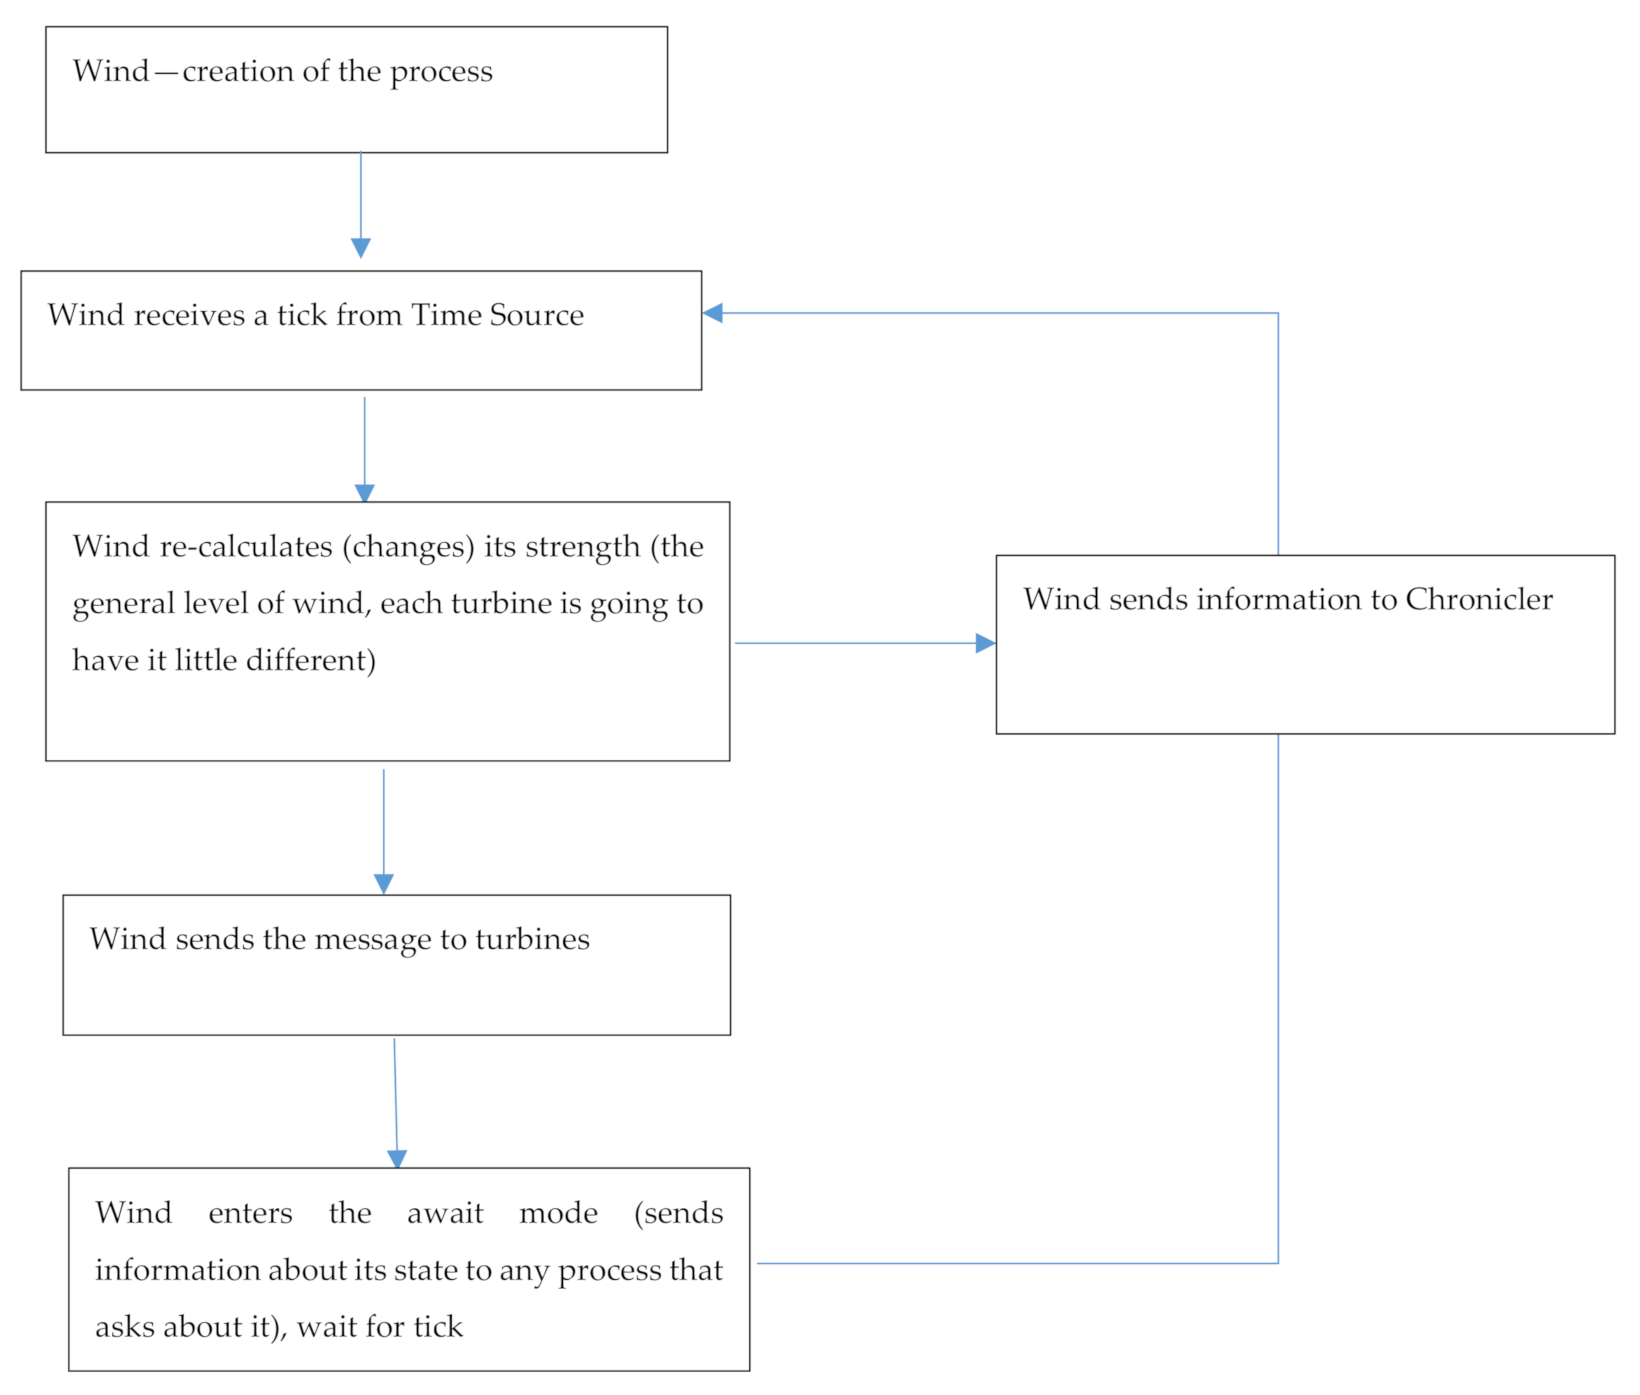
Figure A3.
Diagram of statuses for the “Wind” process.

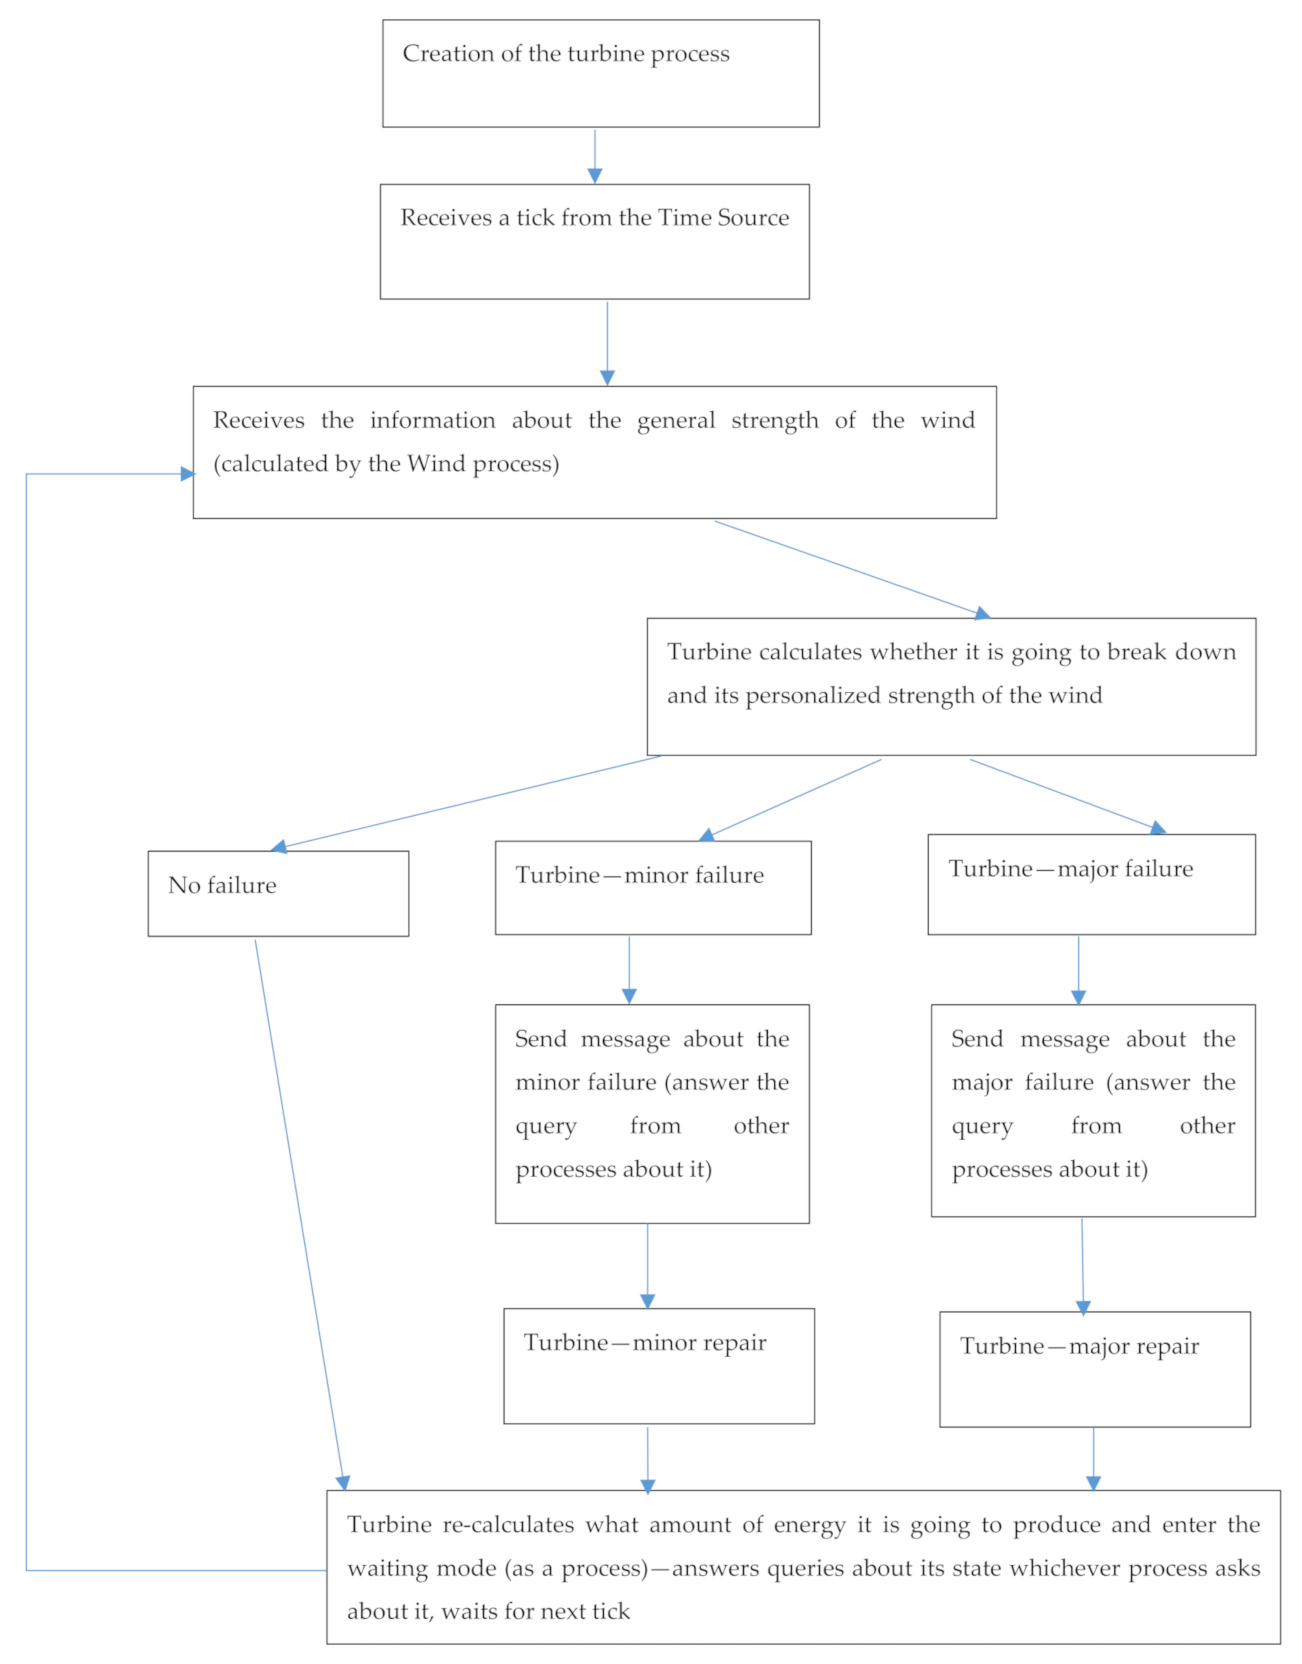
Figure A4.
Diagram of statuses for the “Turbine” process.

Figure A5.
Diagram of statuses for the “Repair team” process.

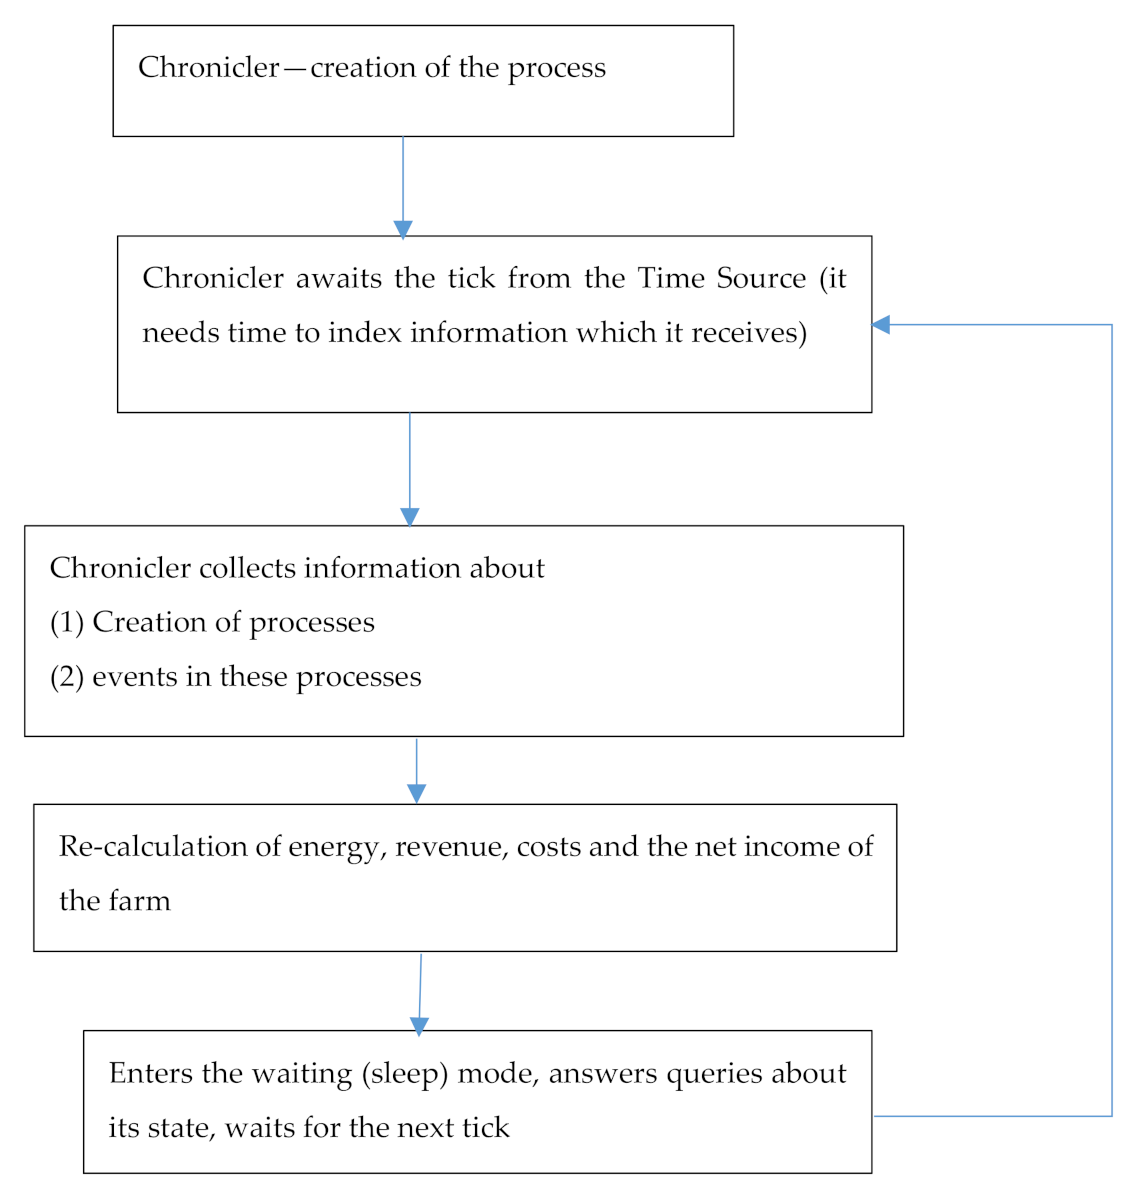
Figure A6.
States diagram for the “Chronicler” process.

Appendix B
Every process in the simulation runs concurrently with other processes. The Erlang programming language allows for a straightforward implementation of concurrency. Below, we briefly described the organization of the code, which was divided into files.
-> actor.erl—actor represented any processes used in the simulation. Every actor could receive and send messages. There were two types of messages, one was the query and received answer concerning the status of the actor, and the second type was event processing.
-> breakdown.erl—the file included mostly functions which calculated the probability of the minor and major failure of the turbine.
-> chronicler.erl
- the file uploaded the inputs of the model into memory (concerning the behavior of actors).
- it runs the loop with a function which reads messages from actors and collects information; there is a list of possible events and reactions to each one.
-> constants.erl—file where the user can set values of the input variables.
-> dispatcher.erl
- the file contains functions which decide when the repair teams should go and where to go (to which turbine), collect events and locations of repair teams and turbine states, decide when the teams should move and where to, collect events and locations of repair teams and turbine states, and send messages to repair teams where they should go (to which turbine).
- dispatcher functions collect and save a big part of messages from actors (receives it).
-> events.erl
- this file contains functions which create and manage the array which keeps records about events (registers what the actors do).
- in this file, there is a description of who sends and who collects various messages.
- it defines functions which create multiple messages.
- it is a library for actors to send messages.
-> general.erl
- the file “general” contains general functions that did not match other libraries.
- it re-calculates time and distances.
-> model.erl
- it runs the entire simulation, spawns actors and processes.
- is activates actors, which depending on its type use functions from other modules.
-> shared.erl
- keeps shared global variables in the table (array).
- it takes values and puts them there.
- a library of functions, used by other processes.
-> teams.erl
- functions used by the Repair Teams processes.
- this library contains all functions connected with the operation of repair teams.
- it works/operates in a loop: it collects calls for repair teams, in the meantime, it communicates with Dispatcher and turbines.
-> timesource.erl
- functions used by Time Source process.
- it searches the table (array) called “event,” and when it finds the closest event, it moves the time of the simulation to this moment and sends a message about this event to the actors.
-> turbines.erl
- functions used by Turbine processes.
- it works in a loop: it changes statuses between working, failure (Time Source sends message to the turbine), communication with Dispatcher and Repair Team.
- this library contains a function which calculates the next failure, information is sent to the table (array) “events” which is managed by the dispatcher.
-> wind.erl
- describes functions used by the wind.
- data from the wind strength function are used to calculate how much the turbines have earned.
- The Time Source process sends the signal to the Wind process that the wind should change.
- the Wind process saves the wind strength in “events.”
- the Time source reads this information and sends a message to the Wind process that it has to change.
Appendix C

Table A1.
The number of available financial reports of wind farms in 2009–2017 in selected EU countries, Canada, and the USA [43].
Table A1.
The number of available financial reports of wind farms in 2009–2017 in selected EU countries, Canada, and the USA [43].
| Country | Total no. of Wind Farms in 2017 | Number of Available Financial Statements by Year and Country | ||||||||
|---|---|---|---|---|---|---|---|---|---|---|
| 2009 | 2010 | 2011 | 2012 | 2013 | 2014 | 2015 | 2016 | 2017 | ||
| Austria | 283 | 1 | 4 | 6 | 4 | 4 | 4 | 8 | 6 | 3 |
| Belgium | 275 | 17 | 24 | 25 | 27 | 31 | 35 | 40 | 41 | 42 |
| Bulgaria | 77 | 5 | 5 | 28 | 28 | 28 | 22 | 22 | 24 | 21 |
| Croatia | 25 | 8 | 6 | 6 | 8 | 9 | 10 | 10 | 11 | 13 |
| Czech Rep. | 91 | 7 | 9 | 9 | 9 | 9 | 8 | 9 | 9 | 5 |
| Denmark | 3258 | 11 | 18 | 25 | 24 | 181 | 196 | 198 | 200 | 201 |
| Estonia | 40 | 12 | 11 | 11 | 10 | 8 | 9 | 14 | 14 | 11 |
| Finland | 225 | 13 | 15 | 22 | 28 | 51 | 57 | 70 | 54 | 48 |
| France | 1394 | 364 | 392 | 398 | 396 | 372 | 367 | 381 | 404 | 397 |
| Germany | 8528 | 70 | 78 | 109 | 121 | 136 | 129 | 147 | 131 | 28 |
| Greece | 252 | 17 | 22 | 22 | 14 | 16 | 12 | 8 | 11 | 3 |
| Hungary | 50 | 49 | 45 | 66 | 58 | 47 | 50 | 50 | 46 | 39 |
| Ireland | 276 | 11 | 7 | 7 | 7 | 8 | 14 | 22 | 22 | 13 |
| Italy | 646 | 241 | 289 | 286 | 291 | 283 | 311 | 316 | 302 | 243 |
| Latvia | 34 | 3 | 26 | 31 | 33 | 34 | 33 | 33 | 31 | 33 |
| Lithuania | 74 | n.a. | 1 | 1 | bd | 2 | 3 | 3 | 2 | n.a. |
| Netherlands | 723 | 14 | 18 | 12 | 13 | 13 | 11 | 9 | 3 | 2 |
| Poland | 330 | 57 | 91 | 114 | 128 | 165 | 172 | 178 | 105 | 32 |
| Portugal | 446 | 92 | 92 | 87 | 74 | 82 | 90 | 88 | 90 | 85 |
| Romania | 108 | 32 | 47 | 52 | 49 | 43 | 42 | 38 | 39 | 6 |
| Slovakia | 3 | n.a. | n.a. | 1 | 1 | 1 | 1 | 1 | 1 | 1 |
| Slovenia | 4 | n.a. | 1 | 1 | 1 | 2 | 2 | 2 | 3 | 4 |
| Spain | 1157 | 189 | 183 | 160 | 163 | 172 | 178 | 189 | 176 | 151 |
| Sweden | 1100 | 243 | 267 | 344 | 365 | 405 | 408 | 417 | 415 | 391 |
| United Kingdom | 1088 | 91 | 125 | 146 | 168 | 187 | 203 | 245 | 243 | 239 |
| Total | x | 1547 | 1776 | 1969 | 2020 | 2289 | 2368 | 2499 | 2384 | 2012 |
| Canada | 344 | n.a. | 14 | 13 | 11 | 11 | 11 | 11 | 8 | 7 |
| USA | 1618 | n.a. | 29 | 27 | 31 | 32 | 32 | 32 | 31 | 28 |
Table A2.
Average return on equity for wind farms in 2009–2017 in selected EU countries, Canada, and the USA (in%) [43].
Table A2.
Average return on equity for wind farms in 2009–2017 in selected EU countries, Canada, and the USA (in%) [43].
| Country | 2009 | 2010 | 2011 | 2012 | 2013 | 2014 | 2015 | 2016 | 2017 |
|---|---|---|---|---|---|---|---|---|---|
| Austria | −3 | 0.2 | 12.3 | 21.6 | 6.7 | 4.4 | 4 | −1.9 | 8.7 |
| Belgium | 11.6 | −24.5 | −7.4 | 24.7 | 16.5 | 1.7 | −4.9 | 5.8 | 20 |
| Bulgaria | 13.4 | 5.5 | −0.9 | 0.2 | −5.8 | −33 | 20.7 | 7 | 8.1 |
| Croatia | −30.9 | −22.8 | −33.7 | −38.8 | −21.8 | 3.8 | −2 | 16.4 | 2.4 |
| Czech Republic | 9.2 | 6.5 | 12.3 | 11.7 | 6.4 | 12.8 | 26.9 | 0.7 | 17.8 |
| Denmark | 15.3 | 20.2 | −10.2 | −0.1 | 4.6 | 4.7 | −12.2 | −21.8 | 10.3 |
| Estonia | −22.7 | 7.3 | 9.5 | 25.1 | 6.2 | 10.3 | 9.2 | 11.8 | 11.3 |
| Finland | −17 | −3.8 | 25.5 | −67 | −27.1 | −19.5 | −50.1 | −47.9 | −12.6 |
| France | −56.9 | −66.9 | −36.7 | 5.9 | -1.4 | 3.3 | 16.7 | −17.6 | −11.2 |
| Germany | −26.4 | −24.1 | 0.2 | −0.4 | 3.9 | −2.3 | 7.6 | 5.6 | 9.3 |
| Greece | −34.1 | −20.1 | −6.8 | 6.5 | −5.9 | 3.5 | 8.3 | −5.5 | 13.5 |
| Hungary | −69.7 | −5.8 | −27.7 | 30.2 | 5.5 | −31.2 | −24 | −13.1 | −3.8 |
| Ireland | 56.7 | −10.1 | 23.3 | 38.6 | 53.9 | 15 | 18.4 | −8.2 | 56.9 |
| Italy | −51.8 | −45 | −41.1 | −22.4 | −25.3 | −19.7 | −37 | −12 | −9.7 |
| Latvia | 20.6 | −22.3 | −20.9 | 28.6 | −30.3 | 1.4 | −36.3 | 3 | −16 |
| Lithuania | n.a. | 9.1 | −25.7 | n.a. | 21.7 | −4.1 | 19.2 | 6.2 | n.a. |
| Netherlands | −2 | −9 | 14.5 | 26.6 | −5 | −69 | 5 | 3.2 | −3 |
| Poland | −68.9 | −40.3 | −33.1 | −23.2 | −45.3 | -28.9 | −23.9 | −52.3 | −10.1 |
| Portugal | −7.8 | 20 | −14.2 | 40.8 | 27.9 | 23.8 | 24.8 | 24.2 | 25.8 |
| Romania | 29.1 | 3.2 | -45.6 | -29.9 | −21.4 | −36.6 | −27.6 | −8.2 | −25.6 |
| Slovakia | n.a. | n.a. | 12.5 | 22.1 | 2.2 | 0.2 | 4.9 | 18 | 9.7 |
| Slovenia | n.a. | −2 | −50.8 | −3.7 | 37.1 | 14.1 | −21.9 | −16.8 | −13.6 |
| Spain | 7.3 | 2.1 | 9.7 | 2.8 | 5.5 | -3.5 | 1.6 | −5.6 | 3.8 |
| Sweden | −11.2 | −7.9 | −5.1 | −31.8 | −33.1 | −29.6 | −20.6 | -38.9 | −28.4 |
| United Kingdom | 9.5 | 5.9 | 20.1 | 9.7 | 23 | 16.2 | 54.8 | 8.4 | 27.5 |
| Total | −27.7 | −25.6 | −16.8 | −6.4 | −9.6 | −9.1 | −3.7 | −15 | −3 |
| Canada | n.a. | −9.53 | −4.36 | −15.42 | −6.58 | −6.70 | −16.79 | −3.48 | −5.02 |
| USA | n.a. | 24.13 | 25.93 | 25.8 | 21.88 | 25 | 21.88 | 35.48 | 28.5 |
References
- Tsili, M.; Papathanassiou, S. A review of grid code technical requirements for wind farms. IET Renew. Power Gener. 2009, 3, 308–332. [Google Scholar] [CrossRef]
- Konieczna, A.; Roman, K.; Roman, M.; Śliwiński, D.; Roman, M. Energy Efficiency of Maize Production Technology: Evidence from Polish Farms. Energies 2021, 14, 170. [Google Scholar] [CrossRef]
- Stelmach, J.; Kuncewicz, C.; Szufa, S.; Jirout, T.; Rieger, F. The Influence of Hydrodynamic Changes in a System with a Pitched Blade Turbine on Mixing Power. Processes 2021, 9, 68. [Google Scholar] [CrossRef]
- Dzikuć, M.; Łasiński, K.; Dzikuć, M. Technical and economic aspects of low emission reduction in Poland. Int. J. Appl. Mech. Eng. 2017, 22, 1107–1112. [Google Scholar] [CrossRef] [Green Version]
- Dzikuć, M.; Piwowar, A.; Szufa, S.; Adamczyk, J.; Dzikuć, M. Potential, and scenarios of variants of thermo-modernization of single-family houses: An example of the Lubuskie Voivodeship. Energies 2021, 14, 191. [Google Scholar] [CrossRef]
- Szufa, S.; Piersa, P.; Adrian, Ł.; Sielski, J.; Grzesik, M.; Romanowska-Duda, Z.; Piotrowski, K.; Lewandowska, W. Acquisition of Torrefied Biomass from Jerusalem Artichoke Grown in a Closed Circular System Using Biogas Plant Waste. Molecules 2020, 25, 3862. [Google Scholar] [CrossRef] [PubMed]
- Dzikuć, M.; Dzikuć, M. Ekonomiczne determinanty ograniczenia emisji benzo[a]pirenu na obszarze Środkowego Nadodrza. Przemysł Chem. 2019, 98, 600–603. [Google Scholar] [CrossRef]
- Serrano-Gonzalez, R.; Lacal-Arantegiu, J. Technological evolution of onshore wind turbines—A market-based analysis. Wind Energy 2016, 19, 2171–2187. [Google Scholar] [CrossRef] [Green Version]
- Watson, R.; Moro, S.; Reis, A.; Baniotopoulos, V.; Barth, C.; Bartoli, S.; Bauer, G.; Boelman, F.; Bosse, E.; Cherubini, D.; et al. Future emerging technologies in the wind power sector: A European perspective. Renew. Sustain. Energy Rev. 2019, 113, 109270. [Google Scholar] [CrossRef]
- Environmental Justice Strategy 2017. Available online: https://www.energy.gov/sites/prod/files/2017/01/f34/G-DOE-EJStrategy.pdf (accessed on 12 January 2021).
- Enevoldsen, P.; Xydis, G. Examining the trends of 35 years growth of key wind turbine components. Energy Sustain. Dev. 2019, 50, 18–26. [Google Scholar] [CrossRef]
- IRENA. Renewable Power Generation Costs in 2018; International Renewable Energy Agency: Abu Dhabi, United Arab Emirates, 2019. [Google Scholar]
- IRENA. Renewable Power Generation Costs in 2019; International Renewable Energy Agency: Abu Dhabi, United Arab Emirates, 2020. [Google Scholar]
- Tang, T. Explaining technological change in the US wind industry: Energy policies, technological learning, and collaboration. Energy Policy 2018, 120, 197–212. [Google Scholar] [CrossRef]
- Urząd Regulacji Energetyki, Średnioważony Koszt Węgla, Zużywanego przez Jednostki Wytwórcze Centralnie Dysponowane oraz Średnia cena Energii Elektrycznej Wytworzonej przez Wytwórców Eksploatujących Jednostki Wytwórcze Centralnie Dysponowane w Danym Roku. Available online: https://www.ure.gov.pl/pl/energia-elektryczna/ceny-wskazniki/7854,Sredniowazony-koszt-wegla-zuzywanego-przez-jednostki-wytworcze-centralnie-dyspon.html (accessed on 2 January 2021).
- Republic of Poland. 1. Act of 20 May 2016 on Wind Energy Investments (pl. Ustawa z 10-tego maja 20016 r o inwestycjach w zakresie elektrowni wiatrowych); Republic of Poland: Warsaw, Poland.
- Rabe, M.; Streimikiene, D.; Bilan, Y. Model of Optimization of Wind Energy Production in the Light of Legal Changes in Poland. Energies 2020, 13, 1557. [Google Scholar] [CrossRef] [Green Version]
- Kaczerowski, M. Najgorszy Rok w Historii Energetyki Wiatrowej w Polsce. BiznesAlert. 3 August 2017. Available online: https://biznesalert.pl/kaczerowski-najgorszy-historii-energetyki-wiatrowej-polsce/ (accessed on 30 March 2020).
- Dołęga, W. Problems and perspectives of wind energy development in Poland. Rynek Energii 2020, 146, 59–64. [Google Scholar]
- Blau, F.; Hubik, J. Profits Gone with the Wind. Handel Today. 2019. Available online: https://www.handelsblatt.com/today/companies/wind-energy-profits-gone-with-the-wind/23573222.html?ticket=ST-323555-apl9x05DRssHosaKJDfy-ap3 (accessed on 11 September 2020).
- Gonzales, J.S. A review of regulatory framework for wind energy in European Union countries: Current state and expected developments. Renew. Sustain. Energy Rev. 2016, 56, 588–602. [Google Scholar] [CrossRef]
- Wind Europe. Wind Energy in Europe 2018: Trends and Statistics. Available online: https://windeurope.org/wp-content/uploads/files/about-wind/statistics/WindEurope-Annual-Statistics-2018.pdf (accessed on 13 January 2021).
- Wind Europe. Financing, and Investment Trends, The European Wind Industry in 2019. Available online: https://windeurope.org/wp-content/uploads/files/about-wind/reports/Financing-and-Investment-Trends-2019.pdf (accessed on 12 January 2021).
- Buchsbaum, L.M. Blown Off-Course? Despite Rapid Expansion Across Europe, German Offshore Wind Capacity Growth is Slowing. Energy Transition Global Energiewende. 2019. Available online: https://energytransition.org/2019/02/german-offshore-wind-capacity/ (accessed on 12 September 2020).
- Wehrmann, B. Limits to Growth: Resistance Against Wind Power in Germany. Clean Energy Wire. 2019. Available online: https://www.cleanenergywire.org/factsheets/fighting-windmills-when-growth-hits-resistance (accessed on 10 January 2021).
- Gienke, E. Ende der Foerderung: Alte Windraeder muessen bald vom Netz. ZDF Nahrhichten. 2019. Available online: https://www.wind-watch.org/news/2017/10/31/ende-der-forderung-alte-windrader-mussen-bald-vom-netz (accessed on 11 January 2021).
- Jones, R.; Eiser, C. Identifying predictors of attitudes towards local onshore wind development with reference to an English case study. Energy Policy 2009, 37, 4604–4614. [Google Scholar] [CrossRef] [Green Version]
- Walter, G. Determining the local acceptance of wind energy projects in Switzerland: The importance of general attitudes and project characteristics. Energy Res. Soc. Sci. 2014, 4, 78–88. [Google Scholar] [CrossRef]
- Energypedia, Feed-In Premiums (FIP). Energypedia 2020. Available online: https://energypedia.info/wiki/Feed-in_Premiums_(FIP) (accessed on 1 February 2021).
- Council of European Energy. Sustainable Development Work Stream: Tendering procedures for RES in Europe: State of Play and First Lessons Learnt 2018. Available online: https://www.ceer.eu/documents/104400/-/-/167af87c-5472-230b-4a19-f68042d58ea8 (accessed on 23 December 2020).
- Erickson, A. The Production Tax Credit: Corporate Subsidies and Renewable Energy 2019. Available online: https://www.heartland.org/_template-assets/documents/publications/TPPF-Erickson-renewable-subsidies.pdf (accessed on 5 January 2021).
- Garrad, M. The lessons learned from the development of the wind energy industry that might be applied to marine industry renewables. Philos. Trans. Math. Phys. Eng. Sci. 2012, 370, 451–471. [Google Scholar] [CrossRef]
- Eltham, S.; Harrison, D.; Allen, G. Change in public attitudes towards a Cornish wind farm: Implications for planning. Energy Policy 2008, 36, 23–33. [Google Scholar] [CrossRef] [Green Version]
- Castelo-Branco, M.; Alves-Pereira, N. Vibroacoustic Disease. Noise Health 2004, 6, 3–20. [Google Scholar]
- Smallwood, S. Comparing bird and bat fatality-rate estimates among North American wind-energy projects. Wildl. Soc. Bull. 2013, 37, 19–33. [Google Scholar] [CrossRef]
- Drewitt, R.; Langston, A. Assessing the impacts of wind farms on birds. IBIS Int. J. Avian Sci. 2006, 148, 29–42. [Google Scholar] [CrossRef]
- Matthews, A. Bat Killings by Wind Energy Turbines Continue. Scientific American 2016. Available online: https://www.scientificamerican.com/article/bat-killings-by-wind-energy-turbines-continue (accessed on 18 December 2020).
- Parkhill, K. Tensions between Scottish National Policies for onshore wind energy and local dissatisfaction—Insights from regulation theory. Eur. Environ. J. Eur. Environ. Policy 2017, 17, 307–320. [Google Scholar] [CrossRef]
- Van Kamp, I. Health Effects Related to Wind Turbine Sound, Including Low-Frequency Sound and Infrasound. Acoust. Aust. 2018, 4, 31–57. [Google Scholar] [CrossRef] [Green Version]
- Dzikuć, M. Bezpieczeństwo energetyczne miast i wsi województwa lubuskiego = Energy security of urban and rural lubuskie land. Rynek Energii 2013, 1, 56–61. [Google Scholar]
- Golobic, M. Are wind farms a problematic project? Urbani Izziv Probl. Proj. 2005, 16, 155–160. [Google Scholar] [CrossRef]
- Piwowar, A.; Dzikuć, M. Poverty and Social Exclusion: Is this a Problem in Rural Areas in the Visegrad Group Countries? Eur. Res. Stud. J. 2020, 23, 45–54. [Google Scholar] [CrossRef] [Green Version]
- Orbis van der Vijk Database (The Countries for which No Data Were Available Were Omitted). The Number of Wind Farms Based On. Available online: https://www.thewindpower.net/windfarms_list_en.php (accessed on 3 December 2020).
- Ziegler, J.; Gonzales, L.; Rubert, E.; Smolka, T.; Melero, U. Lifetime extension of onshore wind turbines: A review covering Germany, Spain, Denmark, and the UK. Renew. Sustain. Energy Rev. 2018, 82, 1261–1271. [Google Scholar] [CrossRef] [Green Version]
- Angelopoulos, D.; Brückmann, R.; Jirouš, F.; Konstantinavičiūtė, I.; Noothout, P.; Psarras, J.; Tesnière, L.; Breitschopf, B. Risks and cost of capital for onshore wind energy investments in EU countries. Energy Environ. 2016, 27, 82–104. [Google Scholar] [CrossRef] [Green Version]
- International Energy Agency. Projected Costs of Generating Electricity 2015, Washington. Available online: https://www.oecd-nea.org/jcms/pl_14756 (accessed on 30 December 2020).
- Bruck, N.; Sandborn, M.; Goudarzi, P. A Levelized cost of energy (LCOE) model for wind farms that include power purchase agreements (PPAs). Renew. Energy 2018, 122, 2131–2139. [Google Scholar] [CrossRef]
- Shah, S.; Bazilian, M. LCOE and Its Limitations. Energy for Growth Hub 2020. Available online: https://www.energyforgrowth.org/memo/lcoe-and-its-limitations/ (accessed on 1 February 2021).
- Burenstam-Linder, C. Levelized Cost of Electricity (LCOE) and Its Limitations. Heat Power 2017. Available online: https://heatpower.com/news/renewable-energy/levelized-cost-of-electricity-lcoe-and-its-limitations/ (accessed on 1 February 2021).
- Aldersey-Williams, J. Levelised cost of energy—A theoretical justification and critical assessment. Energy Policy 2019, 124, 169–179. [Google Scholar] [CrossRef]
- Branker, K.; Pathak, M.J.M.; Pearce, J.M. A review of solar photovoltaic levelized cost of electricity. Renew. Sustain. Energy Rev. 2011, 15, 4470–4482. [Google Scholar] [CrossRef] [Green Version]
- Gonzales, J.S.; Rodriguez, A.G.; Mora, J.C.; Burgos, P.M.; Santos, J.R. Overall design optimization of wind farms. Renew. Energy An. Int. J. 2011, 36, 1973–1982. [Google Scholar] [CrossRef]
- Kost, C.; Shammugam, S.; Julch, V.; Nguyen, H.T.; Schlegl, T. Stromgestehungskosten Erneuerbare Energien 2018. Available online: https://www.ise.fraunhofer.de/content/dam/ise/en/documents/publications/studies/EN2018_Fraunhofer-ISE_LCOE_Renewable_Energy_Technologies.pdf (accessed on 3 January 2021).
- MacLeay, A.; Harris, I.; Annut, K. Digest of United Kingdom Energy Statistics 2015. Available online: https://assets.publishing.service.gov.uk/government/uploads/system/uploads/attachment_data/file/454482/DUKES_2015_internet_content.pdf (accessed on 22 December 2020).
- Department for Business, Energy & Industrial Strategy, Electricity Generation Costs, Department for Business, Energy & Industrial Strategy 2016. Available online: https://assets.publishing.service.gov.uk/government/uploads/system/uploads/attachment_data/file/566567/BEIS_Electricity_Generation_Cost_Report.pdf (accessed on 30 January 2021).
- MacDonald, M. UK Electricity Generation Costs Update 2010, Brighton. Available online: https://assets.publishing.service.gov.uk/government/uploads/system/uploads/attachment_data/file/65716/71-uk-electricity-generation-costs-update-.pdf (accessed on 31 January 2021).
- Energy Information Administration. Annual Energy Outlook 2020, Washington. Available online: https://www.eia.gov/outlooks/aeo/pdf/AEO2020FullReport.pdf (accessed on 12 January 2021).
- Cardwell, D. Buffeted by Energy Politics. New York Times. 30 May 2017. Available online: https://www.nytimes.com/2017/05/30/business/energy-environment/wind-power-base-load.html?searchResultPosition=1 (accessed on 30 January 2021).
- Campisi, D.; Gitto, D.; Morea, S. Effectiveness of incentives for wind energy: Models and empirical evidences from an Italian case study. J. Sustain. Sci. Manag. 2016, 11, 39–48. Available online: http://jssm.umt.edu.my/wp-content/uploads/sites/51/2016/12/5-web.pdf (accessed on 21 December 2020).
- Sakka, C.; Bilionis, E.; Vamvatsikos, D.; Gantes, D. Onshore wind farm siting prioritization based on investment profitability for Greece. Renew. Energy 2019, 146, 2827–2839. [Google Scholar] [CrossRef]
- Veronesi, S.; Grassi, F. Comparison of Hourly and Daily Wind Speed Observations for the Computation of Weibull Parameters and Power Output. In Proceedings of the 3rd International Renewable and Sustainable Energy Conference (IRSEC) IEEE 2015, Piscataway, NJ, USA, 3–6 December 2015; pp. 1–6. Available online: https://www.researchgate.net/publication/301789915_Comparison_of_hourly_and_daily_wind_speed_observations_for_the_computation_of_Weibull_parameters_and_power_output (accessed on 29 December 2020).
- Stąporek, P.; Tauzowski, M. Współczynnik wykorzystania mocy i produktywność różnych modeli turbin wiatrowych dostępnych na polskim rynku. DNV GL 2017, 1–5. [Google Scholar]
- IRENA. Renewable Power Generation Costs in 2017, Abu Dhabi. Available online: https://www.irena.org/-/media/Files/IRENA/Agency/Publication/2019/May/IRENA_Renewable-Power-Generations-Costs-in-2018.pdf (accessed on 28 December 2020).
- IRENA. Future of wind: Deployment, investment, technology, grid integration and socio-economic aspects 2019. Available online: https://www.irena.org/-/media/Files/IRENA/Agency/Publication/2019/Oct/IRENA_Future_of_wind_2019.pdf (accessed on 30 December 2020).
- Hahn, B.; Durstewitz, M.; Rohrig, K. Reliability of Wind Turbines. In Wind Energy; Peinke, S., Schaumann, J., Barth, P., Eds.; Springer: Berlin/Heidelberg, Germany, 2007; pp. 329–332. [Google Scholar]
- Gnatowska, A.; Wąs, R. Analiza opłacalności inwestycji w produkcję energii ze źródeł odnawialnych na przykładzie farmy wiatrowej przy założeniu wsparcia rządu dla zielonej energii. Inżynieria Ochr. Środowiska 2015, 18, 23–33. [Google Scholar]
- Milecarek, J. Analiza projektu farmy wiatrowej za pomocą rachunku kosztów docelowych. Pr. Nauk. Uniw. Ekon. Wrocławiu 2014, 365, 155–173. [Google Scholar] [CrossRef]
- Suska-Szczerbicka, E.; Weiss, M. Ocena opłacalności przedsięwzięcia inwestycyjnego produkcji energii elektrycznej farmy wiatrowej. Rynek Energii 2013, 1, 104–111. [Google Scholar]
- Gnatowska, E.; Moryń-Kucharczyk, R. Current Status of Wind Energy in Poland. Renew. Energy An. Int. J. 2019, 135, 232–237. [Google Scholar] [CrossRef]
- Igliński, B.; Iglińska, A.; Koziński, G.; Skrzatek, M.; Buczkowski, R. Wind energy in Poland—History, current state, surveys, Renewable Energy Sources Act, SWOT analysis. Renew. Sustain. Energy Rev. 2016, 64, 19–33. [Google Scholar] [CrossRef]
- Ozerdem, M.; Ozer, B.; Tosun, S. Feasibility study of wind farms: A case study for Izmir, Turkey. J. Wind Eng. Ind. Aerodyn. 2006, 94, 725–743. [Google Scholar] [CrossRef] [Green Version]
Figure 1.
Graphical representation of the dependency between the wind speeds and NPV of a wind farm (in thousands of EUROs in 2019 prices); real discount rate 5%.
Figure 1.
Graphical representation of the dependency between the wind speeds and NPV of a wind farm (in thousands of EUROs in 2019 prices); real discount rate 5%.

Figure 2.
Graphical representation of the dependency between the wind speeds and NPV of a wind farm (in thousands of EUROs in 2019 prices); real discount rate 7%.
Figure 2.
Graphical representation of the dependency between the wind speeds and NPV of a wind farm (in thousands of EUROs in 2019 prices); real discount rate 7%.

Figure 3.
Graphical representation of the dependency between the wind speeds and NPV of a wind farm (in thousands of EUROs in 2019 prices); real discount rate 10%.
Figure 3.
Graphical representation of the dependency between the wind speeds and NPV of a wind farm (in thousands of EUROs in 2019 prices); real discount rate 10%.

Figure 4.
Minimum, maximum, median, and average break-even prices for wind farms opened in years 2006–2014 in Poland (EURO/MWh); discount rate 5%.
Figure 4.
Minimum, maximum, median, and average break-even prices for wind farms opened in years 2006–2014 in Poland (EURO/MWh); discount rate 5%.

Figure 5.
Average market prices of renewable energy in Poland compared with mean and median break-even prices of wind farms opened in 2006–2014, years 2006–2018; discount rate 5%.
Figure 5.
Average market prices of renewable energy in Poland compared with mean and median break-even prices of wind farms opened in 2006–2014, years 2006–2018; discount rate 5%.

Figure 6.
Minimum, maximum, median, and average break-even prices for wind farms opened in years 2006–2014 in Poland (EURO/MWh); discount rate 7%.
Figure 6.
Minimum, maximum, median, and average break-even prices for wind farms opened in years 2006–2014 in Poland (EURO/MWh); discount rate 7%.

Figure 7.
Average market prices of renewable energy in Poland compared with mean and median break-even prices of wind farms opened in 2006–2014, years 2006–2018; discount rate 7%.
Figure 7.
Average market prices of renewable energy in Poland compared with mean and median break-even prices of wind farms opened in 2006–2014, years 2006–2018; discount rate 7%.

Figure 8.
Minimum, maximum, median, and average break-even prices for wind farms opened in years 2006–2014 in Poland (EURO/MWh); discount rate 10%.
Figure 8.
Minimum, maximum, median, and average break-even prices for wind farms opened in years 2006–2014 in Poland (EURO/MWh); discount rate 10%.

Figure 9.
Average market prices of renewable energy in Poland compared with mean and median break-even prices of wind farms opened in 2006–2014; years 2006–2018, discount rate 10%.
Figure 9.
Average market prices of renewable energy in Poland compared with mean and median break-even prices of wind farms opened in 2006–2014; years 2006–2018, discount rate 10%.

Table 1.
Theoretical median capacity factors of new wind turbines installed in Poland in 2005–2019 (%) for wind speeds of 6 m/s, 7 m/s and 8 m/s.
Table 1.
Theoretical median capacity factors of new wind turbines installed in Poland in 2005–2019 (%) for wind speeds of 6 m/s, 7 m/s and 8 m/s.
| Year of Opening | Median Capacity Factor (Weibull(A = 6 m/s, k = 2) *) | Median Capacity Factor (Weibull(A = 7 m/s, k = 2) *) | Median Capacity Factor (Weibull(A = 8 m/s, k = 2) *) |
|---|---|---|---|
| 2005 | 20 | 29 | 37 |
| 2006 | 18 | 25 | 33 |
| 2007 | 18 | 25 | 33 |
| 2008 | 18 | 25 | 33 |
| 2009 | 21 | 30 | 38 |
| 2010 | 22 | 30 | 37 |
| 2011 | 21 | 30 | 39 |
| 2012 | 21 | 30 | 39 |
| 2013 | 22 | 30 | 37 |
| 2014 | 22 | 30 | 37 |
| 2015 | 21 | 30 | 38 |
| 2016 | 27 | 36 | 45 |
| 2017 | 24 | 33 | 42 |
| 2018 | 15 | 22 | 30 |
| 2019 | 26 | 36 | 44 |
A—scale parameter (represents the average wind speed), k—shape parameter (the popular setting is k = 2, which represents a relatively constant wind; the typical empirical range is 1.5—2.5). Source: data on years of opening and turbine types used in every wind farm were taken from the wind energy database [https://www.thewindpower.net/ (accessed on 10 January 2021)]; parameters of wind turbines were taken from the manufacturer’s websites and an online calculator [https://wind-data.ch/tools/powercalc.php?lng=en (accessed on 10 January 2021)]. * The Weibull distribution of these parameters describes the manufacturers’ performance estimates.
Table 2.
Estimated oversupply of green certificates and market costs of energy and green certificates in Poland, years 2006–2019 [15].
Table 2.
Estimated oversupply of green certificates and market costs of energy and green certificates in Poland, years 2006–2019 [15].
| Itemized | 2006 | 2007 | 2008 | 2009 | 2010 | 2011 | 2012 | 2013 | 2014 | 2015 | 2016 | 2017 | 2018 | 2019 |
|---|---|---|---|---|---|---|---|---|---|---|---|---|---|---|
| Difference between production and demand for green certificates in TWh | −0.2 | −0.69 | −1.99 | −1.53 | −1.63 | 0.32 | 3.43 | 2.17 | 3.5 | 4.3 | 3.8 | 2.1 | n.a. | n.a. |
| Price of green certificate * in EUR/MWh [2019 prices] | 69.68 | 76.64 | 81.99 | 69.95 | 77.05 | 72.93 | 57.91 | 39.81 | 34.94 | 31.13 | 17.89 | 9.48 | 24.92 | 30.75 |
| Market price of energy in EUR/MWh [2019 prices] | 39.71 | 42.92 | 53.55 | 53.29 | 55.74 | 52.77 | 50.70 | 45.17 | 40.82 | 42.81 | 41.23 | 39.96 | 46.64 | 57.09 |
| Market price + green certificate price in EUR/MWh [2019 prices] | 109.39 | 119.56 | 135.54 | 123.24 | 132.78 | 125.70 | 108.60 | 84.97 | 75.76 | 73.94 | 59.12 | 49.43 | 71.56 | 87.84 |
* Estimates based on averaged market prices and indexes (translation into EURO was based on the average foreign exchange rate from the year when the price was observed and then adjusted for inflation in the euro area to obtain fixed 2019 prices).
Table 3.
Share of wind farms with net loss, years 2009–2017 (in %) (the number of wind farms with a net loss divided by the total number of wind farms for which income statements for a particular year were available) [43].
Table 3.
Share of wind farms with net loss, years 2009–2017 (in %) (the number of wind farms with a net loss divided by the total number of wind farms for which income statements for a particular year were available) [43].
| Country | 2009 | 2010 | 2011 | 2012 | 2013 | 2014 | 2015 | 2016 | 2017 |
|---|---|---|---|---|---|---|---|---|---|
| Austria | 100 | 25 | 0 | 0 | 0 | 25 | 13 | 33 | 0 |
| Belgium | 24 | 50 | 20 | 22 | 29 | 34 | 23 | 29 | 17 |
| Bulgaria | 20 | 20 | 57 | 32 | 36 | 45 | 18 | 4 | 10 |
| Croatia | 75 | 67 | 83 | 38 | 67 | 40 | 30 | 36 | 46 |
| Czech Rep. | 43 | 22 | 22 | 22 | 22 | 25 | 22 | 11 | 0 |
| Denmark | 45 | 28 | 44 | 38 | 42 | 41 | 43 | 49 | 31 |
| Estonia | 67 | 64 | 55 | 30 | 50 | 33 | 29 | 57 | 27 |
| Finland | 15 | 27 | 41 | 43 | 41 | 49 | 50 | 54 | 52 |
| France | 82 | 81 | 67 | 49 | 48 | 47 | 44 | 59 | 50 |
| Germany | 66 | 68 | 45 | 49 | 47 | 54 | 30 | 41 | 29 |
| Greece | 47 | 59 | 27 | 43 | 56 | 42 | 38 | 55 | 33 |
| Hungary | 86 | 58 | 70 | 62 | 38 | 56 | 50 | 52 | 49 |
| Ireland | 36 | 43 | 14 | 29 | 25 | 36 | 36 | 55 | 15 |
| Italy | 80 | 81 | 73 | 71 | 69 | 67 | 66 | 55 | 42 |
| Latvia | 33 | 38 | 52 | 48 | 47 | 52 | 55 | 55 | 55 |
| Lithuania | - | 0 | 100 | - | 0 | 33 | 0 | 0 | - |
| The Netherlands | 7 | 50 | 8 | 0 | 23 | 36 | 44 | 33 | 100 |
| Poland | 86 | 77 | 82 | 75 | 79 | 73 | 67 | 78 | 59 |
| Portugal | 41 | 37 | 29 | 15 | 22 | 26 | 23 | 24 | 26 |
| Romania | 31 | 53 | 62 | 49 | 53 | 52 | 55 | 62 | 67 |
| Slovakia | - | - | - | 0 | 0 | 0 | 0 | 0 | 0 |
| Slovenia | - | 100 | 100 | 100 | 50 | 50 | 100 | 67 | 50 |
| Spain | 50 | 46 | 38 | 35 | 40 | 58 | 42 | 52 | 45 |
| Sweden | 37 | 42 | 41 | 54 | 60 | 61 | 60 | 77 | 72 |
| United Kingdom | 24 | 30 | 24 | 25 | 20 | 26 | 16 | 29 | 17 |
| Total | 60 | 60 | 53 | 49 | 50 | 52 | 46 | 54 | 44 |
| Canada | n.a. | 57 | 62 | 73 | 45 | 55 | 64 | 50 | 29 |
| USA | n.a. | 24 | 26 | 26 | 22 | 25 | 22 | 35 | 29 |
Table 4.
Estimated International Renewable Energy Agency (IRENA) total investment costs of onshore wind turbines (above 1 MW of power, 2019 prices) [63,64].
| Year | EURO per kWh |
|---|---|
| 2005 * | 2327.92 |
| 2006 * | 2183.54 |
| 2007 * | 1865.82 |
| 2008 * | 1687.15 |
| 2009 * | 1680.78 |
| 2010 | 1691.84 |
| 2011 | 1540.40 |
| 2012 | 1686.55 |
| 2013 | 1492.87 |
| 2014 | 1442.45 |
| 2015 | 1575.60 |
| 2016 | 1547.27 |
| 2017 | 1476.41 |
| 2018 | 1296.60 |
| 2019 * | 1296.11 |
* extrapolation.
Table 5.
Estimated repair costs and failure rates for 2 MW wind turbine (in EUROs, fixed 2019 prices).
Table 5.
Estimated repair costs and failure rates for 2 MW wind turbine (in EUROs, fixed 2019 prices).
| Maintenance Description | Annual Failure Rate | Cost in EUROs |
|---|---|---|
| bearing replacement (drivetrain) | 0.00025 | 58,655 |
| repair of pitting, misalignment (drivetrain) | 0.02 | 7821 |
| gearbox replacement (drivetrain) | 0.001 | 410,582 |
| gear replacement (drivetrain) | 0.01 | 181,829 |
| gear tooth repair (drivetrain) | 0.1 | 2933 |
| shaft replacement (drivetrain) | 0 | 293,273 |
| minor repair, alignment adjustment (drivetrain) | 0.02 | 489 |
| lubrication change (drivetrain) | 0.1 | 2933 |
| hydraulic pump part replacement (hydraulic system) | 0.165 | 4888 |
| hydraulic valves/pipes replacement (hydraulic system) | 0.165 | 978 |
| brake calipers/pads replacement of worn components (braking system) | 0.05 | 7821 |
| brake discs replacement (braking system) | 0.05 | 5865 |
| yaw actuator part replacement (yaw) | 0.004 | 4888 |
| yaw actuator minor repair (yaw) | 0.075 | 489 |
| yaw bearing/gear complete replacement (yaw) | 0.00025 | 178,897 |
| yaw bearing/gear tooth repair (yaw) | 0.003 | 978 |
| yaw bearing/gear corrective repair (yaw) | 0.08 | 196 |
| yaw brake replacement (yaw) | 0.08 | 2933 |
| pitch actuator part replacement | 0.01 | 13,686 |
| pitch actuator minor repair | 0.1 | 489 |
| pitch bearing/gear tooth repair/replacement | 0.01 | 59,632 |
| pitch bearing/gear corrective repair | 0.1 | 196 |
| hub replacement (rotor) | 0.007 | 8798 |
| hub minor corrosion repair (rotor) | 0.09 | 196 |
| blade replacement (rotor) | 0.01 | 150,547 |
| blade minor repair (patching, sealing) (rotor) | 0.1 | 22 484 |
| generator part replacement (power) | 0.07 | 2933 |
| generator complete replacement (power) | 0.0015 | 190,628 |
| frequency converter part/complete replacement (power) | 0.15 | 37,148 |
| transformer part/complete replacement (power) | 0.15 | 4888 |
| tower replacement (structure) | 0.0003 | 351,928 |
| tower corrosion repair (structure) | 0.02 | 4888 |
| nacelle replacement (structure) | 0 | 48,879 |
| nacelle—loss of section, crack repair (structure) | 0.02 | 978 |
| foundation replacement (structure) | 0 | 97,758 |
| foundation corrosion/repaint/remove marine growth (structure | 0.02 | 4888 |
Table 6.
Results of the simulation for 5, 10, and 15 wind turbines (NPV1, NPV2, and NPV3), per thousands of EURO (2019 prices), with a real discount rate of 5%, 7%, 10%.
Table 6.
Results of the simulation for 5, 10, and 15 wind turbines (NPV1, NPV2, and NPV3), per thousands of EURO (2019 prices), with a real discount rate of 5%, 7%, 10%.
| ID | av.Wind | Median.Wind | std.dev.Wind | NPV1 (5%) | NPV1 (7%) | NPV1 (10%) | NPV2 (5%) | NPV2 (7%) | NPV2 (10%) | NPV3 (5%) | NPV3 (7%) | NPV3_10 | City Name | Voivodship |
|---|---|---|---|---|---|---|---|---|---|---|---|---|---|---|
| 100.0 | 2.7 | 2.3 | 1.3 | −2290 | −1991 | −1658 | −4537 | −3660 | −3263 | −6195 | −5474 | −4275 | Kołobrzeg | zachodniopomorskie |
| 105.0 | 3.2 | 2.9 | 1.5 | −2024 | −1725 | −1392 | −3996 | −3438 | −2665 | −4955 | −4386 | −3873 | Koszalin | zachodniopomorskie |
| 115.0 | 5.2 | 4.6 | 2.4 | 1692 | 1367 | 1144 | 3057 | 2611 | 2433 | 5679 | 5563 | 5560 | Ustka | pomorskie |
| 120.0 | 4.6 | 4.1 | 2.4 | 522 | 502 | 495 | 1279 | 1107 | 926 | 2066 | 1737 | 1354 | Łeba | pomorskie |
| 125.0 | 3.3 | 3 | 1.7 | −1843 | −1544 | −1211 | −3360 | −2831 | −2227 | −4534 | −3882 | −3151 | Lębork | pomorskie |
| 135.0 | 3.9 | 3.6 | 1.5 | −1541 | −1242 | −909 | −2820 | −2243 | −1666 | −3900 | −3120 | −2353 | Hel | pomorskie |
| 140.0 | 4.6 | 4.3 | 1.9 | −129 | −104 | −87 | −211 | −180 | −168 | −246 | −241 | −241 | Gdańsk-Port | pomorskie |
| 155.0 | 4.1 | 3.8 | 1.5 | −1475 | −1176 | −843 | −2847 | −2122 | −1555 | −4142 | −3440 | −2354 | Gdańsk-Świbno | pomorskie |
| 160.0 | 3.3 | 3.1 | 1.4 | −1908 | −1609 | −1276 | −3455 | −3107 | −2357 | −5269 | −4306 | −3463 | Elbląg-Milejewo | warmińsko-mazurskie |
| 185.0 | 3.5 | 3.3 | 1.6 | −1475 | −1176 | −843 | −2700 | −2151 | −1632 | −4178 | −3456 | −2269 | Kętrzyn | warmińsko-mazurskie |
| 195.0 | 3.6 | 3.4 | 1.6 | −1779 | −1481 | −1148 | −3290 | −2864 | −2163 | −4940 | −4208 | −3061 | Suwałki | podlaskie |
| 200.0 | 3.3 | 2.9 | 1.7 | −1773 | −1474 | −1141 | −3380 | −2677 | −2173 | −4795 | −4039 | −3127 | Świnoujście | zachodniopomorskie |
| 205.0 | 3.8 | 3.5 | 1.6 | −1687 | −1388 | −1055 | −2838 | −2337 | −1937 | −4098 | −3536 | −2693 | Szczecin | zachodniopomorskie |
| 210.0 | 2.2 | 2 | 1.1 | −2507 | −2189 | −1856 | −3979 | −3912 | −3494 | −5870 | −5586 | −4830 | Resko-Smólsko | zachodniopomorskie |
| 230.0 | 2.3 | 2.3 | 1.0 | −2500 | −2181 | −1848 | −4414 | −4148 | −3630 | −6116 | −6033 | −5097 | Piła | wielkopolskie |
| 235.0 | 3.7 | 3.4 | 1.5 | −1753 | −1454 | −1121 | −3249 | −2849 | −2064 | −4734 | −4162 | −3015 | Chojnice | zachodniopomorskie |
| 250.0 | 2.5 | 2.4 | 1.0 | −2437 | −2138 | −1806 | −4786 | −4207 | −3558 | −6820 | −5888 | −4685 | Toruń | kujawsko-pomorskie |
| 270.0 | 3.5 | 3.1 | 1.5 | −1872 | −1573 | −1240 | −3435 | −2864 | −2307 | −4936 | −4141 | −3297 | Mława | mazowieckie |
| 272.0 | 2.9 | 2.8 | 1.2 | −2241 | −1942 | −1609 | −4133 | −3658 | −3031 | −6279 | −5769 | −4492 | Olsztyn | warmińsko-mazurskie |
| 280.0 | 3.1 | 2.9 | 1.3 | −2120 | −1821 | −1488 | −4139 | −3575 | −2920 | −5505 | −4580 | −3934 | Mikołajki | kujawsko-pomorskie |
| 295.0 | 2.5 | 2.3 | 1.1 | −2424 | −2125 | −1793 | −4747 | −4340 | −3455 | −6839 | −5713 | −4840 | Białystok | podlaskie |
| 300.0 | 2.6 | 2.5 | 1.0 | −2404 | −2105 | −1772 | −4354 | −4098 | −3376 | −6582 | −5633 | −4593 | Gorzów Wielkopolski | lubelskie |
| 310.0 | 2.7 | 2.5 | 1.3 | −2276 | −1977 | −1644 | −4368 | −4033 | −3199 | −5997 | −5382 | −4285 | Słubice | lubuskie |
| 330.0 | 3.6 | 3.4 | 1.7 | −1669 | −1370 | −1037 | −3054 | −2639 | −2000 | −4442 | −3808 | −2787 | Poznań | wielkopolskie |
| 345.0 | 3.9 | 3.8 | 1.7 | −1580 | −1281 | −948 | −2949 | −2248 | −1727 | −4594 | −3736 | −2604 | Koło | wielkopolskie |
| 360.0 | 3.3 | 3 | 1.4 | −2007 | −1708 | −1375 | −4027 | −3360 | −2679 | −5076 | −4120 | −3557 | Płock | mazowieckie |
| 375.0 | 3.5 | 3.3 | 1.6 | −1765 | −1466 | −1133 | −3335 | −2692 | −2226 | −4601 | −3929 | −3006 | Warszawa | mazowieckie |
| 385.0 | 3.0 | 2.8 | 1.4 | −2177 | −1878 | −1545 | −3939 | −3398 | −2784 | −6046 | −5505 | −4274 | Siedlce | mazowieckie |
| 399.0 | 2.7 | 2.6 | 1.2 | −2322 | −2023 | −1690 | −3989 | −3646 | −3075 | −6122 | −5212 | −4646 | Terespol | lubelskie |
| 400.0 | 3.0 | 2.8 | 1.1 | −2253 | −1954 | −1621 | −4732 | −3811 | −3179 | −6339 | −5246 | −4337 | Zielona Góra | lubuskie |
| 405.0 | 2.6 | 2.4 | 1.4 | −2284 | −1985 | −1652 | −3989 | −3683 | −3057 | −5813 | −5246 | −4317 | Zgorzelec | dolnośląskie |
| 415.0 | 3.3 | 3 | 1.7 | −1860 | −1561 | −1228 | −3633 | −2906 | −2412 | −5070 | −4088 | −3421 | Legnica | dolnośląskie |
| 418.0 | 3.4 | 3 | 1.6 | −1879 | −1580 | −1247 | −3540 | −2865 | −2274 | −5072 | −4430 | −3474 | Leszno | wielkopolskie |
| 424.0 | 3.1 | 2.9 | 1.4 | −2075 | −1776 | −1443 | −3807 | −3217 | −2637 | −5840 | −5151 | −3890 | Wrocław | dolnośląskie |
| 435.0 | 3.7 | 3.4 | 1.6 | −1709 | −1410 | −1077 | −3178 | −2709 | −2093 | −4743 | −4091 | −2992 | Kalisz | wielkopolskie |
| 455.0 | 2.9 | 2.8 | 1.2 | −2231 | −1932 | −1599 | −3893 | −3356 | −2923 | −5694 | −5093 | −4428 | Wieluń | lubelskie |
| 465.0 | 3.3 | 3 | 1.5 | −1955 | −1656 | −1323 | −3905 | −3141 | −2456 | −5033 | −4141 | −3396 | Łódź | łódzkie |
| 469.0 | 3.4 | 3 | 1.7 | −1775 | −1477 | −1144 | −3179 | −2552 | −2088 | −4812 | −3882 | −3053 | Sulejów | łódzkie |
| 488.0 | 2.8 | 2.6 | 1.3 | −2263 | −1964 | −1631 | −4546 | −3805 | −3116 | −5483 | −4903 | −4253 | Kozienice | mazowieckie |
| 495.0 | 2.9 | 2.6 | 1.4 | −2168 | −1869 | −1537 | −4106 | −3627 | −2877 | −5363 | −4719 | −3956 | Lublin-Radawiec | lubelskie |
| 497.0 | 3.7 | 3.5 | 1.6 | −1671 | −1372 | −1039 | −3353 | −2717 | −2007 | −4690 | −3600 | −2802 | Włodawa | lubelskie |
| 500.0 | 2.3 | 2 | 1.5 | −2340 | −2041 | −1708 | −4461 | −3840 | −3162 | −6797 | −5875 | −4714 | Jelenia Góra | dolnośląskie |
| 510.0 | 12.1 | 11.1 | 6.1 | 19,757 | 15,250 | 12,312 | 38,277 | 30,444 | 27,150 | 75,288 | 68,097 | 63,541 | Śnieżka | dolnośląskie |
| 520.0 | 2.8 | 2.3 | 1.8 | −1990 | −1691 | −1358 | −3778 | −3198 | −2513 | −5650 | −4784 | −3665 | Kłodzko | dolnośląskie |
| 530.0 | 2.5 | 2.3 | 1.1 | −2397 | −2098 | −1765 | −4702 | −4269 | −3488 | −6702 | −6013 | −4850 | Opole | opolskie |
| 540.0 | 3.2 | 2.9 | 1.6 | −1949 | −1650 | −1317 | −3751 | −3221 | −2474 | −5168 | −4057 | −3371 | Racibórz | śląskie |
| 550.0 | 2.5 | 2.3 | 1.1 | −2416 | −2117 | −1785 | −4611 | −3747 | −3313 | −6545 | −5661 | −4972 | Częstochowa | śląskie |
| 560.0 | 2.5 | 2.3 | 1.3 | −2354 | −2055 | −1722 | −4489 | −3910 | −3153 | −6041 | −5151 | −4647 | Katowice | śląskie |
| 566.0 | 2.9 | 2.6 | 1.6 | −2033 | −1734 | −1401 | −3717 | −3306 | −2555 | −5276 | −4907 | −3797 | Kraków-Balice | małopolskie |
| 570.0 | 2.8 | 2.5 | 1.4 | −2249 | −1950 | −1618 | −4241 | −3640 | −3076 | −5760 | −5419 | −4496 | Kielce-Suków | świętokrzyskie |
| 575.0 | 1.7 | 1.6 | 0.9 | −2620 | −2321 | −1988 | −4764 | −4329 | −3782 | −7348 | −6040 | −5563 | Tarnów | małopolskie |
| 580.0 | 3.7 | 3.4 | 1.8 | −1522 | −1224 | −891 | −2763 | −2215 | −1651 | −3797 | −3068 | −2276 | Rzeszów-Jasionka | podkarpackie |
| 585.0 | 3.2 | 3 | 1.2 | −2142 | −1843 | −1510 | −4005 | −3688 | −2894 | −5752 | −5039 | −4176 | Sandomierz | świętokrzyskie |
| 595.0 | 3.7 | 3.5 | 1.9 | −1465 | −1166 | −833 | −2927 | −2277 | −1531 | −4043 | −3333 | −2301 | Zamość | lubelskie |
| 600.0 | 2.8 | 2.4 | 1.8 | −1983 | −1684 | −1351 | −3717 | −3144 | −2581 | −5092 | −4447 | −3464 | Bielsko-Biała | śląskie |
| 625.0 | 2.8 | 2.4 | 1.8 | −1982 | −1683 | −1350 | −3620 | −3015 | −2435 | −5041 | −4061 | −3505 | Zakopane | małopolskie |
| 650.0 | 6.4 | 5.9 | 3.1 | 6345 | 5158 | 4096 | 10,824 | 9610 | 9102 | 29,231 | 22,938 | 20,790 | Kasprowy Wierch | małopolskie |
| 660.0 | 1.7 | 1.4 | 1.1 | −2581 | −2282 | −1949 | −4633 | −4110 | −3599 | −6751 | −6074 | −5030 | Nowy Sącz | małopolskie |
| 670.0 | 3.2 | 3 | 1.4 | −2055 | −1756 | −1423 | −3692 | −3242 | −2619 | −5353 | −4574 | −3766 | Krosno | podkarpackie |
| 690.0 | 2.5 | 2.1 | 1.3 | −457 | −391 | −320 | −873 | −745 | −596 | −1286 | −1083 | −856 | Lesko | podkarpackie |
Table 7.
Minimum, maximum, median, and average NPV break-even energy prices for wind farms opened in 2006–2014 (EURO/MWh, fixed 2019 prices); real discount rate 5%.
Table 7.
Minimum, maximum, median, and average NPV break-even energy prices for wind farms opened in 2006–2014 (EURO/MWh, fixed 2019 prices); real discount rate 5%.
| Year | Median Break-Even Price | Average Break-Even Price | Minimum Break-Even Price | Maximum Break-Even Price |
|---|---|---|---|---|
| 2006 | 98.5 | 97.0 | 93.9 | 98.4 |
| 2007 | 94.1 | 94.7 | 86.5 | 100.0 |
| 2008 | 86.3 | 84.8 | 68.0 | 90.9 |
| 2009 | 105.8 | 105.2 | 98.2 | 115.7 |
| 2010 | 97.9 | 96.2 | 82.8 | 111.0 |
| 2011 | 99.5 | 97.1 | 81.9 | 111.3 |
| 2012 | 100.6 | 97.5 | 75.9 | 106.6 |
| 2013 | 88.9 | 90.9 | 83.3 | 113.8 |
| 2014 | 88.4 | 89.3 | 78.9 | 104.1 |
| All years | 97.9 | 94.7 | 68 | 115.7 |
Table 8.
Minimum, maximum, median, and average NPV break-even energy prices for wind farms opened in 2006–2014 (EURO/MWh, fixed 2019 prices); real discount rate 7%.
Table 8.
Minimum, maximum, median, and average NPV break-even energy prices for wind farms opened in 2006–2014 (EURO/MWh, fixed 2019 prices); real discount rate 7%.
| Year | Median Break-Even Price | Average Break-Even Price | Minimum Break-Even Price | Maximum Break-Even Price |
|---|---|---|---|---|
| 2006 | 103.4 | 102.3 | 100.0 | 103.4 |
| 2007 | 100.4 | 101.1 | 91.7 | 108.7 |
| 2008 | 93.8 | 91.1 | 73.4 | 97.8 |
| 2009 | 112.2 | 111.0 | 103.2 | 120.6 |
| 2010 | 104.0 | 101.3 | 87.1 | 114.7 |
| 2011 | 105.5 | 102.7 | 86.1 | 116.5 |
| 2012 | 104.6 | 103.3 | 79.7 | 111.0 |
| 2013 | 95.0 | 96.5 | 88.7 | 117.2 |
| 2014 | 93.2 | 94.3 | 84.3 | 110.9 |
| All years | 103.4 | 100.4 | 73.4 | 120.6 |
Table 9.
Minimum, maximum, median, and average NPV break-even energy prices for wind farms opened in 2006–2014 (EURO/MWh, fixed 2019 prices); real discount rate 10%.
Table 9.
Minimum, maximum, median, and average NPV break-even energy prices for wind farms opened in 2006–2014 (EURO/MWh, fixed 2019 prices); real discount rate 10%.
| Year | Median Break-Even Price | Average Break-Even Price | Minimum Break-Even Price | Maximum Break-Even Price |
|---|---|---|---|---|
| 2006 | 112.46 | 111.55 | 109.15 | 112.58 |
| 2007 | 109.75 | 110.05 | 99.53 | 116.09 |
| 2008 | 100.13 | 98.32 | 77.28 | 105.54 |
| 2009 | 121.78 | 119.97 | 112.16 | 125.30 |
| 2010 | 109.45 | 107.95 | 93.51 | 119.34 |
| 2011 | 112.46 | 110.35 | 92.61 | 123.13 |
| 2012 | 111.85 | 108.55 | 85.09 | 114.20 |
| 2013 | 102.23 | 104.34 | 96.52 | 121.51 |
| 2014 | 100.43 | 102.53 | 91.71 | 115.28 |
| All years | 109.75 | 108.4 | 77 | 125.3 |
Publisher’s Note: MDPI stays neutral with regard to jurisdictional claims in published maps and institutional affiliations. |
© 2021 by the authors. Licensee MDPI, Basel, Switzerland. This article is an open access article distributed under the terms and conditions of the Creative Commons Attribution (CC BY) license (http://creativecommons.org/licenses/by/4.0/).
Share and Cite
MDPI and ACS Style
Wyrobek, J.; Popławski, Ł.; Dzikuć, M. Analysis of Financial Problems of Wind Farms in Poland. Energies 2021, 14, 1239. https://doi.org/10.3390/en14051239
AMA Style
Wyrobek J, Popławski Ł, Dzikuć M. Analysis of Financial Problems of Wind Farms in Poland. Energies. 2021; 14(5):1239. https://doi.org/10.3390/en14051239
Chicago/Turabian StyleWyrobek, Joanna, Łukasz Popławski, and Maria Dzikuć. 2021. "Analysis of Financial Problems of Wind Farms in Poland" Energies 14, no. 5: 1239. https://doi.org/10.3390/en14051239
Note that from the first issue of 2016, this journal uses article numbers instead of page numbers. See further details here.