Enabling Stakeholder Decision-Making With Earth Observation and Modeling Data Using Tethys Platform
 E. James Nelson1*
  Sarva T. Pulla2
  Mir A. Matin3
  Kiran Shakya3
  Norm Jones1
  Daniel P. Ames1
  W. Lee Ellenburg2,4
  Kel N. Markert2,4
  Cédric H. David5
  Benjamin F. Zaitchik6
  Patrick Gatlin7
  Riley Hales1
- 1Department of Civil and Environmental Engineering, Brigham Young University, Provo, UT, United States
- 2National Aeronautics and Space Administration Marshall Space Flight Center, SERVIR, Science Coordination Office, Huntsville, AL, United States
- 3International Centre for Integrated Mountain Development (ICIMOD), SERVIR Team, Kathmandu, Nepal
- 4Earth System Science Center, The University of Alabama in Huntsville, Huntsville, AL, United States
- 5Jet Propulsion Laboratory, California Institute of Technology, Pasadena, CA, United States
- 6Department of Earth and Planetary Sciences, John Hopkins University, Baltimore, MD, United States
- 7National Aeronautics and Space Administration Marshall Space Flight Center, Earth Science Branch, Huntsville, AL, United States
Tethys Platform is an open source framework for developing web-based applications for Earth Observation data. Our experience shows that Tethys significantly lowers the barrier for cloud-based app development, simplifies the process of accessing scalable distributed cloud computing resources and leverages additional software for data and computationally intensive modeling. The Tethys software development kit allows users to create web apps for visualizing, analyzing, and modeling Earth Observation data. Tethys platform provides a collaborative environment for scientists to develop and deploy several Earth Observation web applications across multiple Tethys portals. We work in partnership with leading regional organizations world-wide to help developing countries use information provided by earth-observing satellites and geospatial technologies for managing climate risks and land use. This paper highlights the several Tethys portals and web applications that were developed as part of this effort. Implementation of the Tethys framework has significantly improved the Application Readiness Level metric for several NASA projects and the potential impact of Tethys to replicate and scale other applied science programs.
Introduction
SERVIR is a joint initiative of the National Aeronautics and Space Administration (NASA) and the United States Agency for International Development (USAID) that seeks to build the capacity of local decision-makers dealing with a wide range of climate-related problems by making global earth observation data and associated tools available. The SERVIR model brings together regional hubs supported by USAID grants with scientific experts in the areas of Agriculture and Food Security, Water Resources and Hydroclimatic Disasters, Land Cover and Land Use Change and Ecosystems, and Weather and Climate. For example, the NASA Applied Sciences Program funds scientists from United States (US) institutions with the expectation that technology transfer to the hubs and local stakeholders in their regions occurs by the end of the 3-year grant period. The NASA Applied Sciences Program measures research becoming integrated into stakeholder and end-user decision-making using a 9-point Application Readiness Level (ARL) scale where ARL 1 represents basic research and ideas in their infancy to ARL 9 where data, models, and tools are approved, and fully integrated by the stakeholders and have sustained use in making decisions (see Figure 1).
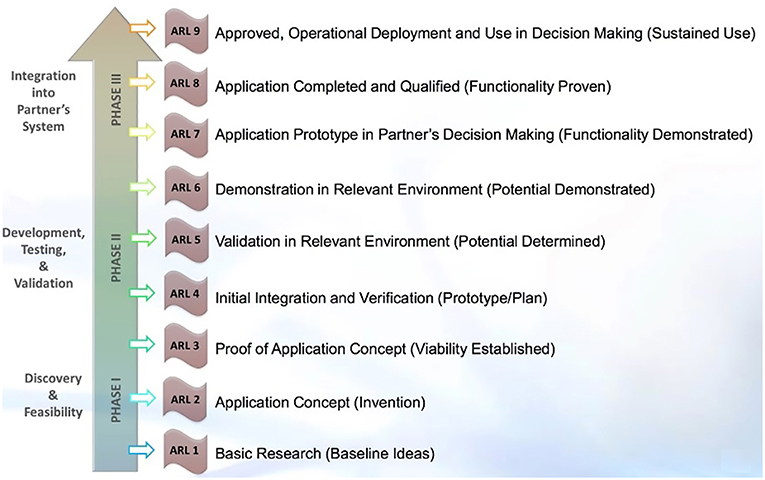
Figure 1. NASA application readiness level scale. Available online at: https://www.nasa.gov/sites/default/files/files/ExpandedARLDefinitions4813.pdf (accessed September 20, 2016).
The hydrologic cycle and other earth systems including the atmosphere and land surface processes are extremely complex integrated systems. Understanding and simulating the hydrologic cycle has been a scientific challenge for many decades, which is further complicated by the vast amount of data, computational horsepower, and human resources it requires (Sood and Smakhtin, 2015). In too many ways and places, our understanding of the hydrologic system is incomplete, and humanity suffers from a lack of information that leads to uninformed decisions. To address this challenge, the NASA/USAID SERVIR program is leveraging advances in earth observations, numerical weather prediction, supercomputing, hydrologic modeling, cloud services, big data visualization, and the collaboration of the scientists that make up the SERVIR Applied Science Team (AST).
The term “Big Data” has been used variously to describe the massive and growing quantity of data available for scientific research, as well as advanced machine learning methods for interpreting and deriving meaning from extremely large databases. When considering the massive datasets themselves—before attempting to automatically extract relationships and predictions from the data—it is critical but also challenging to achieve basic data management and visualization. This problem is exacerbated by the variety of often domain-specific file formats and software tools that have evolved to support these data.
For example, within the hydrologic modeling community, time-series oriented data is often stored in simple text files or Microsoft Excel files. The Consortium of Universities for the Advancement of Hydrologic Science (CUAHSI) has developed networked database systems using web services to advance data storage and sharing beyond these simple methods (Tarboton et al., 2009; Ames et al., 2012; Kadlec et al., 2015; Horsburgh et al., 2016). Additionally, the Open Geospatial Consortium (OGC) has promulgated data structure and storage standards such as WaterML and TimeseriesML (OGC, 2012). However, even with these developments over the past decade, much time series hydrology data continues to be stored and shared using less efficient and outdated methods. In the atmospheric sciences, multivariate flexible data and file format standards such as NetCDF (Rew and Davis, 1990) are commonly used. And, in the case of earth observations data, the Hierarchical Data Format (HDF) has been widely adopted (Folk et al., 1999). This distinction between time series and spatially-oriented data has been termed a “digital divide” and various efforts have been undertaken to integrate spatial and temporal data standards, thereby “crossing” this digital divide (Maidment et al., 2010; Salas et al., 2012).
While tight integration of spatial (e.g., earth observation) and temporal (e.g., hydrologic observations) data in a unified data model and associated file format would be a potentially optimal solution to this earth systems science big data problem, another point-of-view on the challenge is to maintain original datasets in their “native” file formats and rather, develop visualization and analysis tools that can work with these formats directly. This is the approach that has largely been adopted by SERVIR Hubs working to make earth science data actionable for decision-makers and stakeholders. Indeed, various web application technologies exist to support such decision-support tools that operate on spatial and temporal data. For example, Esri Story Maps technology has been used for community outreach in the SERVIR program (Adams et al., 2016) and Esri ArcGIS Online technology has been used to develop interactive flood inundation forecast and mapping tools (Souffront Alcantara, 2018). In addition to these well-established commercial tools for web application development, a number of custom tools built on open source web technologies have recently been presented in the literature for the analysis and visualization of large spatial and temporal data sets (Brendel et al., 2019; da Costa et al., 2019; González et al., 2019; Markert et al., 2019; Strömbäck et al., 2019). The remainder of this paper explores the use of a relatively new big data visualization web application development toolkit called Tethys Platform and its adoption and use within the SERVIR community. Tethys Platform was developed to help lower barriers to web application development in water and environmental modeling (Swain et al., 2016) and has been used successfully as an open source data portal in several applications (Ames et al., 2018; Jackson et al., 2018; Markert et al., 2018; Souffront Alcantara et al., 2018).
Tethys Platform
In the era of big data, desktop computing is not efficient or sustainable, which has the benefit of leveling the computational and decision-making landscape for stakeholders, especially in developing countries where the resources to maintain hardware, software, and technical capacity is limited. International development and relief agencies pour millions into strengthening capacity of water resources managers with often only a small return on investment, because while initial investment in cyberinfrastructure and training may yield working systems, the ability of the receiving countries/agencies to maintain the systems is limited. Figure 2 illustrates the cyberinfrastructure requirements for developing good hydrologic information from earth observation and modeling resources. At the center are computational resources that must have internet access and bandwidth to continually update both in situ and remotely sensed data along with numerical weather predictions that are used to drive hydrologic and hydraulic models.
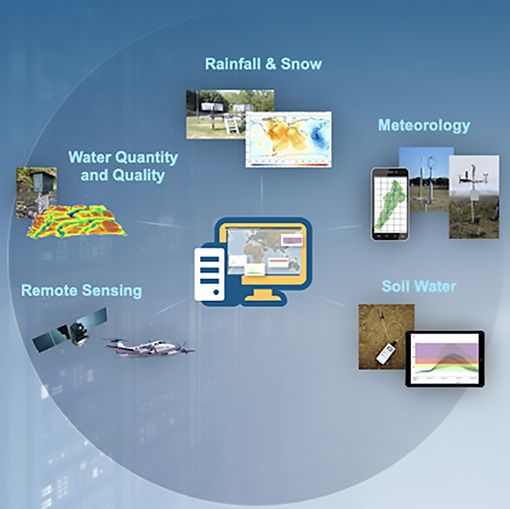
Figure 2. Cyberinfrastructure requirements for hydrologic information development.
The challenge is that there remains a heavy burden to both stand up such systems as well as operate and maintain them in such a way that actionable information is sufficiently reliable to enable informed decision making for national hydrometeorological services. Even after making the investment of such systems, a large amount of the effort and resources are expended just to produce the information necessary to make good decisions. Cloud computing has become a powerful and affordable solution that can aid in shifting the decision-making responsibilities of local agencies from one of developing the reliable hydrologic information needed for informed decision-making to one of focusing on the application and decision-support tools that are populated with established hydrologic information services from reliable sources (see Figure 3).
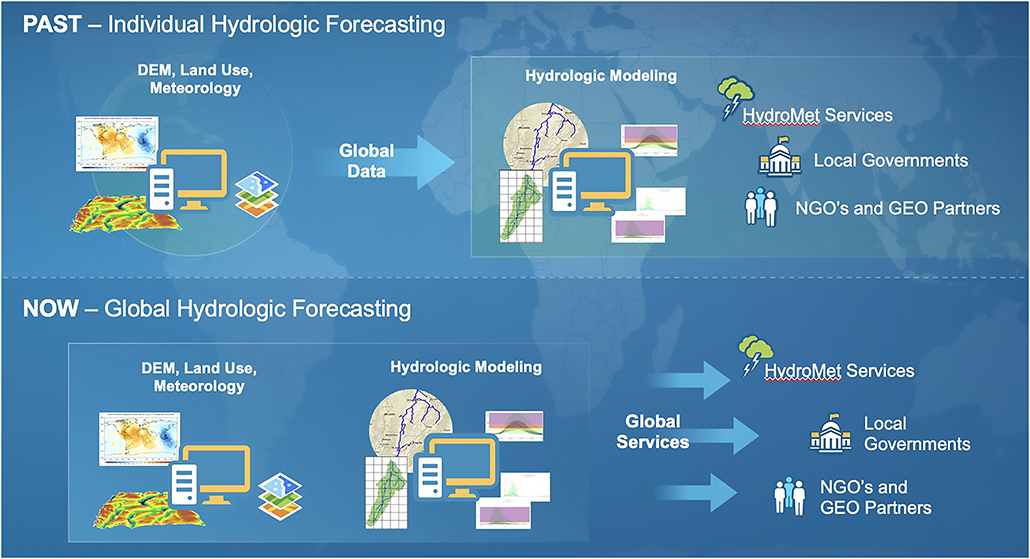
Figure 3. Disruptive technologies for hydrologic information delivery.
Tethys Platform is a web-based app development framework for rapid deployment of end-user-focused tools that follow modern, consistent, scalable, cross-platform, reusable, web programming paradigms. Tethys is a relatively new software system built on commonly used web programming frameworks (e.g., Django, GeoServer, PostGIS, and OpenLayers). It is stable and supported by a growing user and developer community. Tethys Platform leverages recent advances in cloud computing to facilitate better use of large earth observation data sets and water resource models as decision-making tools. These modeling and visualization tools can be hosted on a server and used by multiple remote users via a web interface, which eliminates the need to procure and maintain high performance hardware typically required by models. Further, it deals with issues related to software installation and platform incompatibilities (Mac vs. PC vs. Linux, etc.), monitor and install software updates, or download large data sets; problems that are exacerbated in regions where financial and technical capacity can be limited. An internet connection and a web browser are all that is required to access the models and associated data, which means challenges associated with downloading data and updating software are not a barrier to sustainable use.
The Tethys Platform software architecture is illustrated in Figure 4. Tethys is built on the Django framework and Python programming language—significantly lowering the barrier for app development (Swain et al., 2016). Tethys Platform apps are hosted in a Tethys Portal and are intended to ease the burden of science information access by enabling web based interaction with spatial resources stored in repositories such as the commercial ArcGIS Online or open source approaches such as GeoServer and Openlayers (Swain et al., 2016). The base of the system is the Tethys Software Development Kit (SDK) which integrates a broad suite of open source tools for rapid development of web-based water resource data and modeling applications. The Tethys software suite includes components for distributed computing, spatial publishing, geoprocessing, spatial data management, and visualization. It includes external connections for cloud computing and dataset storage and supports integration of both open source components (GeoServer, OpenLayers, etc.) and proprietary systems (ArcGIS Online, ArcGIS Server, and ArcGIS JavaScript Mapping API) so that applications for stakeholders within collaborative organizations such as SERVIR can be custom-tailored to address a variety of needs and circumstances.
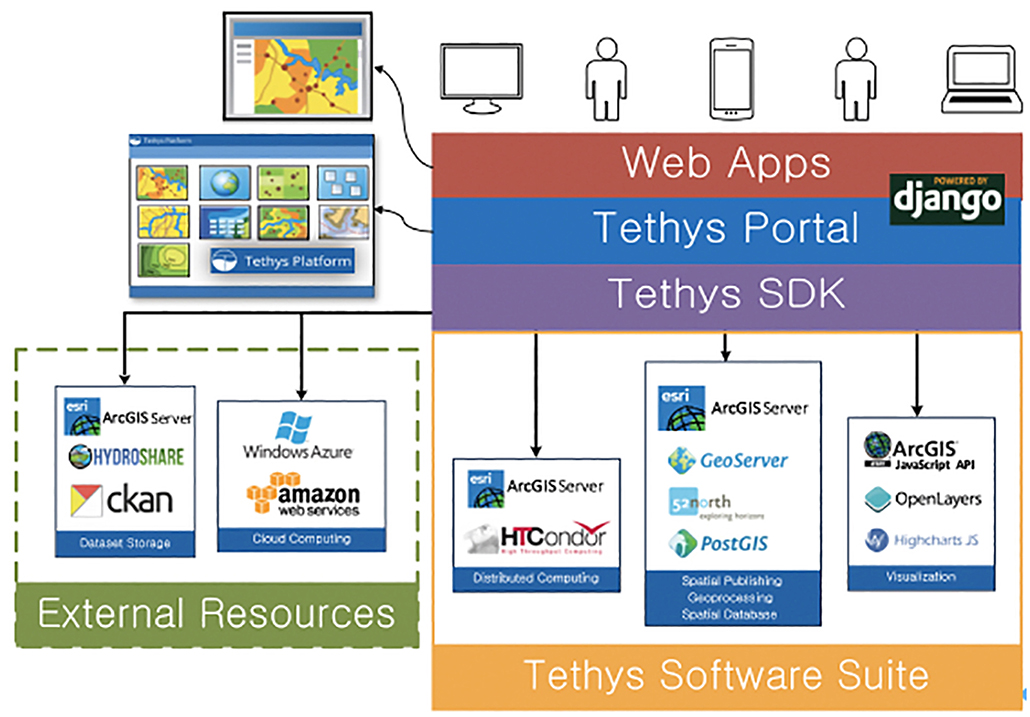
Figure 4. Tethys platform cloud-based app architecture for delivering SERVIR decision support tools.
App views, or web pages, use the Django templating language, but the Tethys framework provides a base template that includes a standard layout for app pages with areas for a header, navigation links, action buttons, and primary content rather than requiring developers to start from scratch with each template using Django. This reduces the amount of repetitive coding required for developing web apps and also leads to a familiar user interface experience.
Tethys Portal is the Tethys Platform component that provides the primary runtime environment for Tethys web apps. It is implemented as a Django website project and it extends Django capabilities to provide the core website functionality that is often taken for granted in modern web applications. It includes a user account system complete with user profiles and a password reset mechanism for forgotten passwords. It also provides a landing page that presents the associated Tethys Platform instance and an app library page that provides an access point for installed apps. It includes an administrator backend that can be used to manage user accounts, permissions, link to elements of the software suite, and customize the instance. This architecture and the associated apps have been developed at BYU and also now being used by the SERVIR Global science coordination office (Figure 5).
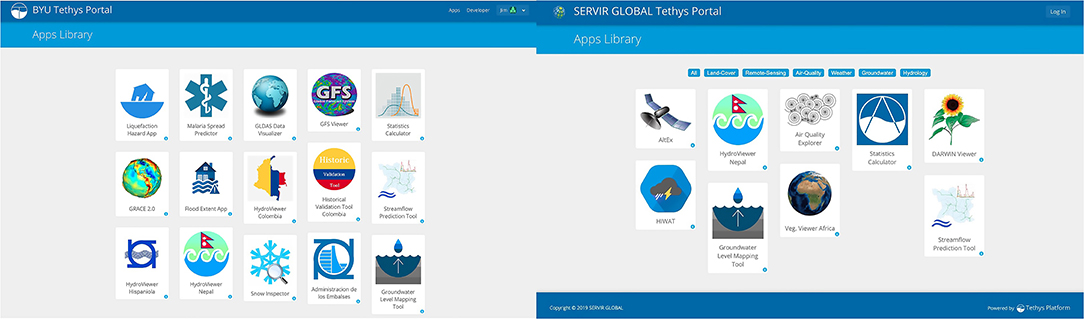
Figure 5. BYU Tethys portal (Left) and SERVIR global Tethys portal (Right).
SERVIR—HKH Applied Science Team
Tethys Platform, described above, has been used extensively to support SERVIR Hub data visualization and dissemination, and as the basis for several regional decision support tool. In particular, we have applied this technology to support the Hindu Kush Himalayan (HKH) SERVIR region. This region is often referred as a disaster hotspot due to increasing geophysical and hydro-meteorological events resulting in growing loss of lives and livelihood support systems. The region accounts for 36% (940 out of 2,564) of disaster events in Asia between 1900 and 2015 (Guha-Sapir, 2009). Flooding is the most prominent disaster that affects all the countries in the region (Shrestha and Pradhan, 2015). International Center for Integrated Mountain Development (ICIMOD) is a regional intergovernmental organization that aims to support sustainable development in the HKH region through information and knowledge generation and sharing and evidence-based decision making to reduce the impact of climate change. ICIMOD hosts the SERVIR HKH hub serving five countries including Afghanistan, Bangladesh, Myanmar, Nepal, and Pakistan. The aim is to enhance the capacity of relevant institutes and people to use earth observation and geospatial technology-based solutions in four service areas, including agriculture and food security, water resources and hydroclimatic disasters, land use landcover and ecosystem, and weather and climate.
To better serve the HKH countries, a series of consultation and assessments were conducted to understand their needs and capacities. Flood early warning was identified as one of the key priorities by all of the countries. However, the existing capacity and type of information needs varied by government agencies, community organizations, and countries. Early warning and transboundary flow were identified as key needs in Bangladesh for both riverine and flash flood. In Nepal, both riverine flood and flash flood warnings were identified as priorities. At present, all the countries are familiar with the Global Flood Awareness System (GLOFAS) to support their flood warning service (Alfieri et al., 2013). However, because of the coarse resolution of the GLOFAS-based forecasts, they are applicable to only a few major river systems. SERVIR promotes the use of earth observations and builds capacity in the region by linking projects of the NASA AST to the region's needs.
The SERVIR AST projects in the HKH region aim to enhance the capacity of ICIMOD to better serve the stakeholders flood early warning needs. In this context, the AST team brings the tools and models to address the modeling and information gaps and build capacity of ICIMOD to address the needs of its stakeholders. The ICIMOD team engages with users and stakeholders to develop customized dissemination tools, build capacity of stakeholders and validate the model results. The following sections describe the four primary AST projects and how each was able to leverage the Tethys Platform to provide a consistent and easy to use system for water management and forecasting of both floods and long-term storage and drought.
South Asia Streamflow Prediction From ECMWF Ensemble Forecasts
A high-density large-scale streamflow prediction system covering South Asia was developed using the GloFAS runoff, ERA Interim data, and the RAPID routing model with sufficient detail to provide local forecasts where decisions are made. The workflow to generate these forecasts was deployed completely on the cloud. Two principal Tethys web applications exist to interact with the results, while a REST application programmer interface (API) has also been developed to easily retrieve data without the need of a web interface. GloFAS is an ensemble hydrologic model that generates 51 different runoff forecasts for the major rivers of the world on a global grid with a resolution of 16 km2 on a continuous basis. A 52nd forecast is generated at a resolution of 8 km2. GloFAS was released in 2011 by ECMWF and the European Commission's Joint Research Center (JRC) as part of the Copernicus Emergency Management Services and has been operational since July 2011. The GloFAS system is composed of an integrated hydrometeorological forecasting chain and of a monitoring system that analyzes daily results and shows forecast flood events on a dedicated web platform (Alfieri et al., 2013). This model uses real-time and historical observations in combination with a Data Assimilation System (DAS) and a Global Circulation Model (GCM). The underlying framework used to create GloFAS is ECMWF's Integrated Forecasting System (IFS). GloFAS uses the HTESSEL for its land surface scheme. HTESSEL is a hydrologically revised version of the Tiled ECMWF Scheme for Surface Exchanges over Land (TESSEL) model (Balsamo et al., 2009). This new land surface scheme corrected the absence of a surface runoff component in its predecessor, among other minor improvements.
The ERA-Interim data is the result of a global atmospheric reanalysis produced also by ECMWF. This data covers from January 1980 to December 2014 (35 years) for the entire globe. One of the advantages of using reanalysis is that the data provides a global view that encompasses many essential climate variables in a physically consistent framework, with only a short time delay (Dee et al., 2011). This type of data becomes invaluable in areas where no actual observed data are available and provides a surrogate in regions where no historical observations are available. A runoff derivative of this atmospheric reanalysis was produced on a 40 km2 global grid using a land surface model simulation in HTESSEL.
Streamflow Prediction Tool Tethys App
The Streamflow Prediction Tool was created as part of the initial experiment to produce higher resolution results on stream networks in the United States (Snow, 2015). The application now provides support for global watersheds and is the primary web application used for visualization and dissemination through an Application Programming Interface (API) to develop customized solutions (see Figure 6).
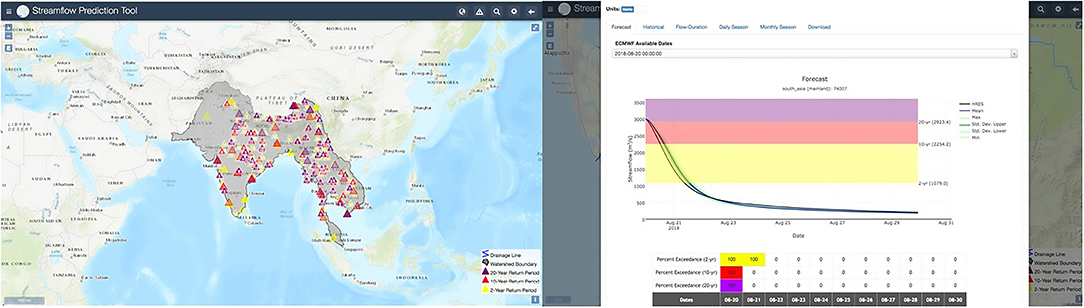
Figure 6. Tethys streamflow prediction tool for visualization and dissemination of the 15-day ECMWF ensemble global forecasts.
Nepal Streamflow Prediction System Tethys App
As an alternate to accessing the entire South Asia stream networks, or any of the larger modeled regions, a custom viewer for a specific country or region can be developed through the API. In this case a national model for Nepal was created as a separate Tethys web application so that it could be customized for use by the Department of Hydrology and Meteorology (DHM). The streamflow network is derived from the subset of the larger South Asia network and then using the unique ID of each river the API to retrieve a streamflow forecast or retrospective historical simulation can be retrieved and displayed. In this instance in order to make the application more responsive a workflow updates a local database of all streams through the API each day as they are computed and then in real time the app accesses forecasts from the local database rather than through the API. Additional layers which indicate important geographic references to provinces and districts have been added as could any other layer's functionality as needed by the specific stakeholders (see Figure 7).
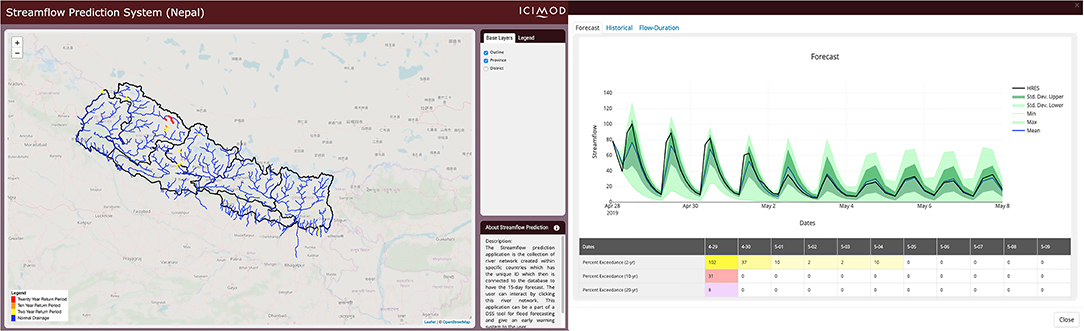
Figure 7. Nepal streamflow prediction system derived from the global streamflow prediction tool.
Bangladesh Transboundary Flow Tethys App
Bangladesh is a country that sits at the downstream of the Ganges and Brahmaputra rivers, while the country itself represents only about 8% of the entire drainage area belonging to those two major networks. Because of this there are repeated floods whose flows originate upstream and out of the country such that good information is difficult to obtain. Because of this the most important need was to have an application that provided the streamflow forecast at these two major transboundary locations along with other minor river networks that also originate outside the country. The ECMWF ensemble forecasts enabled through the streamflow prediction tool API along with a Tethys application that displays the forecasts at each of the transboundary rivers allows the Bangladesh Flood Forecast and Warning Center (FFWC) access to a probabilistic forecast with 15 days of lead time that can be used in downstream hydraulic and flood mapping applications (see Figure 8).
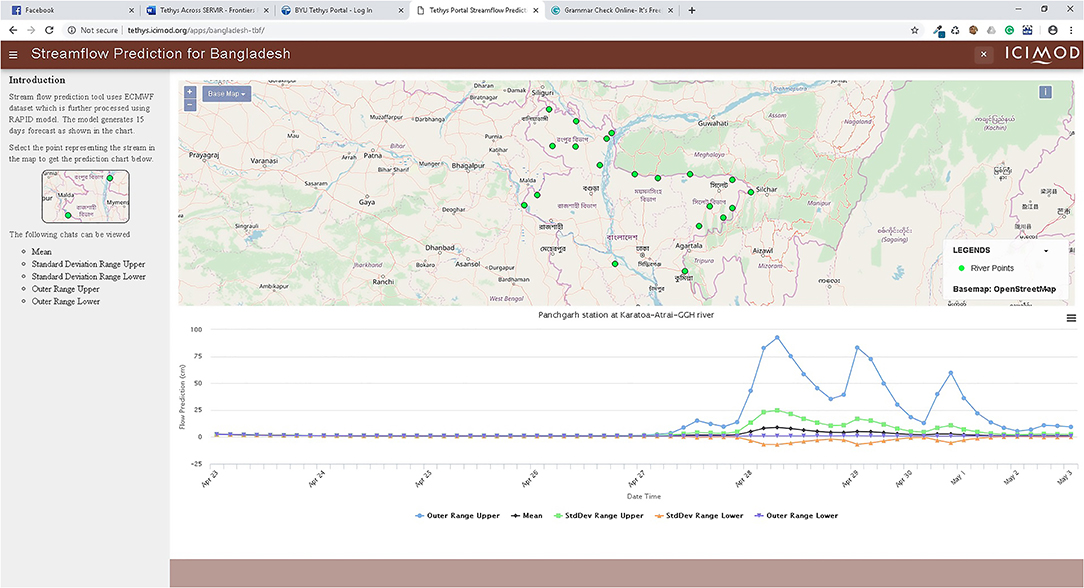
Figure 8. Bangladesh transboundary flows Tethys application.
The HKH Sub-seasonal-to-seasonal Hydrological Forecast System (HKH-S2S)
The HKH and downstream areas in South Asia experience some of the most significant sub-seasonal to seasonal (S2S) variability on earth. The South Asian monsoon is both the lifeblood of the region and a source of significant hazard. Its precipitation sustains agriculture, feeds mountain snowpack and glaciers, and replenishes surface and groundwater resources. But torrential monsoon rains triggers floods and landslides, sub-seasonal monsoon dry spells can cause crops to fail, and years of weak monsoon can endanger food and water security across the region. S2S prediction of HKH meteorology is a grand challenge for atmospheric research and modeling, but significant progress has been made in recent years. Forecasts like those produced by the NASA Global Modeling and Assimilation Office (GMAO) and the NOAA Climate Prediction Center (CPC) now offer meaningful skill that can be applied to disaster preparedness and water and agriculture management. This is particularly true when these atmospheric forecasts are applied to predict hydrological conditions, including drought outlooks and estimates of S2S flood risk. Hydrological forecasts derive skill both from the S2S meteorological prediction and from accurate estimates of initial hydrological conditions, including water storage in snow and soil moisture, so an S2S hydrological forecast can be more skillful than the meteorological forecast that drives it (see Figure 9).
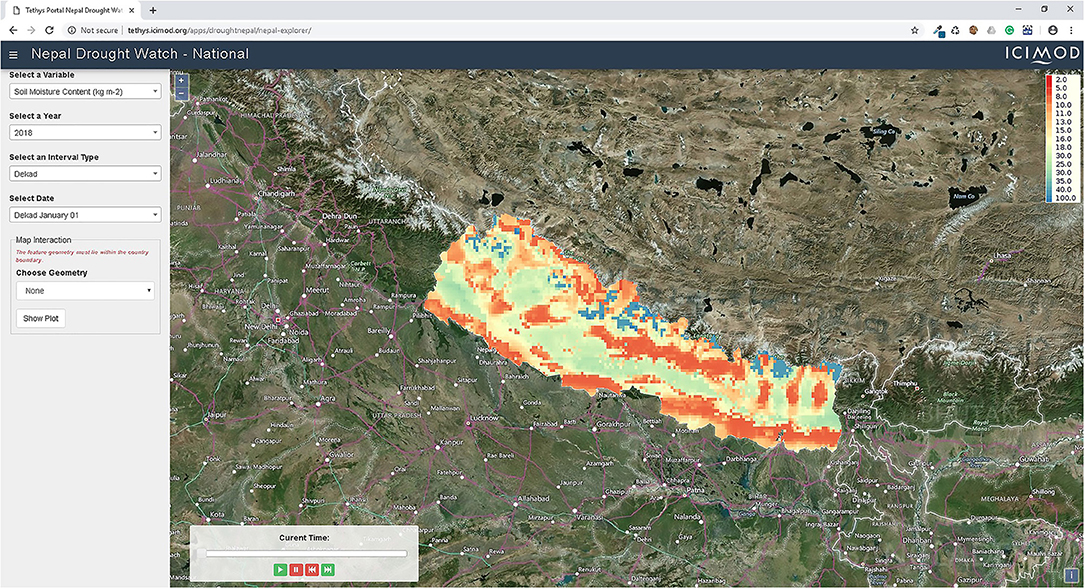
Figure 9. Nepal drought watch—national Tethys application.
Recognizing this potential, HKH-S2S makes use of a land data assimilation system (LDAS)—in this case, the South Asia Land Data Assimilation System (Ghatak et al., 2018)—to provide near-real time hydrological monitoring. The LDAS consists of a suite of gridded land surface models, parameterized using satellite-derived estimates of vegetation, land use, and other parameters, that draw meteorological forcing from a combination of downscaled Global Data Assimilation System (GLDAS) atmospheric analysis fields and precipitation estimates from the Climate Hazards Group InfraRed Precipitation with Stations (Funk et al., 2014) product. The LDAS also has the capability to assimilate terrestrial water storage anomaly estimates from GRACE and snow-covered area estimates from MODIS. The LDAS provides automated near real-time monitoring, and these monitoring products are disseminated through a Tethys app (Figure 10). The LDAS is also used to provide initial conditions for ensemble S2S forecasts. These ensemble forecasts draw meteorological forcing fields from the NASA GEOS forecast system (other forecasts may be added in the future), downscaled using the Generalized Analog and Regression Downscaling (GARD) tool (Gutmann et al., 2018). The resulting forecasts are used to generate probabilistic forecasts of drought indicators defined in consultation with end users throughout the region. These drought indicators can be accessed as maps and timeseries products via two different Tethys apps that have been created. The national drought monitoring system uses five parameters (soil moisture, precipitation, air temperature, evapotranspiration, and standard precipitation index) from the SALDAS dataset as the drought indicators, which is further grouped in dekad (10 days), monthly and quarterly intervals, making it more relevant as a drought application. The system is highly interactive and can view a historical dataset in time-series, draw points or polygon and view the charts of the interested drought indices. During the SERVIR program, large amounts of climate data has been generated by scientific communities but the use of that data/information by decision makers at local and management levels remain low. In-order to fill the information gap, the drought monitoring system provides a good visualization platform for these drought parameters to meet the diverse needs of decision maker.
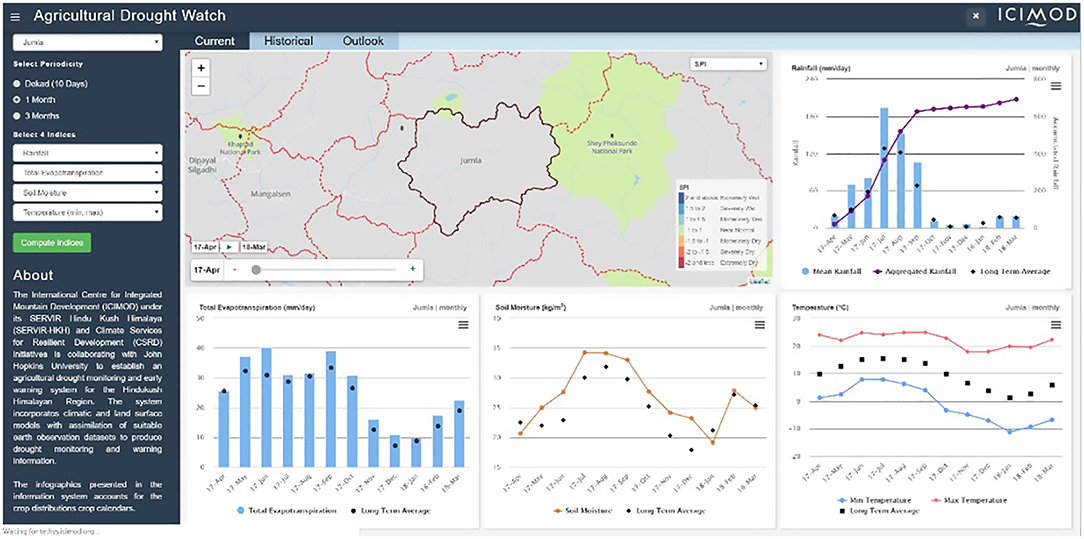
Figure 10. The SERVIR-HKH agricultural drought watch Tethys app.
A second high-level agricultural drought watch Tethys app was created to aggregate data over Nepal Districts (i.e., states) and provide a series of plots with statistics that can be helpful in assessing risk and making plans for agricultural productivity.
Grace
The Gravity Recovery and Climate Experiment (GRACE) mission (Tapley et al., 2004), a collaborative effort between NASA and the German Aerospace Center (DLR), measured monthly anomalies in the Earth's gravity field from 2002 to 2017. Because water has a high density−1,000 kg m−3–changes in terrestrial water storage can be inferred from the gravity anomalies measured by the two twin satellites of GRACE. Note that the total quantity of water integrated vertically at any given place of the Earth is not provided by GRACE, but rather its variations compared to a long-term mean. In other words, GRACE can tell us if there is more or less water than usual (i.e., Terrestrial Water Storage Anomalies: TWSA), but not how much water there actually is (i.e., Terrestrial Water Storage: TWS). GRACE has also proven to be a useful asset in estimating the otherwise unknown changes in groundwater storage. To do so, estimates of water storage anomalies—for snow, soil moisture, canopy interception, and surface water—are obtained from numerical models (e.g., GLDAS: Rodell et al., 2004 and removed from the TWSA estimates to extract Groundwater Storage Anomalies (GWSA). The value of such a methodology has been demonstrated in numerous studies (e.g., Rodell et al., 2009; Famiglietti et al., 2011; Castle et al., 2014) and is therefore mature for water management applications. Yet, the analysis involved in the combination of hydrological models and satellite observations is complex and has been a barrier for the broader use of GRACE-based estimates of Terrestrial Water Storage or Groundwater Storage Anomalies.
An open-source software specifically tailored for the joint analysis of GRACE and GLDAS data was therefore developed to ease the access to satellite-based water availability assessment. The software allows for the generation of on-the-fly estimates of storage anomalies for the various components of the hydrologic cycle and only requires the description of the study domain—in the form of a shapefile—as input. A specific Tethys Application was then developed to allow web-based servicing and exploration of the data (Figure 11). The app displays aggregate times series and raster animations of GRACE-derived water storage anomalies for selected subregions. It displays results derived using the JPL, CSR, and GFZ signal processing methods (Frappart et al., 2010, 2011). It also displays the surface water and soil moisture storage components obtained from the GLDAS model (Syed et al., 2008). The groundwater storage component is found by subtracting the surface water and soil moisture components from the total water storage obtained from the GRACE data.
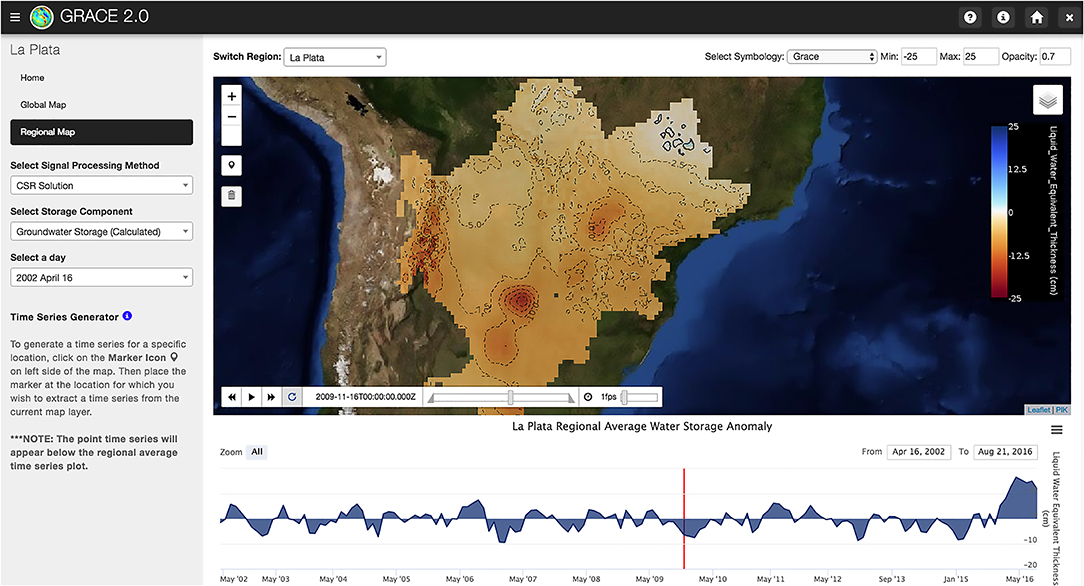
Figure 11. GRACE Tethys app illustrating groundwater storage anomaly for the La Plata Basin in South America.
High Impact Weather Assessment Toolkit (HIWAT)
The High Impact Weather Assessment Toolkit (HIWAT) was designed for filling a gap in weather forecasting services across the HKH region. In particular, HIWAT provides high resolution, probabilistic-based forecasts of extreme weather hazards (e.g., damaging winds/tornadoes, hail, lightning and flash flooding). To do this, HIWAT utilizes the Weather Research and Forecasting (WRF) model (Skamarock et al., 2008) in the framework of the Unified Environmental Modeling System (UEMS) (NWS, 2018), which is a collection of scripts that facilitate a relatively simple means for managing the workflow of numerical weather prediction (NWP). HIWAT consists of a 12-member ensemble WRF configuration that includes several combinations of four microphysical and three planetary boundary layer parameterizations relevant to thunderstorm initiation and evolution. To further capture the range of possible forecast solutions, each ensemble member uses a different initial and boundary condition provided by the NCEP Global Ensemble Forecast System (Zhou et al., 2017). Each HIWAT HKH member uses a 12-km resolution outer domain over South Asia to downscale the GEFS initial/boundary conditions to a 4-km resolution convection-allowing model domain over Nepal and Bangladesh.
A demonstration of HIWAT over the HKH region was conducted during the pre-monsoon and monsoon seasons of 2018. The objective was to assess the capability and utility of HIWAT for enhancing early warning services in the region. A Tethys application was developed to facilitate efficient forecast product interpretation (Figure 12). One of the most useful features of this application is its data interrogation capabilities, thereby enabling decision-makers to readily assess where, what time and the probability of thunderstorm-related hazards during the forecast period. This interactive app enables the user to select a point (or draw a polygon) anywhere on the map to interrogate the hourly forecasts data. Hence a decision-maker (e.g., operational weather forecaster) can quickly assess where strong storms can be expected during the first 24-h in the region from eastern Nepal, across northern Bangladesh to northeast India and central Bangladesh. Going a step further, the user can also quickly ascertain frequent lightning, hail and damaging winds can be expected in northern Bangladesh.
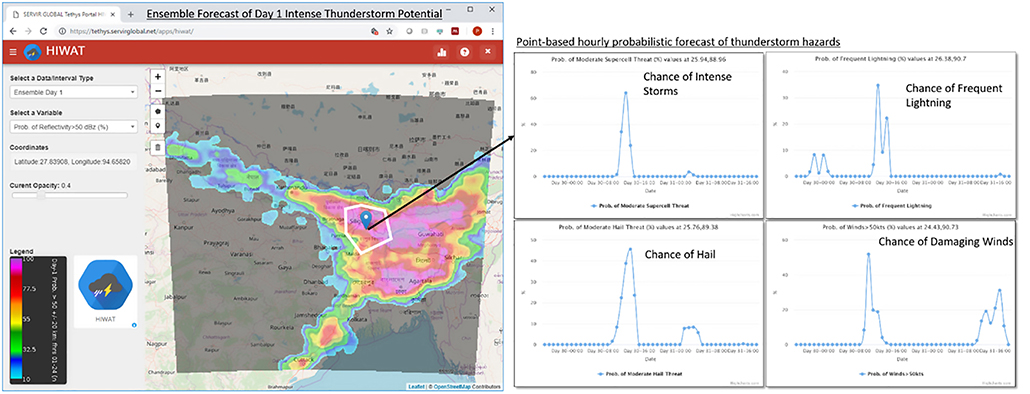
Figure 12. Tethys-based application for HIWAT ensemble forecast weather hazards.
SERVIR Science Coordination
Given the low barrier to development as well as the replicability of current applications and the success amongst principal investigators assigned to the SERVIR-HKH hub, the SERVIR Science Coordination Office (SCO) has leveraged the Tethys platform to support existing applications, deployment of regional Tethys portals beyond the HKH, and application development for hubs and global services. The demand for web applications from other regions supporting SERVIR services has grown and the Tethys application enables quick prototyping and deployment of the applications within the portal framework leading to additional Tethys portals in all of SERVIR's hubs (Figure 13).
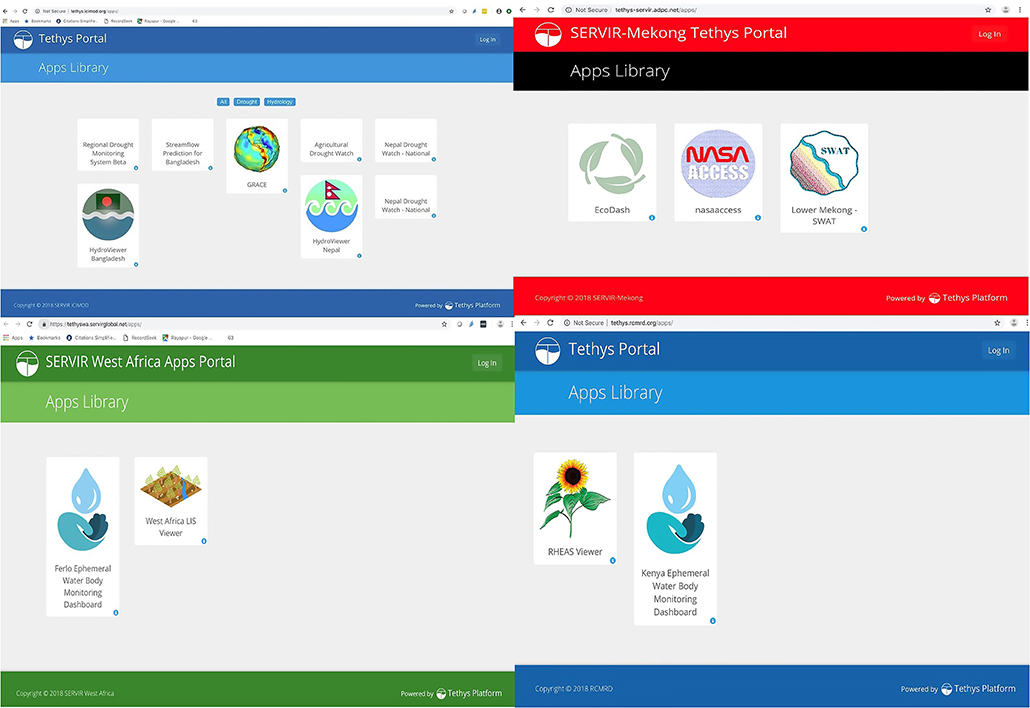
Figure 13. Tethys portals for SERVIR regional hubs. (top left) ICIMOD http://tethys.icimod.org/apps (top right) ADPC http://tethys-servir.adpc.net (bottom left) AGRHYMET (bottom right) http://tethys.rcmrd.org.
In the case of East and Southern Africa, RCMRD is running a complex coupled land surface crop model within an assimilation framework call the Regional Hydrologic Extremes Assessment System (RHEAS) (Andreadis et al., 2017). RHEAS was developed as part of an AST project and is used to support national ministries in East and Southern Africa in monitoring and forecasting drought and its impact on agriculture. The RHEAS system is run in a Linux environment in a command line interface, making it not ideal for end-users in the region. Tethys Platform is being used to efficiently access the RHEAS database (PostGIS) and visualize both the land surface components in a user-friendly geographical interface. Though still in development, Figure 14 shows both components of the RHEAS output visualization. The portal allows the user to inspect the land surface outputs, generate, plot and download time series data. On the crop model page, the app generates the ensemble spread of crop yield by county for the season at hand. Another case that the SERVIR SCO has supported with the hubs is the reimplementation of the EcoDash (Poortinga et al., 2018) and the Mekong Suspended Sediment application into Tethys Platform.
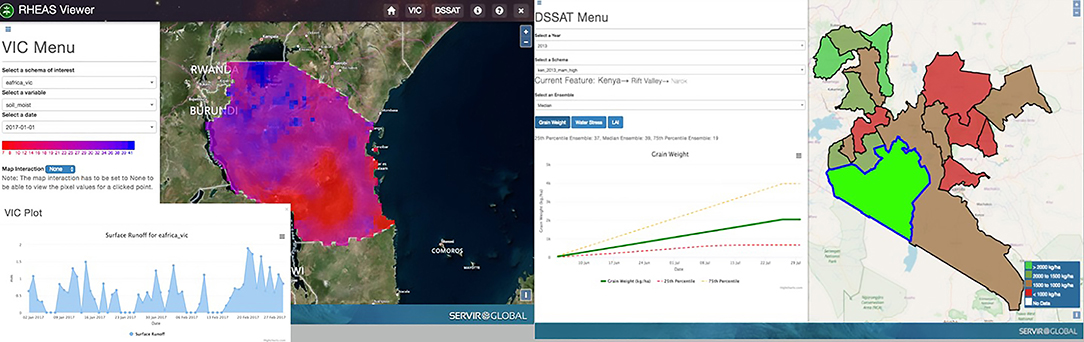
Figure 14. Tethys-based application for the visualization of RHEAS outputs. The portal allows for the display and inspection of land surface outputs such as drought onset, standardized precipitation, or soil moisture (Left) and crop yield trends and water stress (Right).
As a global application provided by the SERVIR SCO to the hubs and the Earth science community, the Altimetry Explorer (AltEx) (Markert et al., 2019) was developed using Tethys to make global water levels data derived from altimetry data available to stakeholders. The AltEx application automatically extracts Jason-2 and Jason-3 data from data sources and allows users to dynamically select overpass segments to display water level data. Figure 15 displays the AltEx user interface where a water layer is provided, users select a start and end point on the altimetry ground track that intersect with water, and the extracted water level time series is provided. This application is also API enabled allowing users programmatically query the application and use the returned water level data for other use. As future needs for global services and regional applications arise the SERVIR SCO will continue to support the development and use of Tethys within the SERVIR network.
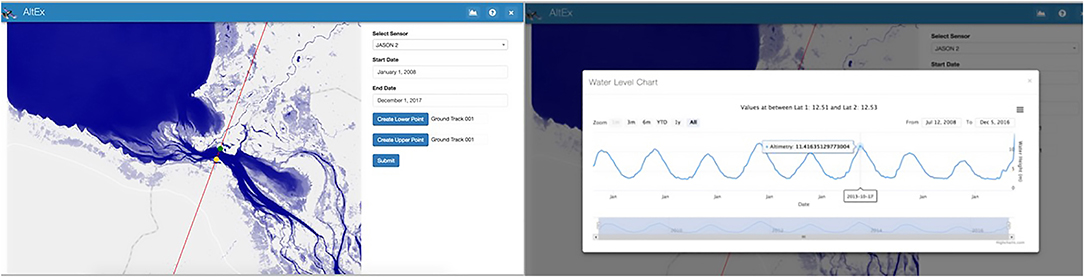
Figure 15. AltEx web application user interface over Tonle Sap, Cambodia (Left) and water level chart as rendered in AltEx web application (Right). Figure taken from Markert et al. (2019).
Conclusions and Future Directions
This paper presented and discussed a number of web applications developed by SERVIR AST members primarily using the open source Tethys Platform software development toolkit for accessing, visualizing, analyzing spatial and temporal earth observation data and providing stakeholder decision support. While many tools and technologies exist to support these types of applications, we found that the Tethys Platform did indeed lower many barriers to web app development allowing for team members with a variety of technical backgrounds to actively contribute to creating these apps. The developed tools meet our definition of a “web app” as essentially single function, self-describing, “easy” to use, web-based applications presented in a unified portal. As such, these web apps can be considered significantly distinct from “web pages” inasmuch as these apps are extremely modular and can be installed and uninstalled in different Tethys Portals as needed to support the needs of individual user communities. Some of the apps developed and presented here could be readily deployed and made useful in any of the SERVIR Hubs, however, regionally specific apps, or apps that are focused problems not present in certain hubs, can be installed or installed in specific portals. In all more than 20 Tethys apps were created in support of the applied science developed by all four of the principal investigators of the HKH hub and deployed across five different SERVIR portals as well as the BYU portal.
Because much of this work presented here has only recently been completed, we recognize the lack of extensive user statistics, usability analysis, and other metrics indicating exactly how successful these apps are in supporting on the ground decision making. We anticipate addressing a part of this deficiency in the near future by deploying new versions of the Tethys Portals that integrate web-based analytics code to gather usage statistics and user information. We also anticipate interesting use and usability results to naturally emerge in the form of white papers, and technical reports from the SERVIR Hubs. The wide-ranging use of Tethys within SERVIR in such a short time is evidence of its promise within SERVIR and perhaps across similar applied sciences groups, however it is still early and feedback is needed to further improve its usability for SERVIR and other organizations that which to join the growing community of this open-source project.
In terms of future technical work in this area, we are actively pursuing the development of an “App Warehouse” which will function much like an app store for a mobile device, allowing user communities to readily launch an empty decision support data portal and, through a few clicks and server commands, identify and install apps from a library of Tethys Apps. This work is currently underway as part of the NASA Water Science Team GeoGLOWS project and is expected to yield operational technology within the timeframe of this project. We expect that this new effort will open more doors for both stakeholder communities and also app developers in much the same way that the availability of an app store for mobile devices has resulted in an explosion of mobile apps and app developers. The Tethys App Warehouse will likely host a relatively small number of apps (in comparison to the Apple App Store, for example) but it is expected that this approach can help motivate both the development, deployment, and adoption of earth observation data visualization and decision support tools throughout the developing and developed world.
Software Availability
Tethys Platform:
• Purpose: Integrated package of open source web app development tools and app portal environment targeted toward water and environmental science and engineering.
• Source Code: https://github.com/tethysplatform/tethys.
• Developers: Brigham Young University, independent code contributors, and the Tethys Platform Steering Committee.
• License: Open Source under the BSD 2-Clause “Simplified” License.
• Initially Release Date: 2015.
• Current Release Version: 2.1.
Additional Software Tools:
• All of the apps presented in this paper are provided through open source licenses on the Brigham Young University Hydroinformatics Research Lab github.com repository located at: https://github.com/BYU-Hydroinformatics.
Author Contributions
EN led this project and coordinated the research and writing of this article. SP, MM, KS, NJ, DA, WE, KM, CD, BZ, PG, and RH developed the web applications presented herein, provided intellectual contributions, and contributed to the writing of the article.
Funding
This work was supported by the NASA ROSES SERVIR Applied Research Grant NNX16AN45G and from USAID under SERVIR-HKH. CD was supported by the Jet Propulsion Laboratory, California Institute of Technology under a contract with NASA, including a grant from the SERVIR Applied Sciences Team. The views and interpretations in this paper are those of the authors and are not necessarily attributable to ICIMOD, USAID, NASA, or BYU.
Conflict of Interest
The authors declare that the research was conducted in the absence of any commercial or financial relationships that could be construed as a potential conflict of interest.
References
Adams, E., Flores, A., Muench, R., Coulter, D., Limaye, A., and Irwin, D. (2016). “Using Esri story map technology to demonstrate SERVIR global success stories,” in AGU Fall Meeting Abstracts (San Francisco, CA).
Alfieri, L., Burek, P., Dutra, E., Krzeminski, B., Muraro, D., Thielen, J., et al. (2013). GloFAS–global ensemble streamflow forecasting and flood early warning. Hydrol. Earth Syst. Sci. 17, 1161–1175. doi: 10.5194/hess-17-1161-2013
Ames, D. P., Horsburgh, J. S., Cao, Y., Kadlec, J., Whiteaker, T., and Valentine, D. (2012). HydroDesktop: web services-based software for hydrologic data discovery, download, visualization, and analysis. Environ. Model. Softw. 37, 146–156. doi: 10.1016/j.envsoft.2012.03.013
Ames, D. P., Jones, N., and Nelson, J. (2018). “Rapid web app development to enable earth science data visualization and analysis using Python and Tethys platform,” in AGU Fall Meeting Abstracts (Washington, DC).
Andreadis, K. M., Das, N., Stampoulis, D., Ines, A., Fisher, J. B., and Granger, S. (2017). The regional hydrologic extremes assessment system: a software framework for hydrologic modeling and data assimilation. PLoS ONE 12:e0176506. doi: 10.1371/journal.pone.0176506
Balsamo, G., Beljaars, A., Scipal, K., Viterbo, P., Van den Hurk, B., Hirschi, M., et al. (2009). A revised hydrology for the ECMWF model: Verification from field site to terrestrial water storage and impact in the Integrated Forecast System. J. Hydrometeorol. 10, 623–643. doi: 10.1175/2008JHM1068.1
Brendel, C. E., Dymond, R. L., and Aguilar, M. F. (2019). An interactive web app for retrieval, visualization, and analysis of hydrologic and meteorological time series data. Environ. Model. Softw. 117, 14–28. doi: 10.1016/j.envsoft.2019.03.003
Castle, S. L., Thomas, B. F., Reager, J. T., Rodell, M., Swenson, S. C., and Famiglietti, J. S. (2014). Groundwater depletion during drought threatens future water security of the Colorado River Basin. Geophys. Res. Lett. 41, 5904–5911. doi: 10.1002/2014GL061055
da Costa, R. T., Manfreda, S., Luzzi, V., Samela, C., Mazzoli, P., Castellarin, A., et al. (2019). A web application for hydrogeomorphic flood hazard mapping. Environ Model Softw. 118, 172–186. doi: 10.1016/j.envsoft.2019.04.010
Dee, D. P., Uppalla, S. M., Simmons, A. J., Berrisford, P., Poli, P., Kobayashi, S., et al. (2011). The ERA-Interim reanalysis: configuration and performance of the data assimilation system. Q. J. R. Meteorol. Soc. 137, 593–597. doi: 10.1002/qj.828
Famiglietti, J. S., Lo, M., Ho, S. L., Bethune, J., Anderson, K. J., and Syed, T. H. (2011). Satellites measure recent rates of groundwater depletion in California's Central Valley. Geophys. Res. Lett. 38, 1–4. doi: 10.1029/2010GL046442
Folk, M., Mcgrath, R. E., and Yeager, N. (1999). “HDF: an update and future directions,” in IEEE 1999 International Geoscience and Remote Sensing Symposium. IGARSS'99 (Cat. No. 99CH36293) (Hamburg: IEEE), 273–275.
Frappart, F., Ramillien, G., Leblanc, M., Tweed, S. O., Bonnet, M.-P., and Maisongrande, P. (2011). An independent component analysis filtering approach for estimating continental hydrology in the GRACE gravity data. Remote Sens. Environ. 115, 187–204. doi: 10.1016/j.rse.2010.08.017
Frappart, F., Ramillien, G., Maisongrande, P., and Bonnet, M.-P. (2010). Denoising satellite gravity signals by independent component analysis. IEEE Geosci. Remote Sens. Lett. 7, 421–425. doi: 10.1109/LGRS.2009.2037837
Funk, C. C., Peterson, P. J., Landsfeld, M. F., Pedreros, D. H., Verdin, J. P., Rowland, J. D., et al. (2014). A quasi-global precipitation time series for drought monitoring. US Geol. Surv. Data Series 832, 1–12. doi: 10.3133/ds832
Ghatak, D., Zaitchik, B., Kumar, S., Matin, M., Bajracharya, B., Hain, C., et al. (2018). Influence of precipitation forcing uncertainty on hydrological simulations with the NASA South Asia land data assimilation system. Hydrology 5, 1–22. doi: 10.3390/hydrology5040057
González, A., Gleeson, J., and Mccarthy, E. (2019). Designing and developing a web tool to support strategic environmental assessment. Environ. Model. Softw. 111, 472–482. doi: 10.1016/j.envsoft.2018.10.014
Guha-Sapir, D. (2009). EM-DAT: The Emergency Events Database [Online]. Available online at: https://www.emdat.be/, https://www.emdat.be/database. (accessed March 2019).
Gutmann, E., Hamman, J., Eidhammer, T., and Clark, M. (2018). “Evaluating downscaling methods,” in EGU General Assembly Conference Abstracts (Vienna), 20.
Horsburgh, J. S., Aufdenkampe, A. K., Mayorga, E., Lehnert, K. A., Hsu, L., Song, L., et al. (2016). Observations data model 2: a community information model for spatially discrete earth observations. Environ. Model. Softw. 79, 55–74. doi: 10.1016/j.envsoft.2016.01.010
Jackson, E. K., Estep, E., Nelson, J., and Perez, F. (2018). An open source hydropower feasibility web application for the dominican republic. Open Water J. 5:2. Available online at: https://scholarsarchive.byu.edu/openwater/ vol5/iss1/2
Kadlec, J., Stclair, B., Ames, D. P., and Gill, R. A. (2015). WaterML R package for managing ecological experiment data on a CUAHSI HydroServer. Ecol. Informatics. 28, 19–28. doi: 10.1016/j.ecoinf.2015.05.002
Maidment, D., Salas, F., Domenico, B., and Nativi, S. (2010). “Crossing the digital divide: connecting GIS, time series and space-time arrays,” AGU Fall Meeting Abstracts (San Francisco, CA).
Markert, K. N., Pulla, S. T., Lee, H., Markert, A. M., Anderson, E. R., Okeowo, M. A., et al. (2019). AltEx: an open source web application and toolkit for accessing and exploring altimetry datasets. Environ. Model. Softw. 117, 164–175. doi: 10.1016/j.envsoft.2019.03.021
Markert, K. N., Pulla, S. T., Limaye, A. S., Lee, H., Saah, D. S., Ate, P., et al. (2018). “Towards democratization of water related data in developing regions using cloud computing and open source geospatial web applications,” AGU Fall Meeting Abstracts (Washington, DC).
NWS (2018). Unified Environmental Modeling System. National Weather Service Science and Training Resource Center.
Poortinga, A., Clinton, N., Saah, D., Cutter, P., Chishtie, F., Markert, K. N., et al. (2018). An operational before-after-control-impact (BACI) designed platform for vegetation monitoring at planetary scale. Remote Sens. 10:760. doi: 10.3390/rs10050760
Rew, R., and Davis, G. (1990). NetCDF: an interface for scientific data access. IEEE Comput. Graph. Appl. 10, 76–82. doi: 10.1109/38.56302
Rodell, M., Houser, P. R., Jambor, U., Gottschalck, J., Mitchell, K., Meng, C. J., et al. (2004). The global land data assimilation system. Bull. Am. Meteorol. Soc. 85, 381–394. doi: 10.1175/BAMS-85-3-381
Rodell, M., Velicogna, I., and Famiglietti, J. S. (2009). Satellite-based estimates of groundwater depletion in India. Nature 460, 999–1002. doi: 10.1038/nature08238
Salas, F., Boldrini, E., Maidment, D., Nativi, S., and Domenico, B. (2012). Crossing the digital divide: an interoperable solution for sharing time series and coverages in earth sciences. Nat. Hazards Earth Syst. Sci. 12, 3013–3029. doi: 10.5194/nhess-12-3013-2012
Shrestha, A. B., and Pradhan, N. S. (2015). “Strengthening flash flood risk management in the Hindu Kush Himalayas,” in Building Resilience to Water-Related Disasters in the Asia-Pacific Region of the 7th World Water Forum (Kathmandu: ICIMOD).
Skamarock, W. C., Klemp, J. B., Dudhia, J., Gill, D. O., Barker, D., Duda, M. G., et al. (2008). A Description of the Advanced Research WRF Version 3. NCAR Technical Note NCAR/TN-475+STR.
Snow, A. (2015). Downscaling ECMWF Global Runoff Datasets Using Geoprocessing Tools and RAPID to Produce Highresolution Stream Forecasts. Provo, UT: Master of Science, Brigham Young University.
Sood, A., and Smakhtin, V. (2015). Global hydrological models: a review. Hydrol. Sci. J. 60, 549–565. doi: 10.1080/02626667.2014.950580
Souffront Alcantara, M. A. (2018). A Flexible Service-Oriented Approach to Address Hydroinformatic Challenges in Large-Scale Hydrologic Predictions. Ph.D. Dissertation, Brigham Young University, Provo, Utah.
Souffront Alcantara, M. A., Kesler, C., Stealey, M. J., Nelson, E. J., Ames, D. P., and Jones, N. L. (2018). Cyberinfrastructure and web apps for managing and disseminating the national water model. J. Am. Water Resour. Assoc. 54, 859–871. doi: 10.1111/1752-1688.12608
Strömbäck, L., Pers, C., Strömqvist, J., Lindström, G., and Gustavsson, J. (2019). A web based analysis and scenario tool for eutrophication of inland waters for Sweden and Europe. Environ. Model. Softw. 111, 259–267. doi: 10.1016/j.envsoft.2018.07.012
Swain, N. R., Christensen, S. D., Snow, A. D., Dolder, H., Espinoza-Dávalos, G., Goharian, E., et al. (2016). A new open source platform for lowering the barrier for environmental web app development. Environ. Model. Soft. 85, 11–26. doi: 10.1016/j.envsoft.2016.08.003
Syed, T. H., Famiglietti, J. S., Rodell, M., Chen, J., and Wilson, C. R. (2008). Analysis of terrestrial water storage changes from GRACE and GLDAS. Water Resour. Res. 44, 1–15. doi: 10.1029/2006WR005779
Tapley, B. D., Bettadpur, S., Ries, J. C., Thompson, P. F., and Watkins, M. M. (2004). GRACE measurements of mass variability in the earth system. Science 305, 503–505. doi: 10.1126/science.1099192
Tarboton, D. G., Horsburgh, J. S., Maidment, D. R., Whiteaker, T., Zaslavsky, I., Piasecki, M., et al. (2009). “Development of a community hydrologic information system,” in 18th World IMACS Congress and MODSIM09 International Congress on Modelling and Simulation, Modelling and Simulation Society of Australia and New Zealand and International Association for Mathematics and Computers in Simulation (Cairns, QLD), 988–994.
Keywords: Tethys platform, earth observations, decision-making, hydroinformatics, SERVIR
Citation: Nelson EJ, Pulla ST, Matin MA, Shakya K, Jones N, Ames DP, Ellenburg WL, Markert KN, David CH, Zaitchik BF, Gatlin P and Hales R (2019) Enabling Stakeholder Decision-Making With Earth Observation and Modeling Data Using Tethys Platform. Front. Environ. Sci. 7:148. doi: 10.3389/fenvs.2019.00148
Received: 06 May 2019; Accepted: 17 September 2019;
Published: 09 October 2019.
Edited by:
Niall Patrick Hanan, New Mexico State University, United StatesReviewed by:
Nidhi Nagabhatla, United Nations University Institute for Water Environment and Health, CanadaYang Hong, University of Oklahoma, United States
Copyright © 2019 Nelson, Pulla, Matin, Shakya, Jones, Ames, Ellenburg, Markert, David, Zaitchik, Gatlin and Hales. This is an open-access article distributed under the terms of the Creative Commons Attribution License (CC BY). The use, distribution or reproduction in other forums is permitted, provided the original author(s) and the copyright owner(s) are credited and that the original publication in this journal is cited, in accordance with accepted academic practice. No use, distribution or reproduction is permitted which does not comply with these terms.
*Correspondence: E. James Nelson, jimn@byu.edu