
3D IoT System for Environmental and Energy Consumption Monitoring System


1
Instituto Universitário de Lisboa (ISCTE-IUL), ISTAR, 1649-026 Lisboa, Portugal
2
INOV INESC Inovação, Instituto de Novas Tecnologias, 1000-029 Lisboa, Portugal
*
Author to whom correspondence should be addressed.
Sustainability 2021, 13(3), 1495; https://doi.org/10.3390/su13031495
Submission received: 26 December 2020
/
Revised: 16 January 2021
/
Accepted: 25 January 2021
/
Published: 1 February 2021
(This article belongs to the Special Issue Emerging Energy Technologies and Energy Savings)
Abstract
:Energy consumption in buildings depends on the local climate, building characteristics, and user behavior. Focusing on user interaction, this research work developed a novel approach to monitoring and interaction with local users by providing in situ context information through graphic descriptions of energy consumption and indoor/outdoor environment parameters: temperature, luminosity, and humidity, which are routinely measured in real-time and stored to identify consumption patterns and other savings actions. To involve local users, collected data are represented in 3D color representation using building 3d models. A simplified color scale depicts environmental comfort (low/comfortable/high temperature/relative humidity) and energy consumption (above/below usual patterns). We found that these indices induced user commitment and increased their engagement and participation in saving actions like turning off lights and better management of air conditioning systems.
1. Introduction
Buildings account for a significant share of energy consumption and related CO2 emissions worldwide. The construction industry, comprising construction and operation, accounts for 30% to 40% of worldwide energy use, [1,2,3]. The use of fossil fuel-generating fuels leads to CO2 emissions and induces air pollution and global warming. S. W. Hadley et al. [4] used a climate prediction model to project temperature changes up to 2025 and the results showed that the lowest predicted temperature variation would result in a 1.09 quadrillion British thermal units (BTU’s) energy increase for building cooling/heating. While renewable energy consumption and energy usage can have a positive effect on a country’s GDP (gross domestic product), fossil fuel energy consumption has a significantly negative impact [5]. To make buildings more efficient and sustainable, common approaches focus on optimization of building control systems using automation rules and dashboard visualization as B. Mataloto et al. [6] did with an Building Management System, or other IoT systems focused on energy management such as in [7,8]. User interaction with monitoring systems can have a significant impact not only in energy savings, but also modeling people’s behavior [9] and creating sustainable users communities [10].
The energy savings and economic performance of building energy are subject to uncertainties such as weather variations [11], construction operations [12,13], shifts in human behavior [14,15], and changes in government policy, [16,17]. The behavior of the occupants is known to have a significant influence on energy consumption [18] and is one of the most critical uncertainties concerning energy saving on buildings. Owens and Wilhite [19], concluded that about 10–20% of domestic energy usage in Nordic countries could be saved by influencing occupant actions alone. According to a study of the energy behavior of householders by Yohanis Y. G. [14], substantial energy savings can be achieved by improving the perception of energy spending. The work of O. Guerra Santin et al. [15] also showed the importance of occupant behavior in the use of energy for space and water heating in the Netherlands. Furthermore, occupant behavior in buildings has been generally recognized as a major factor leading to differences between the measured and simulated energy consumption in buildings [20,21,22,23]. These and other studies have shown that occupant actions can have a substantial effect on energy usage in buildings as well as on the saving potential of building retrofitting. Most studies, however, are based on human surveys.
Although there are many solutions based on Information and Communication Technologies (ICT’s) that process the construction of energy consumption data, there is a lack of investment in user involvement and on strategies that make it easy to understand, promote interaction among users and encourage behavioral changes. Several advantages have been highlighted such as inspiring people, enhancing their knowledge, increasing their awareness [24], improving standard usage practices, encouraging green and sustainable behavior, minimizing energy bills [25] or achieving financial advantages [26]. Since tangible benefits are absent, however, user engagement is not guaranteed [27]. The key reasons behind this emerge from the fact that while a great deal of data is collected around buildings, users do not understand the information [28]. Users, in fact, usually passively experience sensors and are therefore not engaged for long periods [29,30]. These seem to be some of the critical barriers to a concrete breakthrough in energy-saving ICT solutions.
This paper, therefore, proposes a method for user data perception using precise 3D colored models extracted from the facility management building information models (BIM) to deliver data in an easy to read way and provide users with a better reality perception toward energy savings.
2. Literature Review
Thermal and energy optimization, obtained through adequate building orientation, intelligent window choice, and insulation is a critical requirement for new buildings. According to M. Aksoezen et al. [28], buildings over 30 years old and less than 100 years old have the highest energy consumption, reaching up to 19 extra KWh per square meter. H. Ma et al. [31] analyzed the energy consumption of healthcare, office and education buildings and found average consumptions of 195 KWh/m2, 188 KWh/m2, and 103.27 KWh/m2, respectively. Air conditioning systems, lighting, and the building thermal insulation itself were considered the key drivers for these values.
Studies such as those by [6,32,33] on educational buildings had the overall conclusion that heating/cooling systems have a major impact on energy usage, usually related to heat losses on aged buildings. In these studies, regular users cannot or do not know how to use collected information to achieve savings. These factors also have a direct impact on people’s comfort and even air quality when indoor air is not renovated with outside air to increase heating/cooling efficiency when applicable. A. Thewes et al. [32] also described the lack of energy consumption monitoring as a major problem, since having a single meter per building causes energy audits to be less precise and harder to extrapolate into concrete data. The energy sensors developed in our work allow for easy and inexpensive deployment and integration within monitoring systems such as our BIM approach.
As upgrading entire buildings with efficient materials and heating/cooling systems can be very difficult to accomplish, IoT (Internet of Things) systems can help reduce energy waste, in particular, they provide management tools that can be used by users without specific expertise. IoT can be used to control and monitor energy consumptions such as in [34], where energy sensors in a smart home application were employed to collect and send data to the web, giving users remote information on their mobile devices. However, many users do not understand the meaning of energy units such as the kilowatt-hour, thus reducing the value and usability of the information.
W. Ejaz et al. [35] proposed a general framework to accommodate smart city IoT systems, and energy-efficient solutions are described such as lightweight protocols, predictive models for energy consumption, cloud-based approaches, and low-power transceivers. The IoT energy monitoring system developed in [36] used monitoring nodes that collect energy consumption data from current sensors to a local server, displaying information in gauges and charts accessible through a web application, giving the user general consumption values and evolution throughout the day. Most IoT energy-related systems lack user interaction or practical, simple indicators for the general public to understand the provided information. Building information models are currently used mostly for building design and construction purposes [37], for prefabricated constructions, [38], for infrastructure construction projects, or even augmented reality for IoT sensor visualization [39], but this tool can have a major impact on the perception of laypeople concerning the surrounding environment.
When it comes to energy savings and user interaction, 3D BIM models have the potential to connect sensors and people to achieve a new savings paradigm. However, few works have combined these two technologies with user interaction as the focus. A review of BIM and IoT integrations by [40] presented 11 articles about facilities energy management, but none of them were intended for home/user interaction. In [41], the authors used temperature and humidity sensors integrated with BIM models to present a 3D colored map of a room and evaluated fluctuations during the day with results showing, among other findings, major temperature loss near the windows, alerting deficient insulation. A BIM model was also integrated with indoor location sensors in [42] to create a support algorithm for emergency operations. For building management, augmented reality solutions in [43], integrated BIM structural data with the environmental sensor’s data to increase awareness of the energy consumption and environmental conditions, however, the authors only presented a conceptual design of the proposed approach.
As residential and commercial buildings represent almost 40% of the European Union’s total energy consumption in [44], user interaction is essential to explore new ways to save energy. In [45], a concept study was developed using indoor-positioning data to contextualize energy consumption, allowing users to relate activities and rooms to energy values unknown to them previously. In [46], the authors showed that energy consumers understood an interactive visualization tool that allowed energy consumption data manipulation using dynamic graphics. This tool was tested in 12 different homes where participants started to discover specific appliance consumption, and how much energy a determined activity could spend such as using the microwave or air conditioning system. In [9] and [47], authors used a user-centric approach with IoT and BIM models, similar to our work, to interact with users, promoting behavioral changes and people engagement. Another concept work in energy management and savings was developed in [48] as a smart university platform that was able to aggregate the sensor data, environmental data, and data center efficiency, displaying the information on a web service. The system promoted savings using rule-based actions, differing from the other articles when it comes to integrations with the OpenADR standard, allowing future implementation and integration with compatible systems.
3. Internet of Things (IoT) System for Environmental and Energy Consumption Monitoring with 3D Modeling
This work hypothesis was based on the premise that current approaches to energy savings and environmental monitoring at public or even residential buildings lack an understandable information delivery system to the common user. Many users lack the technical expertise to understand energy data charts or indicators. Therefore, an interactive color scheme approach can be used as the medium to extend this type of system usage and increase savings or even change individual and collective behaviors. By identifying other users’ perception, a social and collective sustainable behavior can be achieved, creating a consensus between users in the same location.
To evaluate this hypothesis, this work was divided into individual steps, beginning with the report of the system software and hardware requirements such as sensors, control units, network and data management, followed by the user interactive 3D BIM application, and a pilot at the ISCTE-IUL university campus. Results were collected from the user’s interaction with the application to collect metrics and surveys that evaluates the system usability and impact perception.
3.1. System Architecture
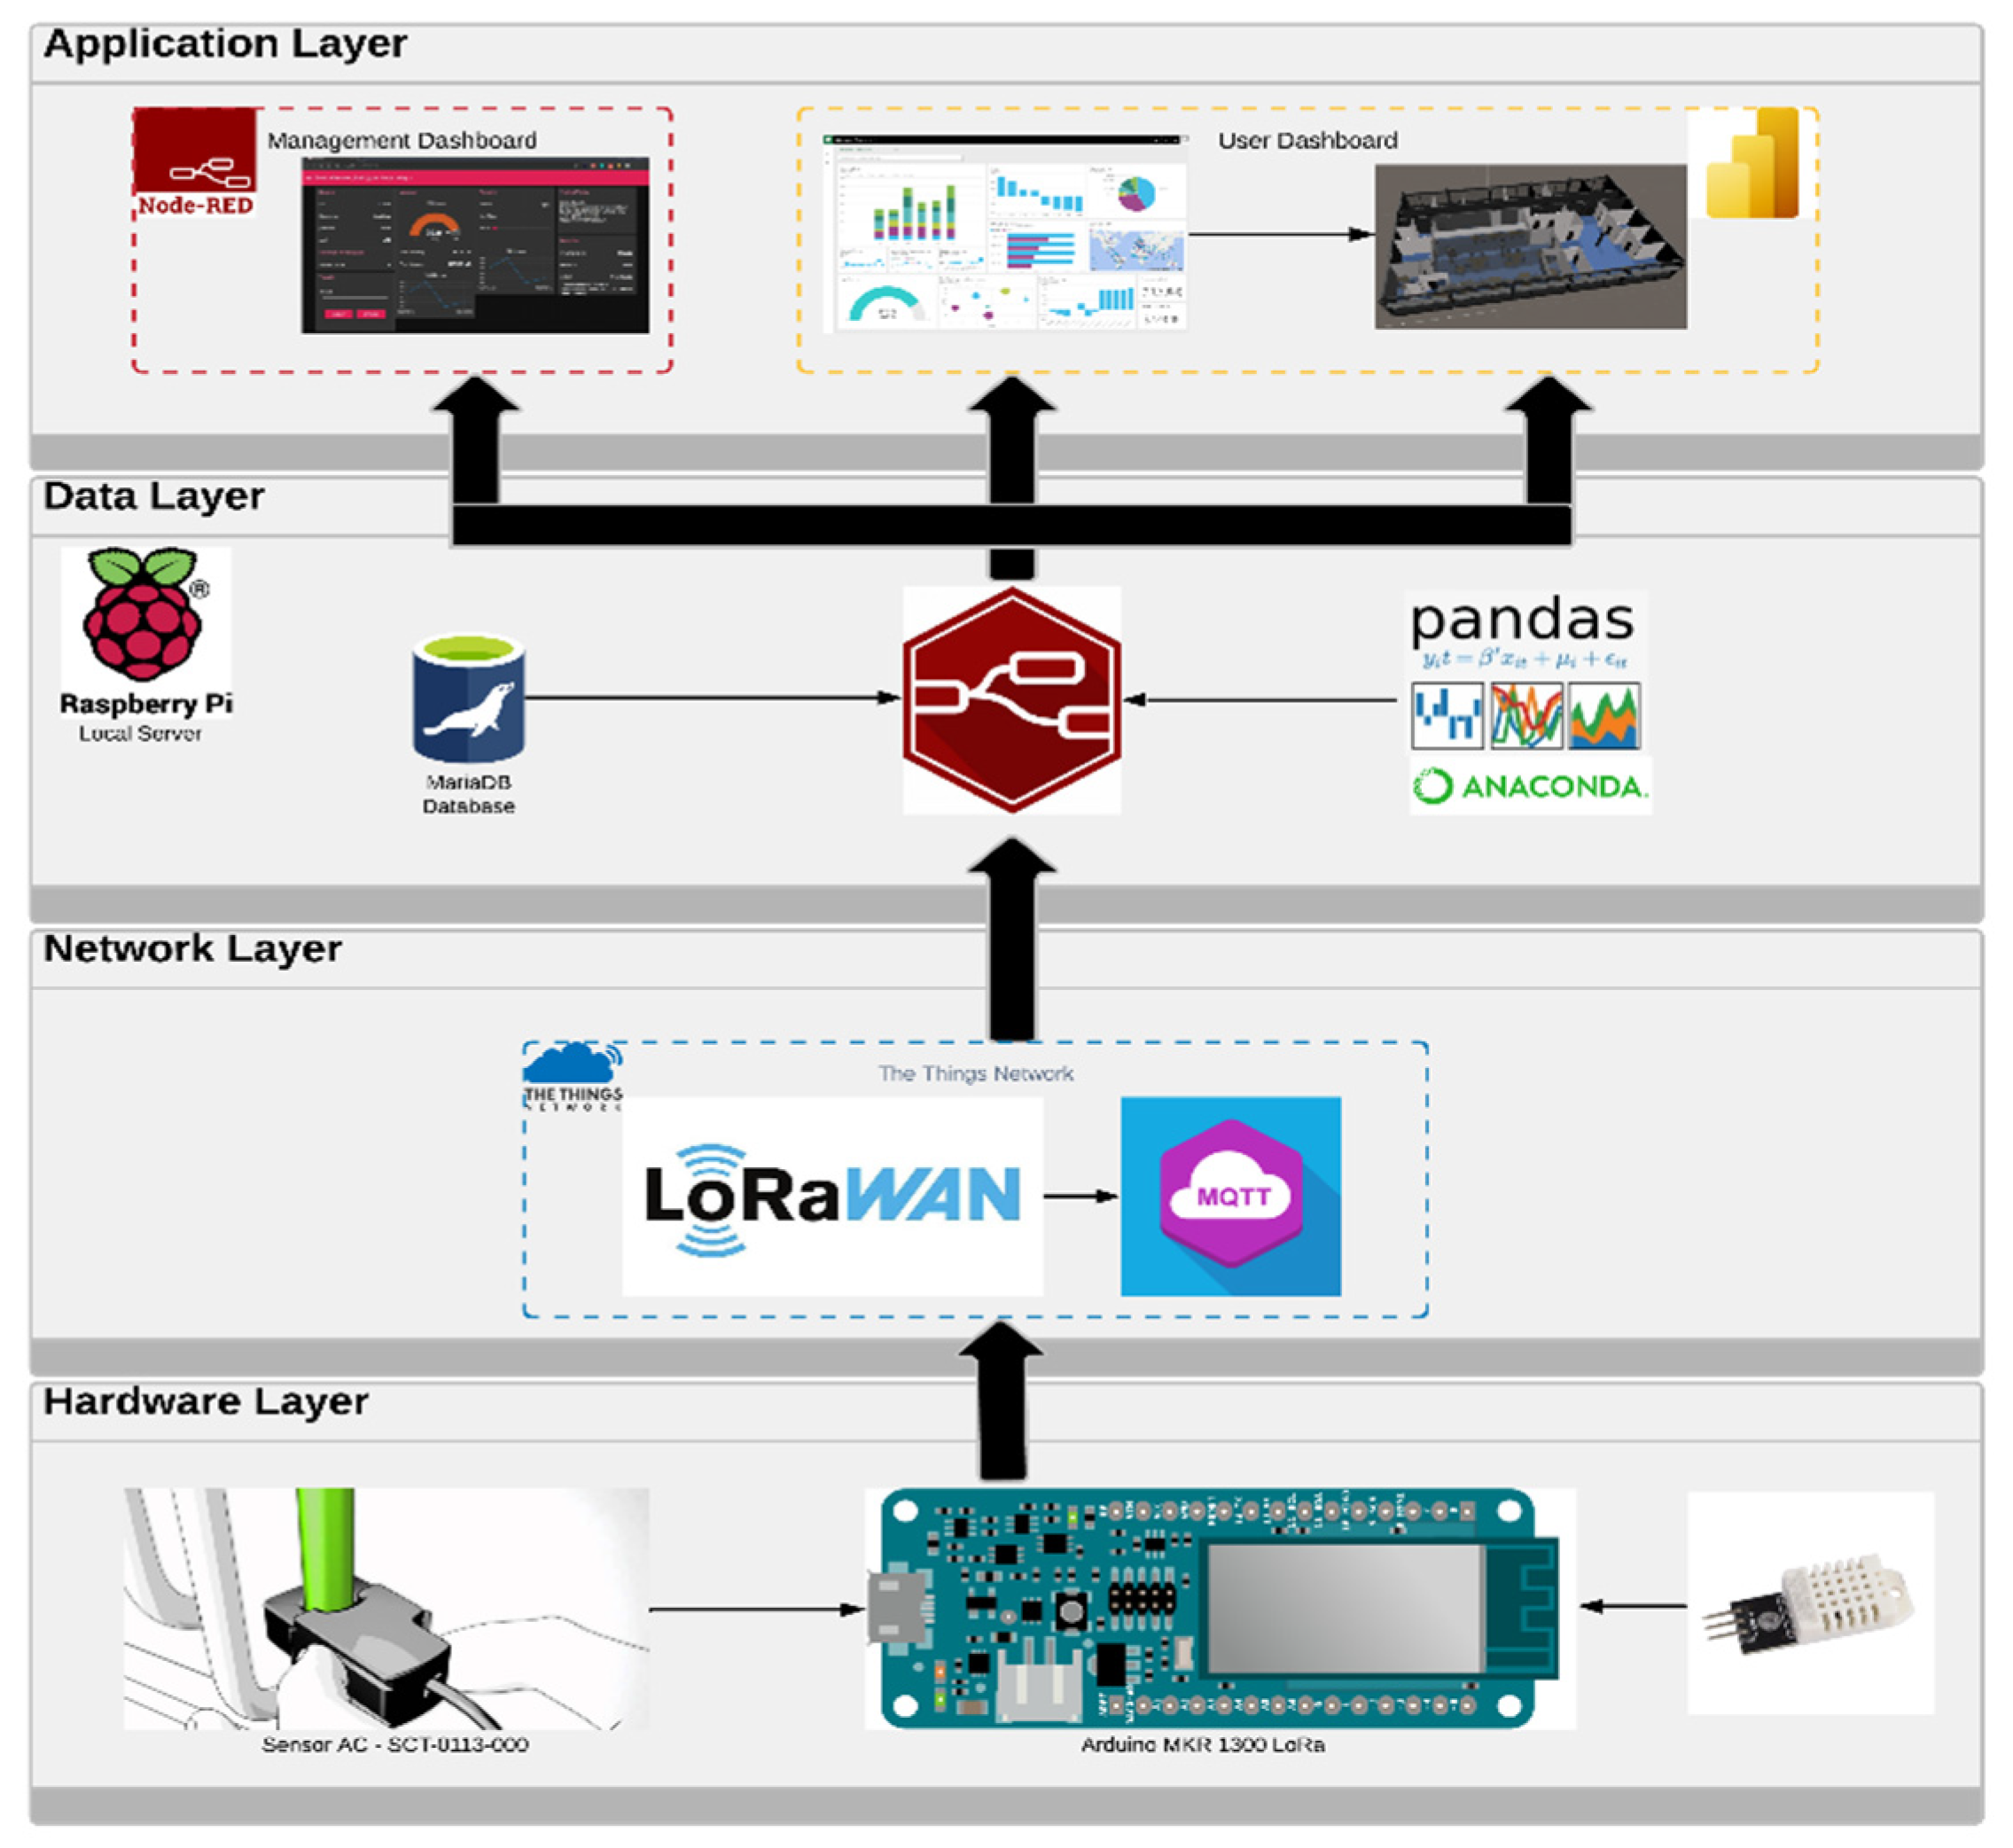
The platform follows the principles of system integration through a common platform for multiple devices, and all these devices transmit data to the platform using Internet of Things (IoT) related technologies. In the definition of the IoT system, the system architecture is divided into four main layers, as shown in Figure 1.
3.2. Hardware Layer
This is the layer that surrounds the physical objects and sensors used to collect the desired data. Two prototypes were developed to collect:
- Environmental conditions and
- Energy consumption.
3.2.1. Environmental Conditions
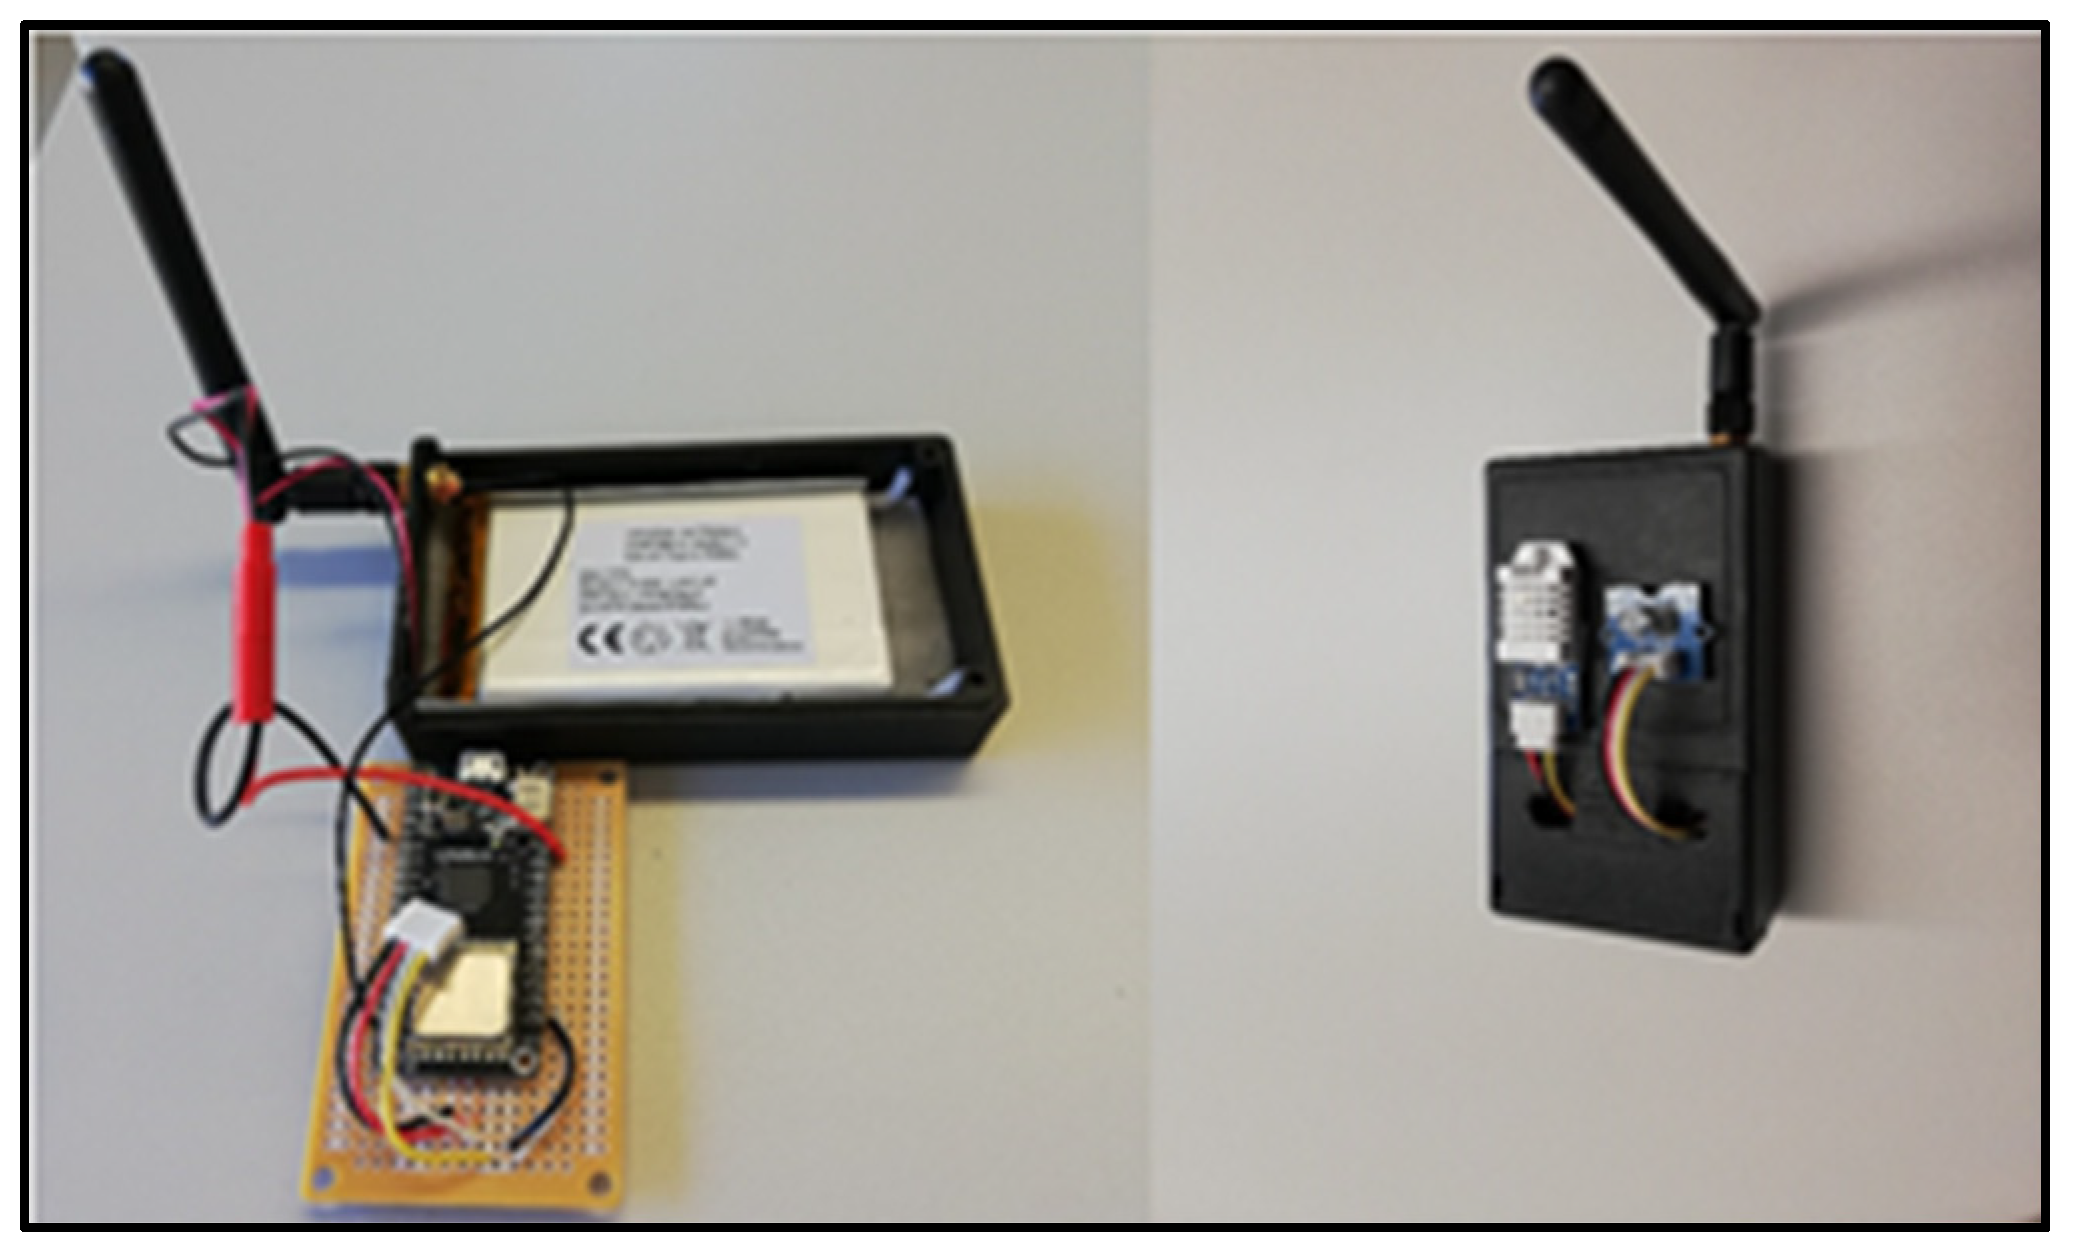
The prototype of the system was developed at ISCTE’s IoT laboratory using a DTH22 sensor that reads temperature and humidity values. Additionally, a BS France LoRa32u4 II microcontroller, which uses the LoRa (Long Range) communication protocol to transmit the data collected by the sensors to the LoRa gateway, was required.
The first tests were performed on a breadboard, as this is more advisable for the initial phase where changes are frequent. Once the test phase was over, it was replaced by a drilling circuit board.
As the prototype was required to work with no external power, a 4000 mAh lithium battery was added. Figure 2 shows the assembly and presents the final prototype.
3.2.2. Energy Consumption
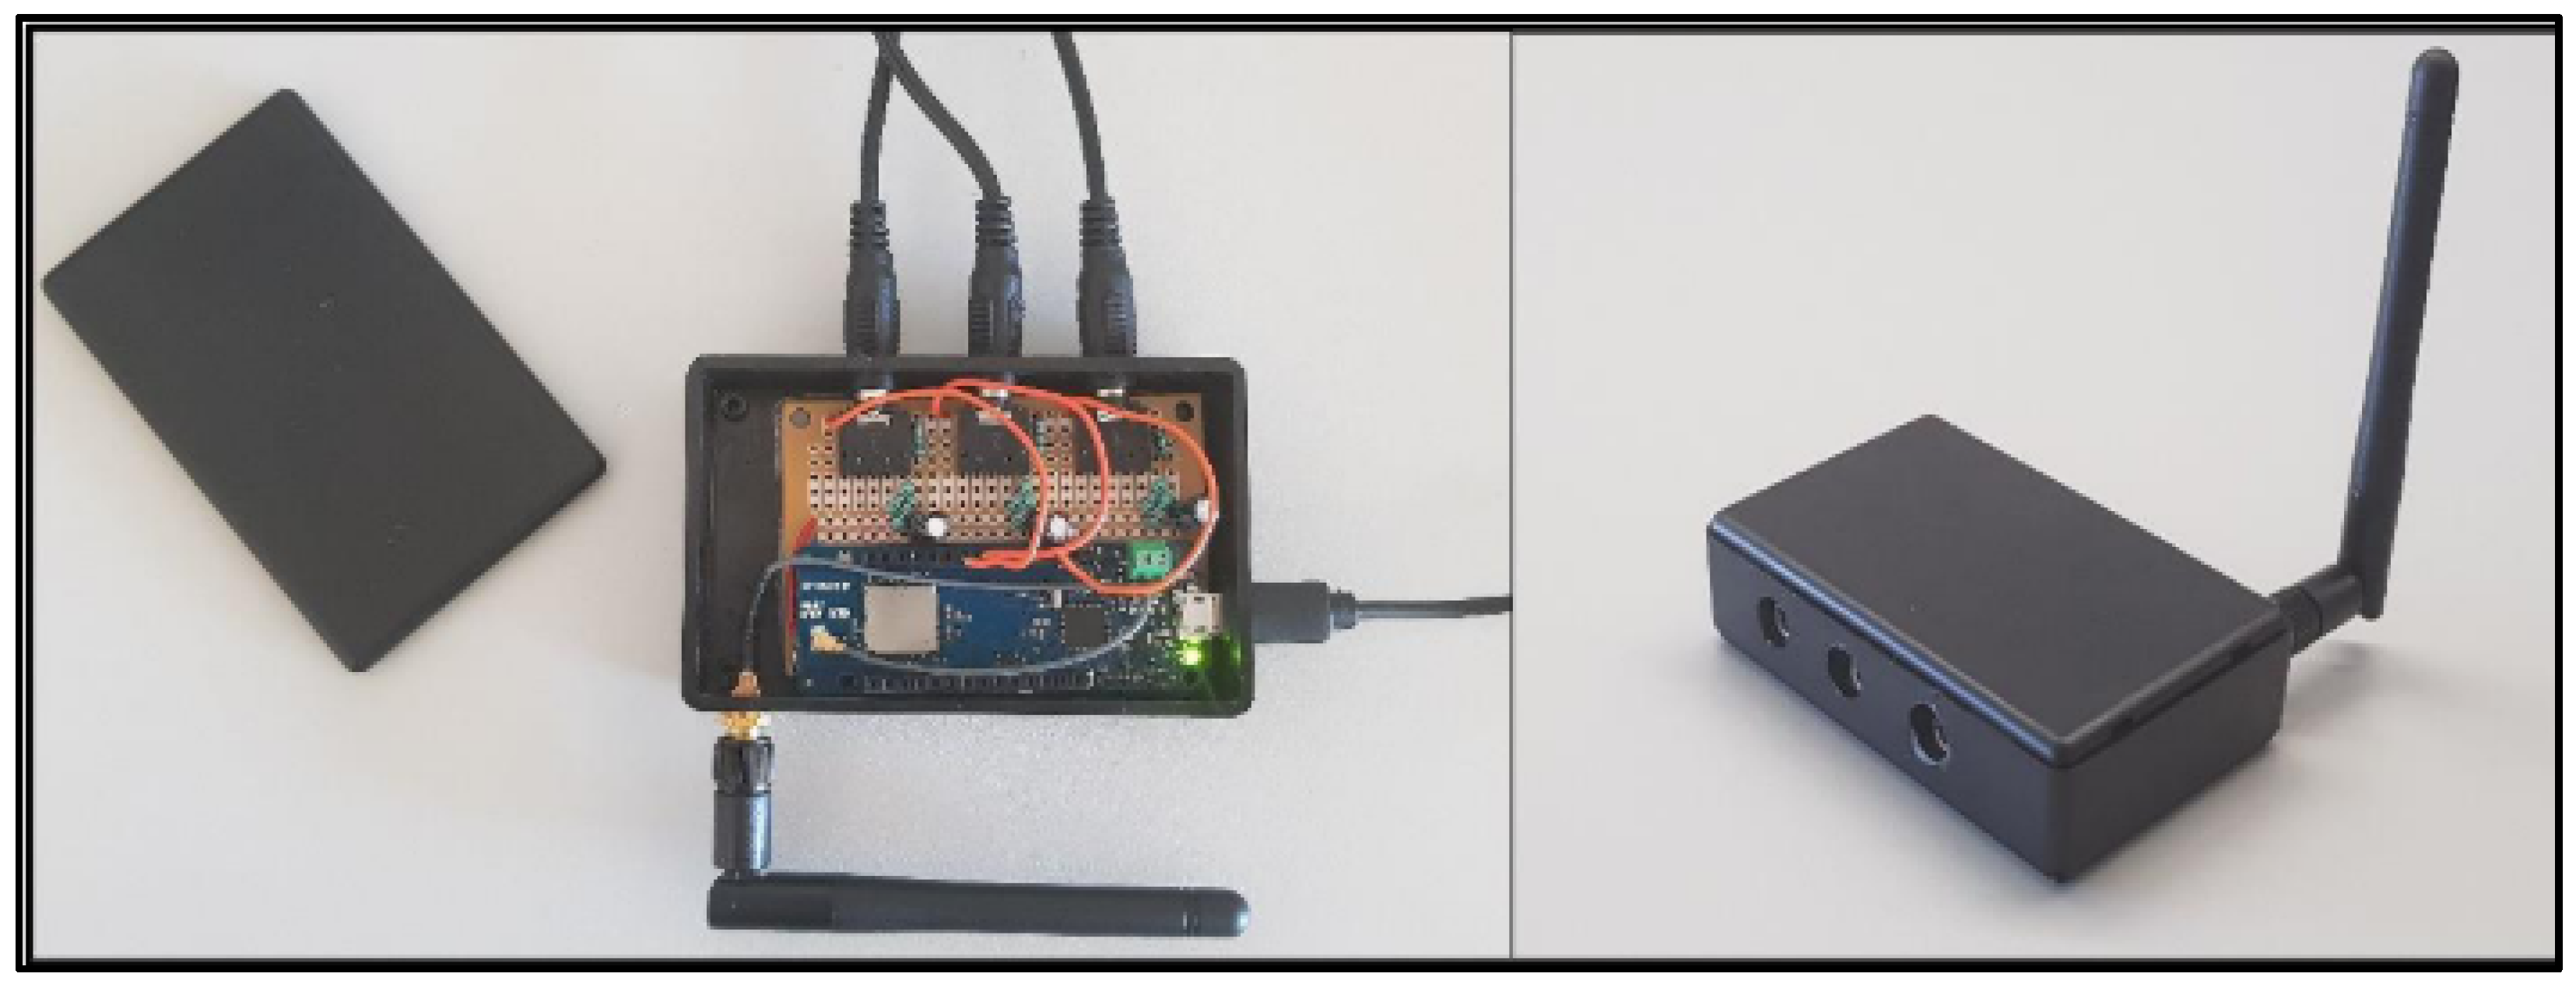
The sensors that calculate the energy consumption were placed in electrical cabinets and took three-phase current readings, that is, each sensor measured three different alternate currents (AC) and calculated the electric power in kW (electric voltage in Portugal is supplied at 230 V). The sensor prototypes were also developed at the ISCTE-IUL IoT Laboratory and composed of an MKR 1300 Arduino microcontroller connected to current transformer clamps. It was a requirement that it was easy to install and measure current passively, therefore they can be installed without the need for physical intervention on the power cables, do not need to interrupt local power, and do not affect the normal flow of electricity. The clamps measure the magnetic field usually generated by the passage of electric current in a cable to make an approximate measurement of the current consumed.
Figure 3 presents the prototype sensor developed in the laboratory, and reduced in size to allow installations in ISCTE-IUL electrical cabinets. In the construction of the sensor, we verified two main components necessary for configuration and assembly, the current transformation clamps and the Arduino microcontroller with LoRa communication.
Current transformer sensors (CT) measure the alternating current passing through an electrical conductor. This type of sensor works as current clamps, which in turn use CT. Like a current clamp, the sensor has a ferrite ring with a coil of wire around it forming a secondary winding, and a primary current conductor is then placed between the ferrite ring that carries the current that we want to measure, the primary conductor.
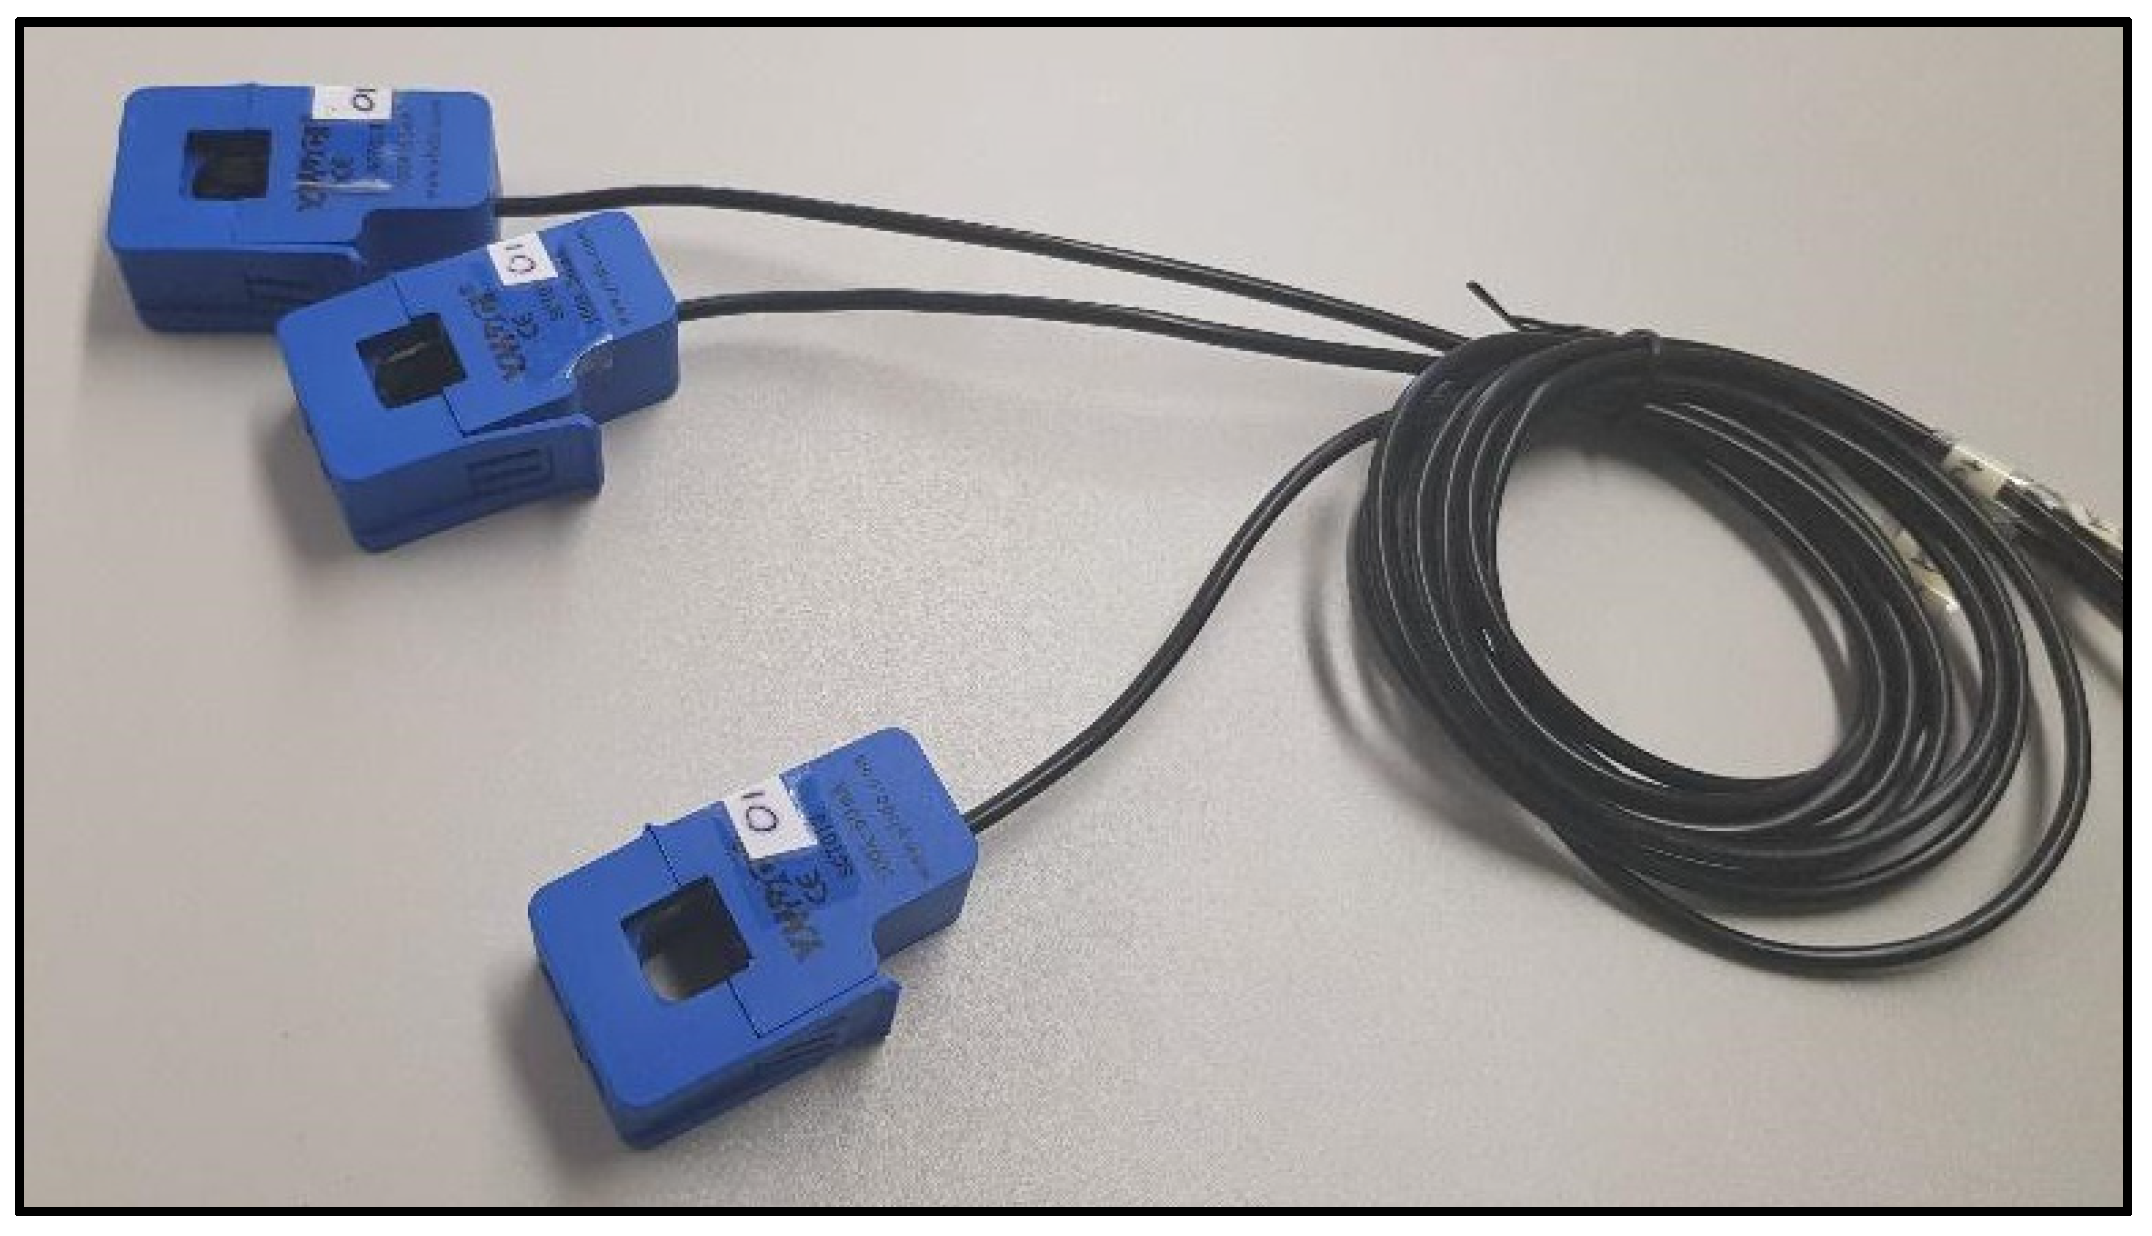
The sensors of the current transformer family have different secondary classifications, the classifications being the current or voltage values that the sensor will provide when a certain primary current is being passed. In testing and deploying our system, we used the same type of SCT-13-000 sensor (Figure 4) whose transformation ratio is 100 A:50 mA, meaning that when 100 A is passing through the primary conductor, the value of the current this sensor will emit is 50 mA without any voltage control (i.e., the Arduino will then read the resulting electrical voltage that this thermocouple sensor emits).
In transformation ratios like 100 A:50 mA where the output signal is a no-voltage standard current, there is a need to add a load resistor outside the TC sensor so that the electrical flow meets the requirements of the Arduino analogue input, 0 v for the reference ADC (Analog to Digital), which will depend on the Arduino’s input voltage or the maximum value that the Arduino can support. In this case, the load resistance needs to be calculated based on the maximum current that the TC sensor can measure, and the input voltage of the Arduino power supply. The load resistance value has a standard value and was calculated in the reference article [46].
The main reasons for choosing the TC sensor SCT-013-000 were the reduced costs, ease of implementation in prototype, high reading accuracy, the existence in the laboratory of several units ready for testing, and the experience gained from previous projects. The size of the TC sensor was also one of the main parameters when choosing this transformer because in most cases, the switchboards are not prepared to receive sensors, and there is little available space. Another factor that facilitates the implementation beyond the size is the shape of the TC sensor, a clamp, easy to open and close, which means that it can be opened and installed around the cable. In the case of the current sensors, it was decided to supply external power. This decision was based on three different factors: first, they were installed in a place where current is available; second, they needed to be small to fit safely in some of the cabinets; and third, they must have much higher sampling frequency than the environmental sensors, meaning that they consume much more power.
For each Arduino, three TC sensors of the same type were used, thus creating a three-phase sensor (Figure 3).
When determining the local to be monitored, it was necessary to know exactly where to implement the sensors (i.e., which electrical switchboard in the office area and which three-phase current cable to measure). To know this necessary information, an analysis of the electrical network of the campus main building, Building 1, was performed together with the facility maintenance staff, which provided all the information and authorization to implement the sensors safely, without disturbing the normal functioning of the university. This collaboration is one of the key drivers for success in this kind of project, and we found that facility management could also benefit from this research.
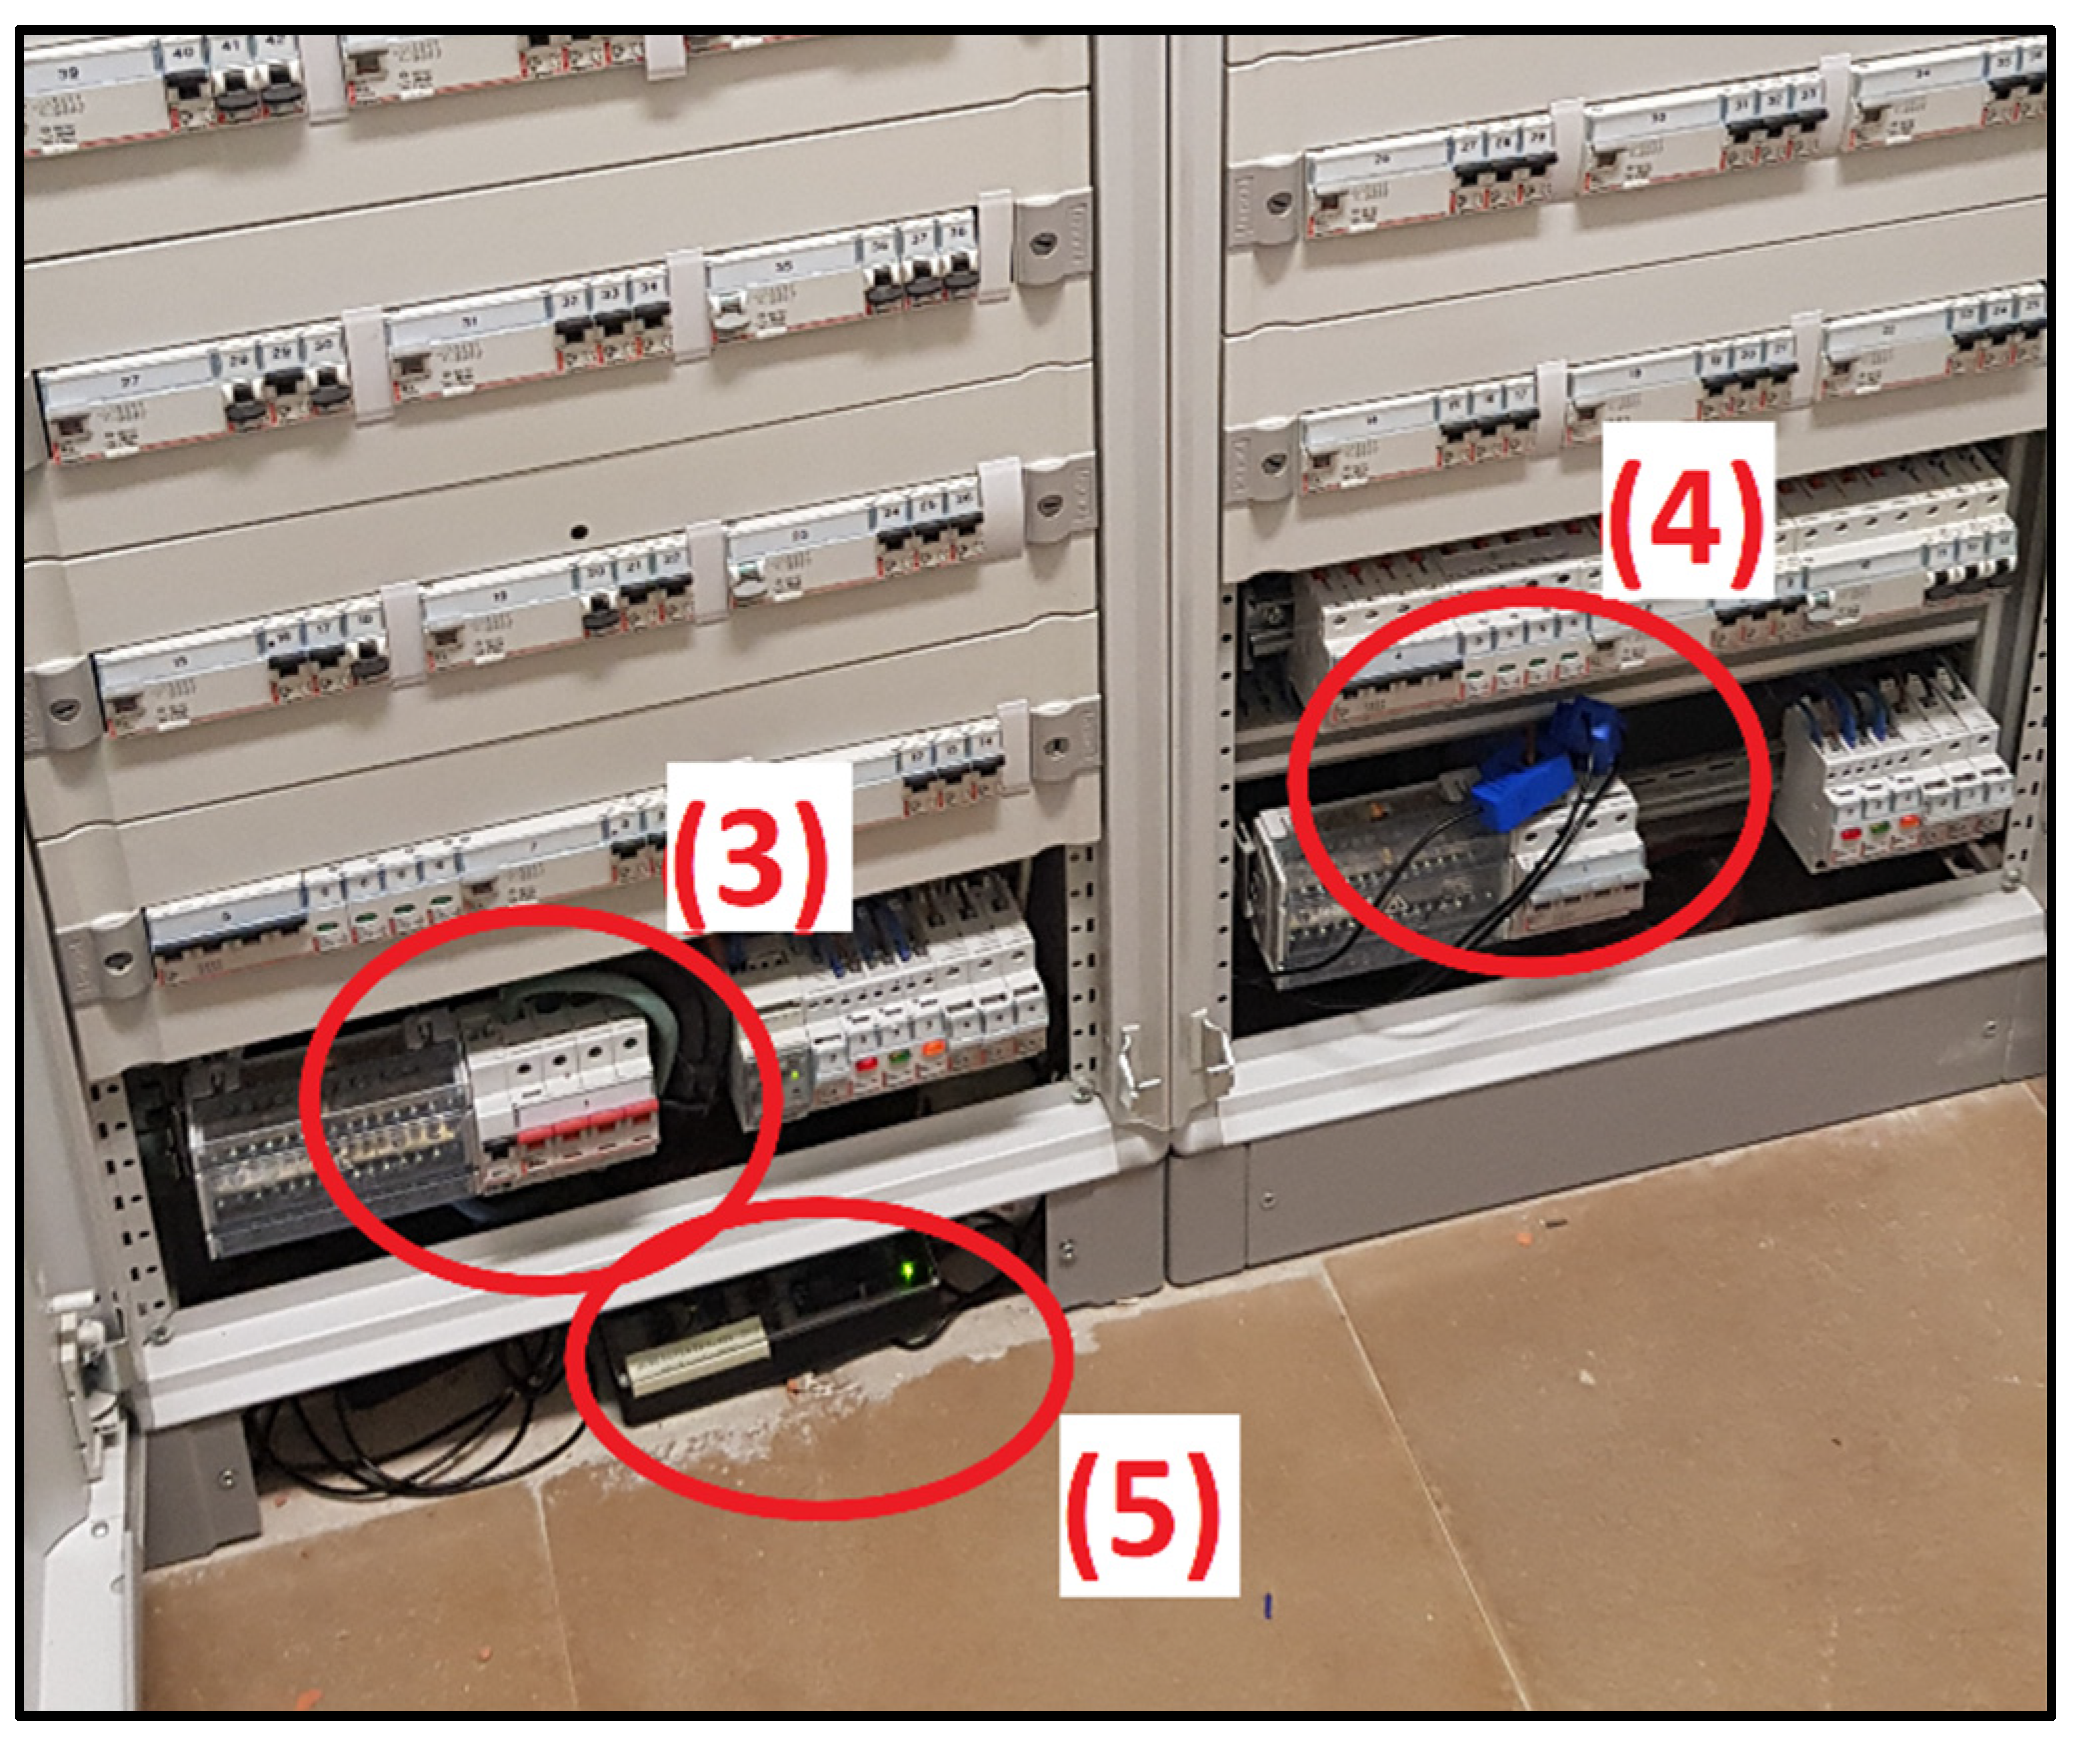
After analyzing the electrical scheme of the energy system scheme, it was found that to measure the total energy consumption in the area of study it was necessary to install two sensors, one in the general board and another in the emergency board, as the circuit for electrical outlets and lighting was split in the two boards. With all the necessary information and with the system ready for implantation, on 1 October 2020, access to the equipment was granted, and a university employee was assigned to assist in the implantation of the sensors and supply an AC electric socket for external feeding of the sensors.
Figure 5 and Figure 6 display the implantation of the sensors, where five moments can be highlighted:
- (1)
- Programming of the sensors and communication with the LoRaWAN (protocol’s name) network;
- (2)
- Calibration of the TC sensors with the aid of a clamp meter;
- (3)
- Three-phase main switchboard circuit breaker, which corresponds to the connections where a sensor has been installed;
- (4)
- Three-phase main switchboard emergency circuit breaker, which corresponds to the connections where a sensor has been installed; and
- (5)
- Implantation of the sensors at the bottom of the switchboard. With the reduced size of the sensors, it was possible to hide them at the bottom of the switchboard without disturbing the normal access to the switchboard or the other connections.
3.3. Network Layer
LoRa is a long-range, low power consumption IoT oriented toward communication technology, ideal for sensors. This technology is transforming the world of IoT, as a LoRa network with a radius of up to 15 km (in rural areas) can be created with only one gateway, where hundreds of sensors can communicate with each other. This network allows data to be collected in real-time from various sensors that can be used by various sectors of society.
This layer consists of the LoRa network and the LoRaWAN gateway of The Things Network (TTN). The LoRaWAN protocol is used to establish a connection between the sensors and a gateway that transmits the data in LoRa to the Internet, by TCP/IP protocol, and then to an MQTT (Message Queuing Telemetry Transport) server where the server and the other applications of the system access the received data. The LoRa network was chosen because it is already in operation at ISCTE, and because it contains a greater range coverage compared to ZigBee and Bluetooth. Regarding the choice of the LoRa server to be used, TTN was chosen because it has an interface that is easy to interpret and free.
With the microcontroller already registered in TTN, the next step was to activate it, so the SendOTAA sketch example was used. In this case, it was necessary to use the APPEUI and APPKEY of the application, where the first one exclusively identifies the server that processes the request to join the network and the second one corresponds to an AES-128 cryptographic key, with the function of exchanging data with the server and encrypting the communication. The TTN network server is located between the gateways and the application server, it has the function to process and route the data. There are two ways in which the sensors can connect to the TTN:
- ABP (Activation by personalization):
In ABP activation mode, it is not necessary to configure DevEUI, AppEUI, or AppKey because the NwkSKey and AppSKey session keys are pre-programmed on the device and is previously registered on the network to which it will be connected.
As it is pre-programmed with the session keys, there is a possibility that a hacker will find these values and create their own devices with copies of these keys, compromising the integrity of the network. In this case, it is advisable not to use the same session keys when dealing with devices on the same network [49].
- OTAA (Over the Air Activation):
According to P. Henrique et al. [50], the air activation mode is the most used, reliable, and secure way to connect to TTN because the activation will be confirmed and the session keys will be negotiated at each activation.
In OTAA activation mode, each device has a DevEUI, AppEUI and AppKey, however, in this mode, the devices do not have the necessary keys to start the connection to the network. To establish communication with the network, the device sends a Join-Request message, which is a connection approval request, in which DevEUI, AppEUI, and AppKey (which will generate the NwkSKey and AppSKey keys) are sent. If the server accepts the request, a Join-Accept message is sent to the device, which will create the session keys through AppKey and AppNonce, also generated by the server, and later stored on the network.
The session keys can be stored and used to allow the exchange of messages between the server and the device.
Comparing the two modes, it was concluded that OTAA was preferred over BPA.
3.4. Data Layer
In this layer, processing and storage of all data transmitted by the sensors is carried out, which are later analyzed and sent to the various applications and purposes of the system.
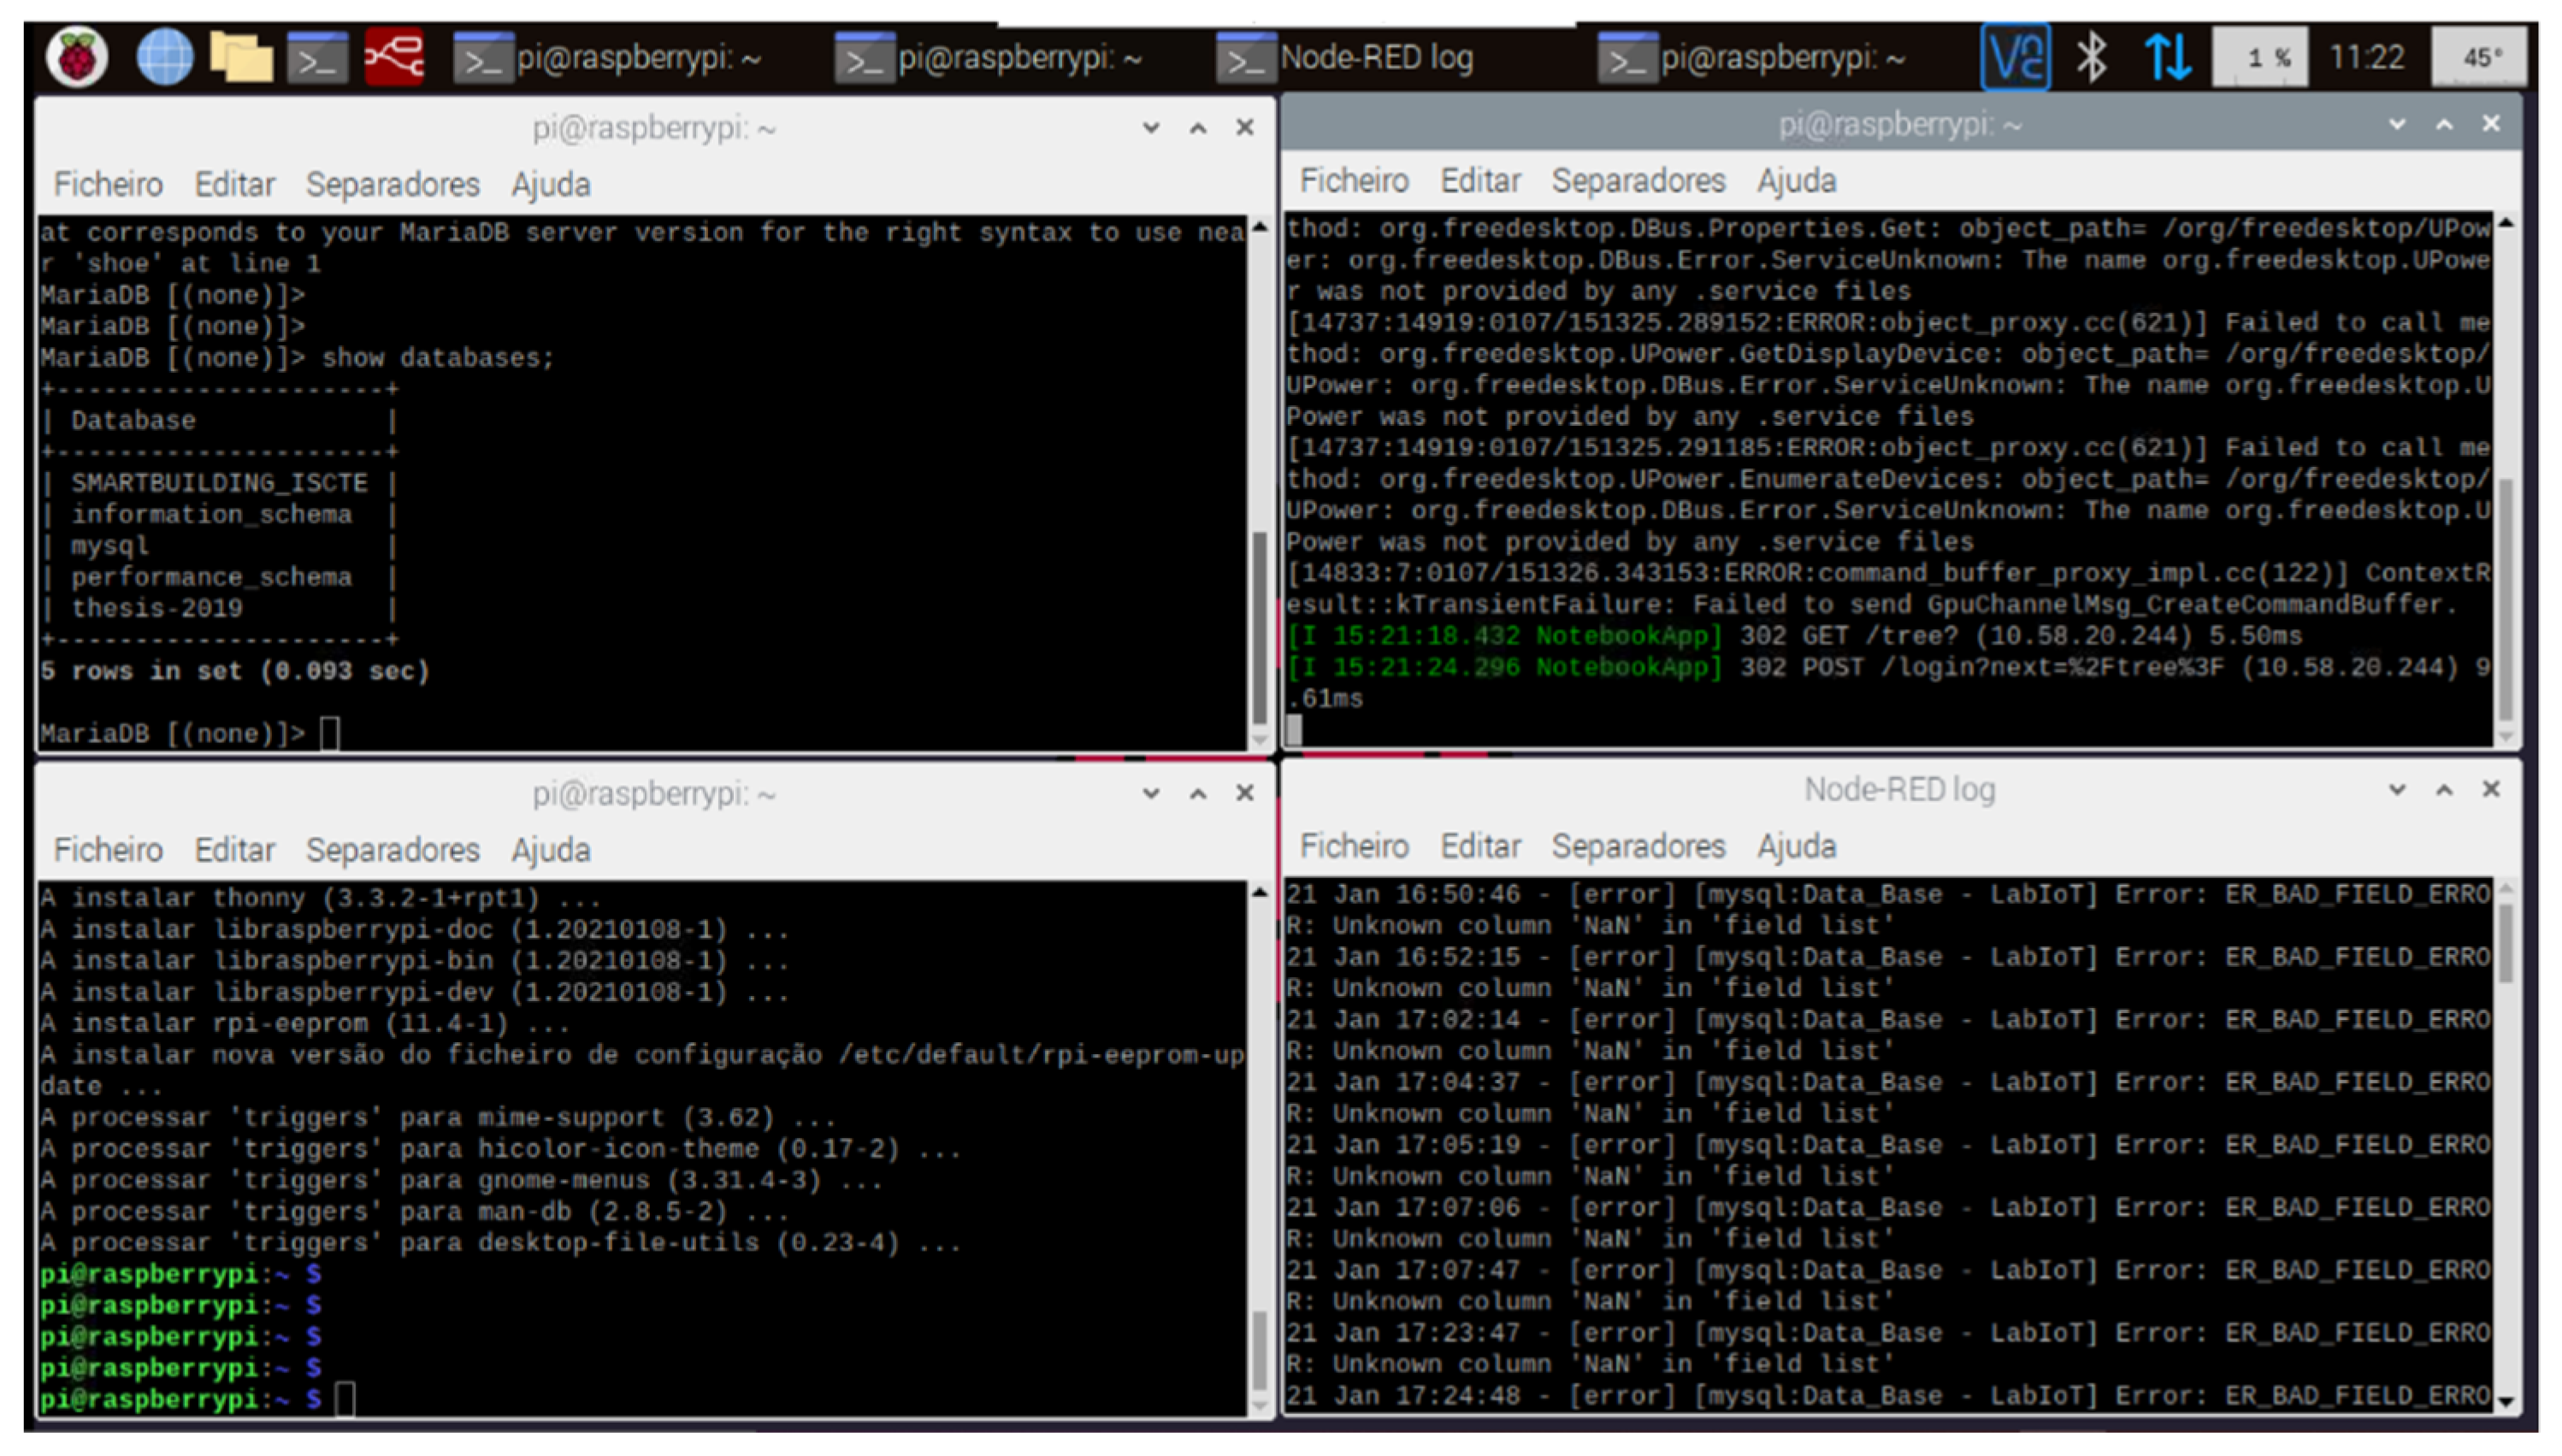
The application server is responsible for receiving data from the LoRa server and processing it. For this purpose, a Raspberry PI (Figure 7), installed on ISCTE-IUL’s internal network, with a RaspbianOS operating system, was configured to run a local web server using [51]. This server has the function of processing JSON type messages received via TTN carrying the data packets of the installed sensors. It then creates corresponding SQL entries according to the type of sensor and sends them to a [52], a flexible, open-source SQL database type, stored locally in the same Raspberry Pi. The data collected by the sensors were structured in individual tables in a SQL database for later analysis, query, and export. Figure 7 shows the server operation screen with all functional applications and the system log open.
3.4.1. Node-Red Server
Node-Red is a flow-based platform, which was developed to interact with hardware devices, APIs (Application Programing Interfaces), and online services to simplify IoT systems, allowing programming through an intuitive graphical interface. To develop an application using Node-RED, it is only necessary to connect nodes, each having a specific function. This platform also allows the inclusion code using Java Script for more elaborate or custom functions.
The configuration applications in the Node-RED of the IoT system are as follows:
- Confirmation of status of all system sensors and the addition of new sensors;
- LoRa message reception with sensor data;
- Treatment of the received LoRa message and separation of the different measurement values;
- Storage of the measurements in the system DB;
- Sending data to machine learning and receiving the processed data;
- Sending consumption information to the final application and dashboard visualization for the system user; and
- Node-RED dashboard configuration for maintenance and system managers.
3.4.2. SQL (Structured Query Language) Database
After being ratted by the Node-RED server, the data collected by all the system’s sensors is permanently stored in a MariaDB. This free database server has a wide variety of features while maintaining backward compatibility with MySQL. For the IoT system, a scheme with the relation between tables was developed for a simple and flexible configuration, maintaining high performance in terms of memory and ease of reading and introduction of new SQL entries.
3.5. Application Layer
This layer is where users interact with the system. It is the visual interface for observing the data collected by the sensors with time filters (time, day, weekday, and month of the year). It also presents other relevant information such as time averages and energy consumption and environmental conditions statistics.
It is in this layer that the main objective of the developed system is shown, to allow visualization of the data collected by the various sensors in a manner that is simple and easy to predict by any type of user. This way, besides the typical visualization modes such as graphs of media and bars, a more appealing 3D visual model of the monitored place is created.
Building Information Model (BIM)
The building information model (BIM) includes the complete geometric description of the building and equipment such as furniture as well as the designation of the departments in the form of a label, which allows the visualization of the location where each sensor was installed.
In this work, one of the forms of data representation consisted of using an interface based on a BIM model. This approach allows laypeople to have a better understanding of the environmental comfort where they are located as well as simplifying the levels of energy consumption to a series of colorimetric scales, which allows the users to identify the areas and time where the biggest consumptions occur.
This model allows users to interpret the indicated values simply, since they are represented by colors that indicate the comfort level of the space. This complements the usual way to present data in dashboards such as bar graphs, tables, and graphs, and allows any user to clearly understand what is going on the environment as it is simpler for a layperson to interpret data through color than a large amount of numbers.
4. Application Case
4.1. Pilot Academics Services at ISCTE-IUL University
ISCTE-IUL’s Academic Services is located on the ground level of Building 1 and occupy a 426.5 m2 area. This area comprises open-space and closed office rooms where three dozen administrative staff work daily. Employees make intensive use of computers and equipment such as printers and photocopiers. It is a place with high energy consumption in comparison with classrooms or auditoriums, and has people working all day long, which helps in the quality of the consumption data collected. Due to the significant number of people on-site, the various electronic equipment used and the characteristic of being an open-space, the local temperature has a big difference between the outside and the other neighboring rooms. In this way, information on local temperature and humidity was collected to inform the local employees. For all these reasons, Academic Services was chosen to implement the IoT system and to serve as a pilot with the BIM model of the site, once provided by the architecture department of ISCTE-IUL.
For this case study, there were two types of implementation:
- Environmental monitoring
- Energy management
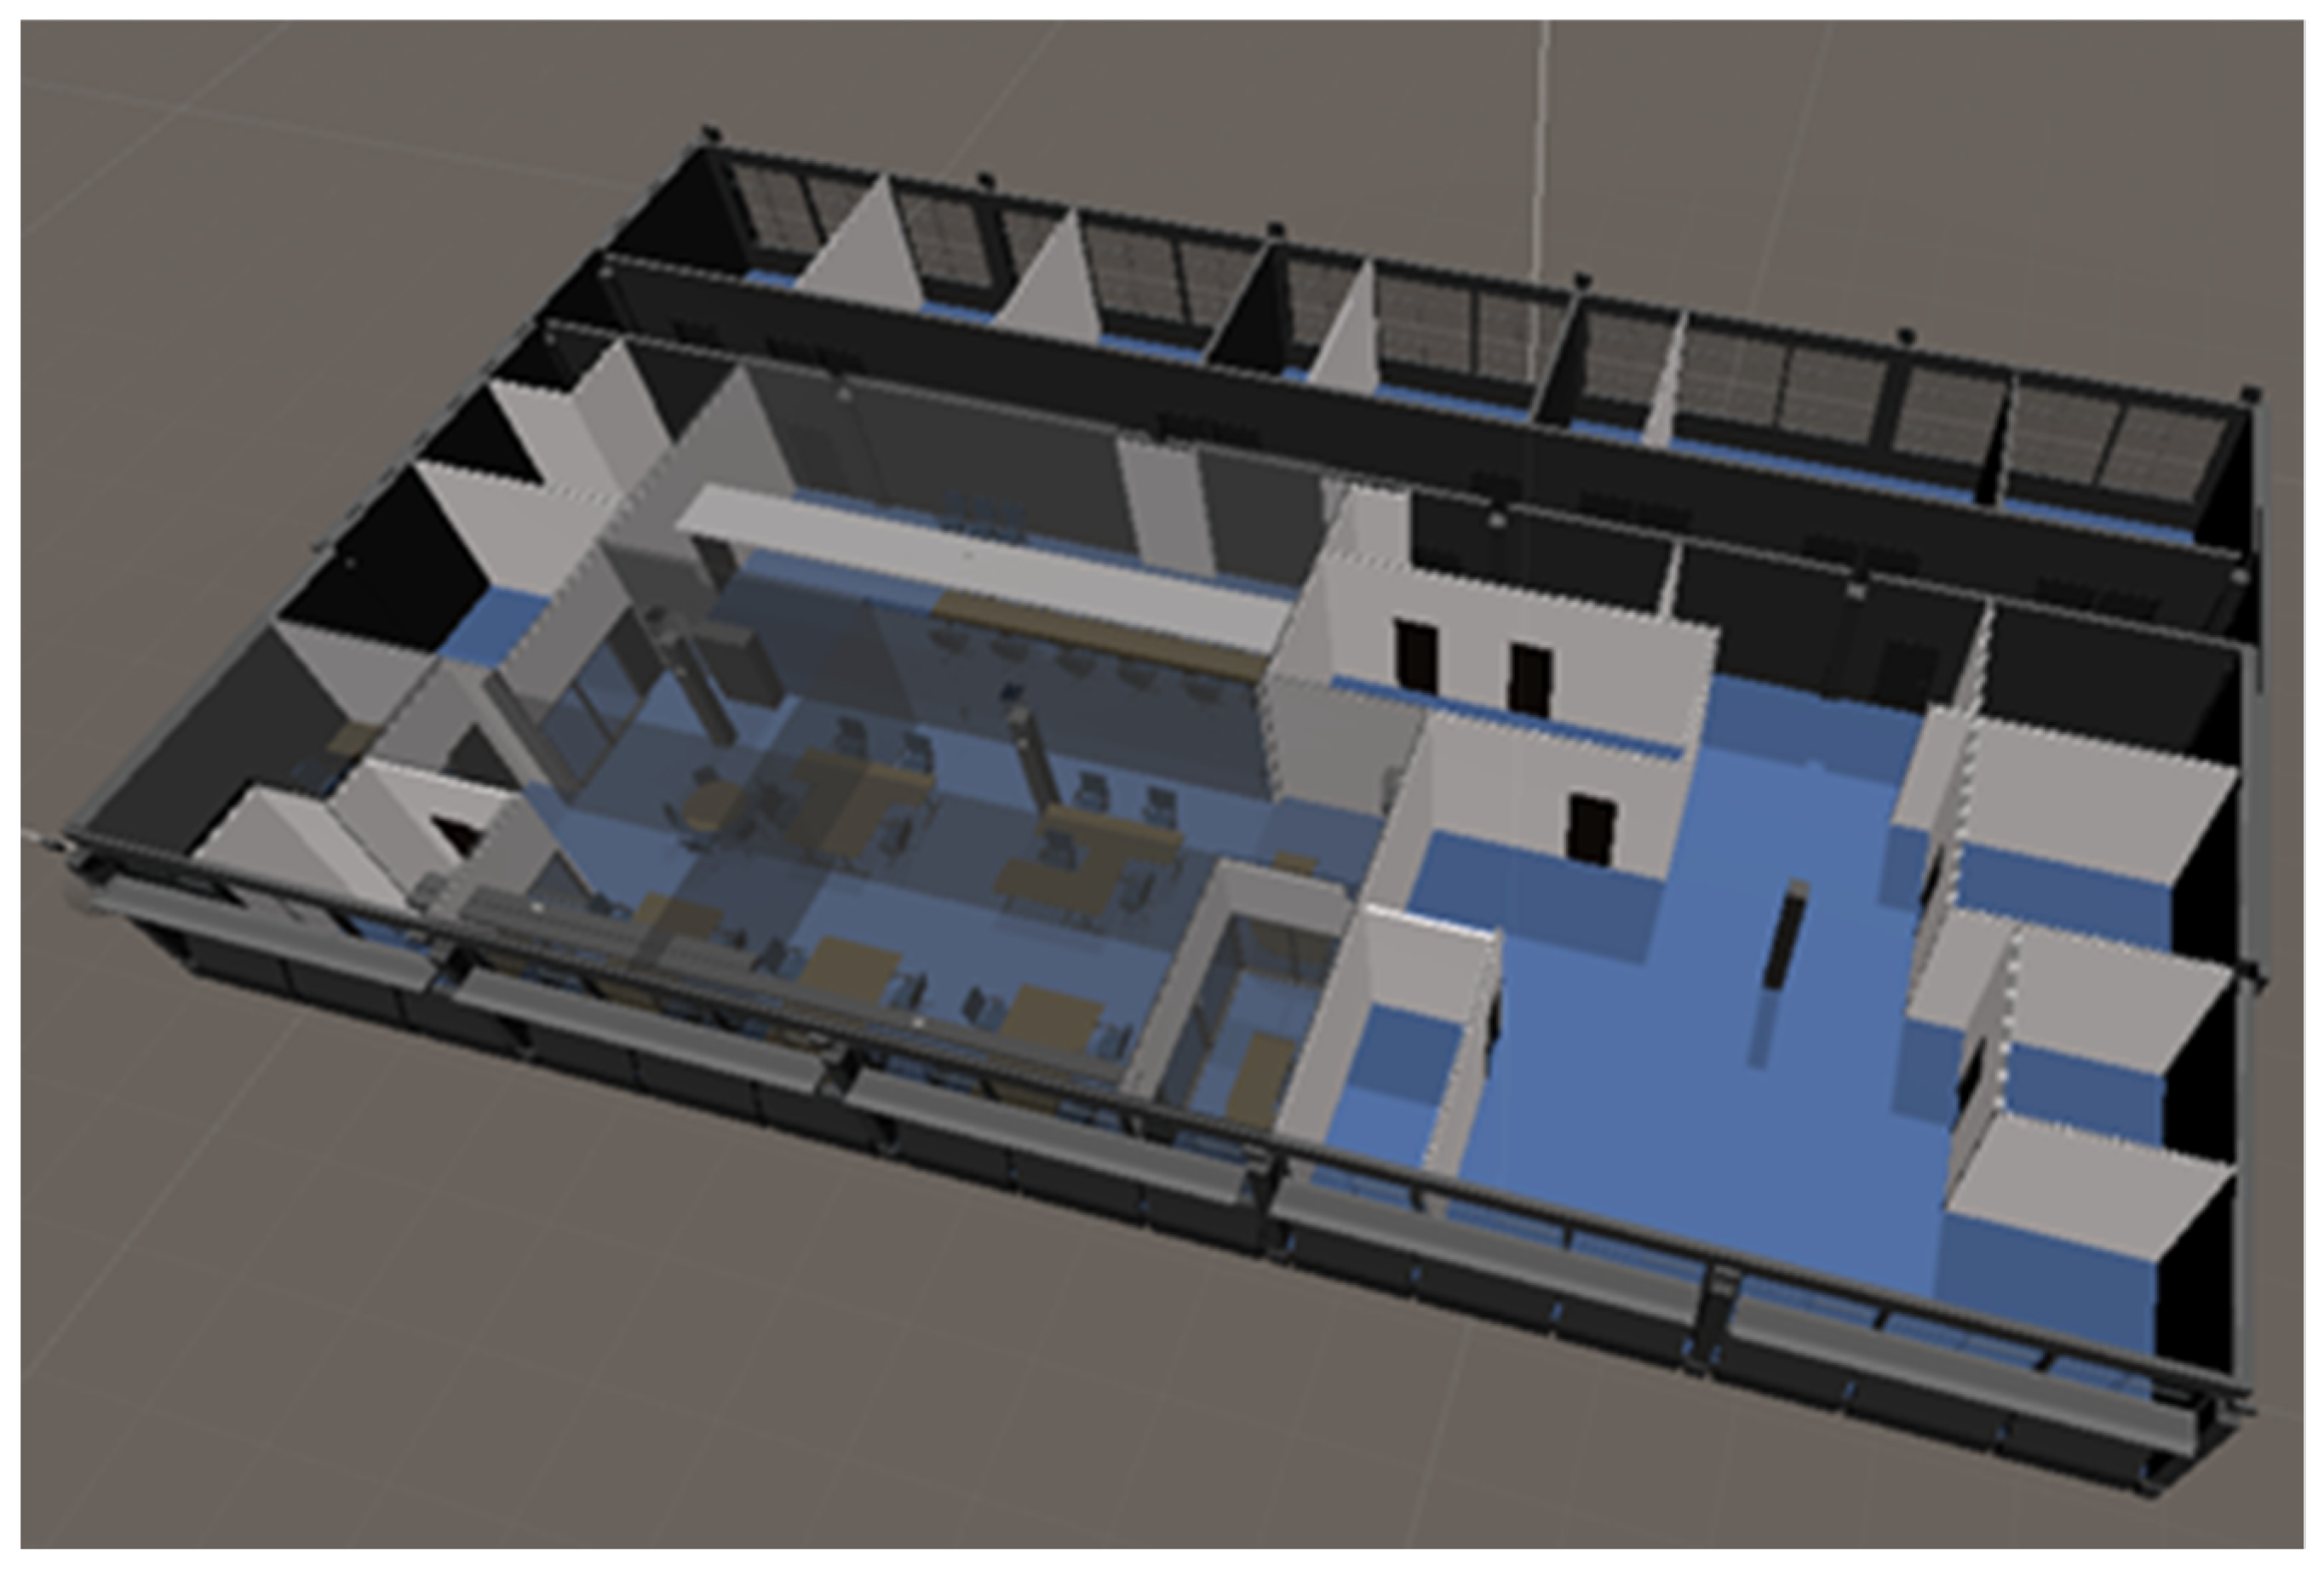
The BIM model created includes the complete geometric description of the building, allowing a more direct approach of the user to 3D visualization, ensuring a greater perception of the environmental conditions around them. Figure 8 depicts a view of the BIM model of the office, extracted from the building model. The BIM allows the data to be represented so that any user can perceive them easily and quickly, according to a perspective that can be configured for different cases.
The main purpose of this visualization interface is to provide users of the site with current information on the data collected by the sensors installed inside the office. In this way, it will be possible to analyze the comfort level of each room and the energy consumption. Regarding the current state of each room, we believe that a 3D environment, represented by colors, has a greater impact on people.
4.1.1. Environmental Monitoring
Environmental monitoring provides a visual interface to local employees with current information on environmental conditions within the office. In this way, it will be possible to analyze the level of comfort of each room or to opt for spaces where the temperature and humidity follow the user’s preference. Regarding the current state of each room, we believe that a 3D environment, represented by colors, has a greater impact on people.
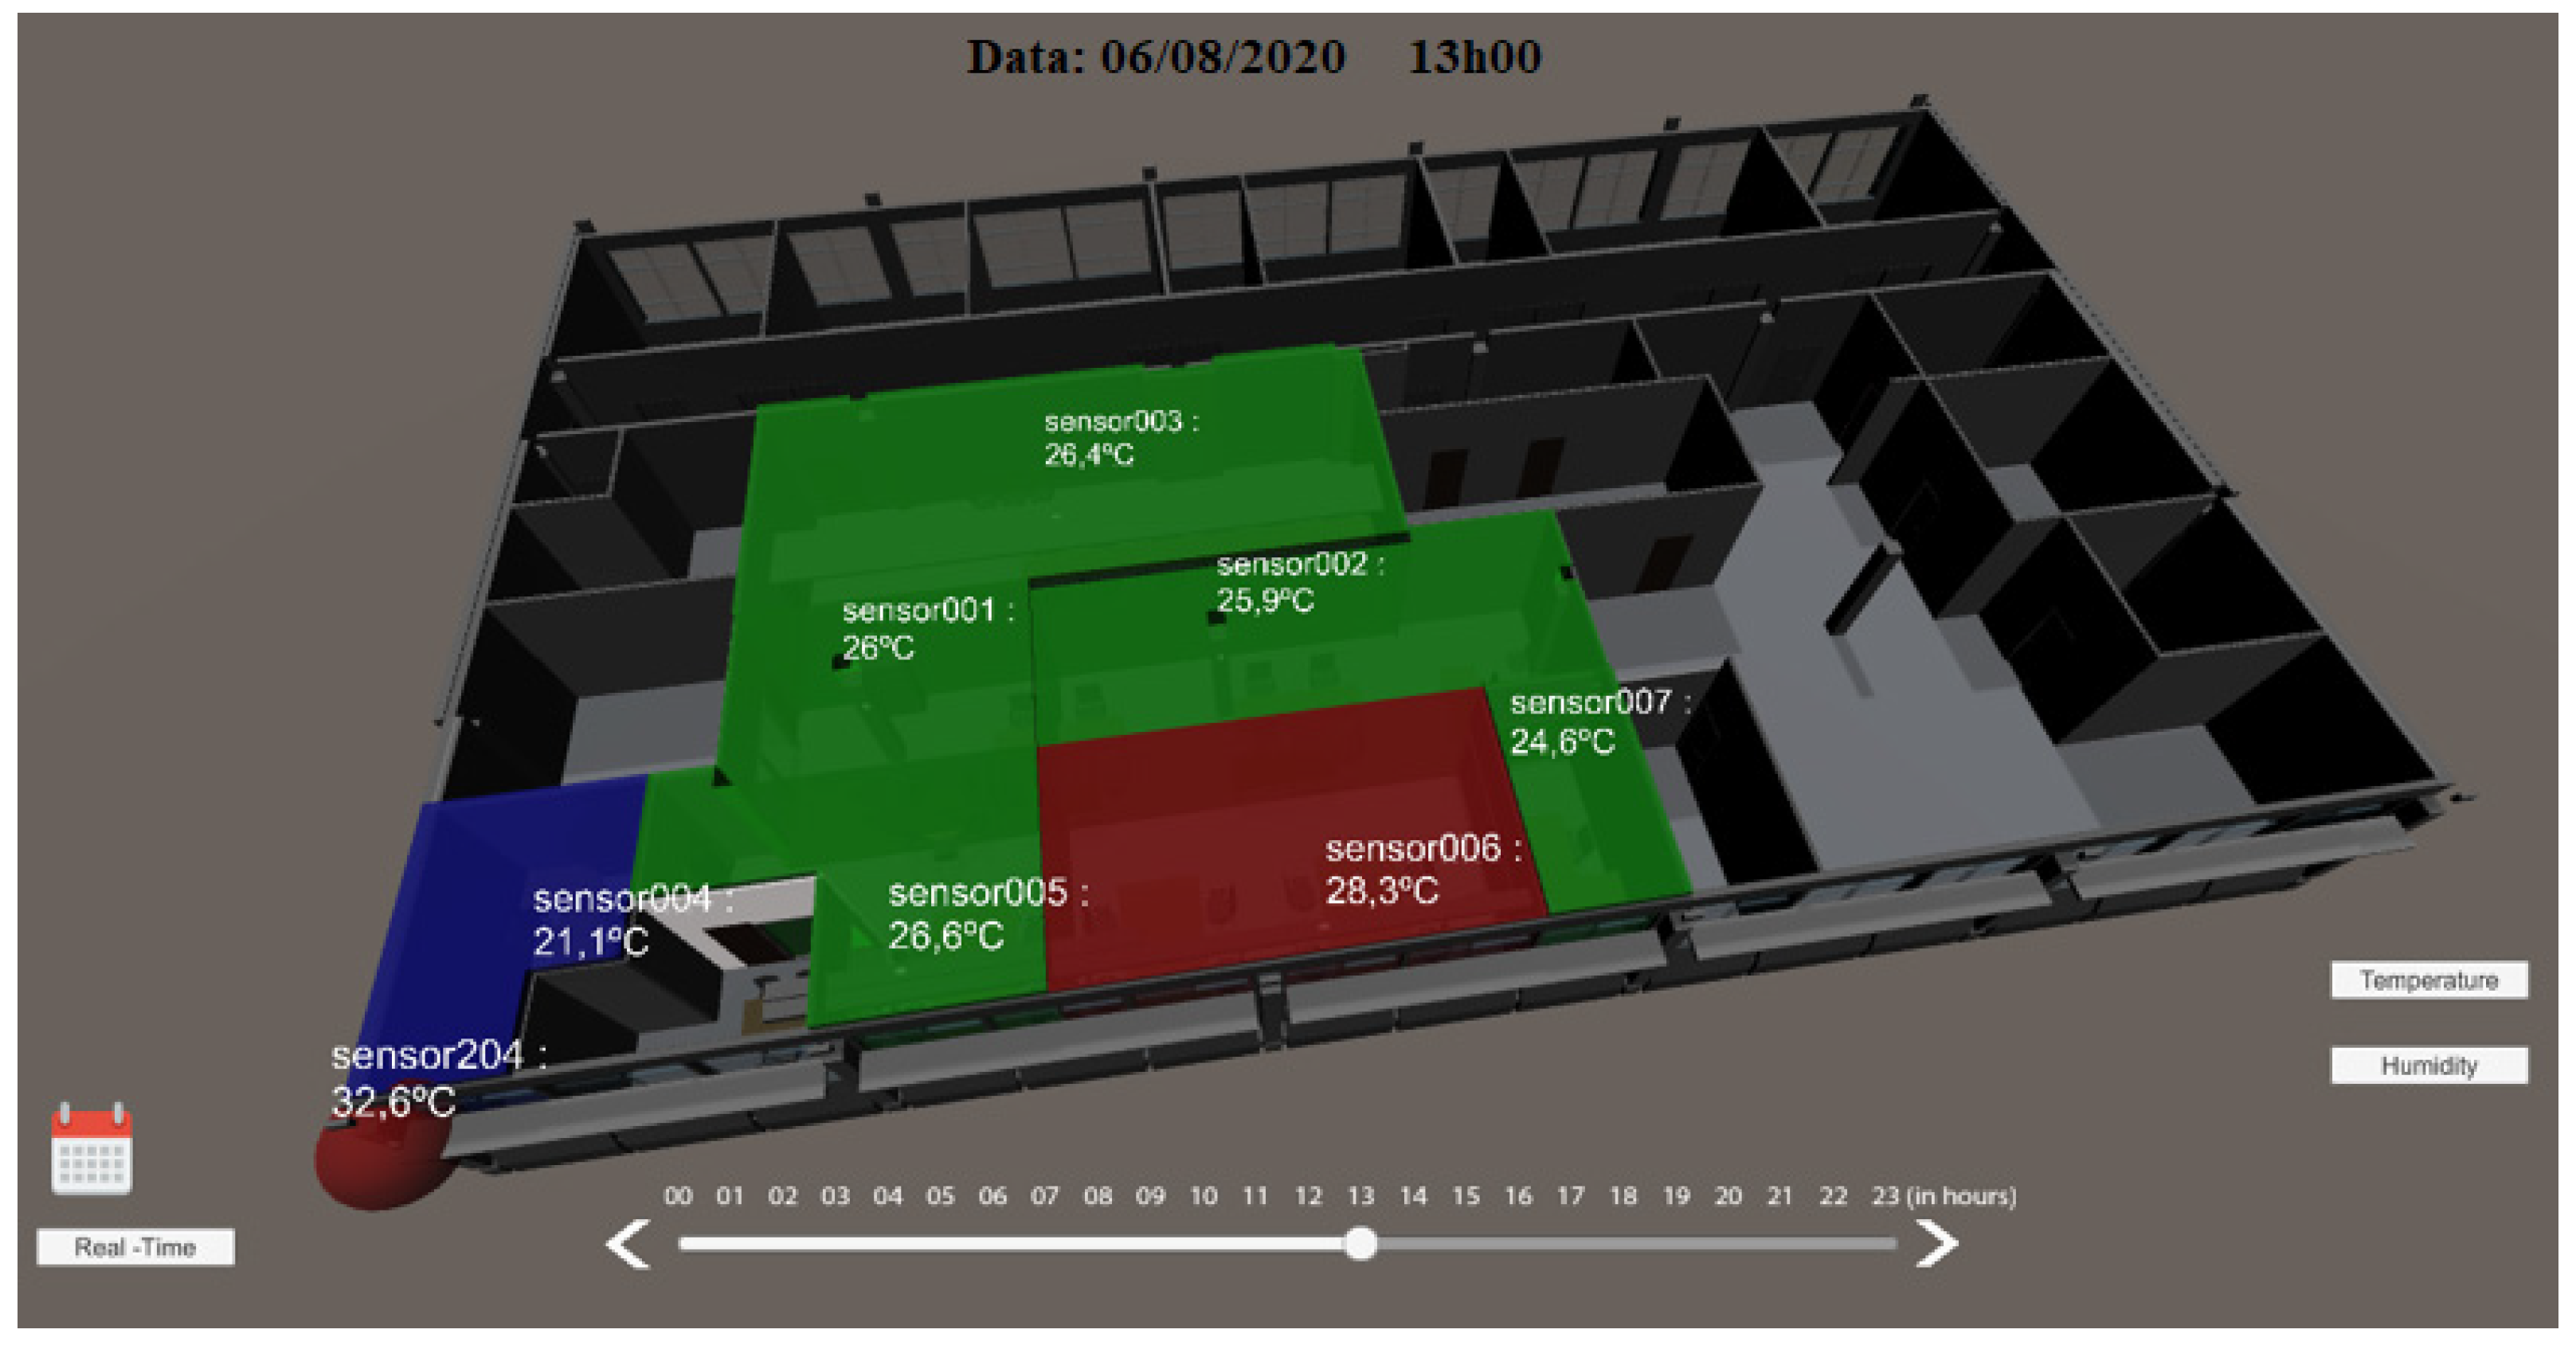
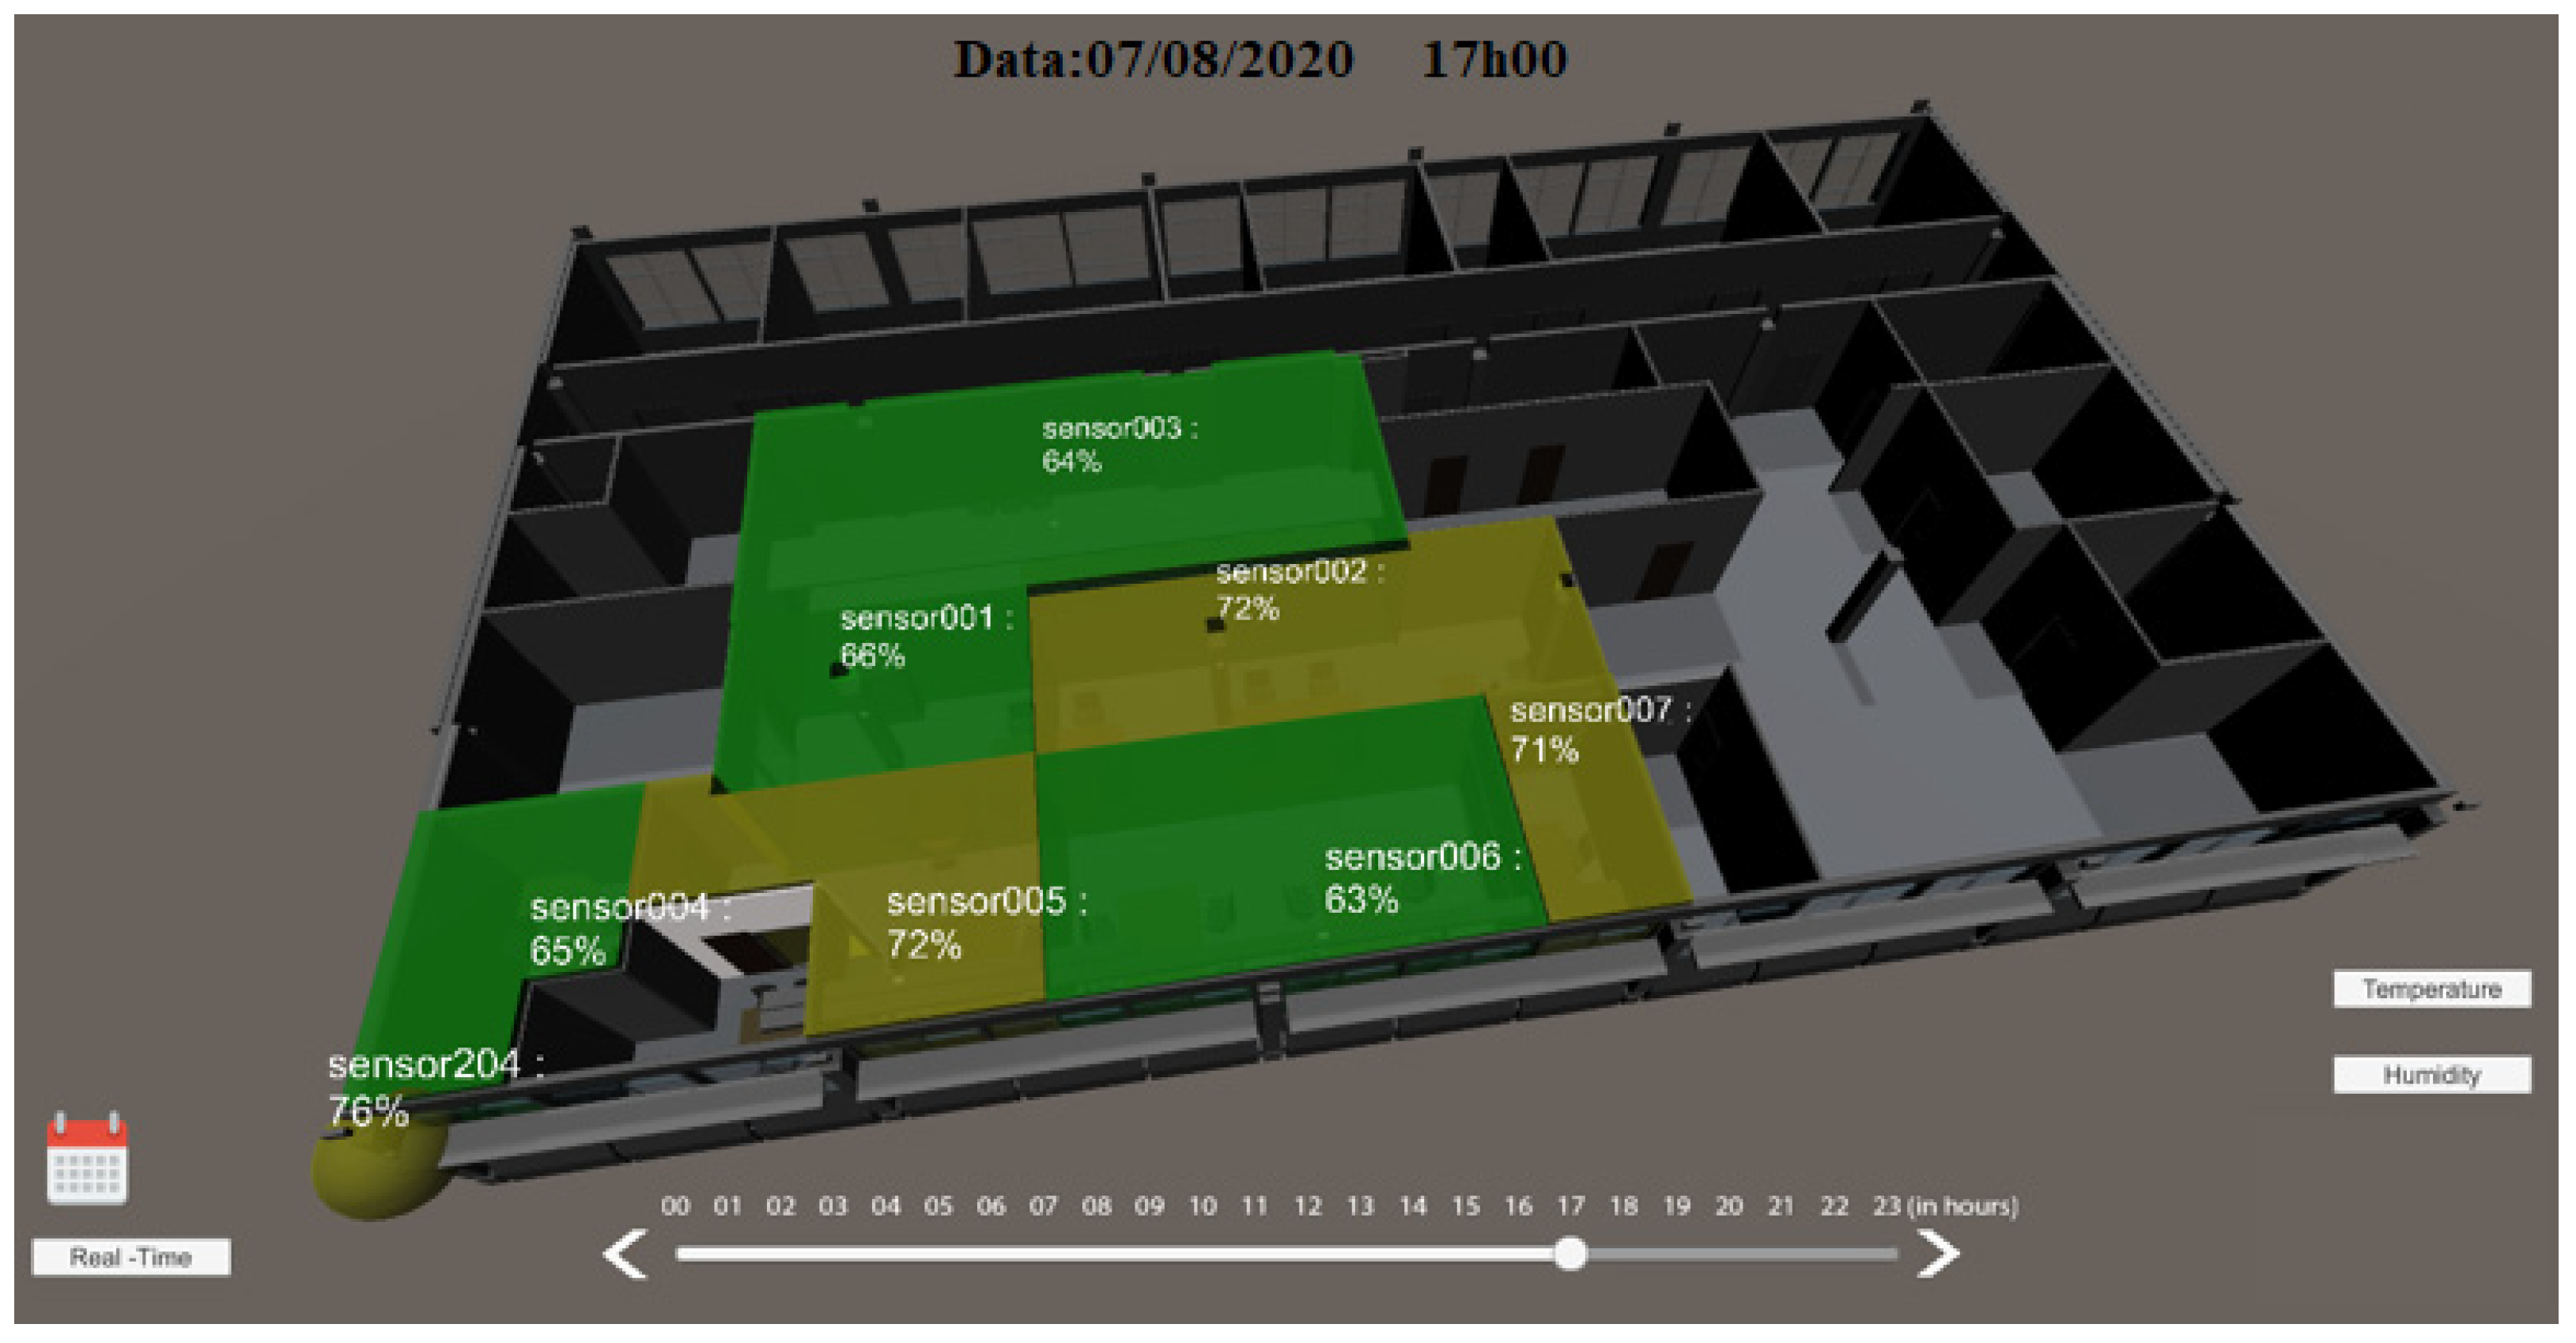
The temperature and humidity parameters of the rooms in the secretariat are presented using colors for each range of values defined in the scripts: red to indicate the high temperatures (above 28 °C), green for pleasant temperatures (22 °C to 28 °C), and blue for temperatures considered below average comfort (below 22 °C). The same process was used to represent humidity values, where a red color shows that the humidity is below the World Health Organization’s (WHO) recommended average (below 40%), green for pleasant humidity (40% to 70%), and yellow, which is above the comfort level (above 70%). A summary of the above is given in Table 1.
Temperature values are based on ASHRAE Standard 5, which indicates that comfort temperature in winter is between 21 °C and 25 °C, while in summer, it is between 22.8 °C and 27.8 °C [53].
According to the WHO, relative humidity recommended for the human body varies between 40% and 70% and can be harmful outside this range; moreover, according to the WHO, relative humidity values below 12% present a health risk, and it is recommended that activities that require agglomerations of people are suspended in enclosed spaces such as classrooms, cinemas, and offices between 10 a.m. and 4 p.m. and the interruption of physical activities, mainly from 10 a.m. to 3 p.m. When the humidity value is above 70%, the risk of proliferation of fungi and bacteria that causes allergies also increases.
The interface developed allows users to pick a specific day through the calendar option, located in the bottom left corner, and the time of the day through the daily time bar, in the center bottom. If no past date and time are selected, the present day is updated in real-time using the real-time button. A label has been placed for each room and, depending on the display mode selected, it indicates the sensor name and the variable value in degrees Celsius or the relative humidity in percentage. Outside temperature and humidity are represented by the sensor, represented by the sphere in the lower-left corner of the BIM model.
This interface has two display modes, corresponding to temperature and humidity data. When the temperature mode is selected, a temperature-related color is displayed for each area, corresponding to a specific sensor placed in its center. In Figure 9, the temperature display mode is selected and it is easy to identify which rooms have the most pleasant temperature, and why the space in the center, near the window, is hotter. Through this display interface, it is possible to recognize which rooms have a climate control system in operation. This requires only a simple analysis by comparing the temperature values in each room. The air conditioning was connected to the room where sensor004 was located as it indicated a temperature of 21.1 °C as opposed to the outside temperature, which was 32.6 °C.
This type of display can be used to try to avoid an unnecessary waste of energy. If a comparison is made between the outside and inside temperature, it is possible to determine whether opening or closing a window is desired. If the user wants to cool the room and notices that the outside temperature is lower than inside, they can open the window and thus reduce the use of air conditioning. The same applies to heating systems: if the user wants to heat the room and sees that the outside temperature is higher, they can avoid using the heating system and choose to open the windows. These small attitudes avoid irrational energy consumption, but are not intuitive to most users today.
The color display helps users without much technical knowledge to understand what is happening or, what such a number indicates. In everyday life, even highly educated people come across values of obscure meaning outside their area of specialization. The representation of information by color tends to be easier to interpret and does not require as many mental resources to be understood, which can result in faster and more efficient decision making. Based on a color coding procedure, the temperature and humidity values are coded according to the previously defined comfort ranges, in which the color changes, according to the values obtained. In Figure 10, three rooms are shown in yellow, as the air is very humid, above 70%.
4.1.2. Energy Management
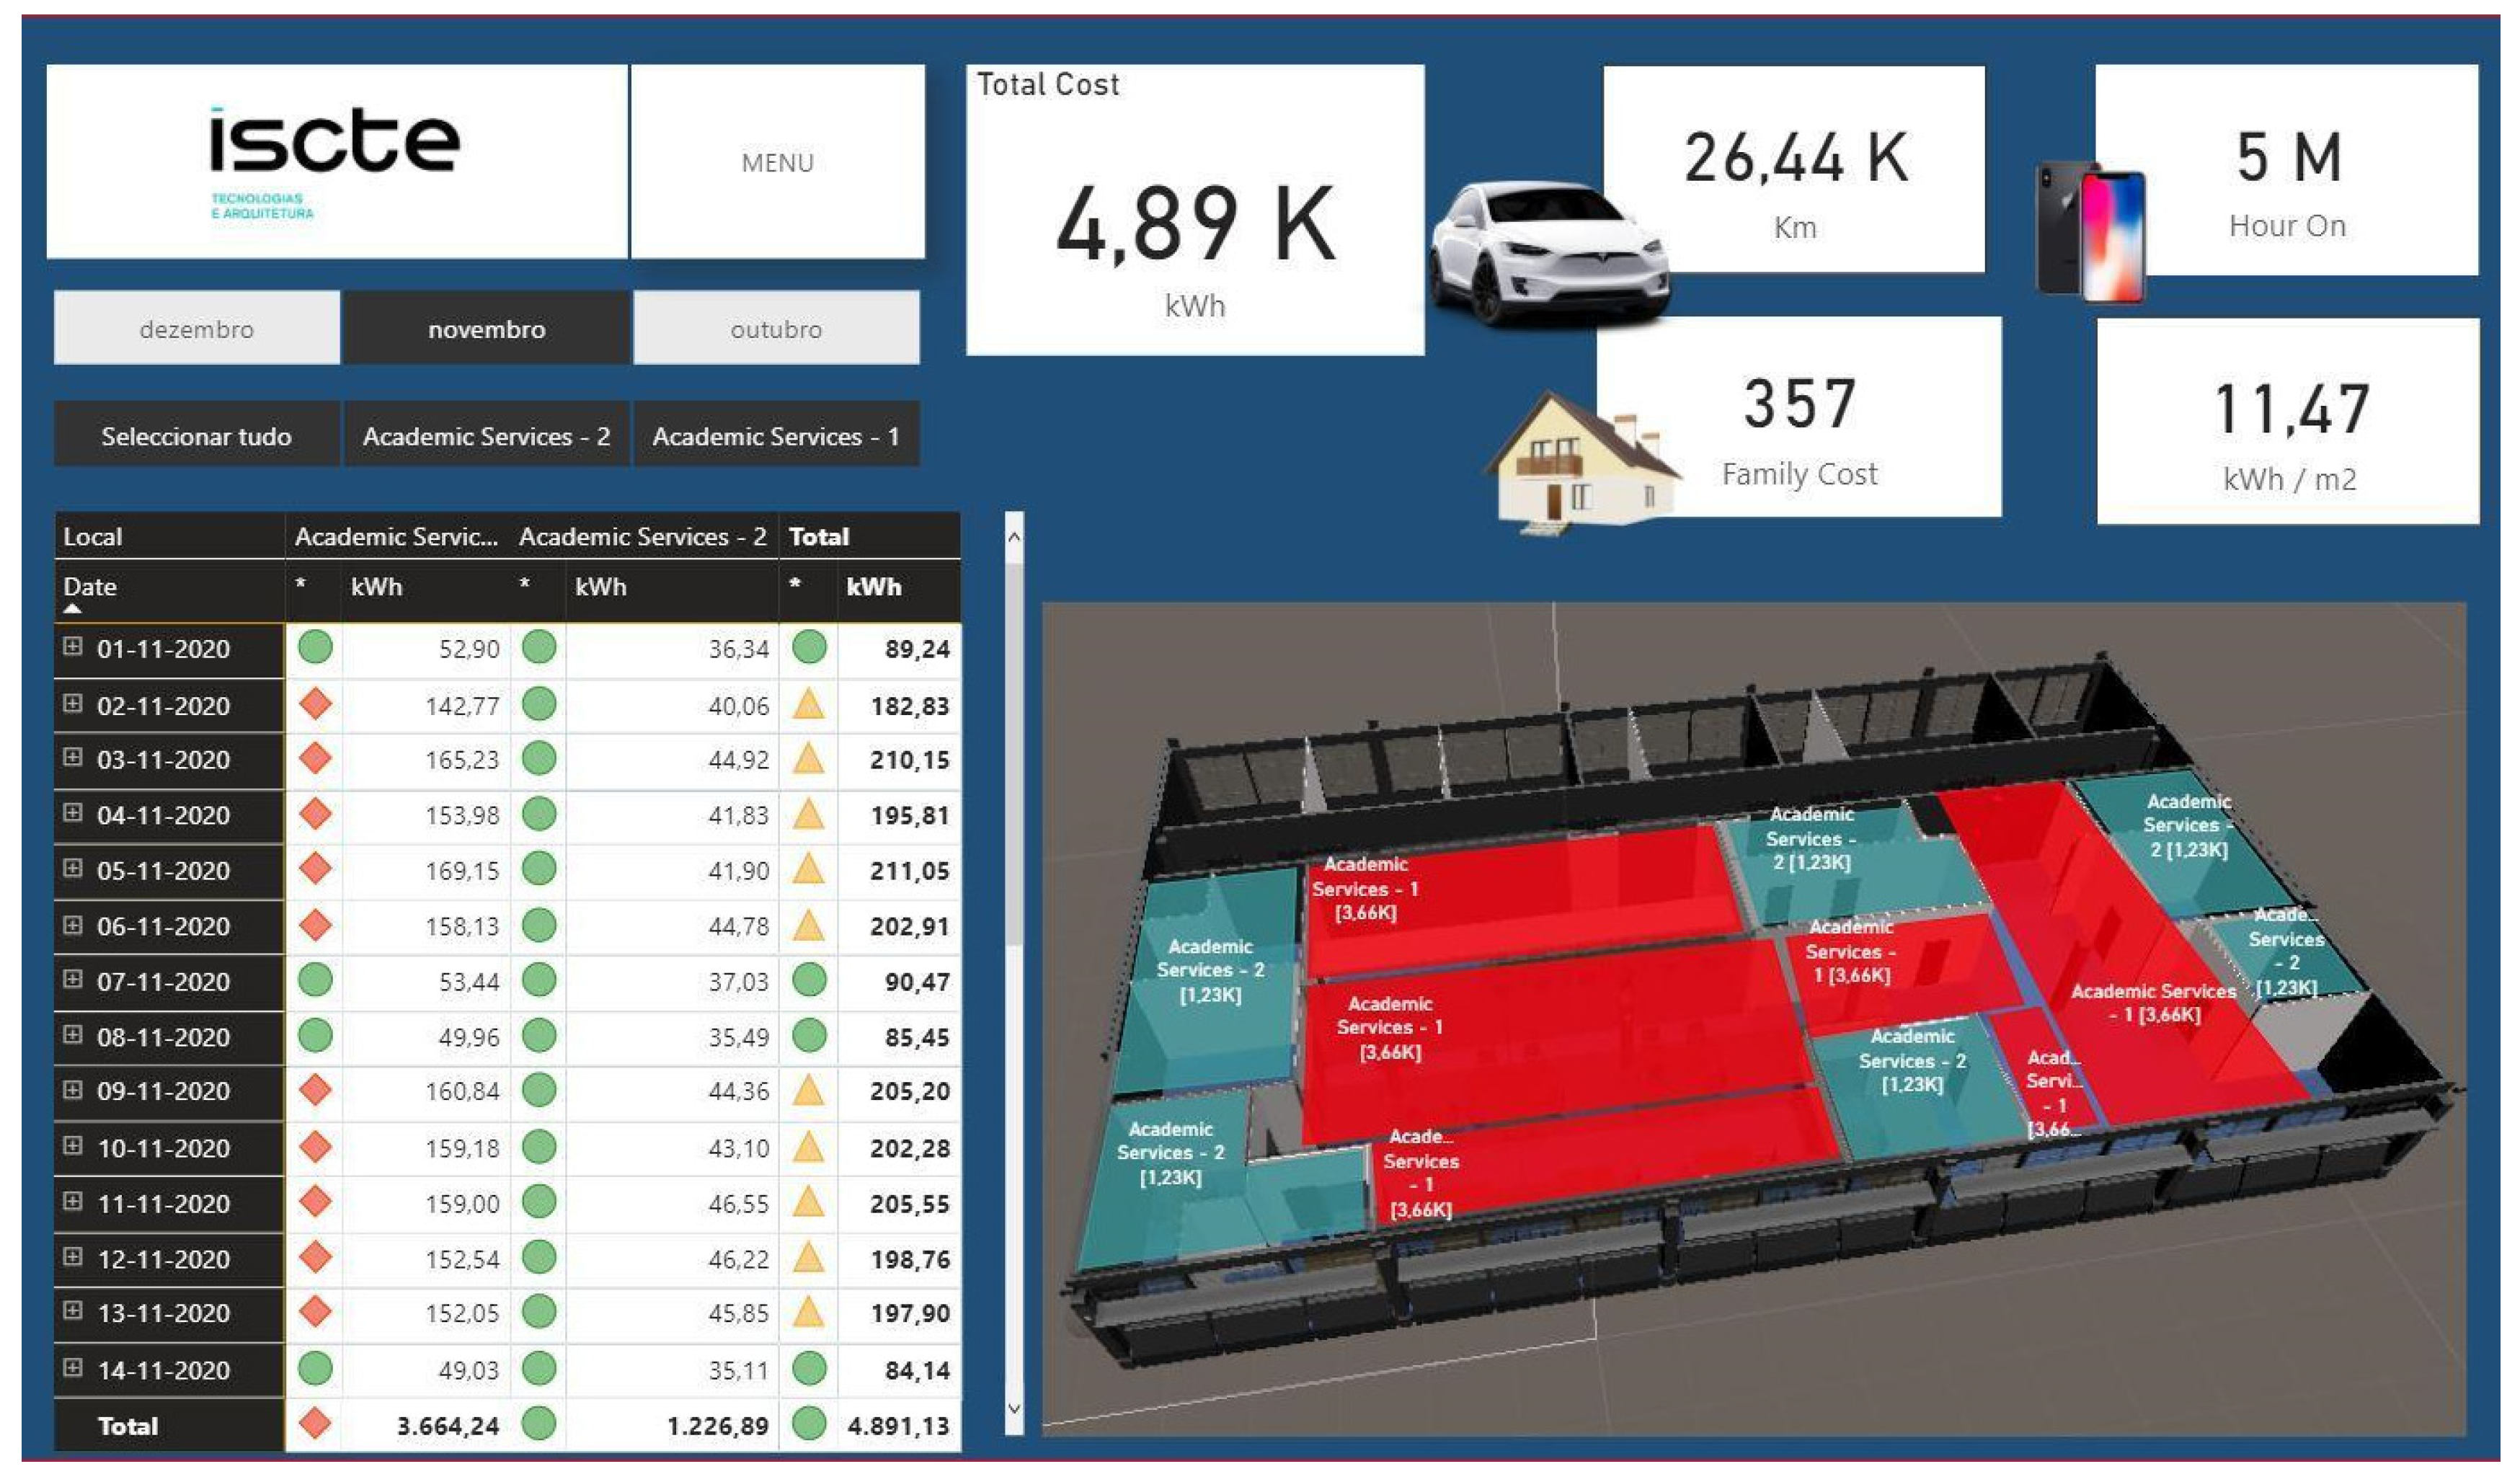
This test pilot was developed to visualize information closer to the physical world, with local users becoming familiar with 3D design. As only the color of the site varies according to consumption, users do not need to understand the real value of energy in kWh because by seeing the color that is marked on the BIM, they can immediately perceive the energy consumption of the site: if the local consumption is high, the space of the BIM model turns red; if the consumption is within the historical average, the space turns blue; and finally if the consumption is lower than the average, the space turns green.
To determine the consumption values in which the BIM model changes color, the average consumption was made every hour. Due to the small number of data obtained during two weeks, it was not possible to test many other hypotheses of color change, and for this reason, it was defined as follows:
- Red: consumption 20% higher than the average of the history of that hour.
- Green: consumption 20% lower than the average for each hour.
- Blue: consumption similar to the average of the hourly history (Mrms) (i.e., between the previous values).
In Table 2, a summary of the above text is made.
In Figure 11, the BIM model of the secretariat has two colors divided into different rooms, this division is due to the particularity of the electrical network of the secretariat, which has two switchboards. In this way, and with the information from each standard and emergency power outlet, an estimate has been made and the area of the office was divided into sections according to the type of board.
Another way of showing the significance of energy consumption is to compare it with the consumption of other devices. The value of the consumption is compared by km driven by a Tesla Model 3 electric car [54], in hours of continuous use of an iPhone 11 Pro smartphone [55], and to the average energy consumed in a day by an average Portuguese family [56]. These values can be seen in the upper part of Figure 11.
All these ways of displaying energy consumption have been presented to the users as the understanding of energy in the standard unit, kWh, serves little as a reference consumption value. Without this, it difficult for users to make decisions to try to change their energy consumption routines to more sustainable forms.
4.2. Evaluation and Discussion
We applied our solution at the ISCTE campus in two different places: (1) open space in an administrative zone, the ISCTE secretary; and (2) classroom C103. One of these places was the secretary open space, where 20 administrative officers run all business related with students. The process started in September 2020, and together with the collected data, we also performed a questionnaire survey with the 20 users from the secretary open space, because as opposed to classroom users, in this space, the users were always the same. Each person was asked to use the proposed solution every day, through a web browser. Every morning, users would go to the webpage, visualize local context information like temperature, humidity, luminosity, and energy consumption with traditional dashboards and the proposed approach with colors. They were also asked to give feedback on their thermal comfort feeling and to fill a small questionnaire. After configuring the system’s visualization application on all desktop computers for easy accessibility and interaction, all users showed interest and curiosity to see the energy consumption and environmental conditions of the workplace daily. They also praised the visual part of the system, finding it appealing. After understanding the meaning of colors and the functioning of the BIM, they showed autonomy when using the visualization application, which led them to share their opinions of consumption and their comfort.
The most pertinent information reported was that, with the BIM visualization, they could know about days when they were spending more or less energy by the color and local demonstration. At the same time, energy consumption magnitude on the display and graphs with kWh units is not understandable for most common users. To address this issue, the innovative comparison table allowed users to compare energy consumption with the use of other devices familiar to them such as an electric car, a smartphone, or a family home. A direct comparison of these variables makes energy usage much easier to be understood. User questionnaires reported a general perception of surprise because the consumption scale at their workspace was much larger than a family home, or even other campus monitored areas since the workspace only represents a tiny section of the ISCTE campus. The consumption view also allowed users to compare values in different areas of the building and detect malfunctions or irregularities, for instance, overnight.
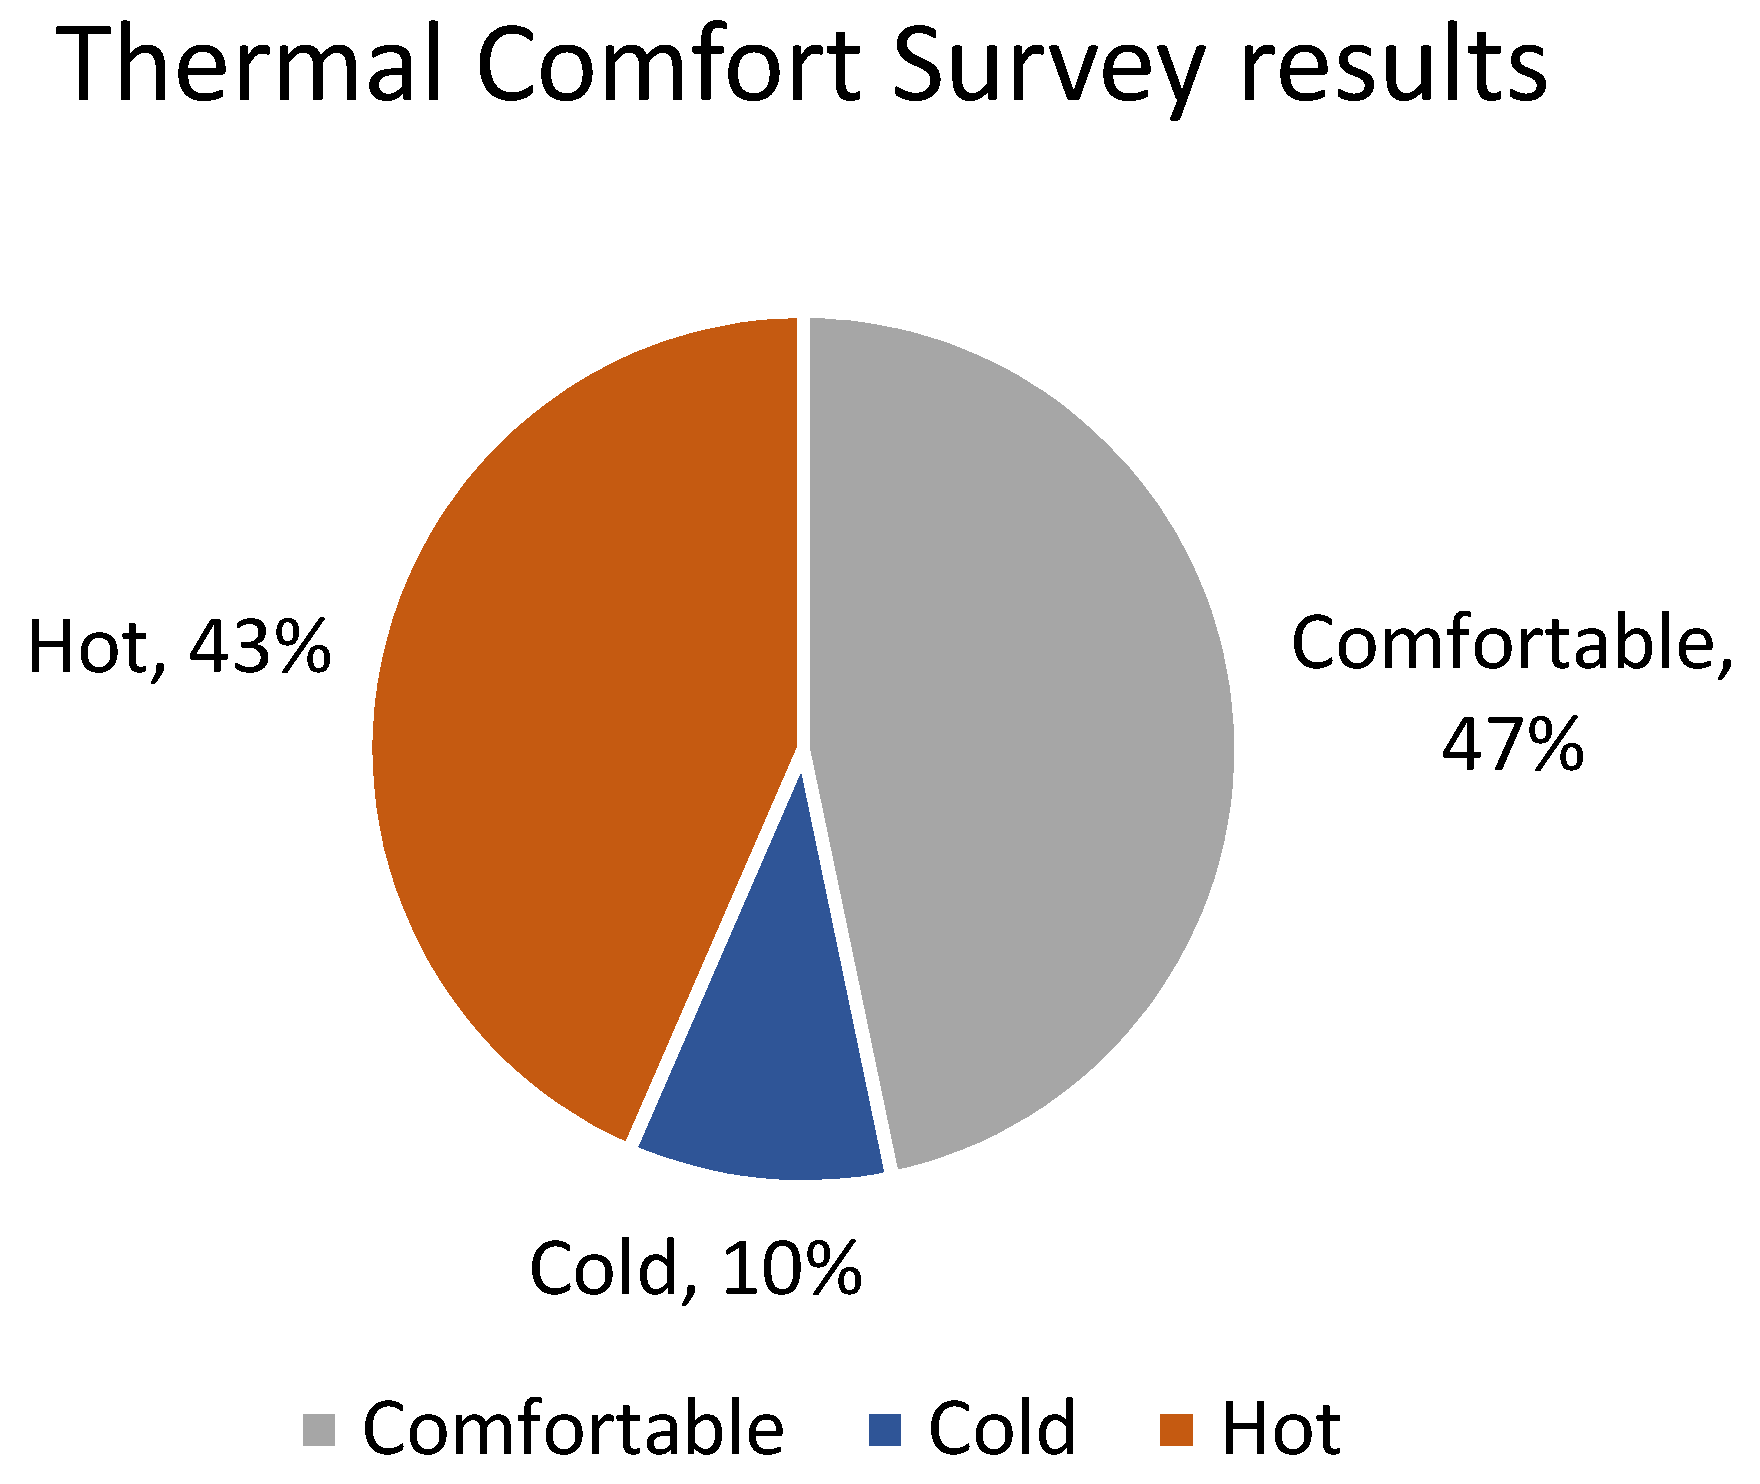
Another essential factor in this description was the aggregation of users from different age groups or technical knowledge in a standard variable, thermal comfort. As expected, each user’s thermal comfort depends on multiple independent factors such as clothing, metabolic rate, and location in the room. The majority of users assumed a comfortable room temperature, while only two to three people were feeling uncomfortable, either too cold or too hot for the same real temperature.
Regarding the temperature values, it was found that the rooms where more employees were working at the same time and more working computers tended to have a slightly higher temperature of 23 °C (2 degrees above the average) than the other monitored rooms. We also found that the temperature inside the room tended to remain constant without suffering much interference from the outside temperature, which, as we have already mentioned, has several changes during the day. Even with the outside temperature reaching extreme values either below or above the average, the office rooms’ temperature did not change so much.
Figure 12 presents the user’s thermal perception results collected from the performed survey. From the collected perceptions, 43% classified the room environment as usually hot.
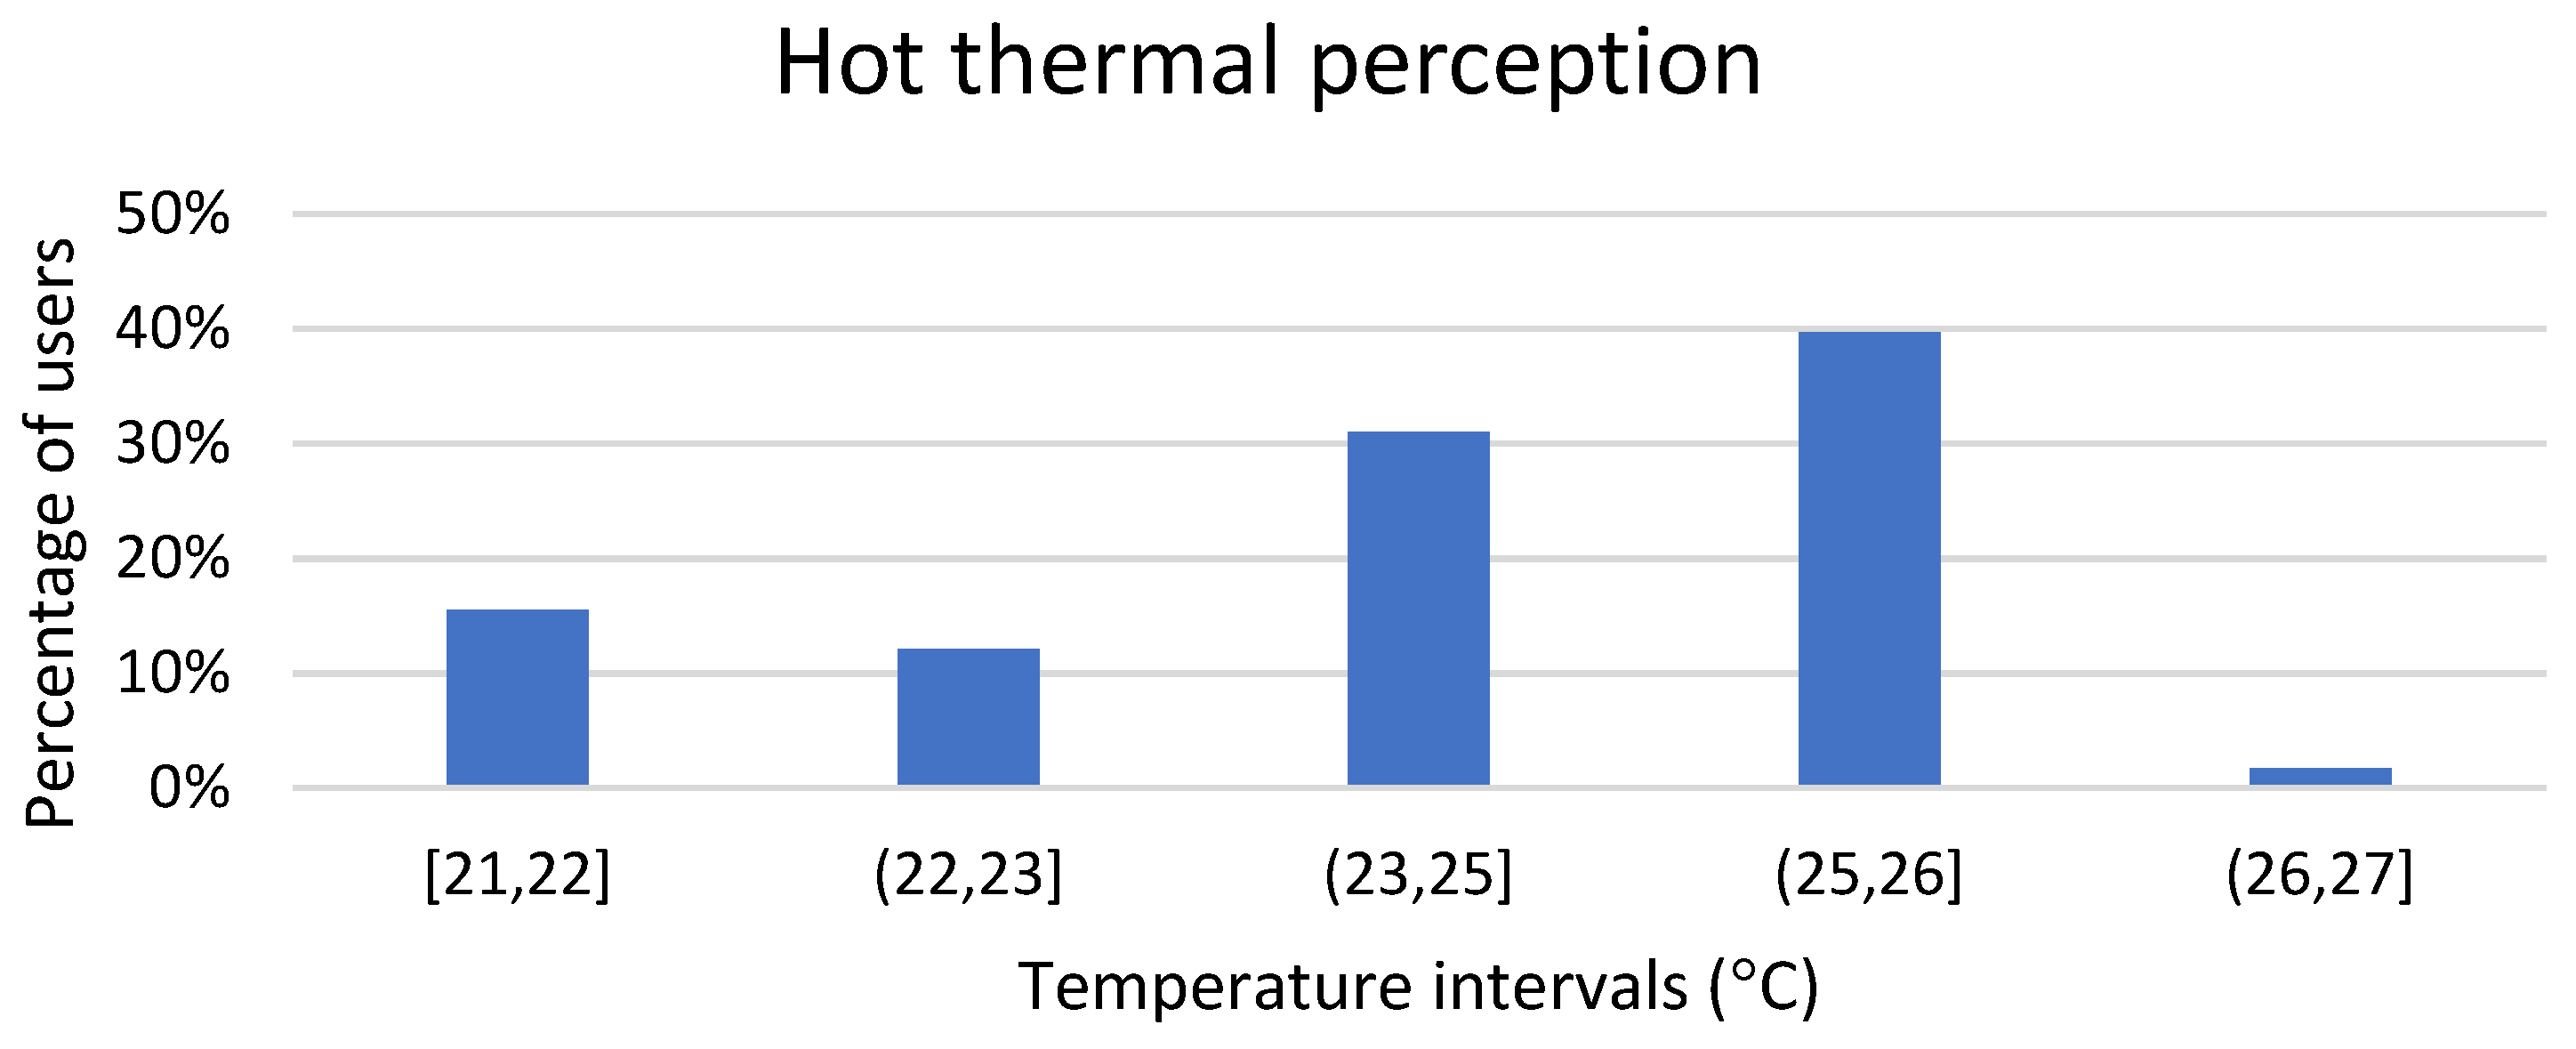
In Figure 13, we determined the intervals where most people classified the room as hot. From the results, we could identify that the majority of users perceived hot from 23 °C upward.
From Figure 14, we can observe that from temperature measurements collected every 10 min from the beginning to the end of the process, 40% of those were above 23 °C. Based on the user’s perception of the environment, the presented results indicate that 40% of the time, the open-space was overheated and therefore, energy could have been saved if air conditioning units were properly programmed.
We also detected some anomalies in the data collected from the humidity level, mainly with the relative humidity value, where rooms closer to the windows had milder relative humidity values (between 40% and 70%) than the other rooms. This can be explained due to these rooms being closer to the windows, and therefore air is hotter, which lowers relative humidity, and is also due to stronger air circulation. We observed that the highest and lowest values reached, for each day, were the external humidity and its level, inside the room, tended to suffer fewer changes.
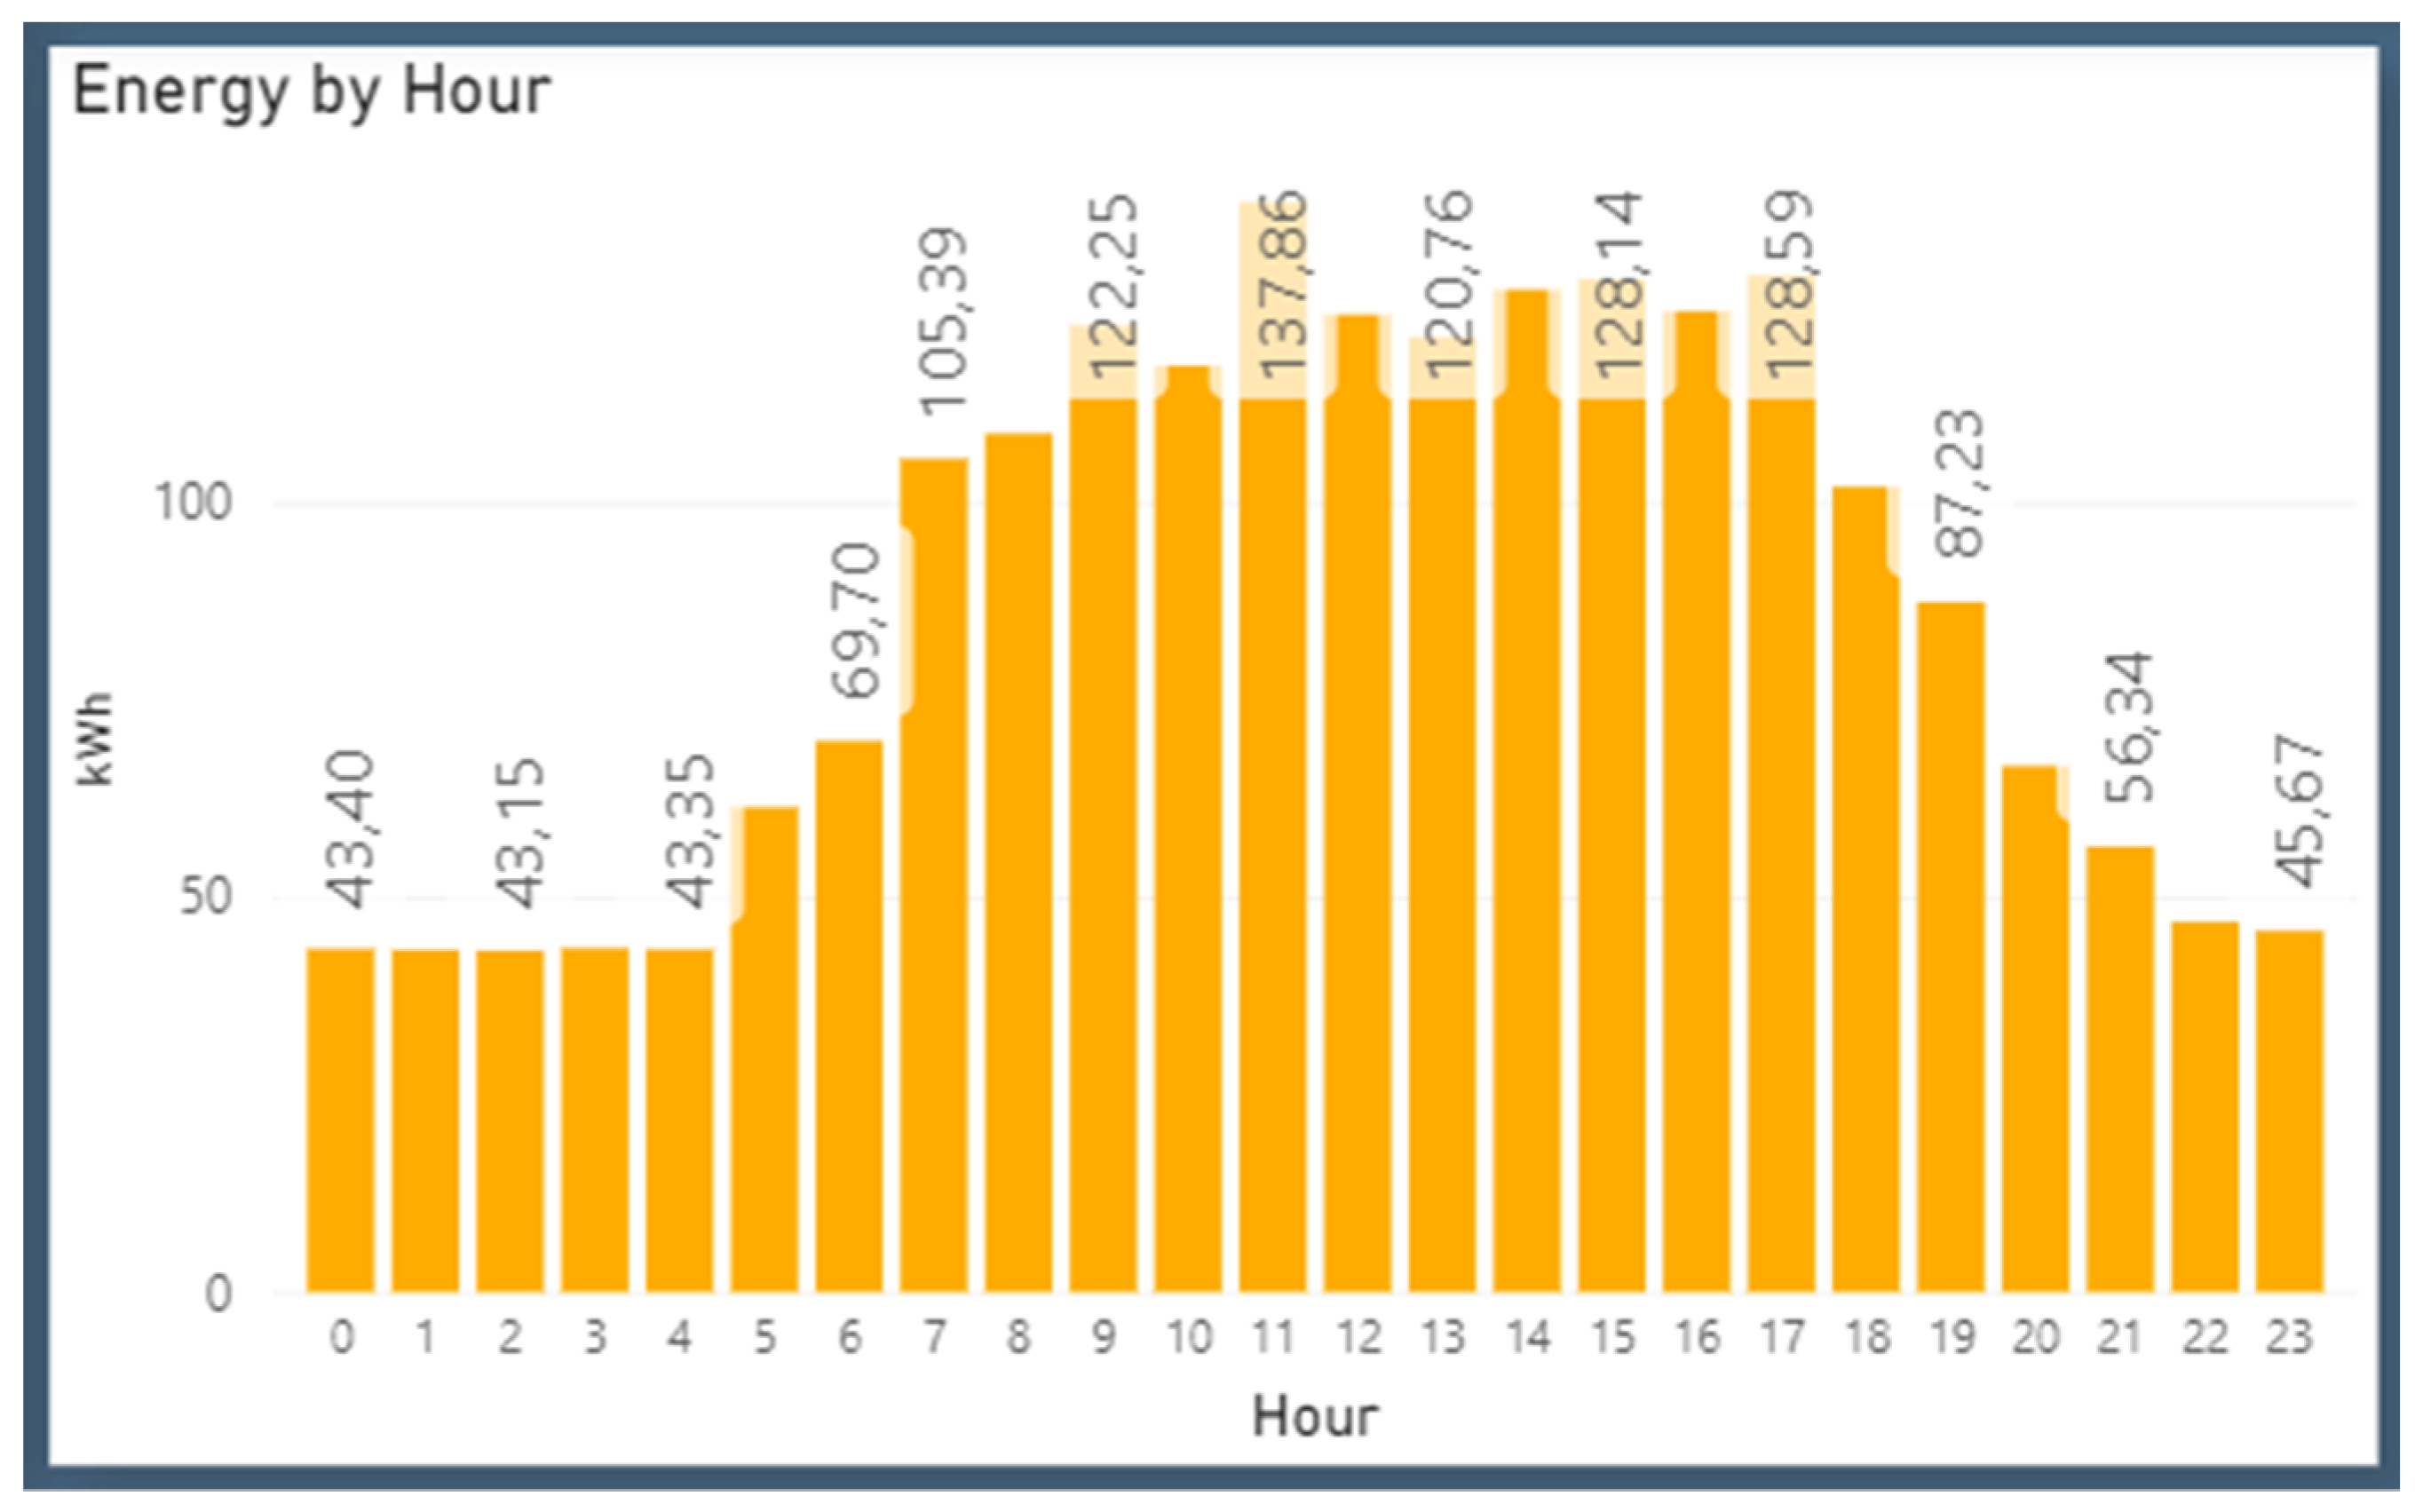
By interpreting the energy consumption data presented in Figure 15, we can conclude that the office had a constant energy consumption of approximately 50 kWh during the day. This consumption came mostly from the users’ computers, printers, and lighting, which were always on during the day. However, we could see that consumption increased with the working hours of the local users, who started working between 7 and 8 a.m. and left at 6 to 7 p.m. This increase in consumption is normal, as users use more electronic devices that consume energy as well as the use of the air conditioning system.
Correlating energy spending and ambient comfort by being able to keep the temperature in the secretariat constant, we were able to reduce the percentage of users who felt that the room was warm and therefore decreased the use of air conditioning. This represents less energy consumed during work hours, and thus a more sustainable use of resources by the subjects.
To obtain a statistically meaningful value of the decrease in energy consumption, a longer data series (more than one year, to obtain homologous values) and more user usage time are needed.
5. Conclusions
As energy demand increases worldwide, local public building users (persons) play an essential role because energy is used for their comfort. This work presents a novel approach where local building users perceive local environment data and energy consumption based on 3D color data representation. Warm colors strive to make people feel warmer than neutral colors, whereas cool colors have the opposite effect. Presentation of energy consumption based on colors allows users to better understand local consumption rather than ambiguous temperature intervals. Integrating hot or cold colors in cool or warm indoor spaces will psychologically cause an optimized thermal perception of occupants against the real thermal situation, which has a positive significance for the thermal environment’s energy saving.
For future comparisons and perceptions of how energy consumption is used by the different sites on the ISCTE-IUL campus, the system calculates the energy density in kWh/m2 so that there is a uniform method of resource consumption comparison between locations.
This study confirmed the hypothesis that delivering hygrothermal and energy consumption information through context-based color coding makes users feel more informed and make a more sustainable use of energy.
The facility management teams also did not have the tools to measure and evaluate energy consumption at the campus or the time and the means to create an extensive analysis of comfort, or even the overall energy performance of each building. With our approach, these tasks are now facilitated and teams can interact with the system from any Internet-connected device.
The users are currently working on a collaborative user approach, where users are aware of their co-occupants’ real-time, auto-reported sensation through mobile devices.
Author Contributions
D.C. and K.C. performed the IoT system development; B.M. performed the user interaction; R.R. developed the BIM model and its integration; and J.C.F. coordinated the research and contributed to the writing of the article. All authors have read and agreed to the published version of the manuscript.
Funding
This research was funded by the Foundation for Science and Technology (FCT) through ISTAR’s project UIDB/04466/2020 and UIDP/04466/2020. J.C.F. received support from the Portuguese National Funds through FITEC—Programa Interface, with reference CIT INOV—INESC INOVAÇÃO—Financiamento Base.
Institutional Review Board Statement
Not applicable.
Informed Consent Statement
Not applicable.
Data Availability Statement
Data Not applicable.
Conflicts of Interest
The authors declare no conflict of interest.
References
- UNEP 2007 Annual Report. Available online: https://wedocs.unep.org/handle/20.500.11822/7647 (accessed on 8 January 2021).
- Becerik-Gerber, B.; Siddiqui, M.K.; Brilakis, I.; El-Anwar, O.; El-Gohary, N.; Mahfouz, T.; Jog, G.M.; Li, S.; Kandil, A.A. Civil Engineering Grand Challenges: Opportunities for Data Sensing, Information Analysis, and Knowledge Discovery. J. Comput. Civ. Eng. 2014, 28, 4. [Google Scholar] [CrossRef]
- Ahmad, A.S.; Hassan, M.Y.; Abdullah, M.P.; Rahman, H.A.; Hussin, F.; Abdullah, H.; Saidur, R. A review on applications of ANN and SVM for building electrical energy consumption forecasting. Renew. Sustain. Energy Rev. 2014, 33, 102–109. [Google Scholar] [CrossRef]
- Hadley, S.W.; Erickson, D.J.; Hernandez, J.L.; Broniak, C.T.; Blasing, T.J. Responses of energy use to climate change: A climate modeling study. Geophys. Res. Lett. 2006, 33, 17703. [Google Scholar] [CrossRef]
- Rehman, A.; Rauf, A.; Ahmad, M.; Chandio, A.A.; Deyuan, Z. The effect of carbon dioxide emission and the consumption of electrical energy, fossil fuel energy, and renewable energy, on economic performance: Evidence from Pakistan. Environ. Sci. Pollut. Res. 2019, 26, 21760–21773. [Google Scholar] [CrossRef] [PubMed]
- Mataloto, B.; Ferreira, J.C.; Cruz, N. LoBEMS—IoT for Building and Energy Management Systems. Electronics 2019, 8, 763. [Google Scholar] [CrossRef] [Green Version]
- Ferreira, J.C.; Afonso, J.A.; Monteiro, V.; Afonso, J.L. An energy management platform for public buildings. Electron 2018, 7, 294. [Google Scholar] [CrossRef] [Green Version]
- Santos, D.; Ferreira, J.C. IoT Power Monitoring System for Smart Environments. Sustainability 2019, 11, 5355. [Google Scholar] [CrossRef] [Green Version]
- Mataloto, B.; Mendes, H.; Ferreira, J.C. Things2people interaction toward energy savings in shared spaces using BIM. Appl. Sci. 2020, 10, 5709. [Google Scholar] [CrossRef]
- Ferreira, J.; Martins, A. Building a Community of Users for Open Market Energy. Energies 2018, 11, 2330. [Google Scholar] [CrossRef] [Green Version]
- Blyth, W.; Bradley, R.; Bunn, D.; Clarke, C.; Wilson, T.; Yang, M. Investment risks under uncertain climate change policy. Energy Policy 2007, 35, 5766–5773. [Google Scholar] [CrossRef]
- Wang, L.; Mathew, P.; Pang, X. Uncertainties in energy consumption introduced by building operations and weather for a medium-size office building. Energy Build. 2012, 53, 152–158. [Google Scholar] [CrossRef] [Green Version]
- Menassa, C.C. Evaluating sustainable retrofits in existing buildings under uncertainty. Energy Build. 2011, 43, 3576–3583. [Google Scholar] [CrossRef]
- Yohanis, Y.G. Domestic energy use and householders’ energy behavior. Energy Policy 2012, 41, 654–665. [Google Scholar] [CrossRef]
- Guerra Santin, O.; Itard, L.; Visscher, H. The effect of occupancy and building characteristics on energy use for space and water heating in Dutch residential stock. Energy Build. 2009, 41, 1223–1232. [Google Scholar] [CrossRef]
- Baek, C.H.; Park, S.H. Changes in renovation policies in the era of sustainability. Energy Build. 2012, 47, 485–496. [Google Scholar] [CrossRef]
- Tobias, L. Retrofitting Office Buildings to Be Green and Energy-Efficient: Optimizing Building Performance, Tenant Satisfaction, and Financial Return; Urban Land Institute: Washington, DC, USA, 2009. [Google Scholar]
- Hong, T.; Yan, D.; D’Oca, S.; Chen, C.F. Ten questions concerning occupant behavior in buildings: The big picture. Build. Environ. 2017, 114, 518–530. [Google Scholar] [CrossRef] [Green Version]
- Owens, J.; Wilhite, H. Household energy behavior in Nordic countries-an unrealized energy saving potential. Energy 1988, 13, 853–859. [Google Scholar] [CrossRef]
- Yan, D.; O’Brien, W.; Hong, T.; Feng, X.; Burak Gunay, H.; Tahmasebi, F.; Mahdavi, A. Occupant behavior modeling for building performance simulation: Current state and future challenges. Energy Build. 2015, 107, 264–278. [Google Scholar] [CrossRef] [Green Version]
- Sun, K.; Yan, D.; Hong, T.; Guo, S. Stochastic modeling of overtime occupancy and its application in building energy simulation and calibration. Build. Environ. 2014, 79, 1–12. [Google Scholar] [CrossRef] [Green Version]
- Hoes, P.; Hensen, J.L.M.; Loomans, M.G.L.C.; de Vries, B.; Bourgeois, D. User behavior in whole building simulation. Energy Build. 2009, 41, 295–302. [Google Scholar] [CrossRef] [Green Version]
- Sun, K.; Hong, T.; Taylor-Lange, S.C.; Piette, M.A. A pattern-based automated approach to building energy model calibration. Appl. Energy 2016, 165, 214–224. [Google Scholar] [CrossRef] [Green Version]
- Living Labs: Successful User Engagement on Energy-Efficiency through Participatory Innovation-ProQuest. Available online: https://search.proquest.com/docview/1690239375?pq-origsite=gscholar (accessed on 13 December 2020).
- Barrios-O’Neill, D.; Hook, A. Future energy networks and the role of interactive gaming as simulation. Futures 2016, 81, 119–129. [Google Scholar] [CrossRef]
- Sütterlin, B.; Brunner, T.A.; Siegrist, M. Who puts the most energy into energy conservation? A segmentation of energy consumers based on energy-related behavioral characteristics. Energy Policy 2011, 39, 8137–8152. [Google Scholar] [CrossRef]
- Gölz, S.; Hahnel, U.J.J. What motivates people to use energy feedback systems? A multiple goal approach to predict long-term usage behaviour in daily life. Energy Res. Soc. Sci. 2016, 21, 155–166. [Google Scholar] [CrossRef]
- Aksoezen, M.; Daniel, M.; Hassler, U.; Kohler, N. Building age as an indicator for energy consumption. Energy Build. 2015, 87, 74–86. [Google Scholar] [CrossRef]
- Houde, S.; Todd, A.; Sudarshan, A.; Flora, J.A.; Armel, K.C. Real-time feedback and electricity consumption: A field experiment assessing the potential for savings and persistence. Energy J. 2013, 34, 87–102. [Google Scholar] [CrossRef]
- Abrahamse, W.; Steg, L.; Vlek, C.; Rothengatter, T. A review of intervention studies aimed at household energy conservation. J. Environ. Psychol. 2005, 25, 273–291. [Google Scholar] [CrossRef]
- Ma, H.; Du, N.; Yu, S.; Lu, W.; Zhang, Z.; Deng, N.; Li, C. Analysis of typical public building energy consumption in northern China. Energy Build. 2017, 136, 139–150. [Google Scholar] [CrossRef]
- Thewes, A.; Maas, S.; Scholzen, F.; Waldmann, D.; Zürbes, A. Field study on the energy consumption of school buildings in Luxembourg. Energy Build. 2014, 68, 460–470. [Google Scholar] [CrossRef]
- Raatikainen, M.; Skön, J.P.; Leiviskä, K.; Kolehmainen, M. Intelligent analysis of energy consumption in school buildings. Appl. Energy 2016, 165, 416–429. [Google Scholar] [CrossRef]
- Al-Ali, A.R.; Zualkernan, I.A.; Rashid, M.; Gupta, R.; Alikarar, M. A smart home energy management system using IoT and big data analytics approach. IEEE Trans. Consum. Electron. 2017, 63, 426–434. [Google Scholar] [CrossRef]
- Ejaz, W.; Naeem, M.; Shahid, A.; Anpalagan, A.; Jo, M. Efficient Energy Management for the Internet of Things in Smart Cities. IEEE Commun. Mag. 2017, 55, 84–91. [Google Scholar]
- Chooruang, K.; Meekul, K. Design of an IoT Energy Monitoring System. In Proceedings of the International Conference on ICT and Knowledge Engineering, Siam University, Bangkok, Thailand, 20–22 November 2019; Volume 2018, pp. 48–51. [Google Scholar]
- Li, C.Z.; Xue, F.; Li, X.; Hong, J.; Shen, G.Q. An Internet of Things-enabled BIM platform for on-site assembly services in prefabricated construction. Autom. Constr. 2018, 89, 146–161. [Google Scholar] [CrossRef]
- DIng, K.; Shi, H.; Hui, J.; Liu, Y.; Zhu, B.; Zhang, F.; Cao, W. Smart steel bridge construction enabled by BIM and Internet of Things in industry 4.0: A framework. In Proceedings of the ICNSC 2018—15th IEEE International Conference on Networking, Sensing and Control, Zhuhai, China, 27–29 March 2018. [Google Scholar]
- Natephra, V.; Motamedi, A. Live data visualization of IoT sensors using augmented reality (AR) and BIM. In Proceedings of the 36th International Symposium on Automation and Robotics in Construction (ISARC 2019), Banff, AB, Canada, 21–24 May 2019; Volume 2, p. 1338. [Google Scholar]
- Tang, S.; Shelden, D.R.; Eastman, C.M.; Pishdad-Bozorgi, P.; Gao, X. A review of building information modeling (BIM) and the internet of things (IoT) devices integration: Present status and future trends. Autom. Constr. 2019, 101, 127–139. [Google Scholar] [CrossRef]
- Chang, K.M.; Dzeng, R.J.; Wu, Y.J. An automated IoT visualization BIM platform for decision support in facilities management. Appl. Sci. 2018, 8, 1086. [Google Scholar] [CrossRef] [Green Version]
- Li, N.; Becerik-Gerber, B.; Krishnamachari, B.; Soibelman, L. A BIM centered indoor localization algorithm to support building fire emergency response operations. Autom. Constr. 2014, 42, 78–89. [Google Scholar] [CrossRef]
- Patti, E.; Mollame, A.; Erba, D.; Dalmasso, D.; Osello, A.; Macii, E.; Acquaviva, A. Information Modeling for Virtual and Augmented Reality. IT Prof. 2017, 19, 52–60. [Google Scholar] [CrossRef]
- Directive 2008/98/EC on Waste (Waste Framework Directive). Available online: https://ec.europa.eu/environment/waste/framework/ (accessed on 17 December 2020).
- Castelli, N.; Stevens, G.; Jakobi, T.; Ogonowski, C. Placing information at home: Using room context in domestic design. In Proceedings of the UbiComp 2014—Adjunct Proceedings of the 2014 ACM International Joint Conference on Pervasive and Ubiquitous Computing, Seattle, WA, USA, 13–17 September 2014; pp. 919–922. [Google Scholar]
- Costanza, E.; Ramchurn, S.D.; Jennings, N.R. Understanding domestic energy consumption through interactive visualisation: A field study. In Proceedings of the UbiComp’12-Proceedings of the 2012 ACM Conference on Ubiquitous Computing, New York, NY, USA, 5–8 September 2012; pp. 216–225. [Google Scholar]
- Pasini, D. Connecting BIM and IoT for addressing user awareness toward energy savings. J. Struct. Integr. Maint. 2018, 3, 243–253. [Google Scholar] [CrossRef]
- Stavropoulos, T.G.; Koutitas, G.; Vrakas, D.; Kontopoulos, E.; Vlahavas, I. A smart university platform for building energy monitoring and savings. J. Ambient Intell. Smart Environ. 2016, 8, 301–323. [Google Scholar] [CrossRef] [Green Version]
- Teixeira, N.I.O.G. Rede de Sensores Wireless Baseada na Tecnologia LoRa Para Monitorização de Processo na Indústria. Available online: https://recipp.ipp.pt/handle/10400.22/14640 (accessed on 17 December 2020).
- Henrique, P.; Pereira, M. Desenvolvimento de dispositivo de sensoreamento para cidades inteligentes usando o padrão LoRaWAN. Acta Bot. Brasilica 2019, 30, 39–64. [Google Scholar]
- Node-Red-Node-Mysql. Available online: https://flows.nodered.org/node/node-red-node-mysql (accessed on 18 October 2020).
- MariaDB Foundation—MariaDB.org. Available online: https://mariadb.org/ (accessed on 18 October 2020).
- American Society of Heating and Air-Conditioning Engineers. Available online: https://searchdatacenter.techtarget.com/definition/ASHRAE (accessed on 18 October 2020).
- Autobahn-Test: Audi e-tron gegen Rest der E-Auto-Welt. Available online: https://nextmove.de/autobahn-test-audi-e-tron-gegen-den-rest-der-elektroauto-welt/ (accessed on 13 December 2020).
- iPhone—Apple (PT). Available online: https://www.apple.com/pt/iphone/#footnote-9 (accessed on 25 October 2020).
- 15, 25 ou Mais de 30 Euros por Mês? Saiba Quanto pode Aumentar a Conta da luz das Famílias na Quarentena—ECO. Available online: https://eco.sapo.pt/2020/04/06/15-25-ou-mais-de-30-euros-por-mes-saiba-quanto-pode-aumentar-a-conta-da-luz-das-familias-na-quarentena/ (accessed on 25 October 2020).
Figure 1.
Architecture and constitution of the Internet of Things (IoT) system.

Figure 2.
Prototype of the IoT sensor for environmental conditions.

Figure 3.
Prototype of the three-phase current IoT sensor.

Figure 4.
Three TC SCT-013-000 sensors used to measure the three-phase current.

Figure 5.
Deployment of energy sensors.

Figure 6.
Sensors in operation and transmitting data to the IoT system.

Figure 7.
Application features from the server.

Figure 8.
Building information model (BIM) of the Academic Services.

Figure 9.
Display interface for the user with the selected temperature mode.

Figure 10.
Display interface for the user with the selected humidity mode.

Figure 11.
BIM of the energy consumption of the Academics Services of ISCTE-IUL.

Figure 12.
Thermal comfort survey results.

Figure 13.
User’s hot thermal perception.

Figure 14.
Percentage of temperature measurements per degree Celsius.

Figure 15.
Average energy consumption per hour in a day.


Table 1.
Color scale for temperature and humidity.
| Temperature | Humidity | ||
|---|---|---|---|
| Color | Temperature Range | Color | Humidity Level |
| Blue | <22 °C | Red | <40% |
| Green | 22 °C–28 °C | Green | 40–70% |
| Red | >28 °C | Yellow | >70% |
Table 2.
Color scale for energy consumption.
| Electrical Energy Consumption | |
|---|---|
| Color | Energy (kWh) |
| Green | >Mrms kWh − 20% |
| Blue | Mrms kWh |
| Red | <Mrms kWh + 20% |
Publisher’s Note: MDPI stays neutral with regard to jurisdictional claims in published maps and institutional affiliations. |
© 2021 by the authors. Licensee MDPI, Basel, Switzerland. This article is an open access article distributed under the terms and conditions of the Creative Commons Attribution (CC BY) license (http://creativecommons.org/licenses/by/4.0/).
Share and Cite
MDPI and ACS Style
Mataloto, B.; Calé, D.; Carimo, K.; Ferreira, J.C.; Resende, R. 3D IoT System for Environmental and Energy Consumption Monitoring System. Sustainability 2021, 13, 1495. https://doi.org/10.3390/su13031495
AMA Style
Mataloto B, Calé D, Carimo K, Ferreira JC, Resende R. 3D IoT System for Environmental and Energy Consumption Monitoring System. Sustainability. 2021; 13(3):1495. https://doi.org/10.3390/su13031495
Chicago/Turabian StyleMataloto, Bruno, Daniel Calé, Kaiser Carimo, Joao C. Ferreira, and Ricardo Resende. 2021. "3D IoT System for Environmental and Energy Consumption Monitoring System" Sustainability 13, no. 3: 1495. https://doi.org/10.3390/su13031495
Note that from the first issue of 2016, this journal uses article numbers instead of page numbers. See further details here.