Article

Equilibrium Relationship between Ecosystem Service Supply and Consumption Driven by Economic Development and Ecological Restoration

1
School of Economics and Management, Northeast Forestry University, Harbin 150040, China
2
School of Forestry, Northeast Forestry University, Harbin 150040, China
3
School of Mining Engineering, Heilongjiang University of Science and Technology, Harbin 150022, China
*
Author to whom correspondence should be addressed.
Sustainability 2021, 13(3), 1486; https://doi.org/10.3390/su13031486
Submission received: 2 December 2020 / Revised: 20 January 2021 / Accepted: 22 January 2021 / Published: 1 February 2021

Abstract

:
Economic development and ecological restoration guided by policies has had a profound impact on the relationship between ecosystem service supply and consumption in the past few decades. Exploring the relationship in specific study areas is necessary to support regional planning for sustainability. In this study, we analyzed the equilibrium relationship between ecosystem service supply and consumption driven by economic development and ecological restoration from 1995 to 2018 in Northeast China. We quantified the supply and consumption of three critical ecosystem services, food production, water yield and atmospheric regulation, and identified the main areas for supply and consumption of ecosystem services. We measured the quantity and spatial equilibrium relationship between ecosystem service supply and consumption driven by economic development and ecological restoration at economic megaregion scale. We found the new industrial structure shaped by regional economic development policies formed the new ecosystem service consumer demand. The development of agricultural industry not only resulted in the increase of water consumption, but also the scope of water consumption was expanded in Northeast China. The development of tertiary industry causes the change of atmospheric regulation consumption in urban agglomeration. What’s more, economic development exacerbated imbalances in the supply and consumption of ecosystem services. The unbalanced areas where food supply was less than consumption were in the clusters of Harbin, Changchun, Shenyang, and coastal cities. Since food products can circulate freely through the market, this imbalance will not fundamentally affect regional food security, but will improve the level of agricultural industrialization and scale. The implementation of the grain economic policy caused the rapid expansion of unbalanced areas where water supply was less than consumption. The incredible space mismatch between the supply and consumption of ecosystem services still exists for a long time. However, the implementation of the ecological restoration didn’t effectively solve the problem of insatiable ecosystem service consumption. The ecosystem service consumption brought by economic development need to be given the utmost attention when formulating ecological restoration policies and economic development policies. The results can provide insights for enhancing economic sustainability in northeast china, as well other economic megaregion with similar characteristics throughout the world.

1. Introduction

Ecosystems are natural resources that contribute to societal wellbeing in multiple ways [1]. The past few decades have witnessed the implementation of China’s regional economic development policy, with the GDP increasing from US$97.988 billion in 1990 to US$888.74 billion in 2018 in Northeast China [2]. China has successively implemented regional economic development strategies such as “The rise of the eastern coast”, “The development of the western region in China”, “The strategy of revitalizing the old industrial base in Northeast China” and “The rise of Central China”. Regional economic development strategies make a significant contribution to economic and social development, while posing a grave pressure to the stable operation of ecosystems. During the process of regional economic development, forest, grassland, wetland and other ecosystems have been converted into human-dominated ecosystems at an unprecedented scale and pace [3]. Because of differentiated ecological service output of different ecosystems and differentiated consumption of ecosystem services by different industries, this process inevitably changes the structure of the antecedent ecosystems and regional industry [4], resulting in the large-scale changes in the supply and consumption structure of ecosystem services. At the same time, since the 1990s, China has successively implemented ecological restoration such as the first and second phases of “The Natural Forest Conservation Program (NFCP)”, “3-North Shelter Forest Program”, grassland protection, wetland protection, and construction of a number of ecological function zones [5]. Economic sustainability has become one of the most pressing issues facing humanity today. Understanding the change of the relationship between the supply and consumption of ecosystem services driven by economic development and ecological restoration is crucial for achieving the balance between economic development and ecological protection [6].
Considerable research has demonstrated that the economic development is the main driving force of change in the supply and consumption structure of ecosystem services (ESs) [7]. ES consumption is the sum of all ecosystem services currently consumed by society in a given period of time. However, the effects of economic development and ecological restoration on the supply and consumption of ecosystem services are not consistent among different studies, and in some cases, research results are contradictory. For example, a number of studies have revealed the supply of ecosystem services were negatively correlated with economic development [8]. The main reason is that the implementation of regional economic development strategies is often accompanied by large-scale land use changes, which destroy the original ecosystem’s circular function and weaken the supply capacity of ecosystem services. However, some studies have found the opposite results—ecosystem service supply would increase during economic development [9]. The main reason is that economic development has brought about the agglomeration and flow of population, which is conducive to the restoration of the ecosystem on a large area of idle land and enhances the supply capacity of ecosystem services. To sum up, the relationship between economic development and the supply and consumption of ecosystem services is complex. Extending the obtained results directly to other study area might lead to erroneous conclusions [10]. It is necessary to detect the relationship between economic development and the structure evolution of ecosystem service supply and consumption in specific research area in order to provide scientific basis for making reasonable regional economic development policies and ecological restoration policies.
Additionally, ecological restoration policies are also an important driving force for changing the ecosystem service supply structure. However, the impact of ecological restoration on the supply of ecosystem services is not consistent in different regions. Many studies believe that ecological restoration have improved the stability of ecosystems such as forests, grasslands, and wetlands, and curbed the deterioration of the ecosystem itself [11], along with improving the supply capacity of ecosystem services. However, other studies have found that the dilemma of insufficient ecosystem services in economic and industrial functional zones has not been improved, although forests, grasslands, wetlands and other ecosystems themselves have been restored [12]. Although a series of ecological restoration policies have been implemented in Northeast China, many industrial functional areas are still facing problems such as water shortages and environmental pollution.
Studying ecosystem services from the point of view of the ecosystem itself or the economic zone itself cannot effectively solve the current ecological problems such as water shortages and environmental pollution. Therefore, under the framework of a megaregion [13], a full understanding of the relationship between the supply and consumption of ecosystem services driven by economic development and ecological restoration, and the relationship between the ecosystem service supply area and the industrial function area is of great significance to minimize the negative impact of regional economic development on the ecosystem and to enhance the effect of ecological restoration policies. The regional economic development policy has caused serious degradation of the regional ecosystem, which not only poses a threat to regional ecological security, but also restricts future economic development, although promoting the rapid economic development [14]. In addition, the changes in the industrial structure caused by economic development policies have created new demand for ecosystem services, which are growing rapidly. A large number of studies mainly focus on the supply and value of ecosystem services [1,15]. However, few articles have studied the changes in the relationship between ecosystem service supply and consumption driven by economic development and ecological restoration [16]. Without an understanding of the linkages between the major consumer and supply areas of ecosystem services, the economic and industrial overdevelopment may lead to the degradation of the supply capacity of key ecosystem services in the major supply areas. In addition, the large amount of ecosystem service consumption formed by the excessive development of industrial function zones lacks the support of the corresponding ecological function zones, which will still cause an imbalance in the supply and consumption of ecosystem services and restrict the sustainable development of the economy.
Based on the above review of the literature, this study was designed to explore the equilibrium relationship between ecosystem service supply and consumption driven by economic development and ecological restoration. The study had two components. First, three types of ecosystem services, including water, air conditioning and food production, were selected to quantitatively assess the evolution of the spatio-temporal pattern of ecosystem service supply and consumption from 1995 to 2018. Second, we determine the main supply and consumption areas of ecosystem services and quantify the equilibrium relationship between ecosystem service supply and consumption driven by economic development and ecological restoration in economic megaregion. Finally, the impact of economic development and ecological restoration on the equilibrium relationship between ecosystem service supply and consumption was analyzed. Our results are expected to provide quantitative information for realizing coordinated development of economy and environment and enhancing economic region sustainability in northeastern China and other economic megaregion with similar characteristics throughout the world.

2. Materials and Methods
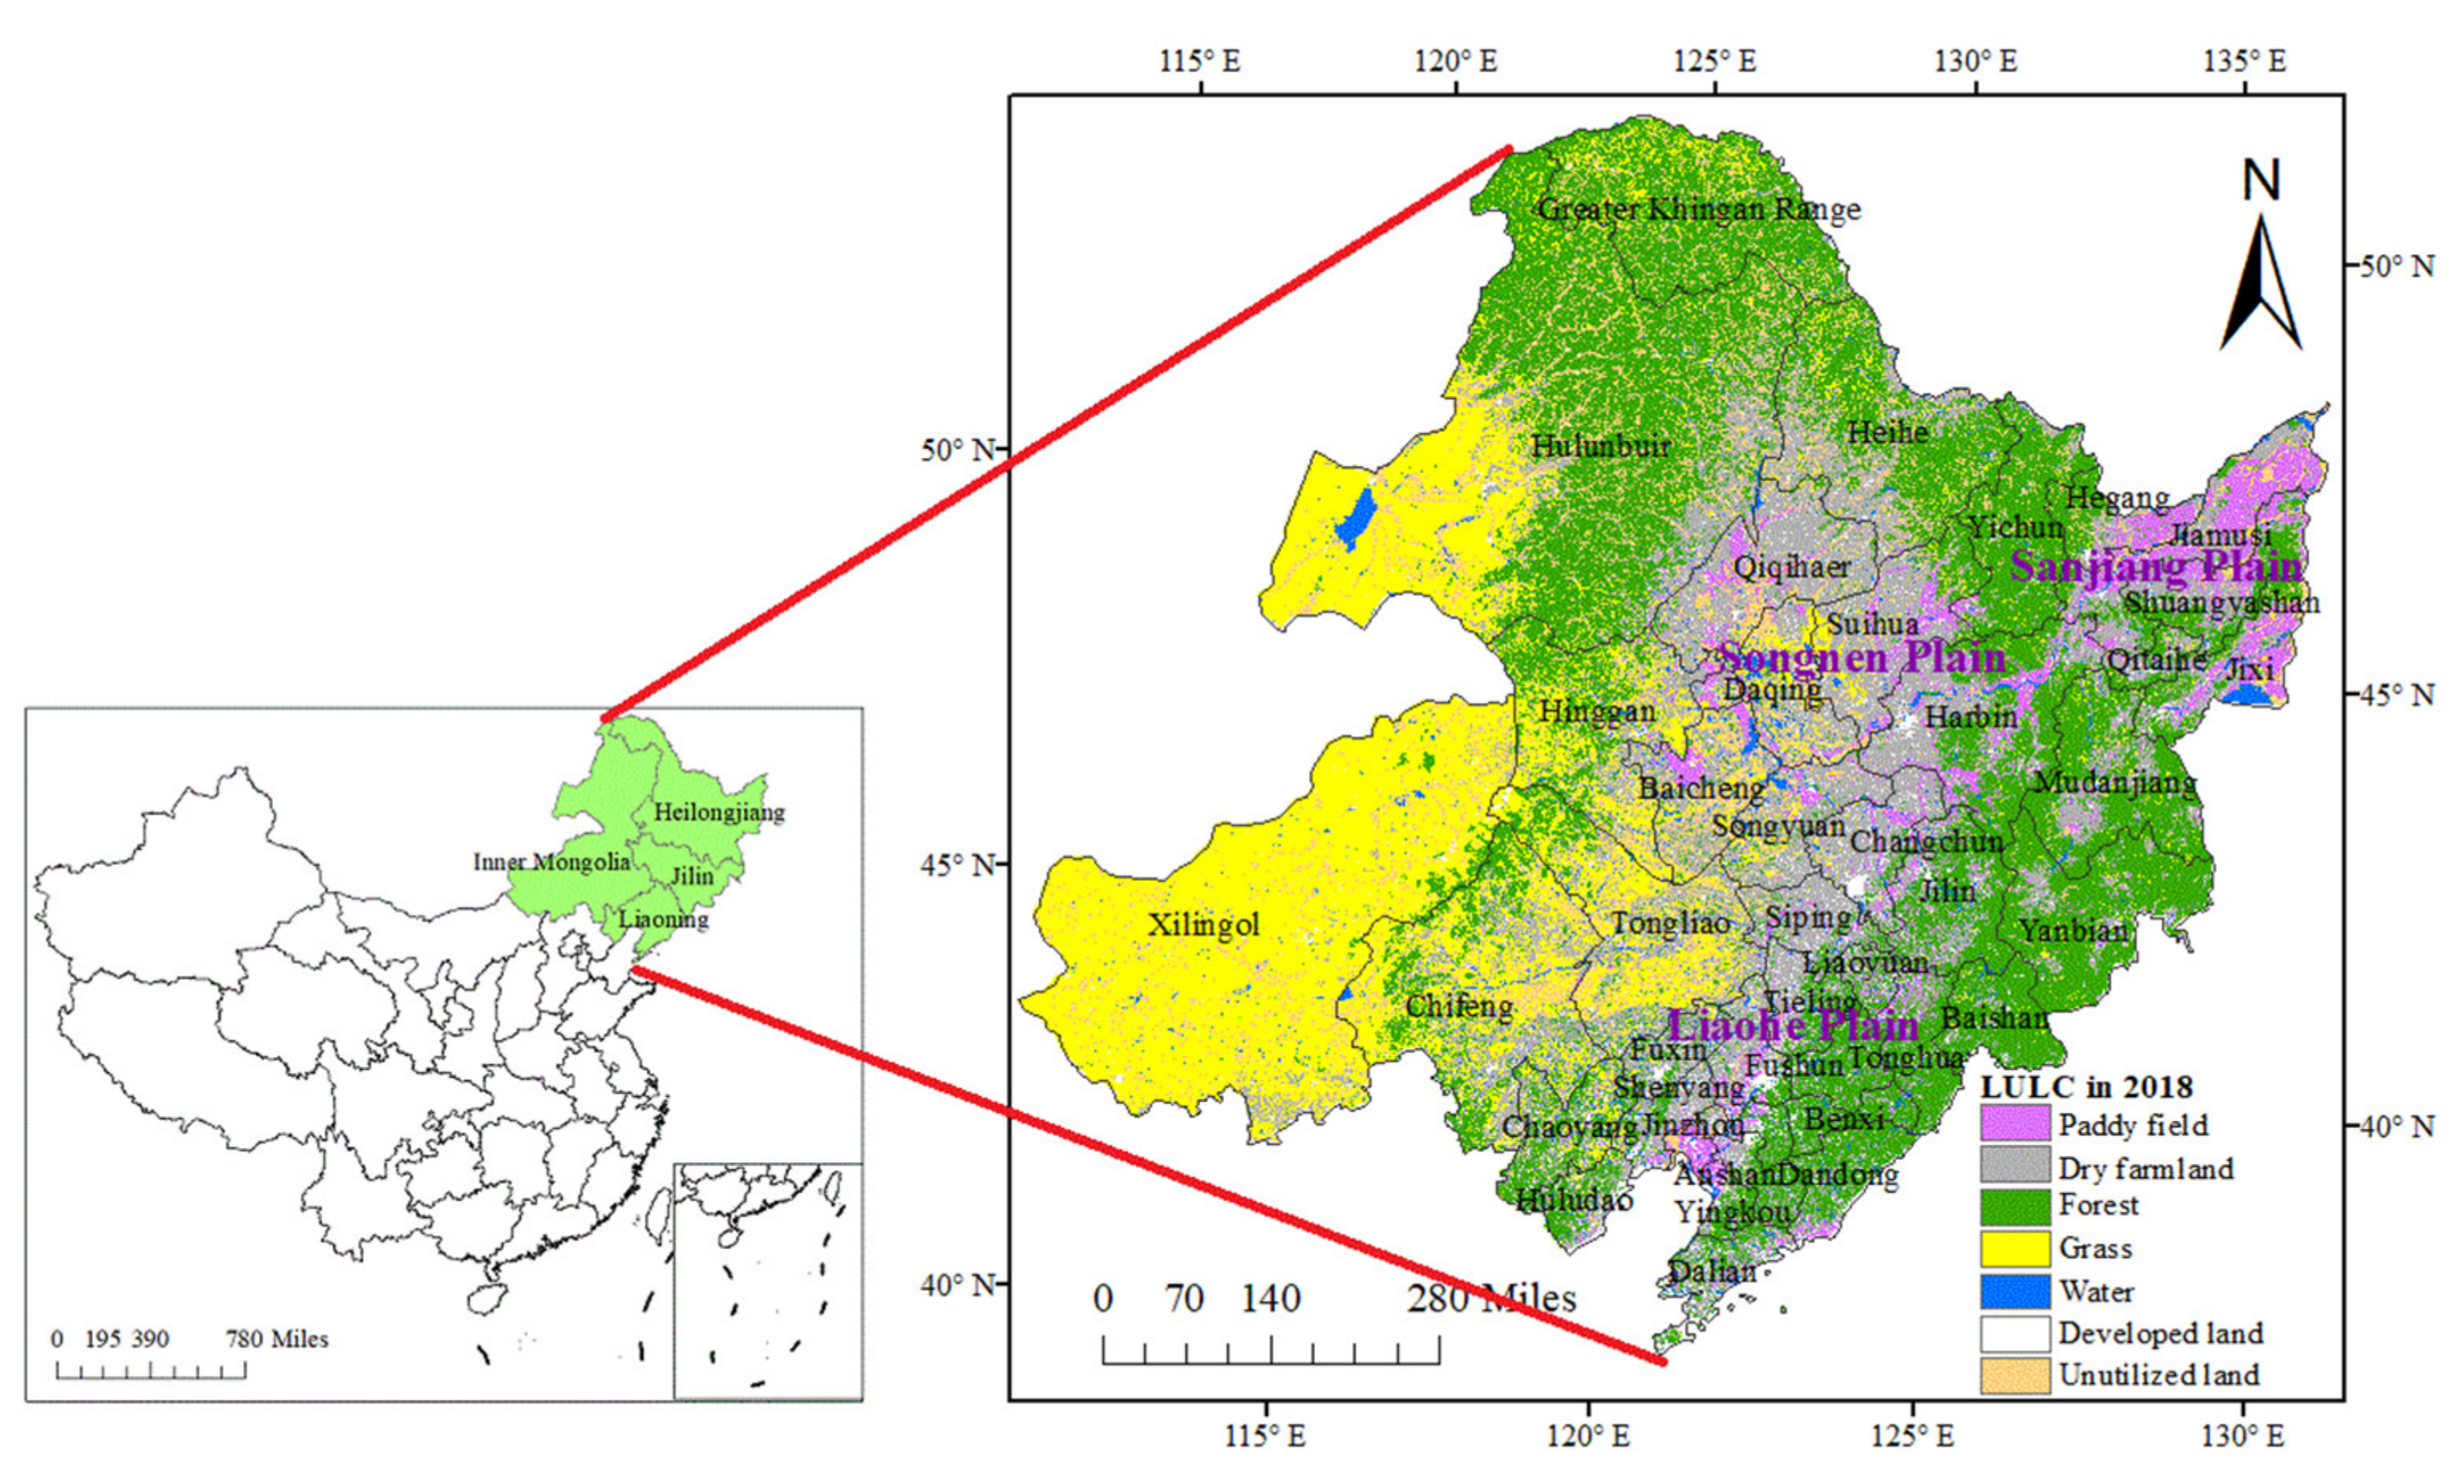
2.1. Study Area

This study was conducted in northeastern China (38.16° N–53.26° N and 111.00° E–136.07° E) (Figure 1), which includes Heilongjiang Province, Jilin Province, Liaoning Province and Inner Mongolia Autonomous Region. Northeast China Economic Zone includes 36 municipalities belonging to Heilongjiang Province, Jilin Province, and Liaoning Province, and the remaining five municipalities (Xilingol, Chifeng, Tongliao and Hulunbuir, Hinggan League) belong to the Inner Mongolia Autonomous Region. There are 337 counties in Northeastern China, the number in Heilongjiang Province, Jilin Province and Liaoning Province is 281, the remaining 56 belong to Inner Mongolia Autonomous Region. The area of the northeast China is 1.47 million km2, with rich natural resources. The study area has a typical temperate continental monsoon climate, with annual average rainfall of 600 mm. The lowest temperature in the study area ranged from −21.50 °C to −16.00 °C, while the highest temperature area ranged from −11.00 °C to −3.50 °C in January. The lowest temperature in the study area was 19.50 °C~21.00 °C, while the highest temperature was 28.00 °C~30.50 °C in July. The study area, with an estimated 117 million people, is China’s energy, steel, timber and grain production base, including The Liaoning coastal Economic Belt, The Shenyang Economic Zone, the Changjitu economic Zone and Hadaqi Industrial Corridor.

2.2. Data Sources

Spatial data and statistical data were used in this study to analyze the relationship between regional ecosystem service supply and consumption under the dual factor of economic development and ecological restoration. The Shuttle Radar Topography Mission (SRTM) digital elevation model (DEM) with spatial resolution of 1 km and Normalized Difference Vegetation Index (NDVI) was obtained from the Geospatial Data Cloud site, Computer Network Information Center, Chinese Academy of Sciences (http://www.gscloud.cn). The radiation, precipitation, and other meteorological data were obtained from the Chinese meteorological data network (http://data.cma.cn/). The spatial meteorological data were interpolated using the kriging method. The soil data were obtained from harmonized world soil database constructed by the Food and Agriculture Organization of the United Nations and the Vienna International Institute for Applied Systems (http://webarchive.iiasa.ac.at/Research/LUC/External-World-soil-database). The population, GDP and Land use data at a spatial resolution of 1 km were provided by the Data Center for Resources and Environmental Sciences, Chinese Academy of Sciences (RESDC) (http://www.resdc.cn). The statistical data, such as food in output and food consumption per capita, obtained from China Statistical Yearbook and China Household Survey Yearbook. Water consumption in industry, agriculture and daily life is derived from China Water Resources Bulletin and China Statistical Yearbook. Air monitoring data obtained Bulletin on the Ecological Environment Ecological Environment Status Bulletin of Inner Mongolia Autonomous Region, Heilongjiang Province, Jilin Province and Liaoning Province. Air monitoring data were obtained from the PM2.5 Historical data Center (https://www.aqistudy.cn) and the Ecological environment status bulletin of Inner Mongolia Autonomous Region, Heilongjiang Province, Jilin Province and Liaoning Province. The spatial air monitoring data were interpolated using the inverse distance weighted method. A small amount of missing data was replaced by data for neighboring years.

2.3. Quantify the Supply and Consumption of Ecosystem Services

2.3.1. Food Supply (FS) and Food Consumption (FC)

Food production is an important part of regional economic and industrial development policies. What’s more, food supply is crucial for food security and regional sustainable development [17]. A large number of studies have shown that there is a significant linear relationship between food yield, such as crops and livestock, and NDVI. According to the land use data, the total rice output is allocated according to the ratio of the grid NDVI value to the total NDVI value of the paddy field. The total output of foods such as corn, wheat, oilseeds, grains and vegetables are distributed according to the ratio of the grid NDVI value to the total NDVI value of dry farmland. The total production of meat and milk is allocated according to the ratio of the grid NDVI value to the total NDVI value of grassland. The total production of aquatic products is allocated according to the ratio of the grid NDVI value to the total NDVI value of the water area. The food supply capacity of each grid is then quantified. At the same time, the total food supply of northeast China is calculated by summation (Table 1). Main food consumption per capita includes the type and weight of food (Table 2). The equation for Food supply and food consumption is as follows:
FS i = G sum × NDVI i NDVI sum
where FSi is the supply of food in the i pixel, including rice, grains other than rice, meat, milk, and aquatic products, with a spatial resolution of 1 km. Gsum is the total output of food (rice, grains other than rice, meat, milk, and aquatic products). NDVIi is the normalized vegetation index of i pixel. NDVIsum is the sum of NDVI values of cultivated land, grassland or water area respectively.
FC i = FC pc × L pop
where FCi is the consumption of food in the i grid, with a spatial resolution of 1 km. FCpc is food consumption per capita. Lpop stands for population density.

2.3.2. Water Supply (WS) and Water Consumption (WC)

Water production refers to the ability of ecosystems to intercept or store water resources from rainfall and to reduce surface runoff. In Northeast China, industry and agriculture consume a lot of water resources. Therefore, evaluating the supply and consumption of water production is critical to the rational use and protection of water resources. The InVEST model was adopted to quantify the supply of water production services. The equation for water supply and water consumption is as follows:
WS = 1 Aet i P i × R i
Aet i R i = 1 + Pet i R i 1 + Pet i R i w 1 / w
Pet i = Kc i × Eto i
W i = Awc i × Z R i + 1.25
where WS represents the annual water supply (mm), Aeti is the actual annual evapotranspiration of the grid unit (mm), Peti is the potential evapotranspiration of the grid unit, Kci is the crop evapotranspiration coefficient, Etoi is the reference evapotranspiration of vegetation, Ri represents annual precipitation, Awci is the available water content of plants, W is the empirical parameter, Z is the Zhang coefficient:
WC = WC pf + WC df + WC il
WC pf = D sp × NDVI pi NDVI psum
WC df = D sd × NDVI di NDVI dsum
WC il = D sr × P i P sum
D sd = D a × A d A d + 6.135 A P
D sp = D a D sd
where WC refers to the water consumption in northeast China, WCpf is the water consumption in the paddy field, WCdf is the water consumption in the dry farmland, WCil is the water consumption in industry and life, Dsp is the total water consumption in the paddy field, Dsd is the total water consumption in the dry farmland, and Dsr is the total water consumption of industry and life, NDVIpi is the normalized leaf area index of the i-th grid in the paddy field, NDVIdi is the normalized leaf area index of the i-th grid in the dry farmland, and NDVIpsum is the sum of the normalized leaf area index of the paddy field, NDVIdsum is the sum of the normalized leaf area index of dry farmland, Pi is the population of the i-th grid, and Psum is the total population in Northeast China. Da is the total water consumption of cultivated land. According to research on agricultural water consumption [18], the average water consumption per unit area of paddy fields is 6.135 times that of dry land in Northeast China.

2.3.3. Atmospheric Regulation Supply (AS) and Atmospheric Regulation Consumption (AC)

Atmospheric regulation means that the ecosystem maintains the balance of atmospheric chemical components, such as absorbing SO2, absorbing nitrogen oxides, dust, etc. Atmospheric regulation has been considered to be an important ecological problem in northeast China. The amount of atmospheric regulation for each pixel on the landscape was obtained by the equation described as follows:
AS i = A SO 2 , i + A Nx , i + A pm 10 , i
where ASi represents the annual amount of atmospheric regulation in the i-th land use type, ASO2 is the annual absorption of SO2, ANx is the annual absorption of nitrogen compounds, and Apm10 is the annual absorption of inhalable particulate matter. With reference to a large number of documents on monitoring data [19,20], the absorption amount per unit area of each land use type SO2, nitride, pm10 was calculated by the average method (Table 3):
AC = ( C SO 2 + C Nx + C pm 10 ) × Ph × ND × β
where AC represents the annual consumption of atmospheric regulation services per square kilometer (kg∙km−2∙a−1), CSO2 is the annual average SO2 concentration (μg/m3), CNx is the annual average nitrogen oxide concentration (μg/m3), Cpm10 is the annual average inhalable particulate matter concentration (µg/m3). According to the relevant research on the transit height of dust and haze in Northeast China [21,22], the pollutant suspension height (Ph) is set to 500. The number of days to consume atmospheric regulation services per year is set to 365. The unit conversion factor (β) is 0.001.

2.4. Equilibrium Relationship between Ecosystem Service Supply and Consumption

2.4.1. Quantity Equilibrium between Ecosystem Service Supply and Consumption

The supply and consumption ratio of ecosystem services (SCRE) was adopted to analyze the relationship between ecosystem service supply and consumption and to reveal the equilibrium level of ecosystem service supply and consumption. SCRE for each pixel was computed as follows [23]:
SCRE = S C S max + C max / 2
where SCRE represents equilibrium relationship between ecosystem service supply and consumption, S is the supply of ecosystem services, C is consumption of ecosystem services, Smax is the maximum supply of ESs within the space of the assessment area, Cmax is the maximum consumption of ESs within the space of the assessment area. SCRE > 0 indicates that the supply of ecosystem services is higher than consumption, SCRE = 0 indicates that the supply of ecosystem services is balanced with consumption, and SCRE < 0 indicates that the supply of ecosystem services is lower than consumption.

2.4.2. Spatial Equilibrium between Ecosystem Services Supply and Consumption

Local Indicators of Spatial Association (LISA) was adopted to reflect the clustering and matching relationship between ecosystem service supply and consumption, and to reveal the spatial equilibrium relationship between ecosystem service supply and consumption. The GEODA software is used to calculate LISA with the following equation:
LISA i = 1 n ( y i y ¯ ) i ( y i y ¯ ) 2 j w ij ( y i y ¯ )
where wij represents the spatial weight matrix between unit i and unit j, yi is the attribute value of unit i, y ¯ is the average of all attribute values, n is the total number of cells in the region. LISA> 0 indicates that the service balance of the space unit is a high-high value or low-low value spatial aggregation. LISA < 0 indicates that the service balance of the space unit is a high-low value or low-high value spatial aggregation.

2.5. Impact of Economic Development on the Equilibrium Relationship between Ecosystem Service Supply and Consumption

The impact of economic development on the equilibrium relationship between ecosystem service supply and consumption is complex, and linearity, “inverted U” shape, “S” shape and other nonlinear relationship may occur. We applied curve estimation to identify the relationship between economic development and the equilibrium relationship. Curve estimation in SPSS 19.0 for Windows (IBM, Armonk, New York, USA), was used to analyze the relationship between GDP and SCRE. The correlation between GDP and equilibrium coefficient (SCRE) of ecosystem service supply and consumption was calculated using SPSS 19.0 software from 1995 to 2018. The basic unit for curve estimation was the county. Due to the different size and unit for the indicators of SCRE and GDP, GDP were centralized before conducting curve estimation.

3. Results

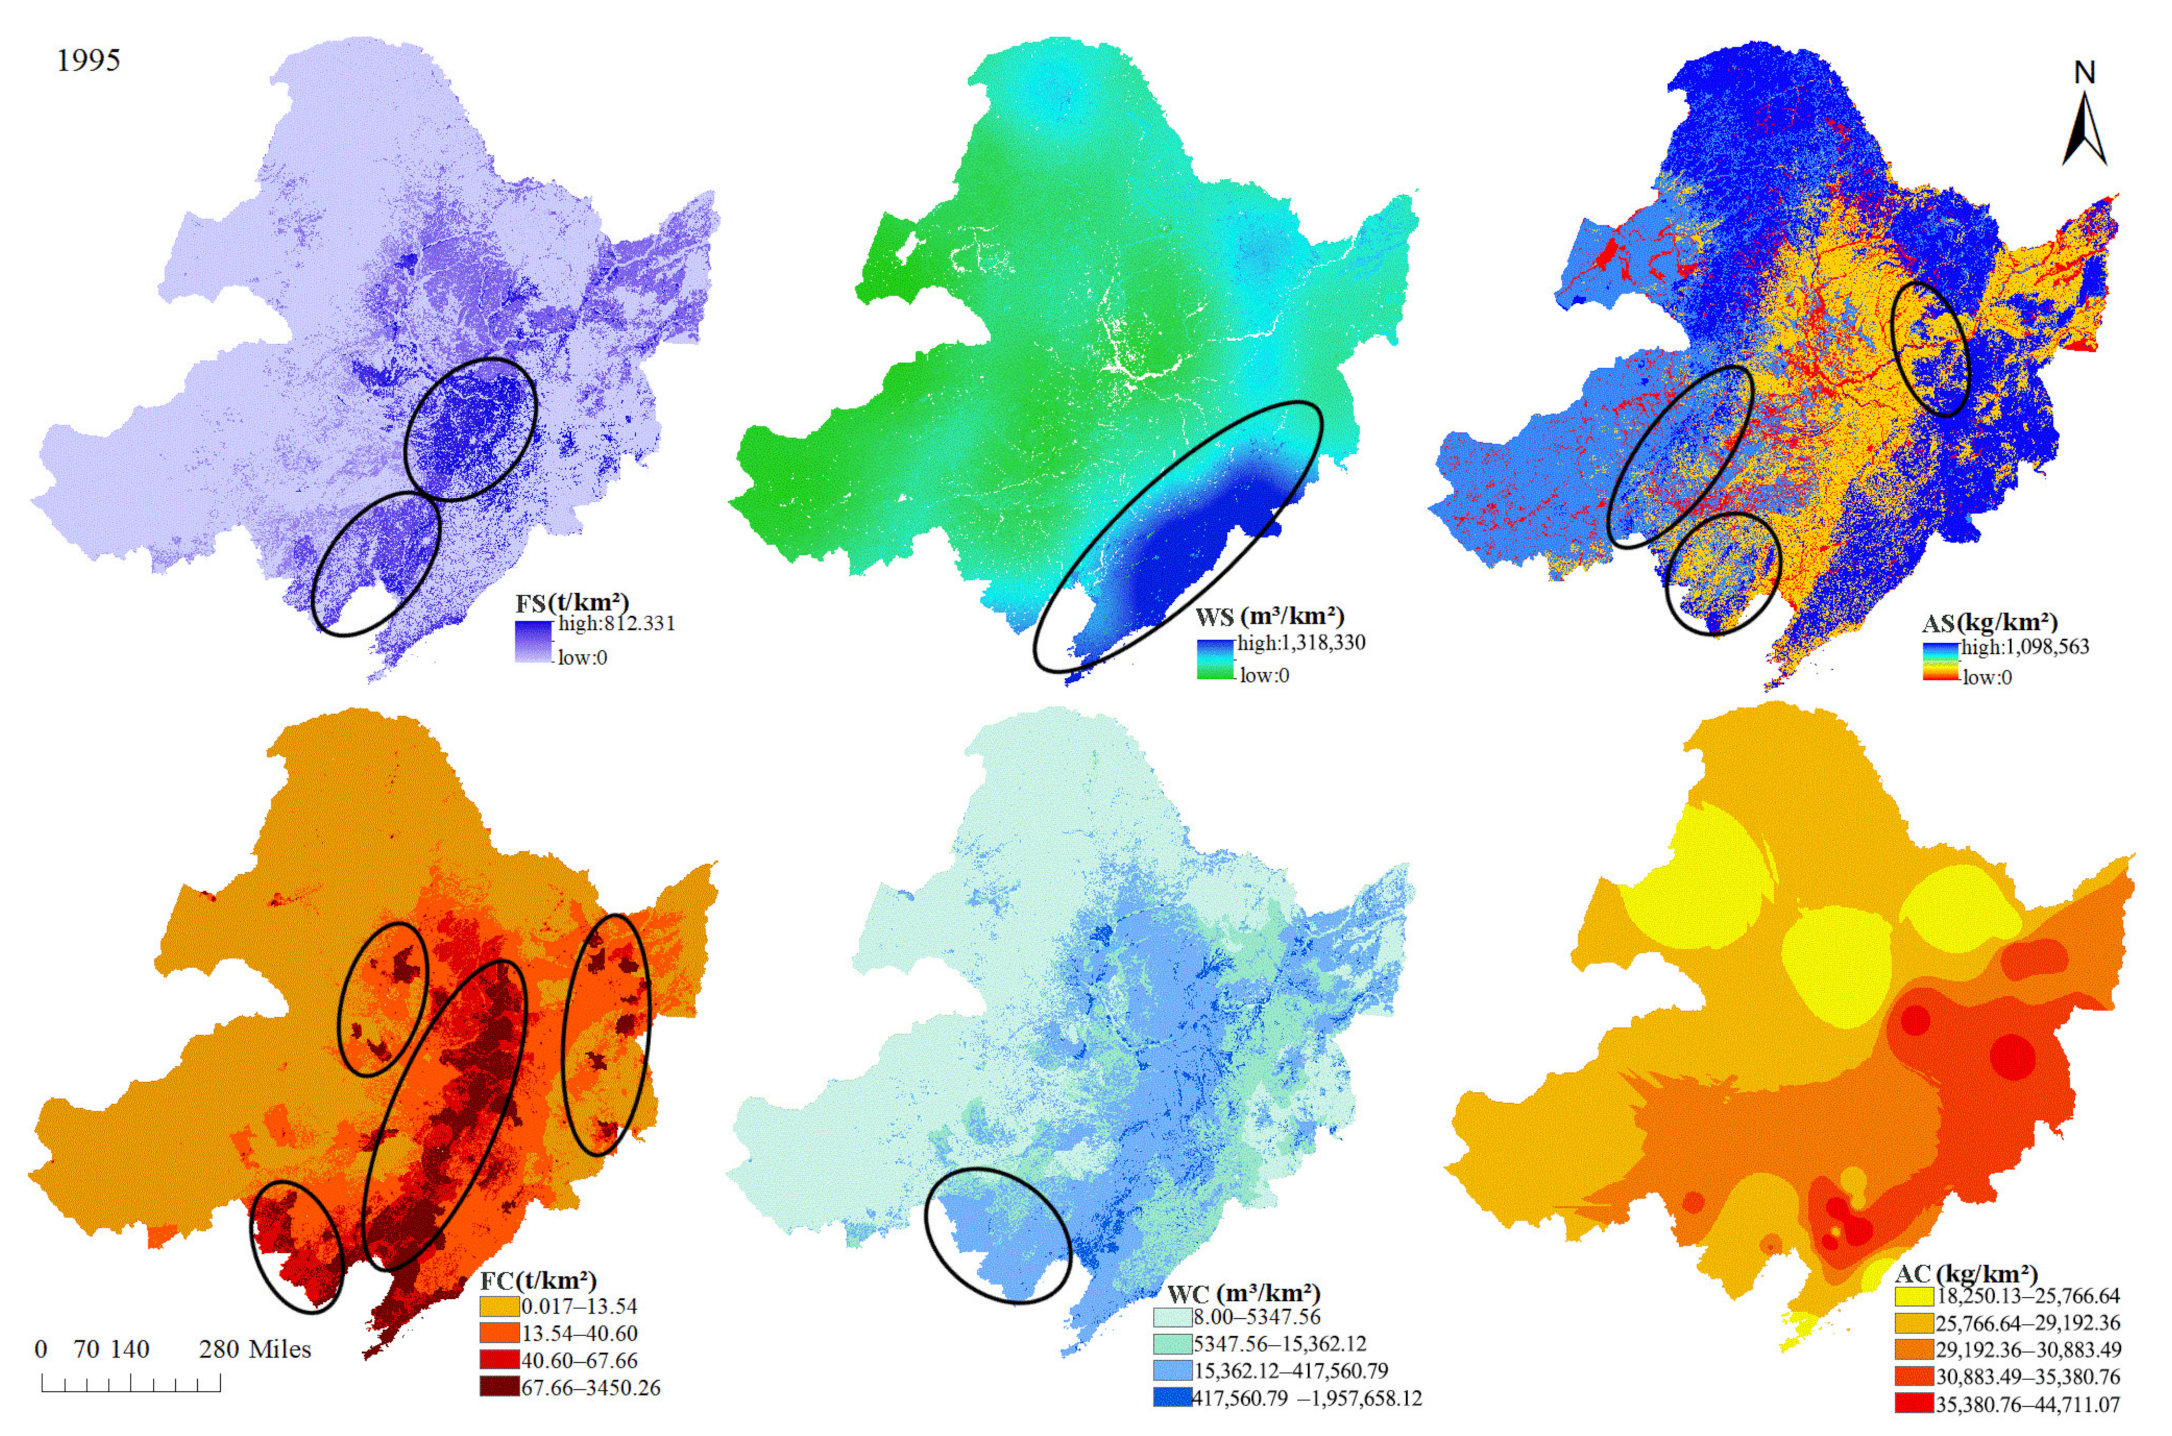
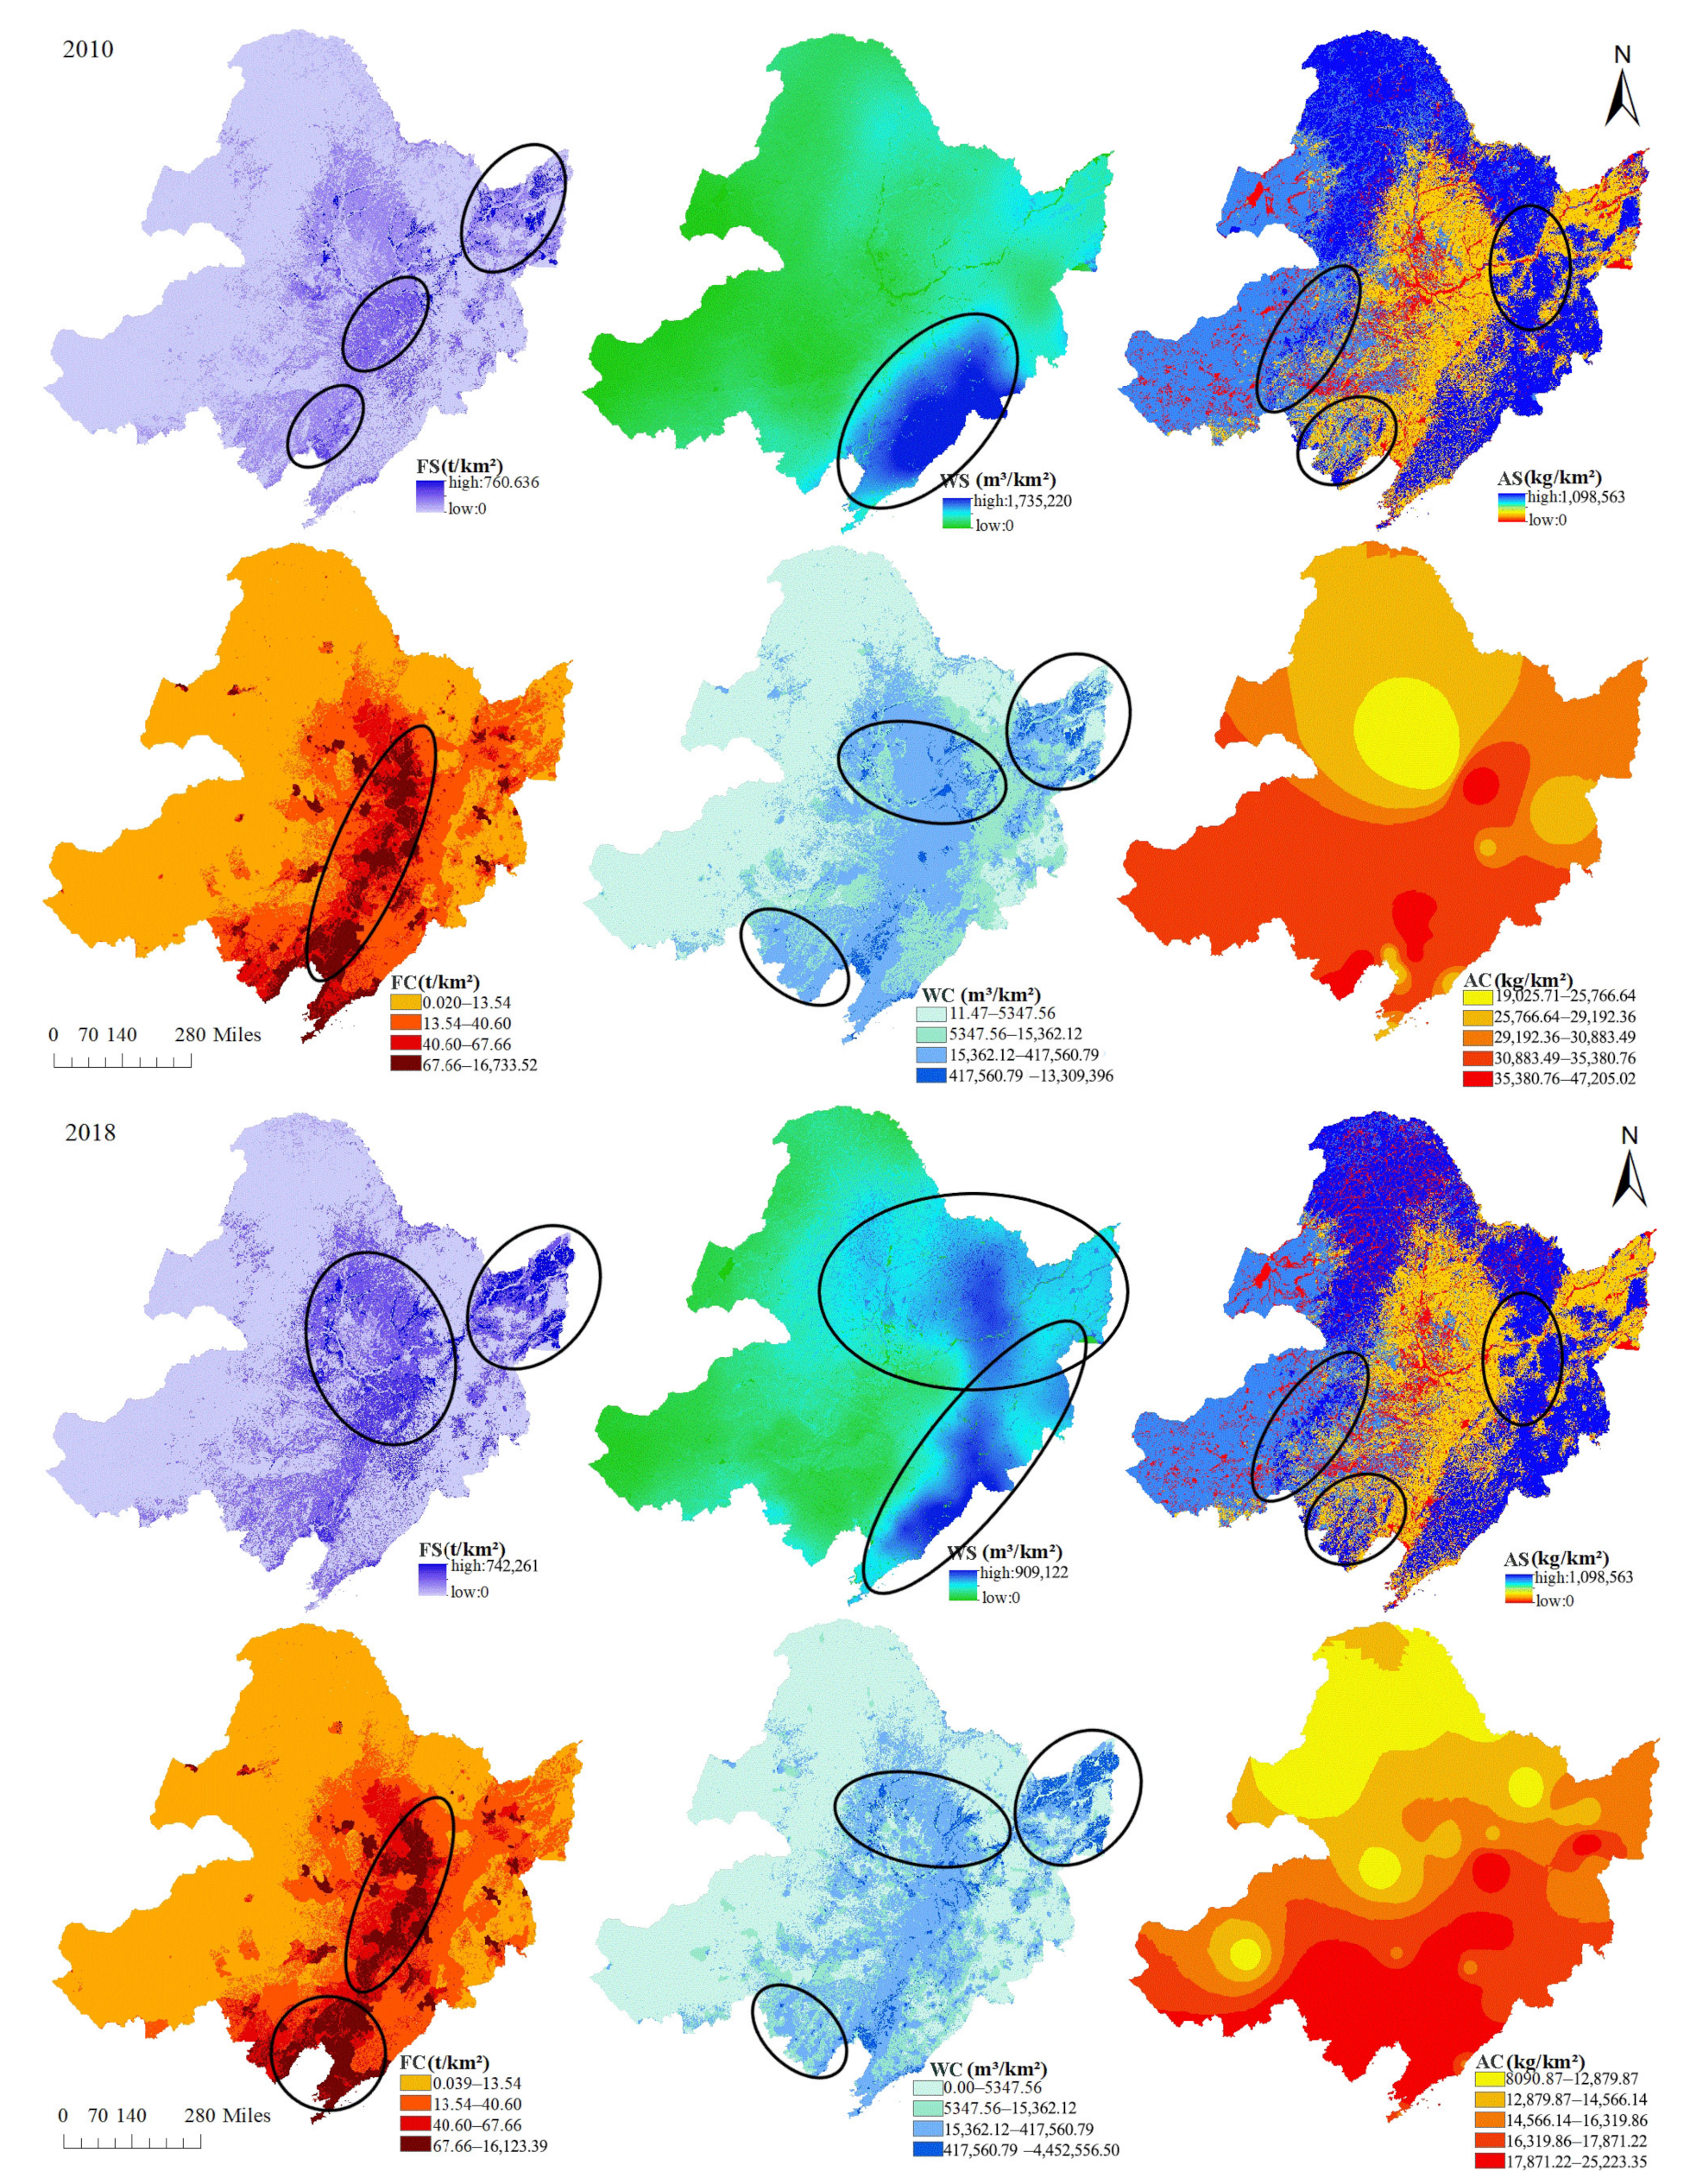
3.1. Spatial Pattern Evolution of Ecosystem Service Supply Driven by Ecological Restoration and Economic Development

3.1.1. The Spatial Evolution of Food Supply

The spatial distribution of ecosystem service supply from 1995 to 2018 is shown in Figure 2 and Figure 3. The map indicates a very high spatial variation of ecosystem service supply across the study area from 1995 to 2018. In 1995, the high food supply areas were mainly distributed in Jilin and Liaohe Plain, while the food supply capacity per unit area was slightly weaker in Heilongjiang and Inner Mongolia. According to Table 4, the food supply of Liaoning and Jilin was 14.60 and 20.47 million tons, which was 50.17% of the total food supply of Northeast China. The food supply was just 8.19 million tons in Inner Mongolia. The food supply of Heilongjiang was 26.65 million tons, which was just 38.12% of the total food supply of Northeast China. However, the main food supply areas were gradually shifting to Heilongjiang Province and Sanjiang Plain By 2010 in northeast china. The food supply of Heilongjiang was 54.53 million tons, which was 43.85% of the total food supply of Northeast China. The food supply of Liaoning was 19.41 million tons, which was just 15.61% of the total food supply of Northeast China in 2010. The high food supply areas were concentrated in the Songnen Plain and the Sanjiang Plain with the implementation of the grain production policy in 2018, while the food supply status of the Liaohe Plain was gradually declining. The food supply of Heilongjiang was 78.72 million tons, which was 46.43% of the total food supply of Northeast China in 2018. The food supply of Liaoning and Jilin was 14.60 and 20.47 million tons, which was just 36.32% of the total food supply of Northeast China.

3.1.2. Spatial Evolution of Water Supply

The results obtained from Figure 2 and Figure 3 indicated that the spatial distribution of water supply also changed greatly from 1995 to 2018. The high water supply areas were mainly concentrated in the east of Jilin Province and the southeast of Liaoning Province in 1995 and 2010. However, not only the high water supply areas were distributed in the east of Jilin Province and the southeast of Liaoning Province, but also the vast majority of Heilongjiang Province became high water supply areas with the implementation of the ecological restoration in 2018. This shows a certain trend that the high water supply area extends to the north and west. According to Table 4, the total water supply of Liaoning and Jilin was 73,166.75 and 72,685.98 million cubic meters in 1995, which was 41.32% of the total water supply of Northeast China. The water supply in Heilongjiang increased from 117,786.32 to 168,890.46 million cubic meters, and the water supply in Inner Mongolia increased from 89,382.77 to 118,444.53 million cubic meters, from 1995 to 2018. However, the water supply in Liaoning decreased from 73,166.75 to 41,656.71 million cubic meters, and the water supply in Jilin decreased from 72,685.98 to 68,843.02 million cubic meters, from 1995 to 2018. The total water supply of Heilongjiang and Inner Mongolia accounted for 72.22% of the water supply of Northeast China in 2018. This again showed that the high water supply areas extended north and west from 1995 to 2018.

3.1.3. Spatial Evolution of Atmospheric Regulation Supply

The results obtained from Figure 2 and Figure 3 indicated that the spatial distribution of atmospheric regulation service supply has changed to some extent from 1995 to 2018. In general, the high supply areas of atmospheric regulation services are mainly distributed in the northeast of Inner Mongolia, the northeast and west of Heilongjiang province, the east of Jilin Province, and the east of Liaoning Province. However, the supply of atmospheric regulation service in Chifeng, Xingan, Chaoyang, Huludao, and Harbin showed a significant increase from 1995 to 2018. The atmospheric regulation supply in Inner Mongolia increased from 183,759.67 to 193,053.53 million kilograms, and the atmospheric regulation supply in Liaoning increased from 63,107.64 to 69,949.39 million kilograms, from 1995 to 2018. This showed that the supply capacity of atmospheric regulation services was improving in these areas from 1995 to 2018, with the implementation of the ecological restoration such as 3-North Shelter Forest Program, Grass protection and NFCP.

3.2. Spatial Pattern Evolution of Ecosystem Service Consumption Driven by Ecological Restoration and Economic Development

3.2.1. Spatial Evolution of Food Consumption

The spatial distribution of the food consumption shown in Figure 2 and Figure 3 shows a different pattern: the spatial concentration trend of food consumption. The spatial distribution of food consumption moved from the surrounding areas to three major urban agglomerations of Harbin, Changchun and Liaoning from 1995 to 2010. With accelerating population concentration in the city, economic development has promoted the process of concentration of food consumption in major cities from 1995 to 2010. The spatial distribution of food consumption moved from the surrounding areas to three major urban agglomerations of Harbin, Changchun and Shenyang from 2010 to 2018. Benefiting from the excellent development of coastal cities, the centralized pattern of food consumption from 2010 to 2018 has shown a trend of gradual strengthening to coastal city clusters such as Shenyang and Dalian.

3.2.2. Spatial Evolution of Water Consumption

The spatial distribution of the water consumption changed remarkably from 1995 to 2018. The water consumption in Huludao, Chaoyang, Chifeng, Jinzhou and Fuxin showed a decreasing trend, while the water consumption shows an increasing and expanding trend in Sanjiang Plain and Songnen Plain of Heilongjiang Province (Table 4, Figure 2 and Figure 3). According to Table 4, Heilongjiang’s share of water consumption in northeast china increased from 40.68% (24,448.46 million cubic meters) to 47.63% (34,356.03 million cubic meters). According to the China Statistical Yearbook, the share of agricultural water in the total water consumption increased from 69.72% to 88.63% in Heilongjiang from 2004 to 2018. However, the share of agricultural water in the total water consumption decreased from 87.55% to 73.03% in Inner Mongolia from 2004 to 2018. The share of agricultural water in the total water consumption decreased from 65.11% to 61.78% in Liaoning from 2004 to 2018. These evolutions show that Heilongjiang Province, as the most important commercial grain base, not only increased the area of dry farmland and paddy fields, but also increased the consumption of agricultural water from 1995 to 2018 (Table 4, Figure 2 and Figure 3). At the same time, due to the decline in food production status in southwestern Liaoning, agricultural water consumption has also experienced a major reduction. From 1995 to 2010, the maximum water consumption per square kilometer for domestic and industrial water in Shenyang, Changchun, and Harbin rose from 1.95 to 13.3 million cubic meters. Between 2010 and 2018, the maximum water consumption per square kilometer was reduced from 13,300,000 to 440,000 cubic meters (Figure 3), with the industrial structure shifted from high water-consuming industries to tertiary industry (Table 5).

3.2.3. Spatial Evolution of Atmospheric Regulation Consumption

The distribution of atmospheric regulation service consumption shows obvious variation in spatial structure from 1995 to 2018. The consumption areas for atmospheric regulation service were mainly distributed in the central and southwestern regions of Heilongjiang Province and the Shenyang urban agglomeration in 1995. The demand area for atmospheric regulation services showed a trend of extending to the central, southern and western parts of the study area from 1995 to 2018. According to Table 4, the consumption of atmospheric regulation services increased from 40,929.71 to 44,224.93 million kilograms from 1995 to 2010 in Northeast China. However, the overall demand for atmospheric regulation services declined in 2018. The consumption of atmospheric regulation services decreased from 44,224.93 to 22,538.05 million kilograms from 2010 to 2018 in Northeast China. The maximum demand for atmospheric regulation services in 2018 was only 25,223.35 kg per square kilometer, compared with 47,205.02 kg per square kilometer in 2010. To some extent, this evolution was affected by the transformation of the economic structure from industrial industries to service industries. According to Table 5, the proportion of the secondary industry dropped significantly, while the proportion of the tertiary industry rose rapidly in northeast china.

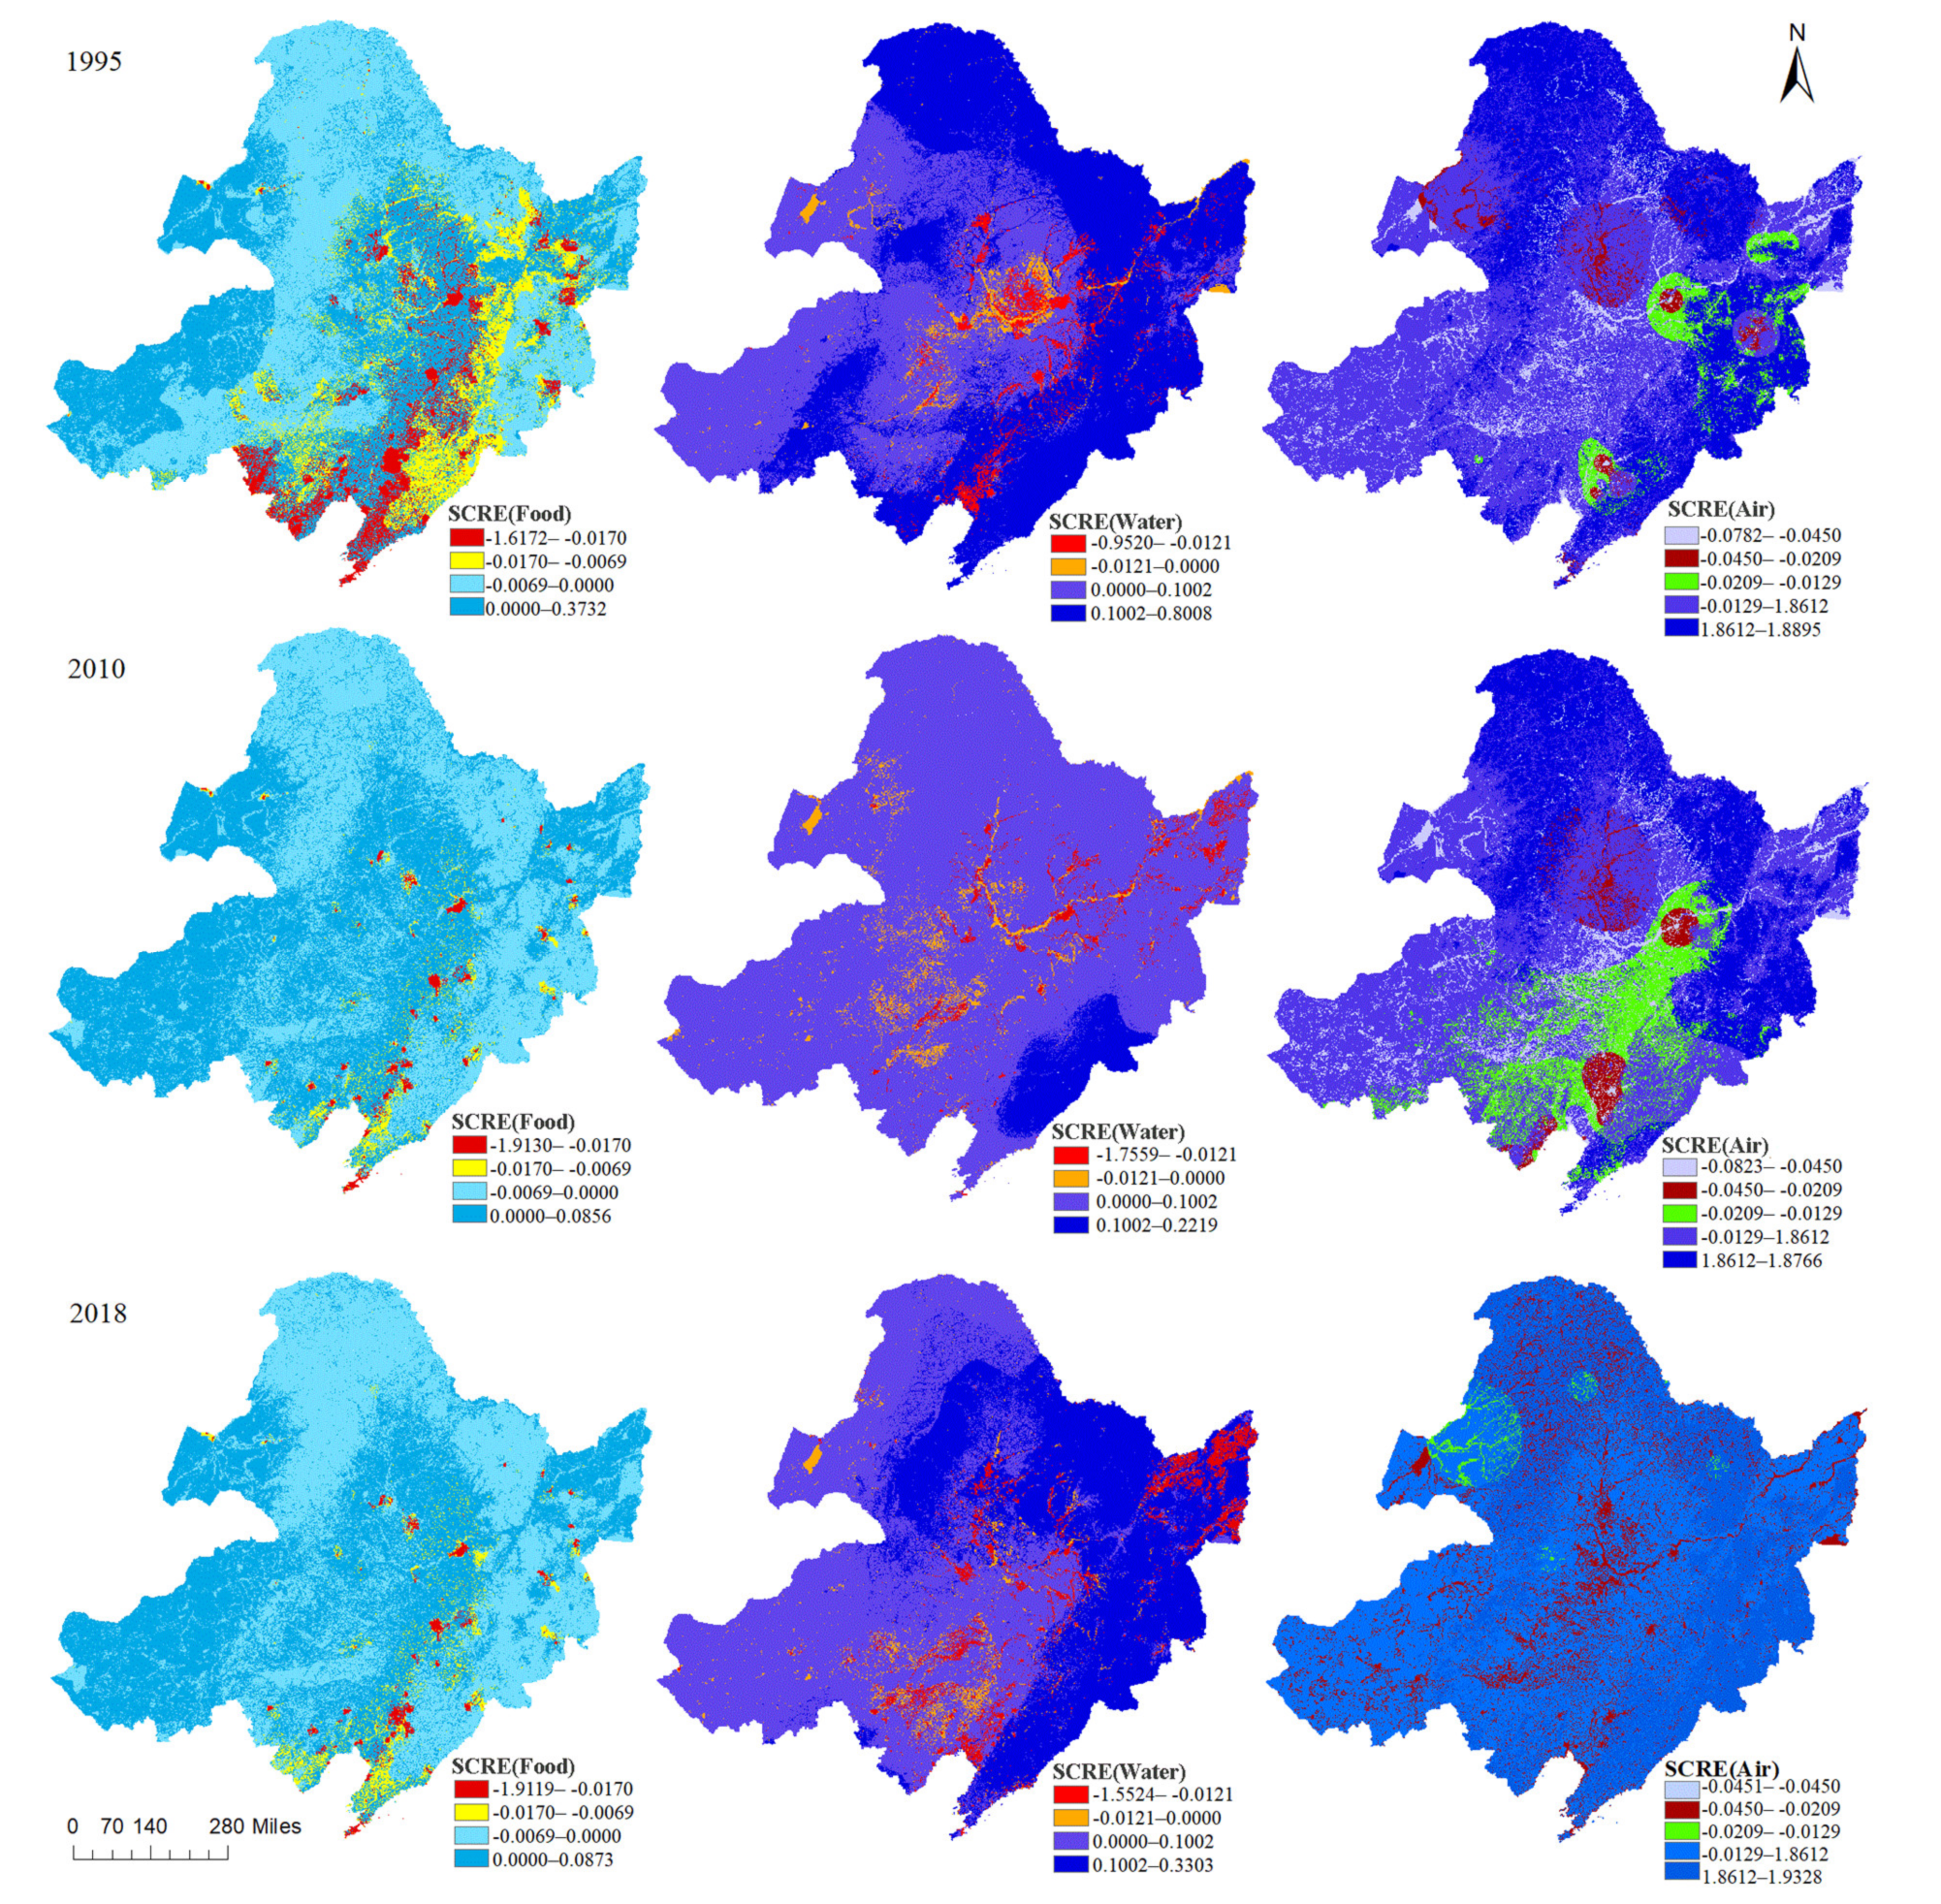
3.3. Spatial Pattern Evolution of Equilibrium Relationship between Ecosystem Service Supply and Consumption Driven by Ecological Restoration and Economic Development

3.3.1. Equilibrium Relationship between Food Supply and Consumption

The results obtained from Figure 4 indicate that the equilibrium relationship between food supply and consumption changed greatly from 1995 to 2018. The large-scale unbalanced areas where food supply was lower than consumption were mainly distributed in the Songnen Plain, the Liaohe Plain and the eastern part of the Inner Mongolia Autonomous Region in 1995. What’s more, the most serious unbalanced areas were mainly concentrated in Harbin, Changchun, Shenyang and other areas. However, with the construction of Commodity Grain Base in northeast china in northeast China, the situation of insufficient food supply was changed in most areas of Songnen plain, Liaohe Plain and eastern Inner Mongolia in 2010. The scope of insufficient food supply was narrowed largely, mainly in Harbin urban agglomeration, Changchun urban agglomeration, Shenyang urban agglomeration, Dalian urban agglomeration, etc. from 1995 to 2010 (Figure 4). However, the minimum value of SCRE has changed from −1.6172 to −1.9130, showing a trend of increasing imbalance in food supply in urban agglomerations from 1995 to 2010. What’s more, the scope of insufficient food supply expanded in southern Liaoning and coastal urban agglomerations from 2010 to 2018.

3.3.2. Equilibrium Relationship between Water Supply and Consumption

The equilibrium relationship between water supply and consumption shows obvious variation in spatial structure from 1995 to 2018 (Figure 4). The unbalanced areas where water supply was lower than consumption were mainly distributed in Harbin, Daqing, Suihua, Shenyang, Liaoyang, Anshan, Panjin, Yingkou in 1995. These distribution shows that the industrial structure of over-reliance on heavy industry exacerbated the imbalance between water supply and consumption. The unbalanced areas where water supply was lower than consumption were mainly distributed in western Liaoning Province, eastern Inner Mongolia Autonomous Region, Shenyang and Harbin. However, the highly unbalanced areas where water supply was higher than consumption (SCRE > 0.1002) remarkably decreased from 1995 to 2010. The unbalanced areas where water supply was lower than consumption expanded to central Liaoning and the Sanjiang Plain from 2010 to 2018. In addition, the highly unbalanced areas where water supply was higher than consumption (SCRE > 0.1002) remarkably increased in Heilongjiang Province, eastern Liaoning Province, eastern Jilin Province, and northeastern Inner Mongolia from 2010 to 2018, with the construction of ecological function zone for water conservation (Greater Khingan Mountains, Lesser Khingan Range and Changbai Mountain).

3.3.3. Equilibrium Relationship between Atmospheric Regulation Supply and Consumption

The unbalanced areas where atmospheric regulation supply was lower than consumption were mainly distributed in Harbin, Jiamusi, Shenyang, Liaoyang and Anshan in 1995. The unbalanced areas where atmospheric regulation supply was lower than consumption extended to the south from 1995 to 2010, mainly in Liaoning Province, Jilin Province, and Harbin. According to Table 5, the proportion of the secondary industry in Jilin, Liaoning, and Inner Mongolia increased from 42.57%, 51.14%, 38.39% to 52.00%, 54.10%, 54.60% respectively from 1995 to 2010. However, the proportion of the secondary industry in Heilongjiang decreased from 52.70% to 50.20%. At the same time, the consumption of atmospheric regulation services in Inner Mongolia, Liaoning and Jilin increased from 18,097.46, 4322.13, 5870.06 to 20,303.49, 4949.42, 6105.15 million kilograms respectively from 1995 to 2010 (Table 4). These results show an expanding trend in the area of insufficient atmospheric regulation, with rapid economic (the secondary industry) development. What’s more, the minimum value of SCRE has changed from −0.0782 to −0.0832, showing a trend of increasing imbalance in atmospheric regulation from 1995 to 2010. According to Table 4 and Table 5, the unbalanced areas where the supply of air conditioning was lower than consumption had been greatly reduced from 2010 to 2018, with the proportion of the secondary industry dropped significantly. In reality, there were still large areas of potential imbalance in Heilong Province, Jilin Province and Liaoning Province in 2018.

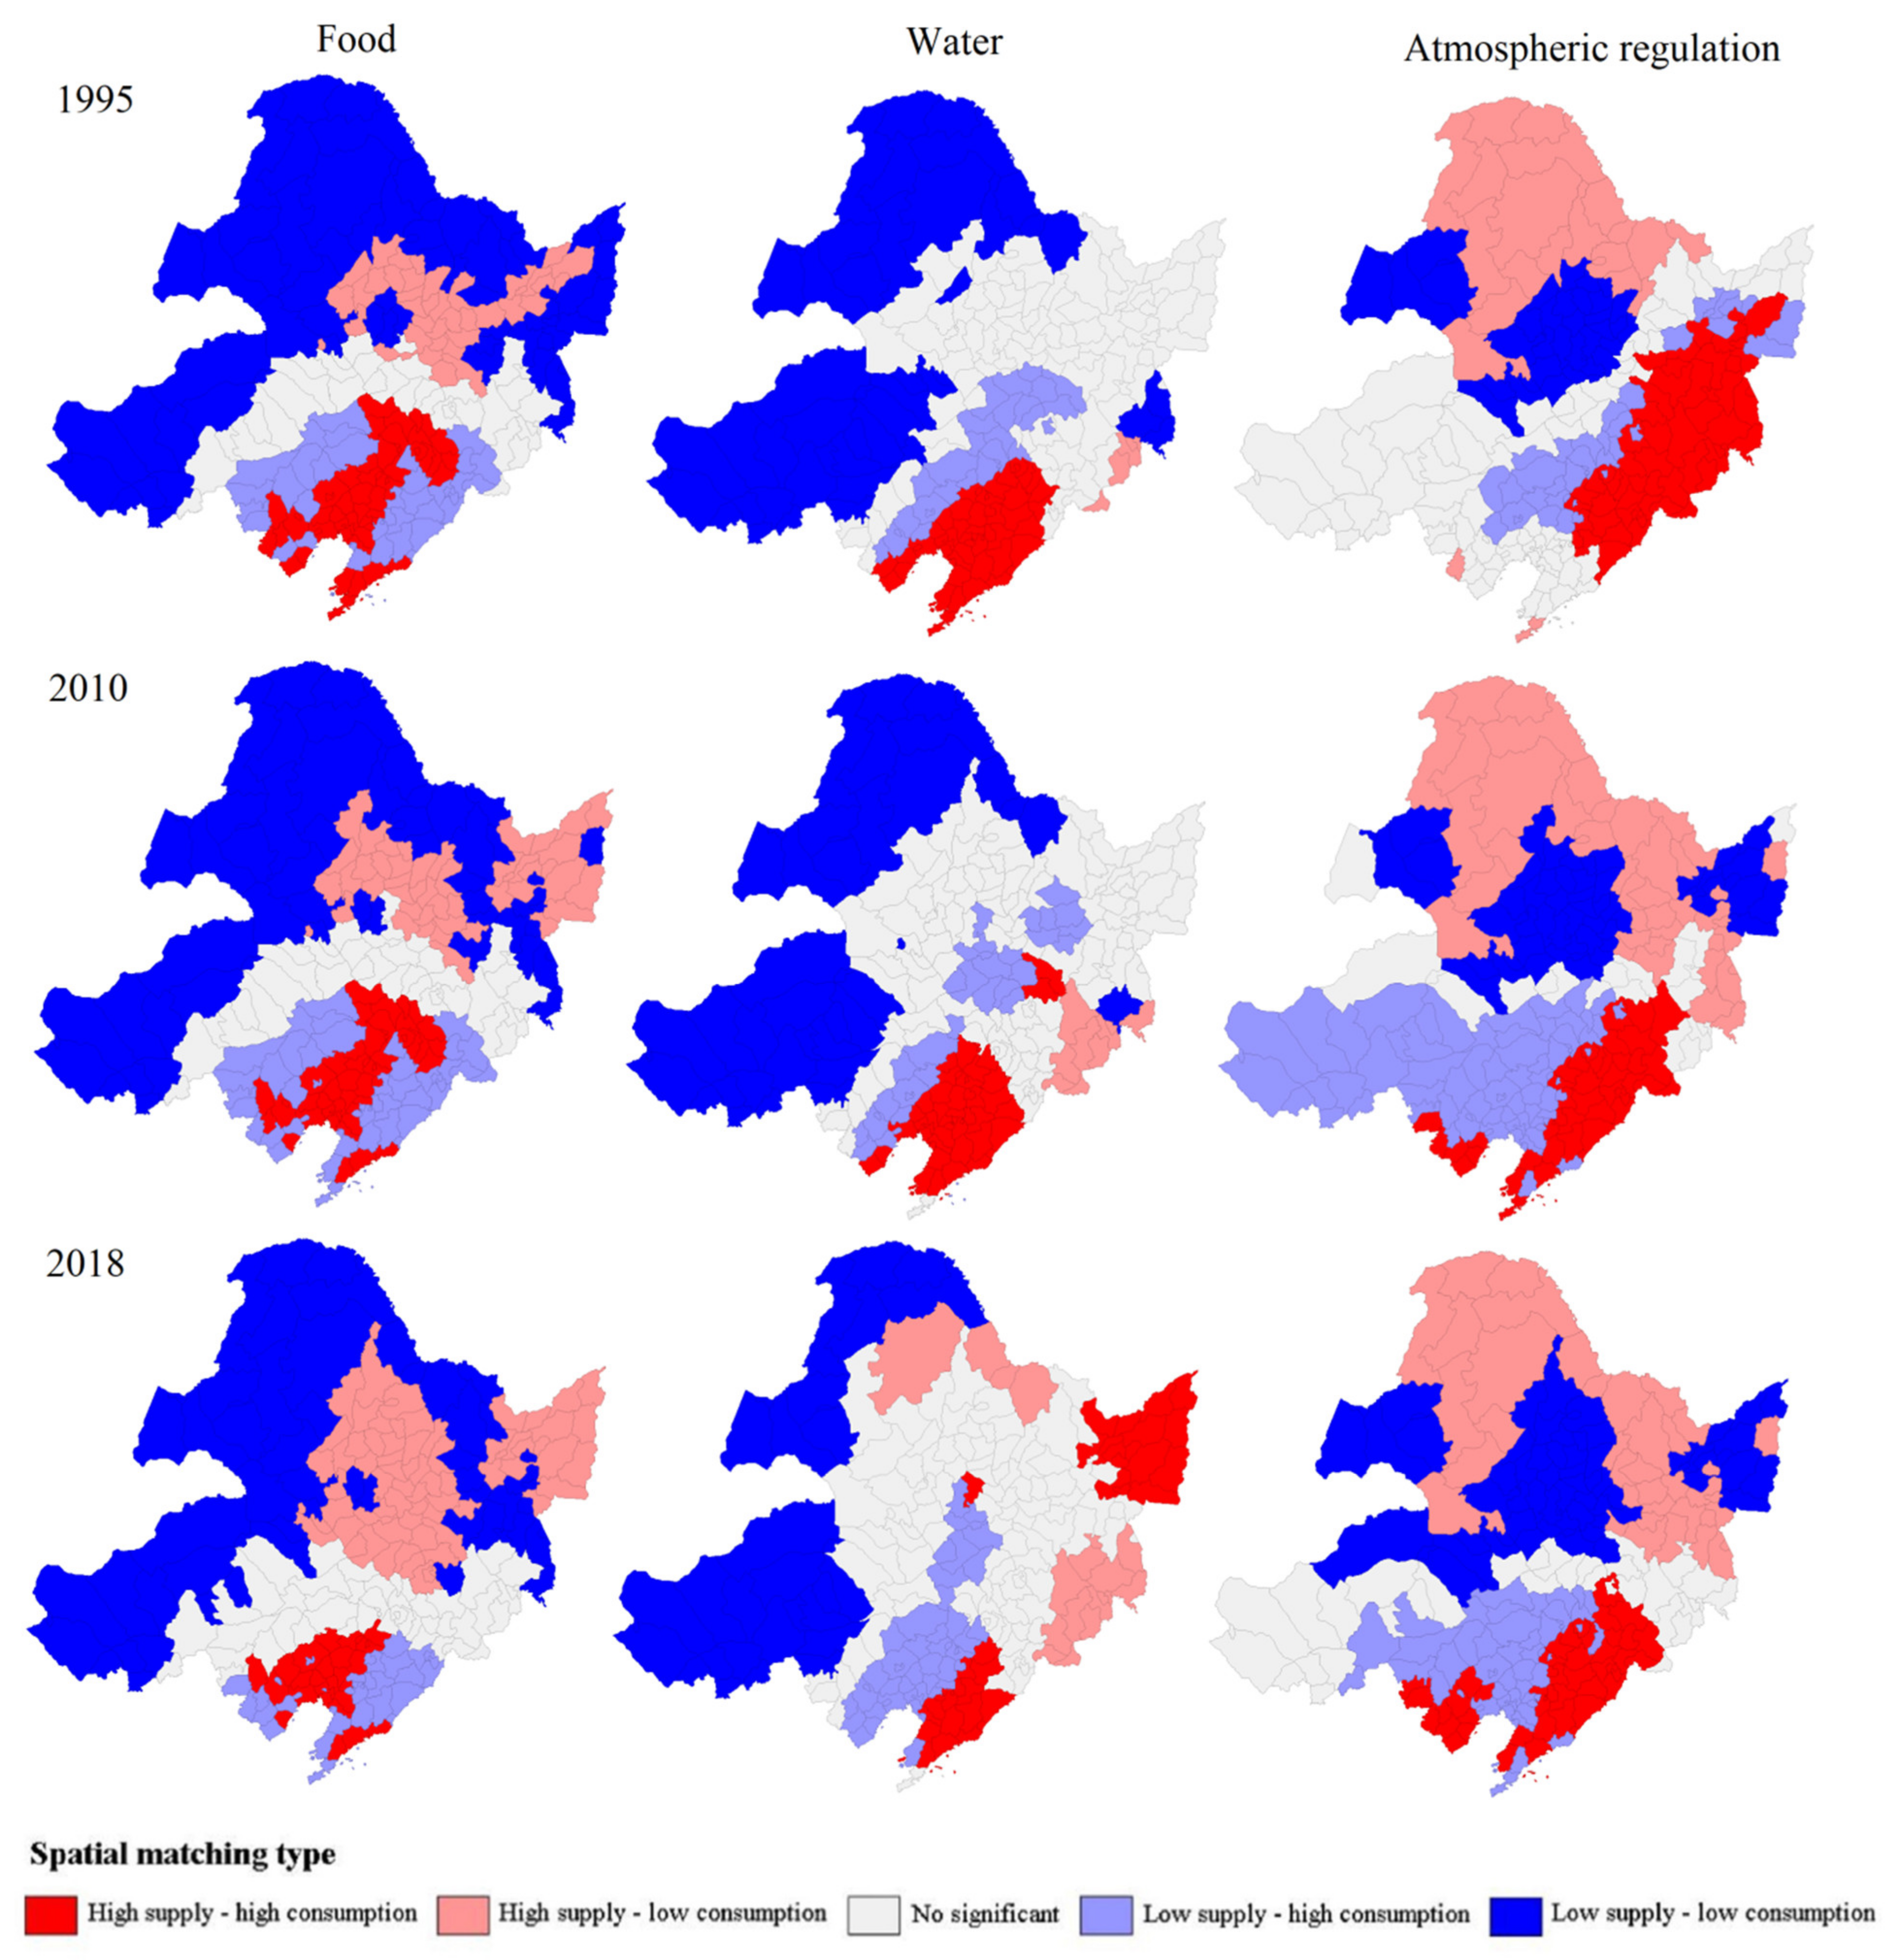
3.4. Spatial Relationship between Ecosystem Services Supply and Consumption Driven by Ecological Restoration and Economic Development

3.4.1. Spatial Relationship between Food Supply and Consumption

The results of LISA obtained from Figure 5 indicates that the dominant matching type of food in Northeast China is low supply and low consumption. The space range of the two space matching types of low supply—high consumption and high supply—high consumption changed little from 1995 to 2010. The spatial range of matching types of high food supply and high consumption changed the most in 2010, which mainly extended in Heilongjiang Province and Sanjiang Plain. What’s more, The spatial range of matching types of high food supply and high consumption extended in Songnen Plain and Sanjiang Plain from 2010 to 2018, with the development of the agricultural industry in Heilongjiang as the most important commodity grain base in China. However, the scope between low supply—high consumption and high supply—high consumption was narrowed from 2010 to 2018. These evolutions show that economic development have not only caused a trend of centralization of food demand, but also weakened the food supply capacity of areas with high urbanization levels. This type of specialization combined with trade between regions is an result of economic development.

3.4.2. Spatial Relationship between Water Supply and Consumption

The LISA results obtained from Figure 5 shows that the matching types of water supply and consumption changed significantly from 1995 to 2018. The areas with low supply and high consumption of water were mainly distributed in the south-central Songnen Plain and Liaohe Plain. The spatial scope of low supply and high consumption of water was gradually concentrated in the southern part of the study area, with a certain degree of expansion in Liaoning from 1995 to 2018. The spatial scope of high supply—high consumption of water gradually decreased from 1995 to 2018, mainly in the southeast of Liaoning Province. However, due to the implementation of the ecological restoration policy by the Chinese government since 1998, the spatial scope of high supply and low demand gradually expanded in Northeast China from 1995 to 2018, mainly in the east of Jilin Province and the northwest of Heilongjiang Province.

3.4.3. Spatial Relationship between Atmospheric Regulation Supply and Consumption

The LISA results obtained from Figure 5 showed that the areas with high supply and high consumption of atmospheric regulation were mainly located in the east of Jilin Province and the east of Heilongjiang Province in 1995. The areas with high supply and high consumption of atmospheric regulation gradually shifted to the south from 1995 to 2018, mainly in eastern Jilin Province, eastern Liaoning Province, Chaoyang, Chifeng, and Fuxin. The evolutions show that both the supply and consumption for atmospheric regulation were increasing in eastern Liaoning Province, Chaoyang, Chifeng, and Fuxin from 1995 to 2018. The areas with low supply and high consumption of atmospheric regulation increased substantially from 1995 to 2010, mainly in Inner Mongolia Autonomous Region, Liaoning Province and Jilin Province. The areas with low supply and high consumption of atmospheric regulation decreased substantially from 2010 to 2018, mainly in Liaoning Province, eastern Inner Mongolia Autonomous Region and southern Jilin Province. The evolutions show that the driving effect of economic development on atmospheric regulation shows an upward trend and then a downward trend. With the implementation of the ecological restoration policy, the areas with high supply and low consumption of atmospheric regulation were extending from 1995 to 2018.

3.5. Impact of Economic Development on the Equilibrium Relationship between Ecosystem Service Supply and Consumption

The results obtained from Table 6 showed that the equilibrium relationship between ecosystem service supply and consumption was negatively correlated with economy developing level. Economic development exacerbated the imbalance between food supply and consumption from 1995 to 2018. The main reason was that economic development intensified the agglomeration around the population, resulting in increased imbalances between food supply and consumption. What’s more, there was a significant negative correlation between the level of economic development and the imbalanced level of water supply and consumption in 1995 and 2018 (Table 6). In addition, economic development exacerbated the imbalance between atmospheric regulation supply and consumption from 1995 to 2018 (Table 6).

4. Discussion

4.1. Ecosystem Service Supply and Consumption Evolution Driven by Economic Development and Ecological Restoration

The sustainability of economic development and the effectiveness of ecological restoration have received widespread attention in recent years [24]. Regional economic development policies not only promoted the development of agriculture, industry, and service industries in Northeast China, but also their structural relationships continued to dynamically evolve from 1995 to 2018. However, the new industrial structure formed a new ecosystem service consumer demand. The development of agricultural industry not only resulted in the increase of water consumption [25], but also the scope of water consumption was expanded in northeast China. The development of tertiary industry causes the change of atmospheric regulation consumption in urban agglomeration. Regional economic development not only promoted the concentration of population in coastal cities, Shenyang urban agglomeration, Harbin urban agglomeration, and Changchun urban agglomeration, but also resulted in the concentration of food consumption, industrial and domestic water consumption in cities. The ecological restoration policies improved the ecological services of water, food, and atmosphere regulation in northeast china in the past 25 years. Such improvement in ecosystem services was consistent with that from the China Ecosystem Assessment at the national scale [26], and from other studies [27]. However, there was a strong spatial difference in the improvement of ecological service supply.

4.2. Significance of Analyzing the Relationship between Ecosystem Service Supply and Consumption

Separating the supply of ecosystem services from consumption to conduct research cannot effectively solve the problem of insatiable ecosystem service consumption [28]. In the past 25 years, economic development strategies such as The strategy of revitalizing the old industrial base in Northeast China and The development of the western region in China were implemented, which greatly promoted the development of the regional economy. The output value of the primary, secondary, and tertiary industries greatly increased. However, the economic development had a profound impact on the relationship between the supply and consumption of ecosystem services, and there were considerable differences in multiple service types [29]. At the same time, in order to solve the ecological crisis, the government successively implemented ecological restoration policies such as The Natural Forest Conservation Program (NFCP), the construction of ecological function area, and the construction of ecological civilization since 1998 [30]. Although this restoration policy increased the value of ecosystem services in northeast china [26], the situation of water supply and air pollution in the region became more severe. The equilibrium relations and spatial matching relations were introduced into this study to examine changes in the relationship between ESs supply and consumption driven by economic development and ecological restoration. First of all, food production increased considerably in northeast China, with the development of the economy in the past 25 years. However, the expansion of urban land use types and the concentration of population caused by economic development exacerbated the imbalance of food supply. In fact, this imbalance is the result of specialization and regional division. Since food products can circulate freely through the market, this imbalance will not fundamentally affect regional food security, but will improve the level of agricultural industrialization and scale. Secondly, the economic development policy exacerbated the imbalance of water supply, while promoting agricultural and industrial development. Not only did the minimum value of the imbalance decrease from −0.9520 to −1.5524, but the range of the imbalance also expanded. The degree of spatial mismatch of water was also shocking, and it did not show a trend that the range of mismatch will shrink. Thirdly, economic development also affected the imbalance of atmospheric regulation in northeast China. The imbalance of atmospheric regulation from 1995 to 2010 became more severe in scope and extent. Although the imbalance of atmospheric regulation was moderating from 2010 to 2018, there were still quite extensive areas where supply and consumption didn’t match.
The results show that the implementation of the ecological restoration didn’t effectively solved the problem of unsatisfied consumption of ecosystem services due to the existence of imbalance and spatial mismatch, although improving the value of ecological services [26]. Due to the limited radiation range of water and atmosphere regulation [31], the free circulation of space in the market environment cannot be realized, so it didn’t significantly improve social welfare like food. In order to improve the efficiency of ecological investment, the consumption-oriented factor should be taken into account in future ecological restoration policies. It is necessary to consider the potential ecosystem service demand types of future industry types, and establish a matching ecosystem service supply functional area [32], while formulating economic development policies.

4.3. Integrating Ecological and Economic Approaches

The new demand of ecosystem services triggered by regional economic development is not usually considered because obtaining this type of data is very time-consuming. However, in this study, we have demonstrated that not only the value of ecological services can be overestimated or underestimated [16], but there is also impossible to solve the ecological service supply and consumption gap caused by new ecological service consumption if we consider only the ecosystem service supply. What’s more, the imbalance between supply and consumption weakens the supporting role of ecosystem to social and economic system. In fact, only a small percentage of the territory provided efficient supply that can meet the ecosystem service consumption. Solving the sustainability of economic development is a very important point of departure for ecosystem services research [33], as they facilitate a more inclusive ecological-economic approach by using economic methods to estimate changes in ecosystem service demand caused by economic development or changes in industrial structure, and exploring the interaction between economic and ecological processes. Incorporating the ecological service demand brought about by future industrial reform into the ecological restoration policy considerations will improve the efficiency of the ecological restoration policy and solve the sustainability problem of economic development.
This study is focused on the analysis of the relationship between ecosystem service supply and consumption, although to support decision-making it is necessary to analyses different ES because synergies and trade-offs between them may occur [34], and to analyses delivery method of ecosystem services. We considered that the trend of ecosystem service consumption brought by economic development would need to be given the utmost attention when analyzing ES for effective policy implementation and management, as the realization of the ecosystem service flow strongly depends on economic development process. Understanding which ecosystem services are more valued by economic social system is useful for targeting resources efficiently. In addition, under the framework of megaregions [12], studying the relationship between the supply and demand of ecosystem services can better understand the interaction process between ecosystems and economic systems. This type of study has important reference implications for the formulation of ecological restoration policies and economic development policies, as we identify the area with the highest or lowest demand based on changes of economic industry and show the equilibrium relationship between ecosystem service supply and consumption.

5. Conclusions

Our work presented an interdisciplinary framework by quantifying the spatial equilibrium relationship between the supply and consumption of ecosystem services to optimize ecosystem management, and used the framework to conduct a study on the relationship between the supply and consumption of ecosystem services driven by economic development and ecological restoration in Northeast China, which contributed to the formulation of economic development policies and ecological restoration policies.
The results show that the study of ecosystem service supply and consumption separately cannot effectively solve the problem that ecosystem service consumption cannot be satisfied. The economic development policies aggravated the spatial imbalance between the supply and consumption of ecosystem services in northeast China in the past 30 years, while promoting economic development. The imbalance between the supply and consumption of food, water and air in Northeast China became more severe. The unbalanced areas where food supply was less than consumption were in the clusters of Harbin, Changchun, Shenyang, and coastal cities, and there were a serious spatial mismatch between supply and consumption. Since food products can circulate freely through the market, this imbalance will not fundamentally affect regional food security, but will improve the level of agricultural industrialization and scale. The implementation of the grain economic policy not only caused the rapid expansion of unbalanced areas where water supply was less than consumption, but also aggravated the spatial mismatch between water supply and consumption in Northeast China. With economic development, the unbalanced situation in which the supply of atmospheric regulation was lower than the consumption became more severe (1995–2010), and then experienced a reduction (2010–2018). However, the mismatch between atmospheric regulation supply and consumption was still relatively widespread from 2010 to 2018. On the other hand, the implementation of ecological restoration policies improved the supply of ecosystem services to varying degrees in Northeast China.
We concluded that economic development exacerbated spatial imbalances in the supply and consumption of ecosystem services over the past 30 years in Northeast China. What’s more, the incredible space mismatch between the supply and consumption of ecosystem services still exists for a long time. The implementation of the ecological restoration didn’t effectively satisfy the consumption of ecosystem services, although improving the quality and value of ecological services in Northeast China. Economic development policies which promote the change of industrial structure will form the new consumption demand of ecosystem services. The ESs consumption direction brought by economic development need to be given the utmost attention when formulating ecological restoration policies and economic development policies. The analysis of the relationship between the supply and consumption of ecosystem services can help understand the process of interaction between ecosystems and economic systems. Future ecological restoration policies should include the consumption of ecosystem services in the scope of decision-making to improve the efficiency of ecological restoration policies.

Author Contributions

Conceptualization, Y.H. and X.Z; methodology, Y.H. and X.Z.; software, X.Z.; validation, H.Q.; formal analysis, Y.H. and X.Z.; resources, L.D.; data curation, L.D.; writing—original draft preparation, Y.H. and X.Z.; writing—review and editing, Y.H. and X.Z.; visualization, L.D.; supervision, Y.X.; Investigation, Z.Q. All authors have read and agreed to the published version of the manuscript.

Funding

This research was funded by the project of the National Natural Science Foundation of China (Grant No. 31700562) and the Fundamental Research Funds for the Central Universities (Grant No.2572015EC04).

Data Availability Statement

The data presented in this study are available on request from thecorresponding author. The data are not publicly available due to confidentiality assurance of eachparticipant’s information.

Acknowledgments

We gratefully acknowledge the data support of the Ministry of Environmental Protection (MEP) of China and Chinese Academy of Sciences (CAS).

Conflicts of Interest

The authors declare no conflict of interest.

References

  1. Costanza, R.; d’Arge, R.; De Groot, R.; Farber, S.; Grasso, M.; Hannon, B.; Limburg, K.; Naeem, S.; O’Neill, R.V.; Paruelo, J.; et al. The value of the world’s ecosystem services and natural capital. Nature 1997, 387, 253–260. [Google Scholar] [CrossRef]
  2. Shen, S.; Chen, X.; Han, M. Industrial Restructuring and Spatial Distribution of Northeast Revitalization—Comprehensive Analysis Based on Revitalization Goals, Resource Advantages and Logistics Costs. Econ. Rev. J. 2020, 6, 102–108. [Google Scholar]
  3. Etter, A.; Andrade, A.; Nelson, C.R.; Cortés, J.; Saavedra, K. Assessing restoration priorities for high-risk ecosystems: An application of the IUCN red list of ecosystems. Land Use Policy 2020, 99, 104874. [Google Scholar] [CrossRef]
  4. Lee, L.J.; Brown, M.T. Estimating the Value of Global Ecosystem Structure and Productivity: A Geographic Information System and Emergy Based Approach. Ecol. Model. 2021, 439, 109307. [Google Scholar] [CrossRef]
  5. Cao, S.; Wang, X.; Song, Y.; Chen, L.; Feng, Q. Impacts of the Natural Forest Conservation Program on the livelihoods of residents of Northwestern China: Perceptions of residents affected by the program. Ecol. Econ. 2010, 69, 1454–1462. [Google Scholar] [CrossRef]
  6. Mehring, M.; Zajonz, U.; Hummel, D. Social-Ecological Dynamics of Ecosystem Services: Livelihoods and the Functional Relation between Ecosystem Service Supply and Demand—Evidence from Socotra Archipelago, Yemen and the Sahel Region, West Africa. Sustainability 2017, 9, 1037. [Google Scholar] [CrossRef] [Green Version]
  7. Kauano, É.E.; Silva, J.M.C.; Diniz Filho, J.A.F.; Michalski, F. Do protected areas hamper economic development of the Amazon region? An analysis of the relationship between protected areas and the economic growth of Brazilian Amazon municipalities. Land Use Policy 2020, 92, 104473. [Google Scholar] [CrossRef]
  8. Khalili, N.R.; Duecker, S.; Ashton, W.; Chavez, F. From cleaner production to sustainable development: The role of academia. J. Clean. Prod. 2015, 96, 30–43. [Google Scholar] [CrossRef]
  9. Fenta, A.A.; Tsunekawa, A.; Haregeweyn, N.; Tsubo, M.; Yasuda, H.; Shimizu, K.; Kawaia, T.; Ebabuae, K.; Liyew Berihunaf, M.; Sultanf, D.; et al. Cropland expansion outweighs the monetary effect of declining natural vegetation on ecosystem services in sub-Saharan Africa. Ecosyst. Serv. 2020, 45, 101154. [Google Scholar] [CrossRef]
  10. Kindu, M.; Schneider, T.; Teketay, D.; Knoke, T. Changes of ecosystem service values in response to land use/land cover dynamics in Munessa–Shashemene landscape of the Ethiopian highlands. Sci. Total Environ. 2016, 547, 137–147. [Google Scholar] [CrossRef]
  11. Lengefeld, E.; Metternicht, G.; Nedungadi, P. Behavior change and sustainability of ecological restoration projects. Restor. Ecol. 2020, 28, 724–729. [Google Scholar] [CrossRef]
  12. Wang, J.; Zhou, W.; Steward, T.; Pickett, S.T.; Yu, W.; Li, W. A multiscale analysis of urbanization effects on ecosystem services supply in an urban megaregion. Sci. Total Environ. 2019, 662, 824–833. [Google Scholar] [CrossRef] [PubMed]
  13. Sun, X.; Crittenden, J.C.; Li, F.; Lu, Z.; Dou, X. Urban expansion simulation and the spatio-temporal changes of ecosystem services, a case study in Atlanta Metropolitan area, USA. Sci. Total Environ. 2018, 622, 974–987. [Google Scholar] [CrossRef] [PubMed]
  14. Maes, M.J.A.; Jones, K.E.; Toledano, M.B.; Milligan, B. Mapping synergies and trade-offs between urban ecosystems and the sustainable development goals. Environ. Sci. Policy 2019, 93, 181–188. [Google Scholar] [CrossRef]
  15. Daily, C. Nature’s Services: Societal Dependence on Natural Ecosystems; Island Press: Washington, DC, USA, 1997. [Google Scholar]
  16. Peña, L.; Casado-Arzuaga, I.; Onaindia, M. Mapping recreation supply and demand using an ecological and a social evaluation approach. Ecosyst. Serv. 2015, 13, 108–118. [Google Scholar] [CrossRef]
  17. Barbeau, C.D.; Oelbermann, M.; Karagatzides, J.D.; Tsuji, L.J. Sustainable agriculture and climate change: Producing potatoes (Solanum tuberosum L.) and bush beans (Phaseolus vulgaris L.) for improved food security and resilience in a Canadian subarctic first nations community. Sustainability 2015, 7, 5664–5681. [Google Scholar] [CrossRef] [Green Version]
  18. Wu, W.; Xia, T.; Hu, Q. Study on mutual transformation spatial and temporal pattern and its water resources effect between paddy field and dryland in Heilongjiang province from 1980 to 2015. Chin. J. Agric. Resour. Reg. Plan. 2019, 40, 142–151. [Google Scholar]
  19. Li, M.; Zhou, X. Positive and negative ecosystem services evaluation andits spatial pattern analysis on urban landscape: A case study of Xi’an City. Acta Geogr. Sin. 2016, 71, 1215–1230. [Google Scholar] [CrossRef]
  20. Han, B.; Zhou, X. Evaluation on ecosystem services in haze absorption by urbangreen land and its spatial pattern analysis in Xi’an. Geogr. Res. 2015, 34, 1247–1258. [Google Scholar]
  21. Li, L.; Gao, X.; Su, H. Characteristic analysis of a wide range haze in Liaoning. J. Shenyang Agric. Univ. 2019, 50, 266–272. [Google Scholar]
  22. Feng, Q.; Bao, Y.; Min, J.; Chen, Q. A Study on effects of satellite based AOD data assimilation on numerical forecast of haze. Acta Meteorol. Sin. 2018, 76, 104–116. [Google Scholar]
  23. Chen, J.; Jiang, B.; Bai, Y.; Xu, X.; Alatalo, J.M. Quantifying ecosystem services supply and demand shortfalls and mismatches for management optimisation. Sci. Total Environ. 2019, 650, 1426–1439. [Google Scholar] [CrossRef] [PubMed]
  24. Luukkanen, J.; Kaivo-oja, J.; Vähäkari, N.; O’Mahony, T.; Korkeakoski, M.; Panula-Ontto, J.; Vehmas, J.; Nguyen Quoc, A. Resource efficiency and green economic sustainability transition evaluation of green growth productivity gap and governance challenges in Cambodia. Sustain. Dev. 2019, 27, 312–320. [Google Scholar] [CrossRef] [Green Version]
  25. Trodahl, M.I.; Jackson, B.M.; Deslippe, J.R.; Metherell, A.K. Investigating trade-offs between water quality and agricultural productivity using the Land Utilisation and Capability Indicator (LUCI)–A New Zealand application. Ecosyst. Serv. 2017, 26, 388–399. [Google Scholar] [CrossRef]
  26. Ouyang, Z.; Zheng, H.; Xiao, Y.; Polasky, S.; Liu, J.; Xu, W.; Wang, Q.; Zhang, L.; Xiao, Y.; Rao, E.; et al. Improvements in ecosystem services from investments in natural capital. Science 2016, 352, 1455–1459. [Google Scholar] [CrossRef]
  27. Viña, A.; Mcconnell, W.J.; Yang, H.; Xu, Z.; Liu, J. Effects of conservation policy on China’s forest recovery. Sci. Adv. 2016, 2, e1500965. [Google Scholar] [CrossRef] [Green Version]
  28. Castillo-Eguskitza, N.; Martín-López, B.; Onaindia, M. A comprehensive assessment of ecosystem services: Integrating supply, demand and interest in the Urdaibai Biosphere Reserve. Ecol. Indic. 2018, 93, 1176–1189. [Google Scholar] [CrossRef]
  29. Schirpke, U.; Egarter Vigl, L.; Tasser, E.; Tappeiner, U. Analyzing spatial congruencies and mismatches between supply, demand and flow of ecosystem services and sustainable development. Sustainability 2019, 11, 2227. [Google Scholar] [CrossRef] [Green Version]
  30. Delang, C.O.; Wang, W. Chinese forest policy reforms after 1998: The case of the natural forest protection program and the slope land conversion program. Int. For. Rev. 2013, 15, 290–304. [Google Scholar] [CrossRef]
  31. Costanza, R. Ecosystem services: Multiple classification systems are needed. Biol. Conserv. 2008, 141, 350–352. [Google Scholar] [CrossRef]
  32. Yahdjian, L.; Sala, O.E.; Havstad, K.M. Rangeland ecosystem services: Shifting focus from supply to reconciling supply and demand. Front. Ecol. Environ. 2015, 13, 44–51. [Google Scholar] [CrossRef]
  33. Schröter, M.; Stumpf, K.H.; Loos, J.; van Oudenhoven, A.P.; Böhnke-Henrichs, A.; Abson, D.J. Refocusing ecosystem services towards sustainability. Ecosyst. Serv. 2017, 25, 35–43. [Google Scholar] [CrossRef]
  34. Inostroza, L.; Konig, H.J.; Pickard, B.; Zhen, L. Putting ecosystem services into practice: Trade-off assessment tools, indicators and decision support systems. Ecosyst. Serv. 2017, 26, 303–305. [Google Scholar] [CrossRef]
Figure 1. Location of the study area and the land use/land cover (LULC) in 2018.
Sustainability 13 01486 g001
Figure 2. Spatial patterns of ecosystem service supply and consumption in 1995 and 2010 (FS—food supply; FC—food consumption; WS—water supply; WC—water consumption; AS—atmospheric regulation supply; AC—atmospheric regulation consumption).
Sustainability 13 01486 g002
Figure 3. Spatial patterns of ecosystem service supply and consumption in 2018 (FS—food supply; FC—food consumption; WS—water supply; WC—water consumption; AS—atmospheric regulation supply; AC—atmospheric regulation consumption).
Sustainability 13 01486 g003
Figure 4. Equilibrium relationship between atmospheric regulation supply and consumption in 1995, 2010 and 2018 (SCRE (food)—The equilibrium relationship between food supply and consumption; SCRE (water)—The equilibrium relationship between water supply and consumption; SCRE (atmospheric)—The equilibrium relationship between atmospheric regulation supply and consumption).
Sustainability 13 01486 g004
Figure 5. Matching relationship between ecosystem service supply and consumption in 1995, 2010 and 2018.
Sustainability 13 01486 g005
Table 1. Food supply in each province (tons), estimated using Equation (1).
YearProvinceRiceGrains Other than RiceMeatMilkAquatic Products
1995Heilongjiang4,699,000.0020,822,000.00303,874.00566,729.00252,900.00
Inner Mongolia396,000.0010,158,000.00373,926.60372,700.0047,644.00
Jilin2,969,000.0016,955,000.00428,055.0015,745.00110,550.00
Liaoning2,618,000.0011,617,000.00194,090.004986.00194,364.00
2010Heilongjiang18,439,000.0031,689,000.001,069,393.002,924,437.00399,700.00
Inner Mongolia748,000.0020,834,000.001,702,486.002,958,309.00113,804.00
Jilin5,685,000.0022,740,000.001,240,679.00567,218.00165,958.00
Liaoning4,576,000.0013,078,000.00696,939.00283,213.00806,408.00
2018Heilongjiang26,855,000.0048,213,000.001,019,749.001,995,090.00624,320.00
Inner Mongolia1,219,000.0034,314,000.001,998,052.002,167,688.00139,499.00
Jilin6,463,000.0029,864,000.00638,504.00197,283.00234,090.00
Liaoning4,180,000.0017,744,000.001,097,863.00326,058.00838,107.00
Table 2. Food consumption per capita (kg), estimated using Equation (2).
YearGrainVegetablesEdible OilMeatMilkFishesFruits
199597116.477.1123.6514.369.244.96
201081.53116.118.8434.7223.9815.2154.23
2018127.296.19.635.121.911.452.1
Table 3. Amount of pollutants absorbed by each landscape type per unit area (kg∙km−2∙a−1).
ValueAbsorption of SO2Absorption of NOXAbsorption of PM10
Paddy field4500335015,864.33
Dry farmland4500335015,864.33
Woodland15,21360010,827.5
Grassland27,90360060
Waters000
Urban and Rural
Construction land
000
Unutilized land000
Table 4. Total supply and total consumption of ecosystem services in the four provinces of Inner Mongolia, Liaoning, Jilin and Heilongjiang. (FS—food supply (million tons); FC—food consumption (million tons); WS—water supply (million cubic meters); WC—water consumption (million cubic meters); AS—atmospheric regulation supply (million kilograms); AC—atmospheric regulation consumption (million kilograms)).
TimeProvinceFSWSASFCWCAC
1995Inner Mongolia8.1989,382.77183,759.674.226903.7118,097.46
Liaoning14.6073,166.7563,107.6413.5315,129.914322.13
Jilin20.4772,685.9895,085.607.9413,624.575870.06
Heilongjiang26.65117,786.32233,051.6811.0924,448.4612,640.05
2010Inner Mongolia20.0281,337.92182,406.184.3112,589.5020,303.49
Liaoning19.4192,069.1164,093.6314.4614,296.394949.42
Jilin30.39100,363.8094,754.139.1912,014.766105.15
Heilongjiang54.53127,831.54230,040.3412.7132,513.3912,866.87
2018Inner Mongolia29.26118,444.53193,053.534.6412,920.849678.37
Liaoning24.1841,656.7169,949.3915.3012,901.962986.92
Jilin37.4168,843.0294,562.179.6911,956.083282.50
Heilongjiang78.72168,890.46213,877.1413.0534,356.036590.25
Table 5. Proportion of secondary and tertiary industries.
IndustryProportion of Secondary IndustryProportion of Tertiary Industry
Year199520102018199520102018
Inner Mongolia38.39%54.60%39.40%31.03%36.10%50.50%
Liaoning51.14%54.10%39.60%35.90%37.10%52.40%
Jilin42.57%52.00%42.50%29.73%35.90%49.80%
Heilongjiang52.70%50.20%24.60%27.76%37.20%57.10%
Table 6. Correlation between GDP and equilibrium coefficient (SCRE) of ecosystem service supply and consumption.
Time199520102018
GDP111
SCRE_FOOD−0.750 ** (0.000)−0.727 ** (0.000)−0.704 ** (0.000)
SCRE_WATER−0.175 ** (0.007)0.021 (0.744)−0.326 ** (0.000)
SCRE_AIR−0.127 (0.051)−0.146 * (0.024)−0.147 * (0.023)
N238238238
* p < 0.05; ** p < 0.01.
Publisher’s Note: MDPI stays neutral with regard to jurisdictional claims in published maps and institutional affiliations.

