
Application of Marginal Rate of Transformation in Decision Making of Multi-Objective Reservoir Optimal Operation Scheme

1
School of Water Resources and Hydropower Engineering, North China Electric Power University, Beijing 102206, China
2
Bank of KunLun, Beijing 100033, China
*
Author to whom correspondence should be addressed.
Sustainability 2021, 13(3), 1488; https://doi.org/10.3390/su13031488
Submission received: 5 January 2021
/
Revised: 25 January 2021
/
Accepted: 27 January 2021
/
Published: 1 February 2021
Abstract
:For reservoirs with combined storage capacity for flood control and beneficial purposes, there tends to be potential benefit loss when the flood control limited water level is used in medium and small floods. How to find the optimal water level scheme for profit-making and pursue the optimization of comprehensive benefits has always been a difficult problem in multi-objective reservoir optimal operation. Based on the principle of the maximum benefit obtained by the product conversion curve and the isorevenue line in microeconomics, taking flood control and power generation as two products of a reservoir, a multi-objective optimal operation scheme decision-making model is established to seek the highest water level scheme that can produce the maximum comprehensive benefits of flood control and power generation. A case study of the Three Gorges reservoir in the early flood season of a dry year shows that on the one hand, under the condition of deterministic inflow, the model can work out the optimal water level and the corresponding best equilibrium point for both flood control and power generation, and it can increase the total power output by 4.48% without reducing the flood control benefits; on the other hand, it can also obtain the dynamic control area of the maximum allowable water level for power generation considering inflow forecast error, which provides a theoretical reference for determining the starting water level in medium and small floods and utilizing flood resources.
1. Introduction
Multi-objective reservoir optimal operation generally considers the benefits of multiple objectives such as flood control, power generation, and water supply, which are neither completely conflicting nor coordinated [1]. The increase of one objective benefit may lead to an increase or decrease of other objective benefits, and there are varying degrees of mutual feedback among the objectives [2]. In addition, as multi-objective problems under uncertain conditions often face complex non-inferior solution sets, it is a major problem to make reasonable decisions at present [3]. Under the condition of deterministic inflow runoff, the uncertainty can be diminished by runoff forecast [4]. However, due to the existence of forecast error, in the multi-objective reservoir optimal operation based on forecast runoff, each objective benefit may have a certain degree of uncertainty, which is actually a multi-dimensional, continuous, and nonlinear optimization problem, aggravating the difficulty of operation decision making [5].
Currently, the research on decision-making methods of multi-objective reservoir optimal operation schemes [6,7,8,9,10,11] focuses on the analysis of the competition and coordination among objectives [12], and the formulation of a relatively compromise scheme by comprehensively considering various objectives. For example, Zhang Yongchuan et al. [13,14] applied fuzzy sets to multi-objective optimal operation scheme decision making of reservoirs; Ji Changming et al. [15,16] used the ideal mean rate method to determine the best compromised solution of a multi-objective reservoir scheme set, and they solved the problem of non-unique equilibrium solution when the multi-objective non-inferior solution set is non-convex; Peng Yang et al. [17] used the weighted ideal point evaluation model to sort the set of non-inferior solutions, in which decision makers could select the optimal scheme according to their subjective preferences; Zhou Yanlai et al. [18] used a multi-objective evaluation method combining the weighting method and projection pursuit to select the joint storage scheme of the Xiluodu–Xiangjiaba–Three Gorges cascade reservoirs; Gabriel-Martn et al. proposed a method to solve conflicts that arise in the operation of multipurpose reservoirs when determining maximum conservation levels [19]. These achievements have laid a sound theoretical basis for the decision making of multi-objective reservoir operation schemes. However, due to the complexity of such a decision-making problem, especially when strong subjectivity emerges in determining the weight value of each index, the influence of uncertain factors on multi-objective reservoir optimal operation scheme decision making is often neglected.
The marginal rate of transformation (MRT) is often used to analyze the best combination of output between different products in economics. MRT refers to a ratio according to which two kinds of products can be converted to each other. On the premise of maintaining the same degree of satisfaction (that is, on the same indifference curve), MRT is the ratio between one unit increase of a product and the abandonment of another, which can be represented graphically by the gradient of a line between two points on the indifference curve. For multi-objective reservoir optimal operation scheme decision making, flood control, power generation, water supply, and so on can be regarded as products, and their best output combination is the best benefit combination. In water conservancy engineering, some scholars have used similar concepts for related applications (e.g., Zhang Juntao et al. [3] carried out marginal analysis through objective weight coefficients to guide the multi-objective optimal operation decision of cascade hydropower stations). Yet so far, there is no research and application of directly using the MRT method for evaluation and analysis in multi-objective reservoir optimal operation decision making.
In order to explore the reasonable decision-making method of multi-objective reservoir optimal operation schemes, this paper uses the MRT method in microeconomics to seek the operation scheme with the maximum expected benefit of different objective combinations. Taking the early flood season of a dry year as the studied period, the mutual feedback relationship between flood control and power generation benefits is analyzed. The MRT method can avoid the common uncertainty in previous multi-objective evaluation methods due to the influence of subjective factors, and it can work out the best equilibrium solution of the benefit combinations of flood control and power generation. This method is also applied to the multi-objective optimal operation scheme decision making under the condition of uncertain inflow. The optimal scheme is consistent with the actual runoff process, which can provide reference and guidance for the actual reservoir operation.
2. Materials and Methods
In order to study the selection and decision-making of multi-objective reservoir optimal operation schemes, firstly, a multi-objective reservoir optimal operation model is developed and solved. Then, the MRT method is used to select a suitable scheme based on the calculation results.
2.1. Multi-Objective Reservoir Optimal Operation Model and its Solution
Taking a reservoir with combined storage capacity for flood control and power generation as an example, a multi-objective reservoir optimal operation model is established, which aims to maximize the benefits of power generation and flood control, respectively. Taking the maximum allowable water level for power generation in the early flood season as the key decision variable, this paper focuses on the analysis of the mutual feedback response relationship between the two objectives. Taking the MRT as the intermediate variable, the principle in microeconomics that the product conversion curve is tangent to the isorevenue line is used to determine the maximum allowable water level for power generation in the early flood season, so as to maximize the overall objective benefits.
2.1.1. Objective Function
In order to analyze the mutual feedback relationship between power generation and flood control benefits in the early flood season, two indexes—power generation and relative flood control guarantee rate—are calculated to indirectly reflect the relationship between power generation benefits and flood control benefits.
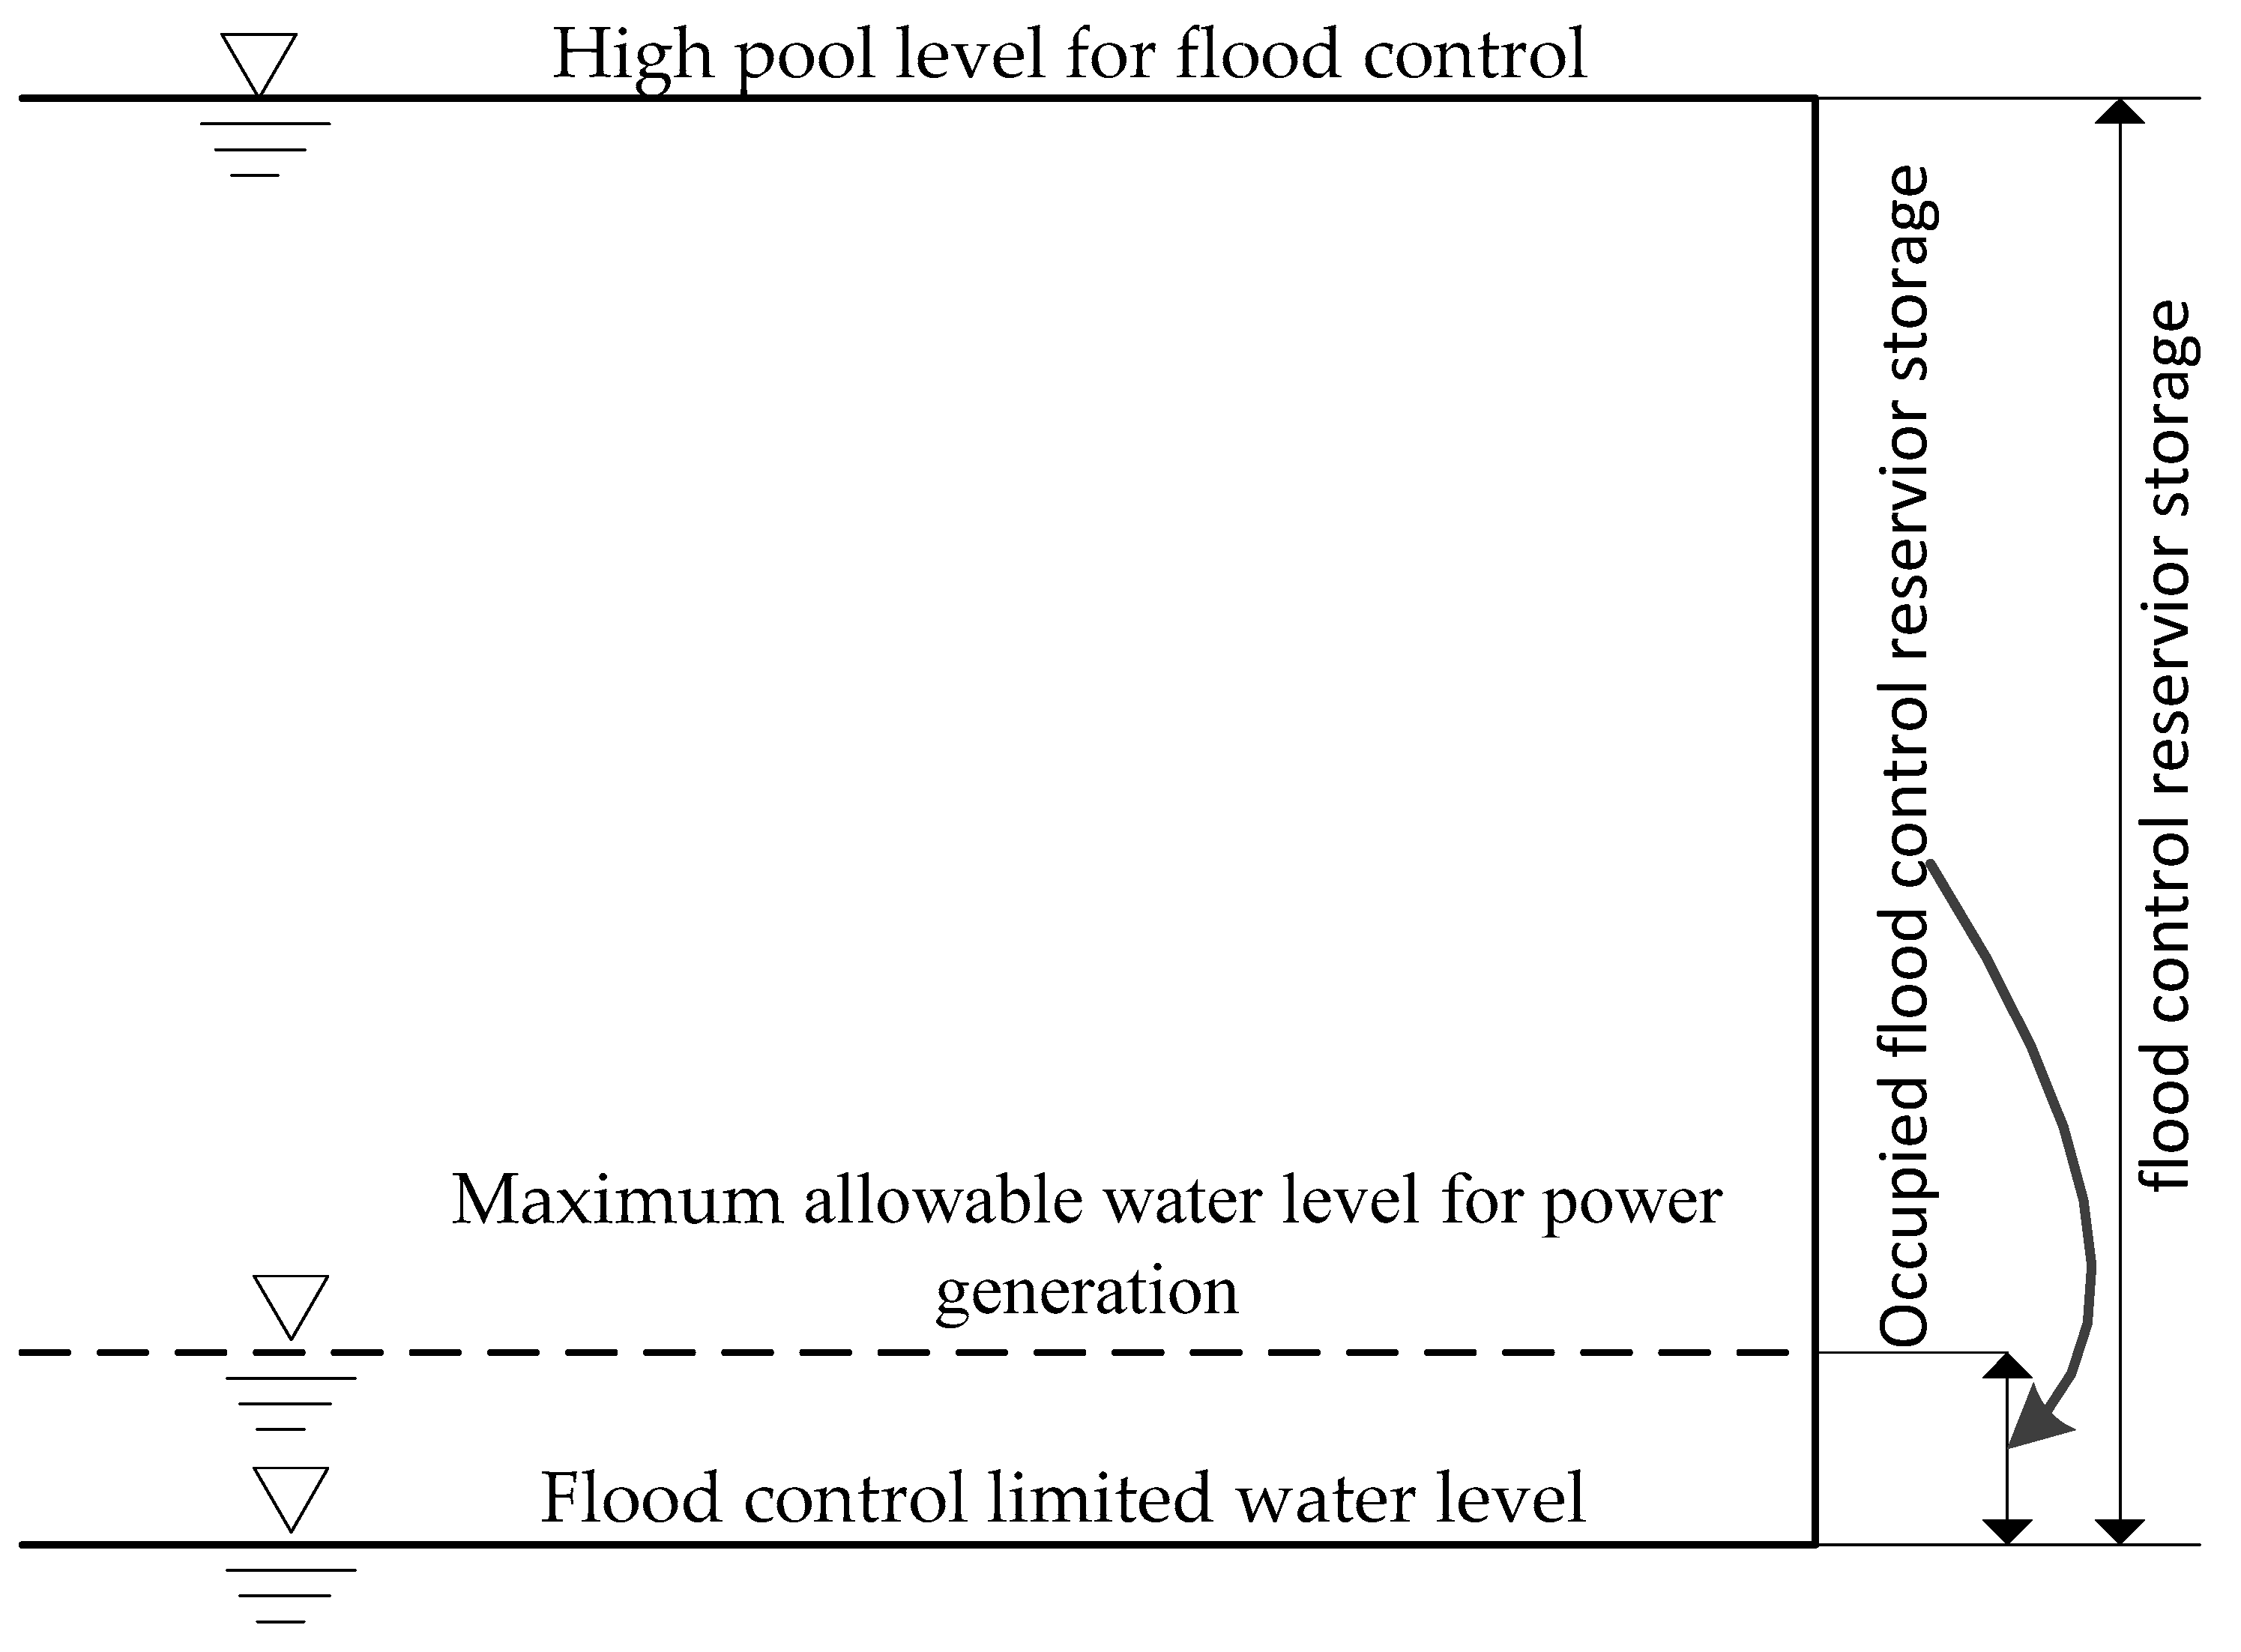
where , ; F1 is the total power generation in an operation cycle; T is the number of periods in an operation cycle; i is the identifier of a period; Δt is the length of a period; is the power output in period i; F2 is the flood control benefits in an operation cycle; Pf is the relative flood control guarantee rate; , Zm is the maximum allowable water level for power generation in an operation cycle, Zd is the high pool level for flood control, and Zf is the flood control limited water level. The relative flood control guarantee rate is related to the maximum allowable water level for power generation. The higher the maximum allowable water level, the higher the risk that the water level cannot fall below the flood control limited water level at the end of the operation cycle, and the smaller the flood control benefits. See Figure 1 for their specific relationship.
2.1.2. Constraints Conditions
- (1)
- Water balance constraint
where Vi and Vi+1 are the reservoir storage capacity at the beginning and the end of period i respectively; Qi and are the reservoir inflow and outflow in period i, respectively.
- (2)
- Outflow constraint
where and are the minimum and the maximum allowable reservoir outflow in period i, respectively.
- (3)
- Water level constraint
where is the reservoir water level at moment i; and are the upper and the lower limits of water level at moment i, respectively.
- (4)
- Power output constraint
where is the power output in period i; and are the minimum and the maximum allowable power output in period i, respectively (e.g., the guaranteed output and the expected output, respectively).
- (5)
- Variables are not negatively constrained
All variables in the model are greater than 0 or equal to 0.
2.1.3. Model Solution
By the constraint method, maximizing power generation is taken as the major objective and maximizing flood control benefit is transformed into the constraint condition. In other words, the multi-objective optimization is converted into a single-objective problem. Different schemes of the maximum allowable water level for power generation are selected, and then, the genetic algorithm [20] is used to solve the transformed single-objective model.
2.2. Marginal Substitution Relation of Reservoir Operation Benefits
The concept of MRT comes from the ordinal utility theory in microeconomics [21]. It refers to how much the output of a product will decrease with each unit of another product added, which means the gradient of the product conversion curve. The product conversion curve represents the maximum limit of various production combinations of different commodities by using existing resources under certain technical conditions, which constitutes the production possibility boundary. On this boundary, each point represents a certain combination of two products. Moving from one point to another means the increase of one product with the decrease of the other. This kind of curve with equivalent utility is generally called the indifference curve. It reflects a kind of “equal value” state of product combination for consumers; that is, every point on the curve has the same value at a certain angle. The movement of points on the curve indicates the change of combination modes with a constant value and also the competitive relationship between two products. The MRT at each point can be deemed as the relative competitive value of the two products in the current situation, which is an objective law of replacement. In the case of two products, each point on the curve represents a product combination, and the absolute value of its gradient is the MRT of that combination.
The result of a multi-objective reservoir optimal operation model is often a group of non-inferior solutions. According to the Pareto optimization theory, it can be regarded as an indifference line or indifference surface. Here, the concept of MRT can be used to measure the mutual feedback between the objectives. This is a quantitative method to describe the relationship between the objectives under uncertain conditions, which makes it convenient for decision makers to formulate the optimal operation scheme in different scenarios.
Similar to the concepts in economics, the concepts of product and utility have corresponding meanings in reservoir operation [22]. The composition of products includes power generation, flood control, water supply, etc., which means how to distribute the water so that the benefit relationship between the objectives can reach the best state. In operation decision making, the data of the indifference curve are composed of the non-inferior solution set, and the utility effect of water resources for a particular set of non-inferior solutions is the same under the same conditions. Therefore, in the application of MRT, an indifference curve represents the output level of power generation, flood control, and water supply under the same inflow condition, which is the product conversion curve or conversion surface.
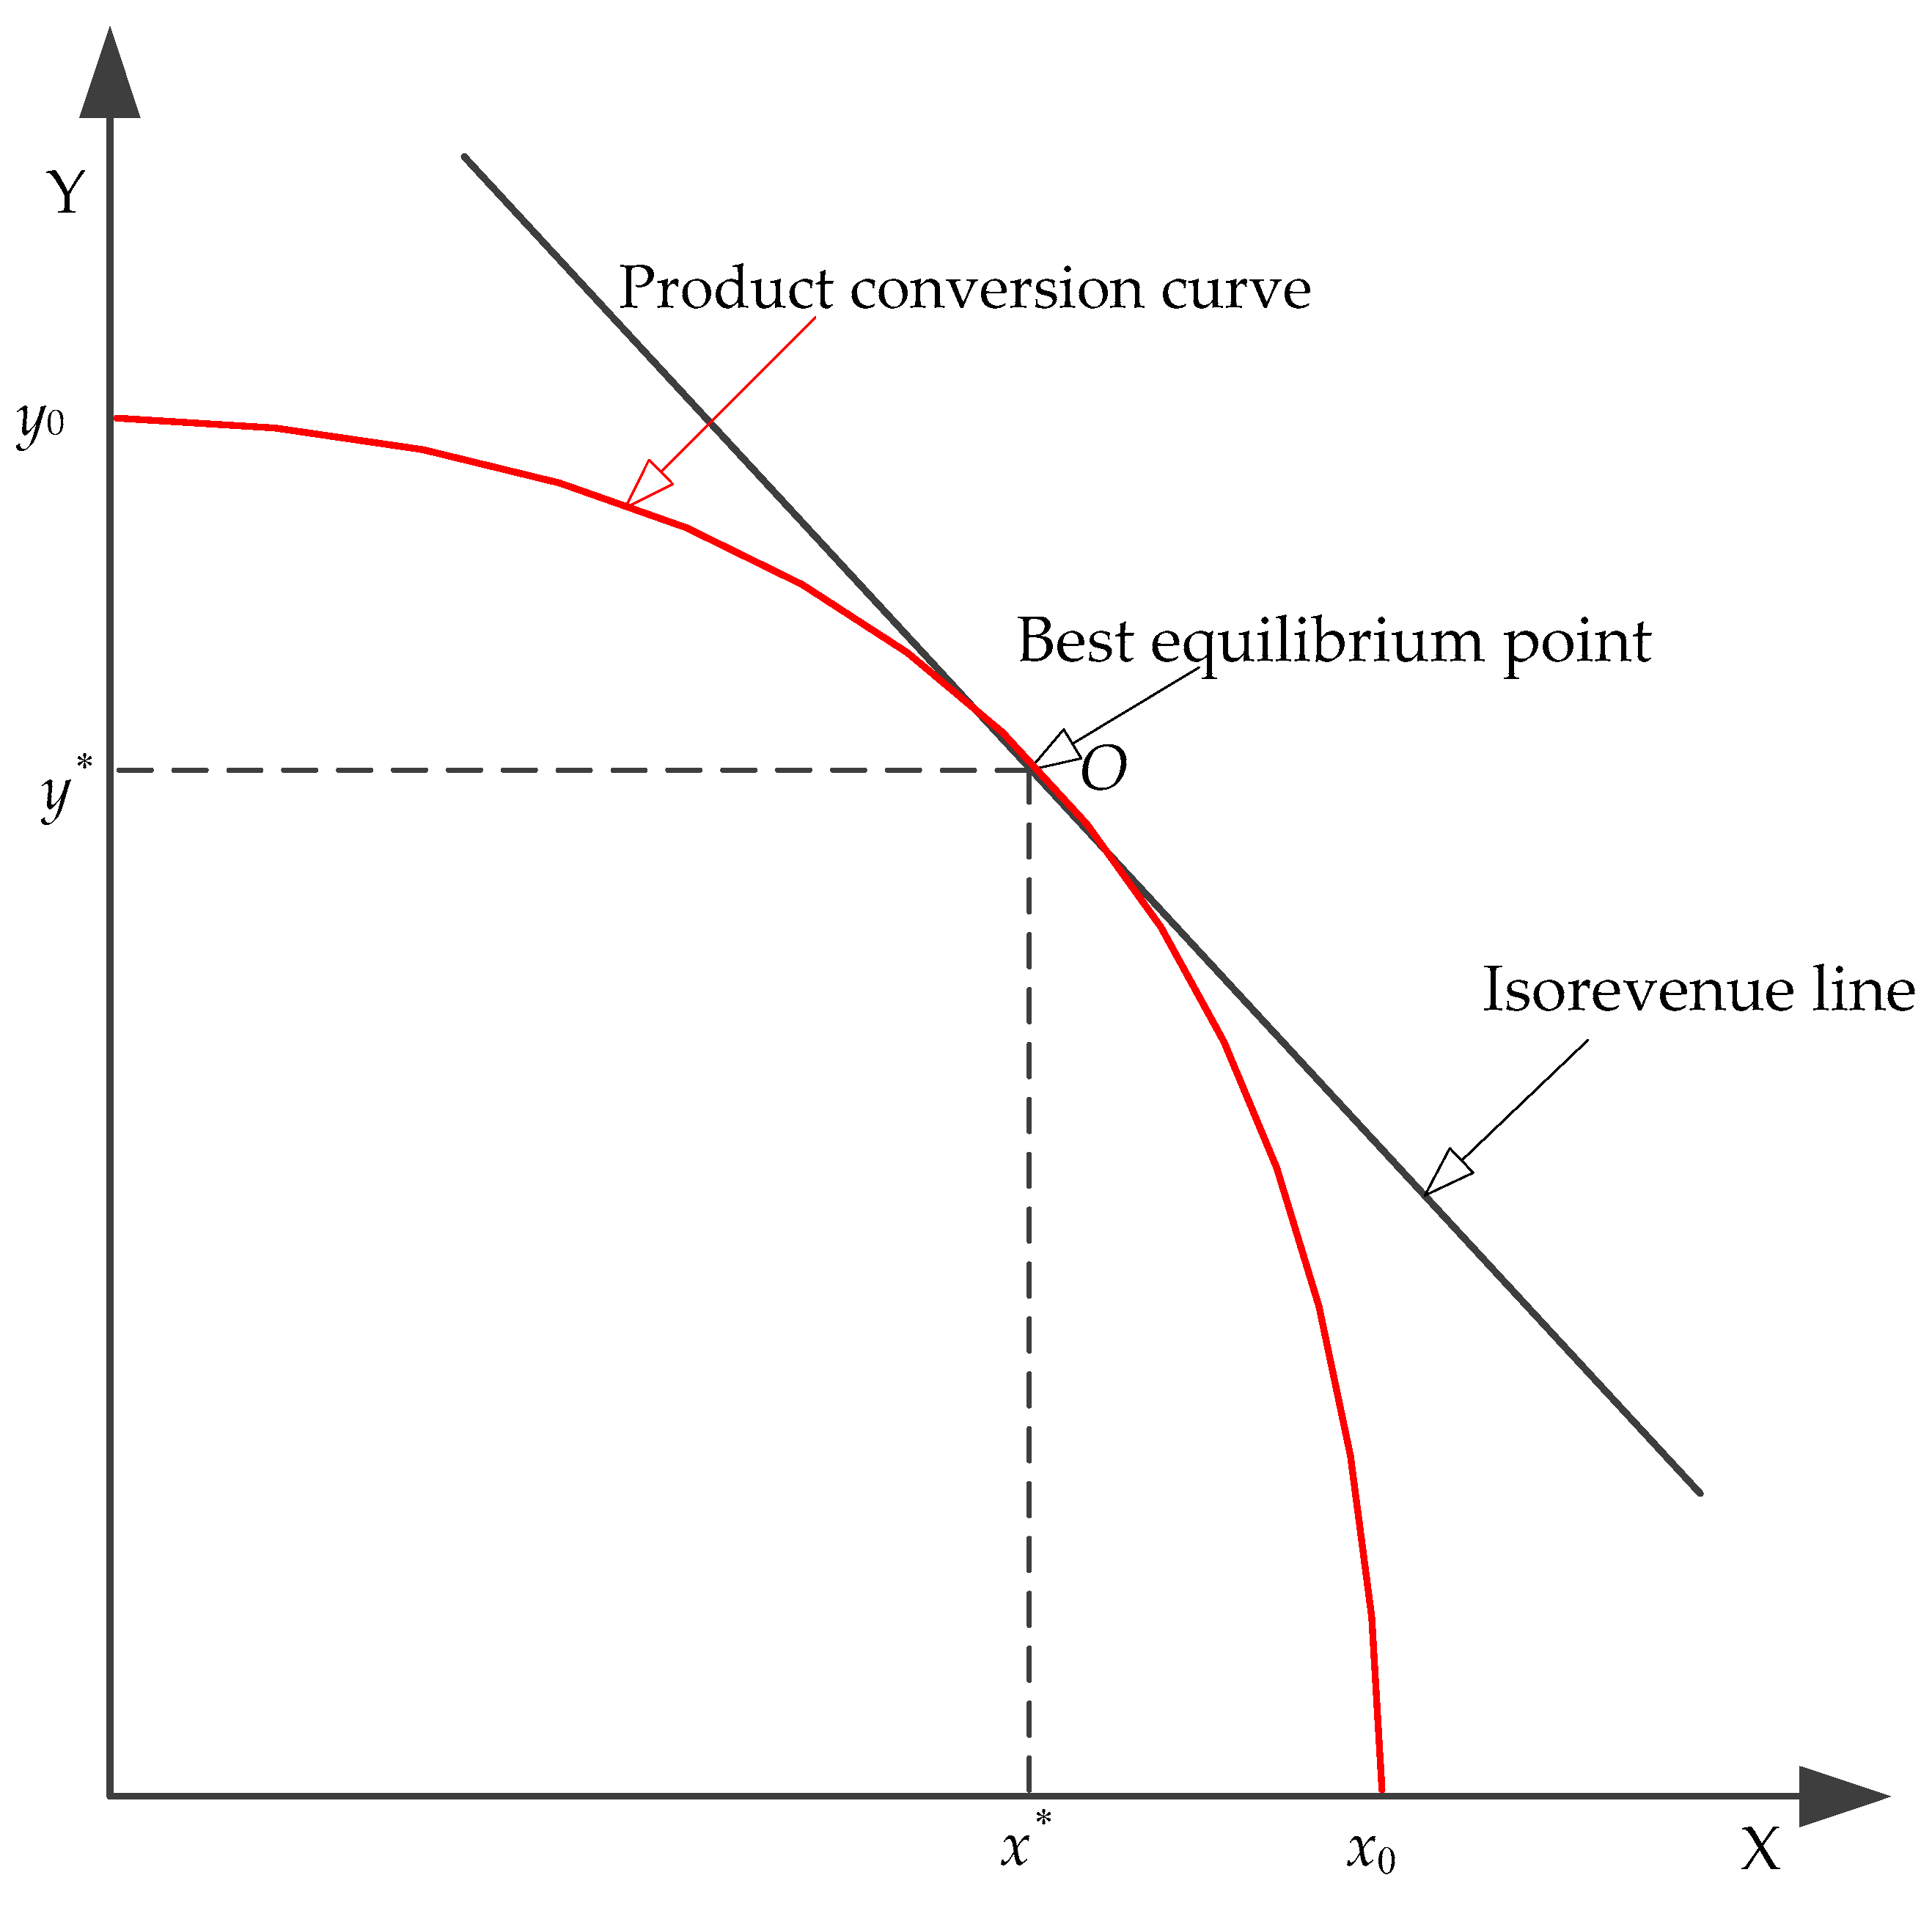
Based on the above two premises, the mutual feedback relationship between flood control and power generation in reservoir operation is analyzed through the marginal rate of transformation. Taking the early flood season as the studied period, the production combinations of flood control and power generation under different maximum water levels are derived through optimal operation, and thus their product conversion curve under the same inflow condition is obtained. The points with different gradients on the curve correspond to different marginal rates of transformation, which represent the conversion relationship between the two objectives and also their relative value, indicating the practical benefits of reservoir operation. This specific relationship is shown in Figure 2.
Assuming that the flood control benefit is expressed as X and the power generation benefit is expressed as Y, then their total utility function U can be expressed as Equation (6).
The MRT is a negative gradient of the benefit conversion curve, and its specific calculation is shown in Formula (7).
where is the variation of flood control benefits and is the variation of power generation benefits.
For multi-objective reservoir decision making, the isorevenue line stands for different production combinations that yield certain total benefits of flood control and power generation under the same inflow condition, and its gradient is the market price ratio of the two products, as shown in Equation (8).
where is the price of flood control benefits; is the price of power generation benefits; and IC is the total income.
When the MRT is equal to the price ratio, the investment for flood control and power generation is the best combination:
In Figure 2, when the MRT of a certain point on the product conversion curve is the same as the gradient of the isorevenue line, the combined benefits of power generation and flood control are the largest. Point O is the best combination point of flood control and power generation benefits, which is also known as the best equilibrium point.
2.3. Decision Making of Multi-Objective Reservoir Optimal Operation Scheme with Deterministic Inflow
Under the condition of deterministic inflow, the power generation and flood control operation scheme is formulated with forecast runoff. The decision-making steps of the optimal operation scheme using the MRT method are as follows.
Step 1: Draw the product conversion curve according to the optimal operation results. This paper mainly studies the maximum benefit combination that sacrifices flood control benefits for more power generation benefits while ensuring flood control safety in the flood season. For the objective function in this paper, the production of power generation is expressed in the form of generated energy, whereas the production of flood control is expressed in the form of flood control storage capacity. Since the flood control storage capacity is sacrificed to increase power generation, the independent variable of the function is flood control storage capacity, and the dependent variable is power generation. Thereby, the abscissa and ordinate of the product conversion curve are flood control storage capacity and power generation respectively, which are expressed by the letters x and y. Work out their function expression .
Step 2: Differentiate the function and obtain the MRT function y′ of power generation and flood control storage capacity.
Step 3: Obtain the isorevenue line according to the price ratio of flood control and power generation (), where is the price of flood control and is the price of power generation.
Step 4: From , calculate the MRT of the optimal benefit combination (MRT*).
Step 5: According to MRT* and the MRT function, reversely calculate the power generation, flood control storage capacity, and maximum allowable water level at the best equilibrium point.
2.4. Decision Making of Multi-Objective Reservoir Optimal Operation Scheme with Uncertain Inflow
Reservoir inflow plays an important role in multi-objective reservoir optimal operation, as it determines the flow distribution among each objective. In general, the forecast runoff is directly used in the multi-objective reservoir optimal operation and decision making. However, due to the existence of forecast error, there are some differences between the actual inflow and the forecast inflow. This uncertainty of inflow is detrimental to the formulation of reservoir operation schemes and the decision making. While it is difficult to improve the accuracy of forecast models, the quantitative analysis of runoff forecast error can help enhance the accuracy of formulated reservoir operation schemes. It is important to make full use of hydrological forecast information, reasonably consider forecast error, and reduce the loss caused by error. Here, the t-Copula function method is used to obtain the joint distribution function of runoff forecast error variables. Then, n values of forecast runoff are simulated based on the Monte Carlo method and the forecast error function. Next, the constraint method is used to convert the multi-objective problem into a single-objective problem to solve. Finally, the MRT method is employed to obtain the optimal equilibrium solution area under different inflow probabilities.
For the simulation of the runoff forecast error function, this paper refers to [23,24], and the specific steps are as follows.
Step 1: Based on statistical analysis of historical reservoir runoff data, calculate the relative error of forecast inflow ().
Step 2: Calculate the mean value and variance of the series of relative error, and obtain the error domain.
Step 3: Under the constraints of the mean value and variance, and based on the Gaussian mixture model, work out the distribution function of runoff forecast errors of different periods , where t = 1, 2, …, T and T is the total number of runoff periods.
Step 4: Analyze the correlation between the runoff forecast errors in each period.
Step 5: Use the t-Copula function to simulate the joint distribution function of reservoir runoff forecast error , as shown in Equation (10).
where Σ is the correlation matrix; v is the degree of freedom; is the inverse function of the t distribution whose degree of freedom is v; X is the matrix of forecast error variables in different forecast periods.
Step 6: Based on the joint distribution function, use the Monte Carlo method to simulate the runoff forecast error in each forecast period. Suppose that m sets of forecast errors are simulated.
Step 7: Combine the m sets of forecast error with the forecast runoff to obtain m sets of simulated runoff, as shown in Equation (11).
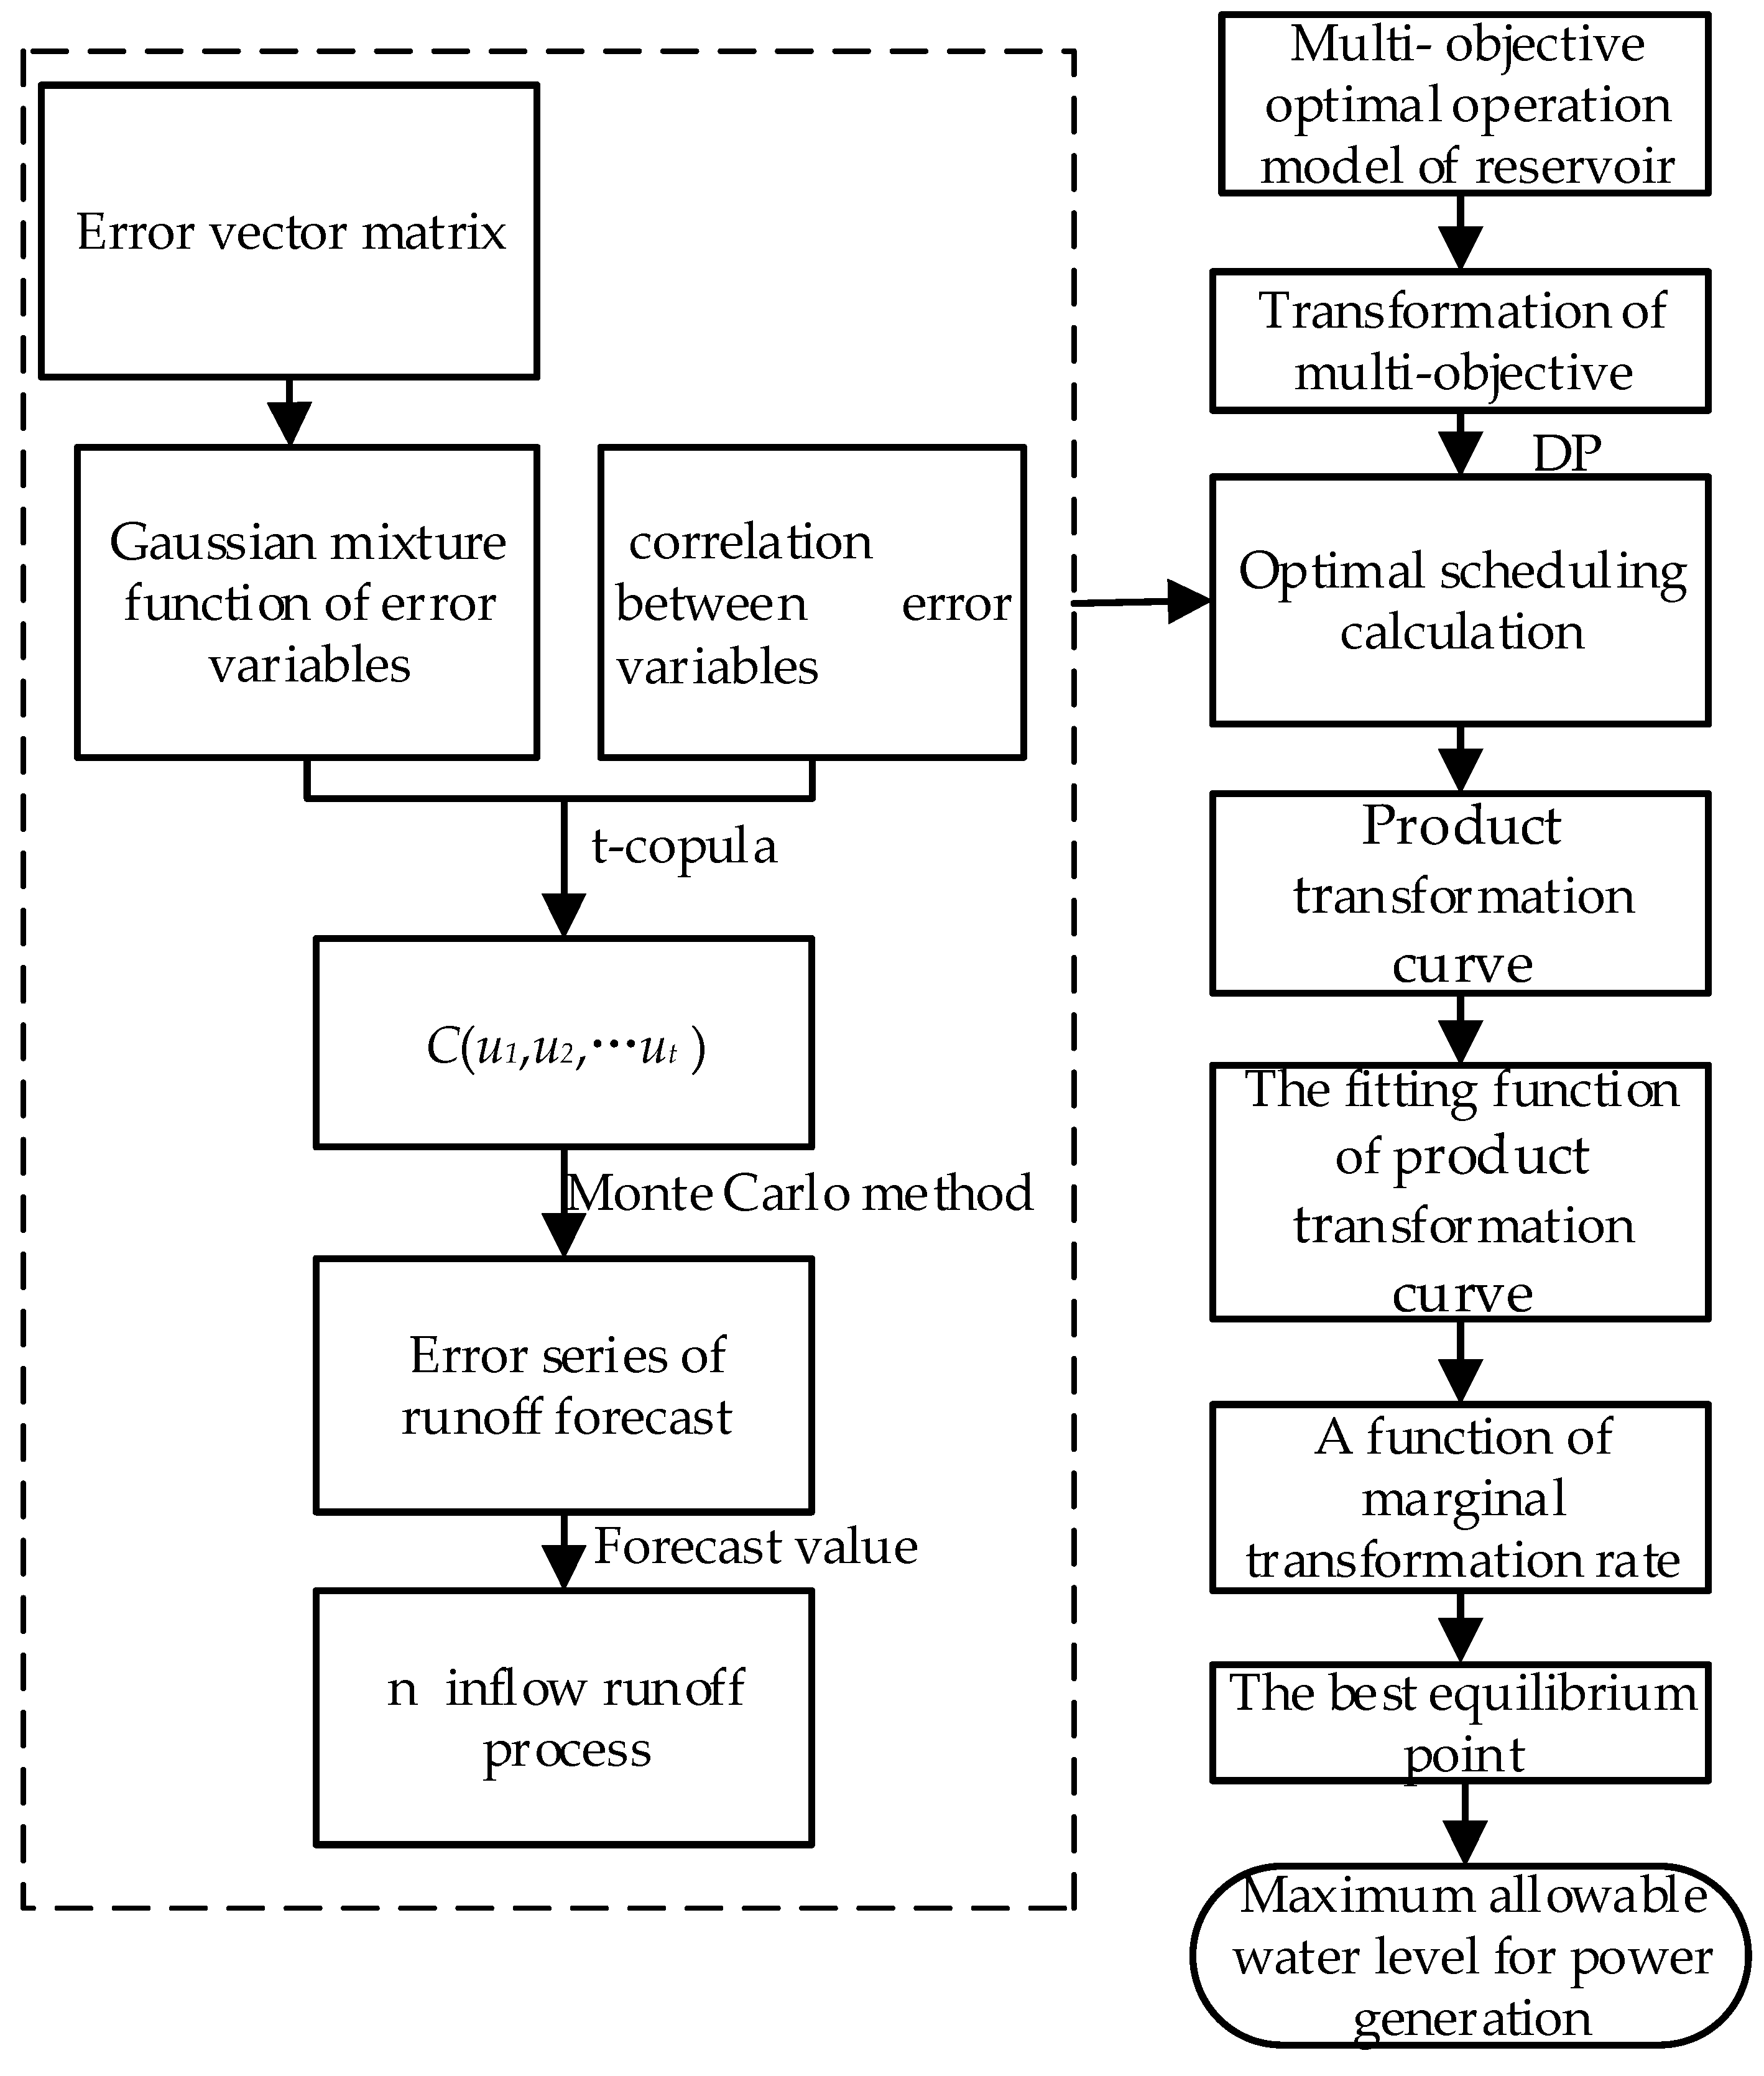
where Qs is the simulated runoff, Qp is the forecast runoff, and is the simulated forecast error. Due to the existence of inflow runoff forecast error, it is necessary to fit the runoff forecast error function before multi-objective operation. The decision-making process of multi-objective optimal operation scheme considering runoff forecast error by using the MRT method is shown in Figure 3.
3. Case Study
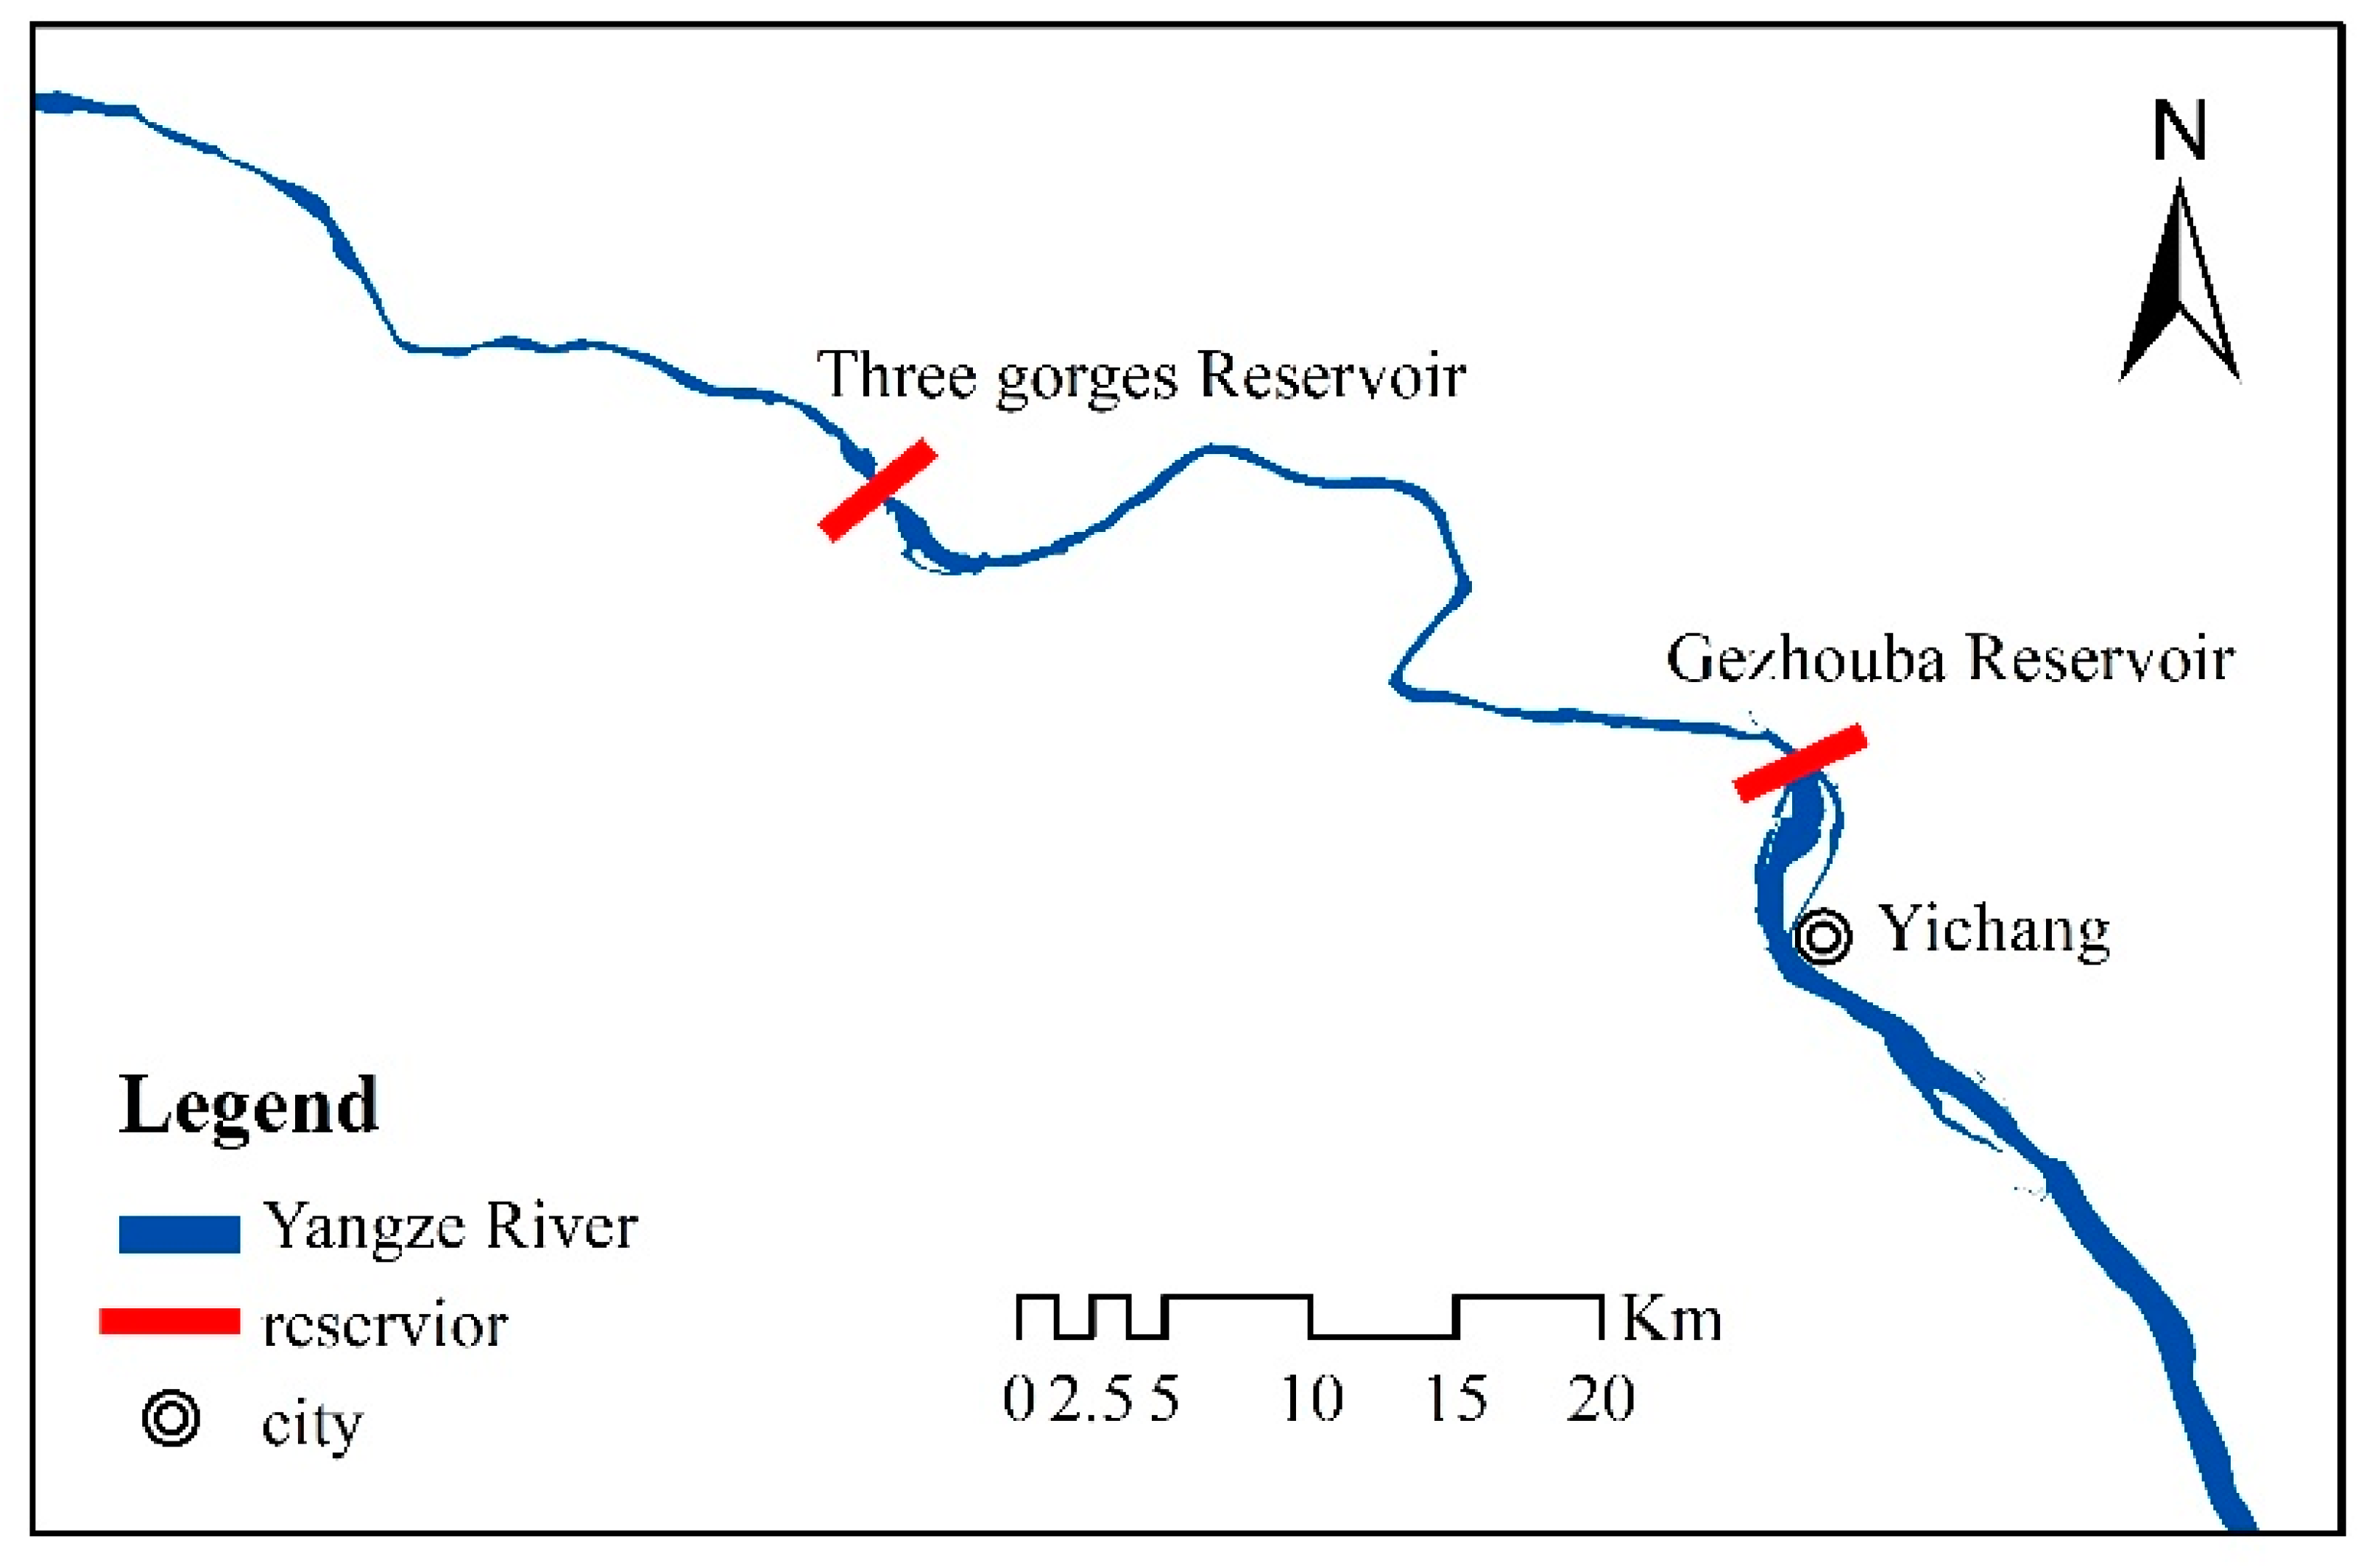
In order to analyze and test the application of the MRT method in multi-objective optimal reservoir decision making, the Three Gorges reservoir is taken as an example to seek the best equilibrium point between flood control and power generation. The Three Gorges reservoir is located in Yichang, Hubei province, the hinterland of the mainstream of the Yangtze River, and the center of central China. It is about 40 km away from the Gezhouba reservoir, with a drainage area of 1 million km2 and an average annual runoff of 451 billion m3. The hydropower reserves reach 270 million kW, which is mainly distributed in the mainstream and tributaries of the upper reaches. The exploitable capacity is 197 million kW, accounting for 53% of China’s exploitable hydropower resources. The Three Gorges reservoir is a large reservoir with comprehensive benefits of flood control, power generation, and navigation. Its main parameters are shown in Table 1, and the location map of its basin is shown in Figure 4.
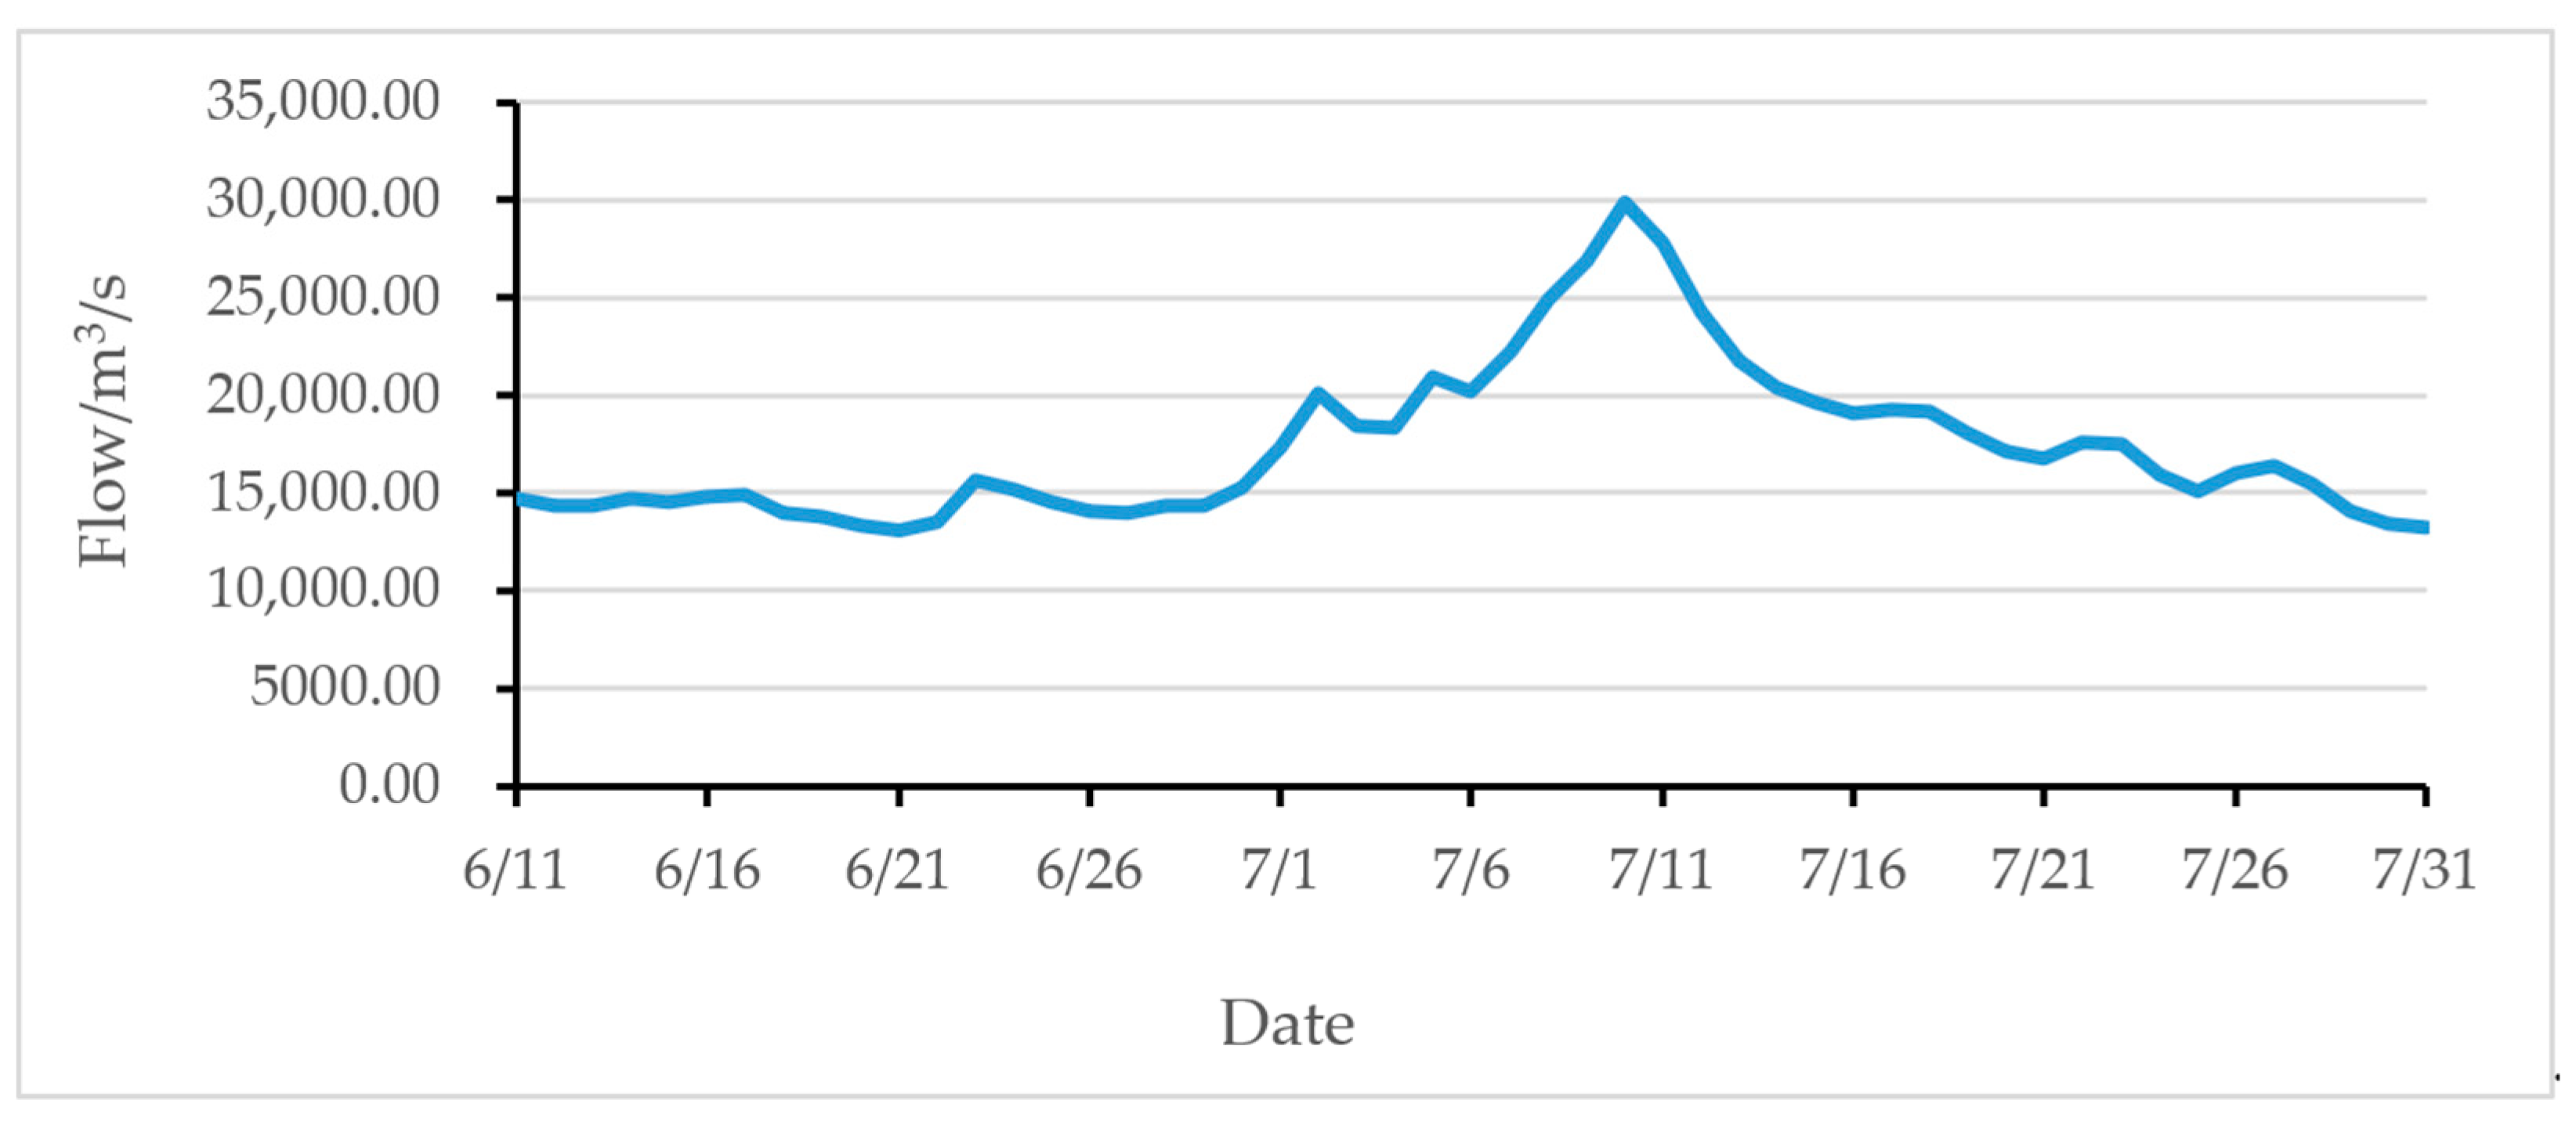
The flood season of the Three Gorges reservoir is from 10 June to 30 September, the transition period is from late May to early June, and the non-flood season is from mid September to mid May. Based on the existing runoff data, this paper selects the early flood season in 2006 as the research period, and the operation cycle is from 11 June to 30 June before the first flood. Generally, the maximum allowable water level for power generation in flood season is the flood control limited water level. The flow variation process from 1 June to 30 July is shown in Figure 5. By analyzing the inflow data series in June and July 2006, the maximum value from 11 June to 30 June is 15,600 m3/s, while the power generation flow for the generating unit at full capacity is about 30,000 m3/s. Therefore, the maximum allowable water level for power generation in the early flood season can be raised to increase water storage and thus enhance power generation. Different maximum allowable water levels for power generation are selected to calculate the power generation and flood control benefits under different flood control starting water levels. Taking one day as the calculation period, the multi-objective optimal operation and decision making are carried out by considering different water level upper limit schemes, and the mutual feedback relationship between flood control and power generation is analyzed. Furthermore, the multi-objective optimal operation and scheme decision making considering runoff forecast error is studied and analyzed.
In order to compare and analyze the two objectives of power generation and flood control, the two products are respectively expressed by power generation and flood control storage capacity. Power generation includes fixed power generation and variable power generation. Variable power generation is the power generation from sacrificing flood control benefits, while fixed power generation can be obtained without sacrificing flood control benefits. Here, the variable power generation is selected to analyze the relationship between power generation and flood control benefits. Since the flood control limited water level is the maximum allowable water level limit for power generation in the flood season, the fixed power generation in this example is the optimal operation power generation when the maximum water level is equal to the flood control limited water level. Through the calculation results of multi-objective optimal operation, it is found that when the maximum allowable water level for power generation exceeds 154 m, the power generation will not change anymore. Hence, for the convenience of calculation and without affecting the calculation results, the relative flood control storage capacity is used for calculation and analysis. The calculation of variable power generation and relative flood control storage capacity is shown in Equations (12) and (13).
where Ev is the variable power generation; Es is the power generation of the maximum water level schemes; E0 is the power generation when the maximum water level equals to the flood limited water level; C* is the relative flood control storage capacity; Cs is the flood control storage capacity of the maximum water level schemes; and C0 is the flood control storage capacity of the highest maximum water level scheme, which in this paper is the flood control storage capacity when the maximum allowable water level for power generation is 154 m.
3.1. Analysis of the Relationship between Flood Control and Power Generation Benefits under the Condition of Deterministic Inflow
In order to make a comparative analysis with the condition of uncertain inflow, the measured runoff in 2006 is taken as the deterministic inflow for calculation. The schemes of maximum water level for power generation starts from 145 m and rises every 0.5 m. The optimal operation result shows that when the maximum allowable water level for power generation reaches 154 m, the power generation will no longer continue to grow. Therefore, we select 19 schemes of maximum allowable water level for power generation from 145 to 154 m for analysis, as shown in Table 2.
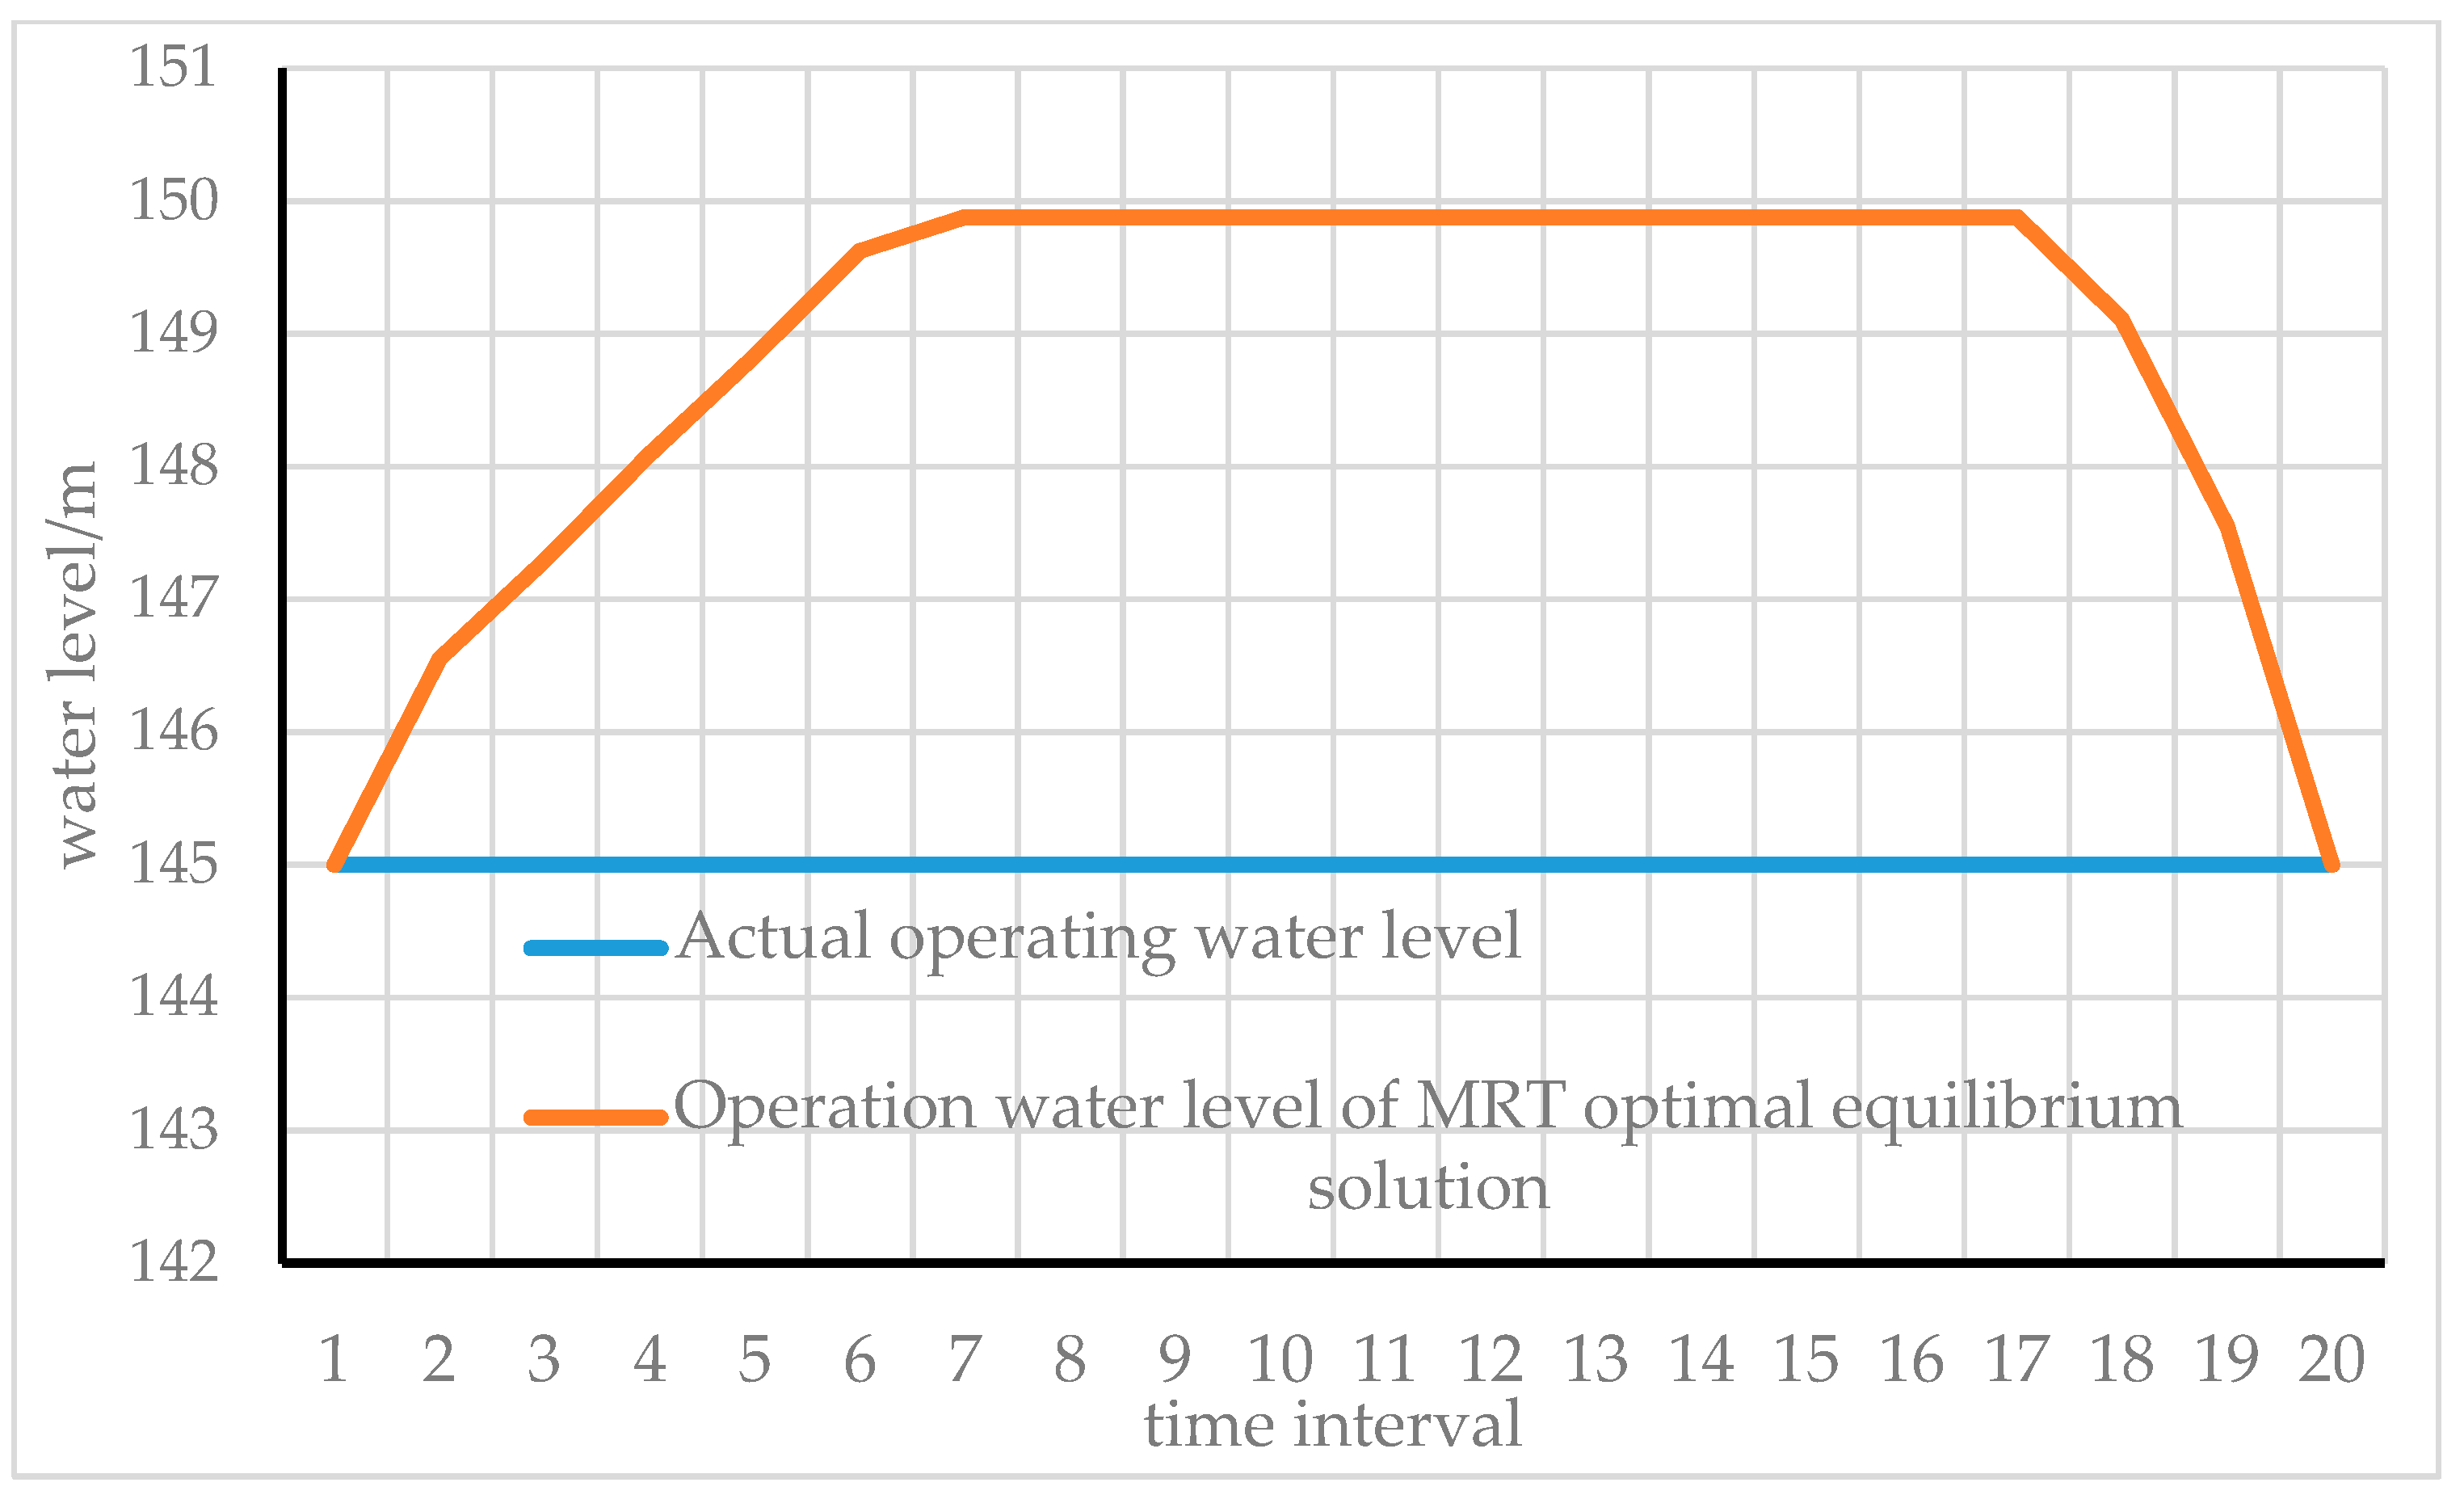
The variation in actual reservoir levels and the reservoir-level pattern for MRT optimized operation in 2006 from 11 June to 30 June is shown in Figure 6. On the basis of ensuring the safety of flood control, the MRT method makes full use of water quantity and increases the benefit of power generation.
The following can be seen from Table 2: (1) The total power generation increases with the rising of the maximum allowable water level for power generation, indicating that the reasonable increase of the maximum allowable water level for power generation can make full use of the water and increase the water head, which is conducive to power generation. (2) By contrary, the flood control guarantee rate decreases with the rising of the maximum allowable water level for power generation, which is in line with the theoretical analysis.
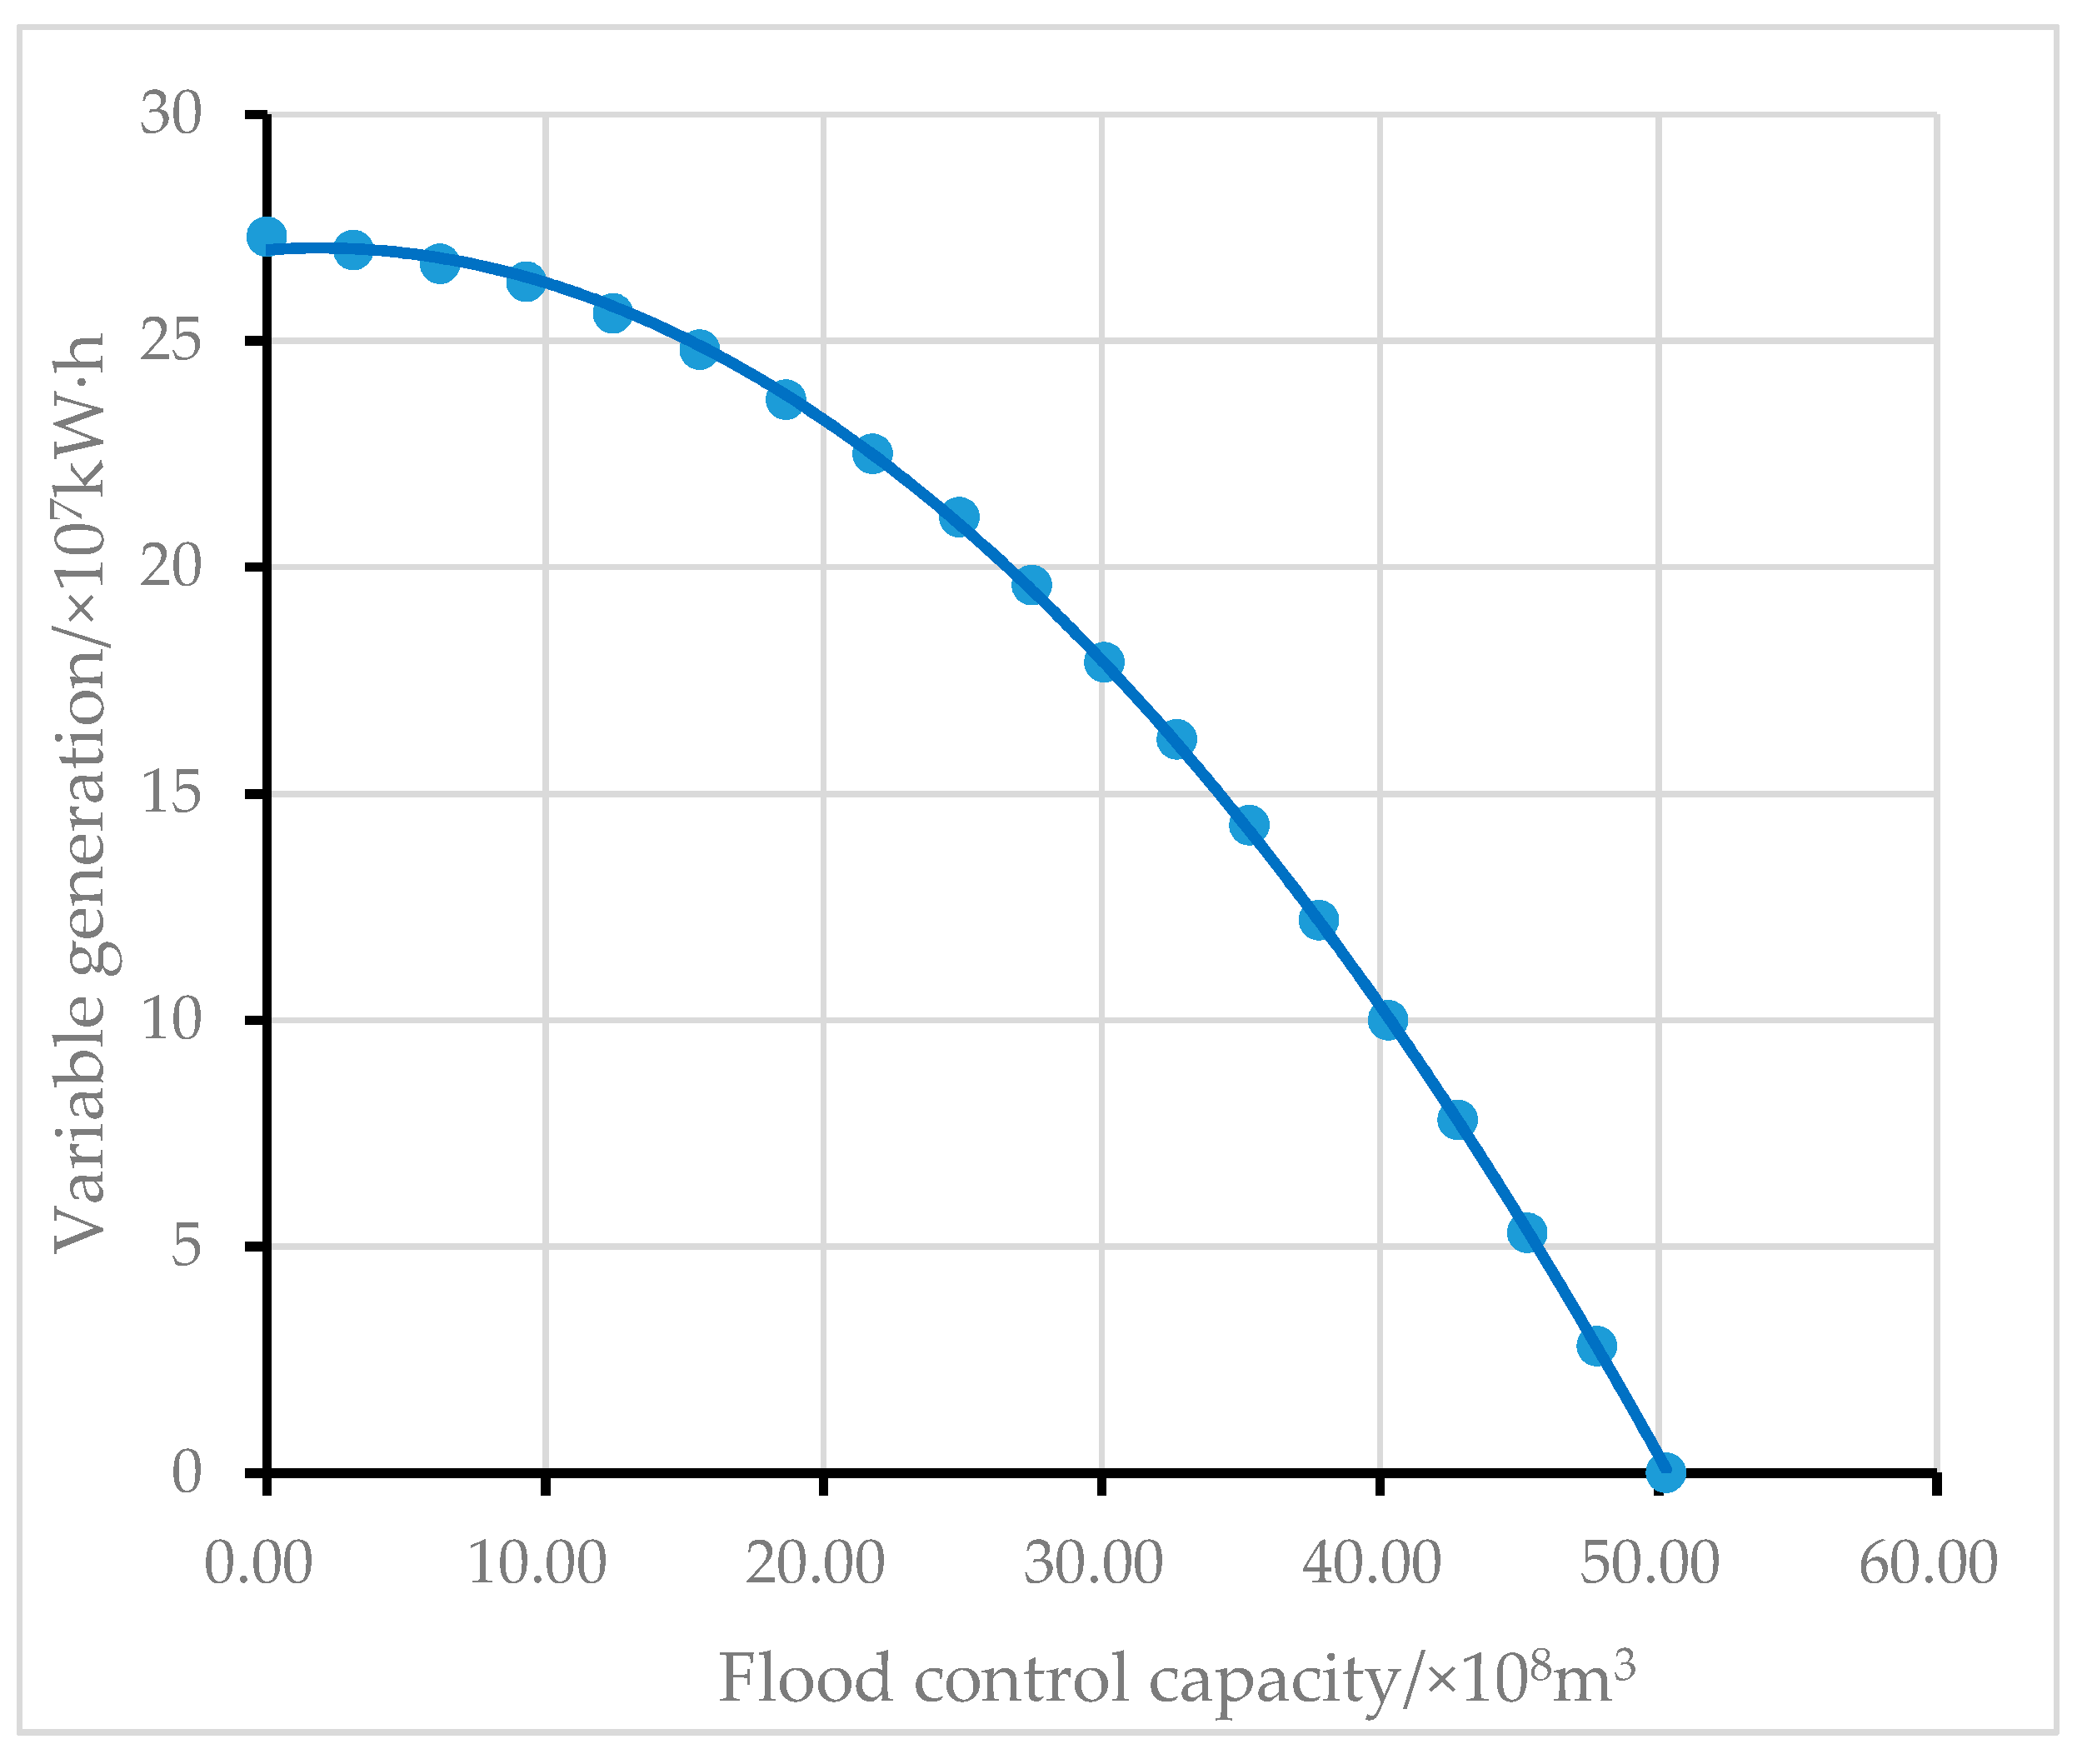
The essence of changing the maximum allowable water level for power generation is to sacrifice part of flood control benefits in exchange for power generation benefits. However, as the maximum allowable water level for power generation keeps rising, the sacrifice of flood control benefits cannot bring proportional power generation benefits, which is unacceptable for decision makers. To further quantitatively analyze their relationship, the MRT method is used to find their best equilibrium point. Taking the flood control storage capacity as the independent variable and the variable power generation as the dependent variable, the equivalent utility curve is drawn, as shown in Figure 7.
The polynomial function is used to fit the benefit conversion curve in Figure 7. The fitting function is a quadratic function, with a high fitting degree of 99.99%. Through the derivation of the fitting function, we can get that the MRT of the curve changes from left to right in the range of 0.0964 to 1.1214, increasing by 1.0250, which conforms to the law of progressively increasing MRT.
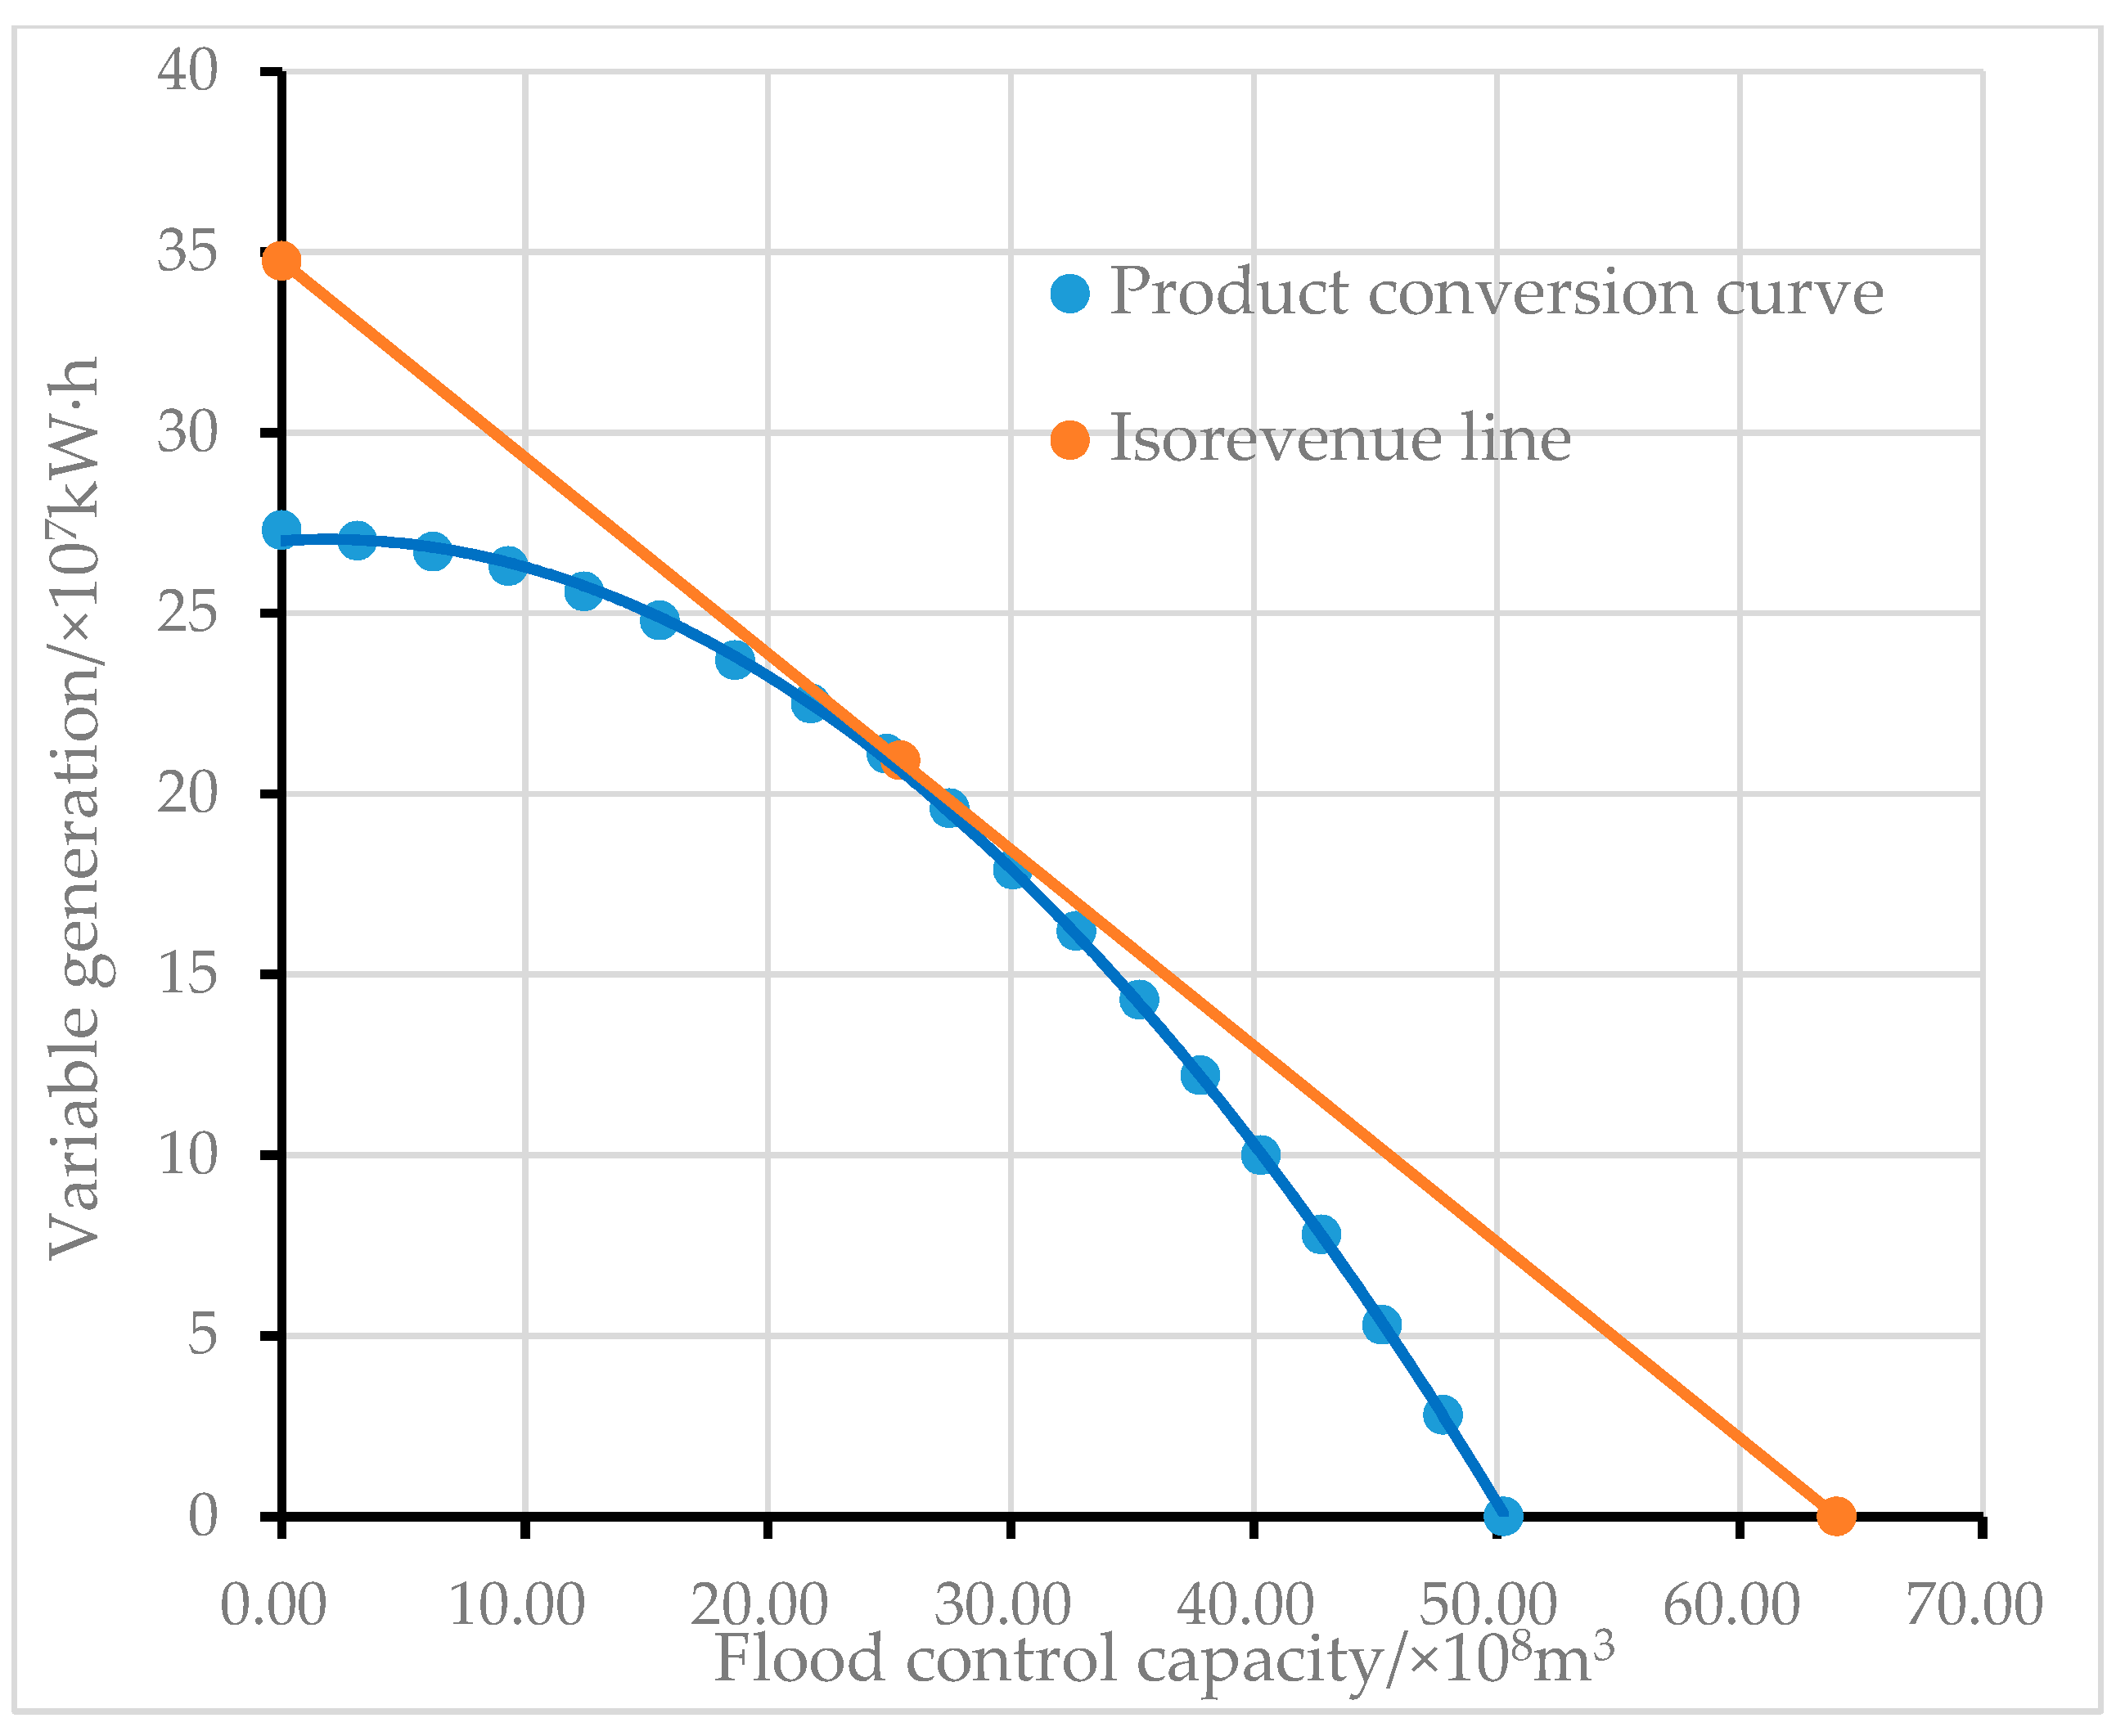
Figure 8 shows the optimal output of flood control and power generation with the measured runoff. The tangent point of the isorevenue line and the product conversion curve is the best equilibrium point of the multi-objective operation schemes. When the derivative of the fitting function (denoted as y′) is equal to the gradient of the isorevenue line, the variable power generation at the best equilibrium point can be obtained, after which the corresponding flood control storage capacity and maximum allowable water level for power generation can be determined. At the best equilibrium point, the variable power generation is 20.92 × 10⁷ kW·h, the flood control storage capacity is 25.46 × 10⁸ m3, and the maximum allowable water level for power generation is 149.88 m (4.88 m higher than the flood control limited water level of 145 m). The total power generation is increased by 20.92 × 10⁷ kW·h (4.48% relatively), which demonstrates that the elevation of the maximum allowable water level for power generation increases the water head and also the water amount for power generation, thus improving power generation benefits.
3.2. Analysis of the Relationship between Flood Control and Power Generation Benefits under the Condition of Uncertain Inflow
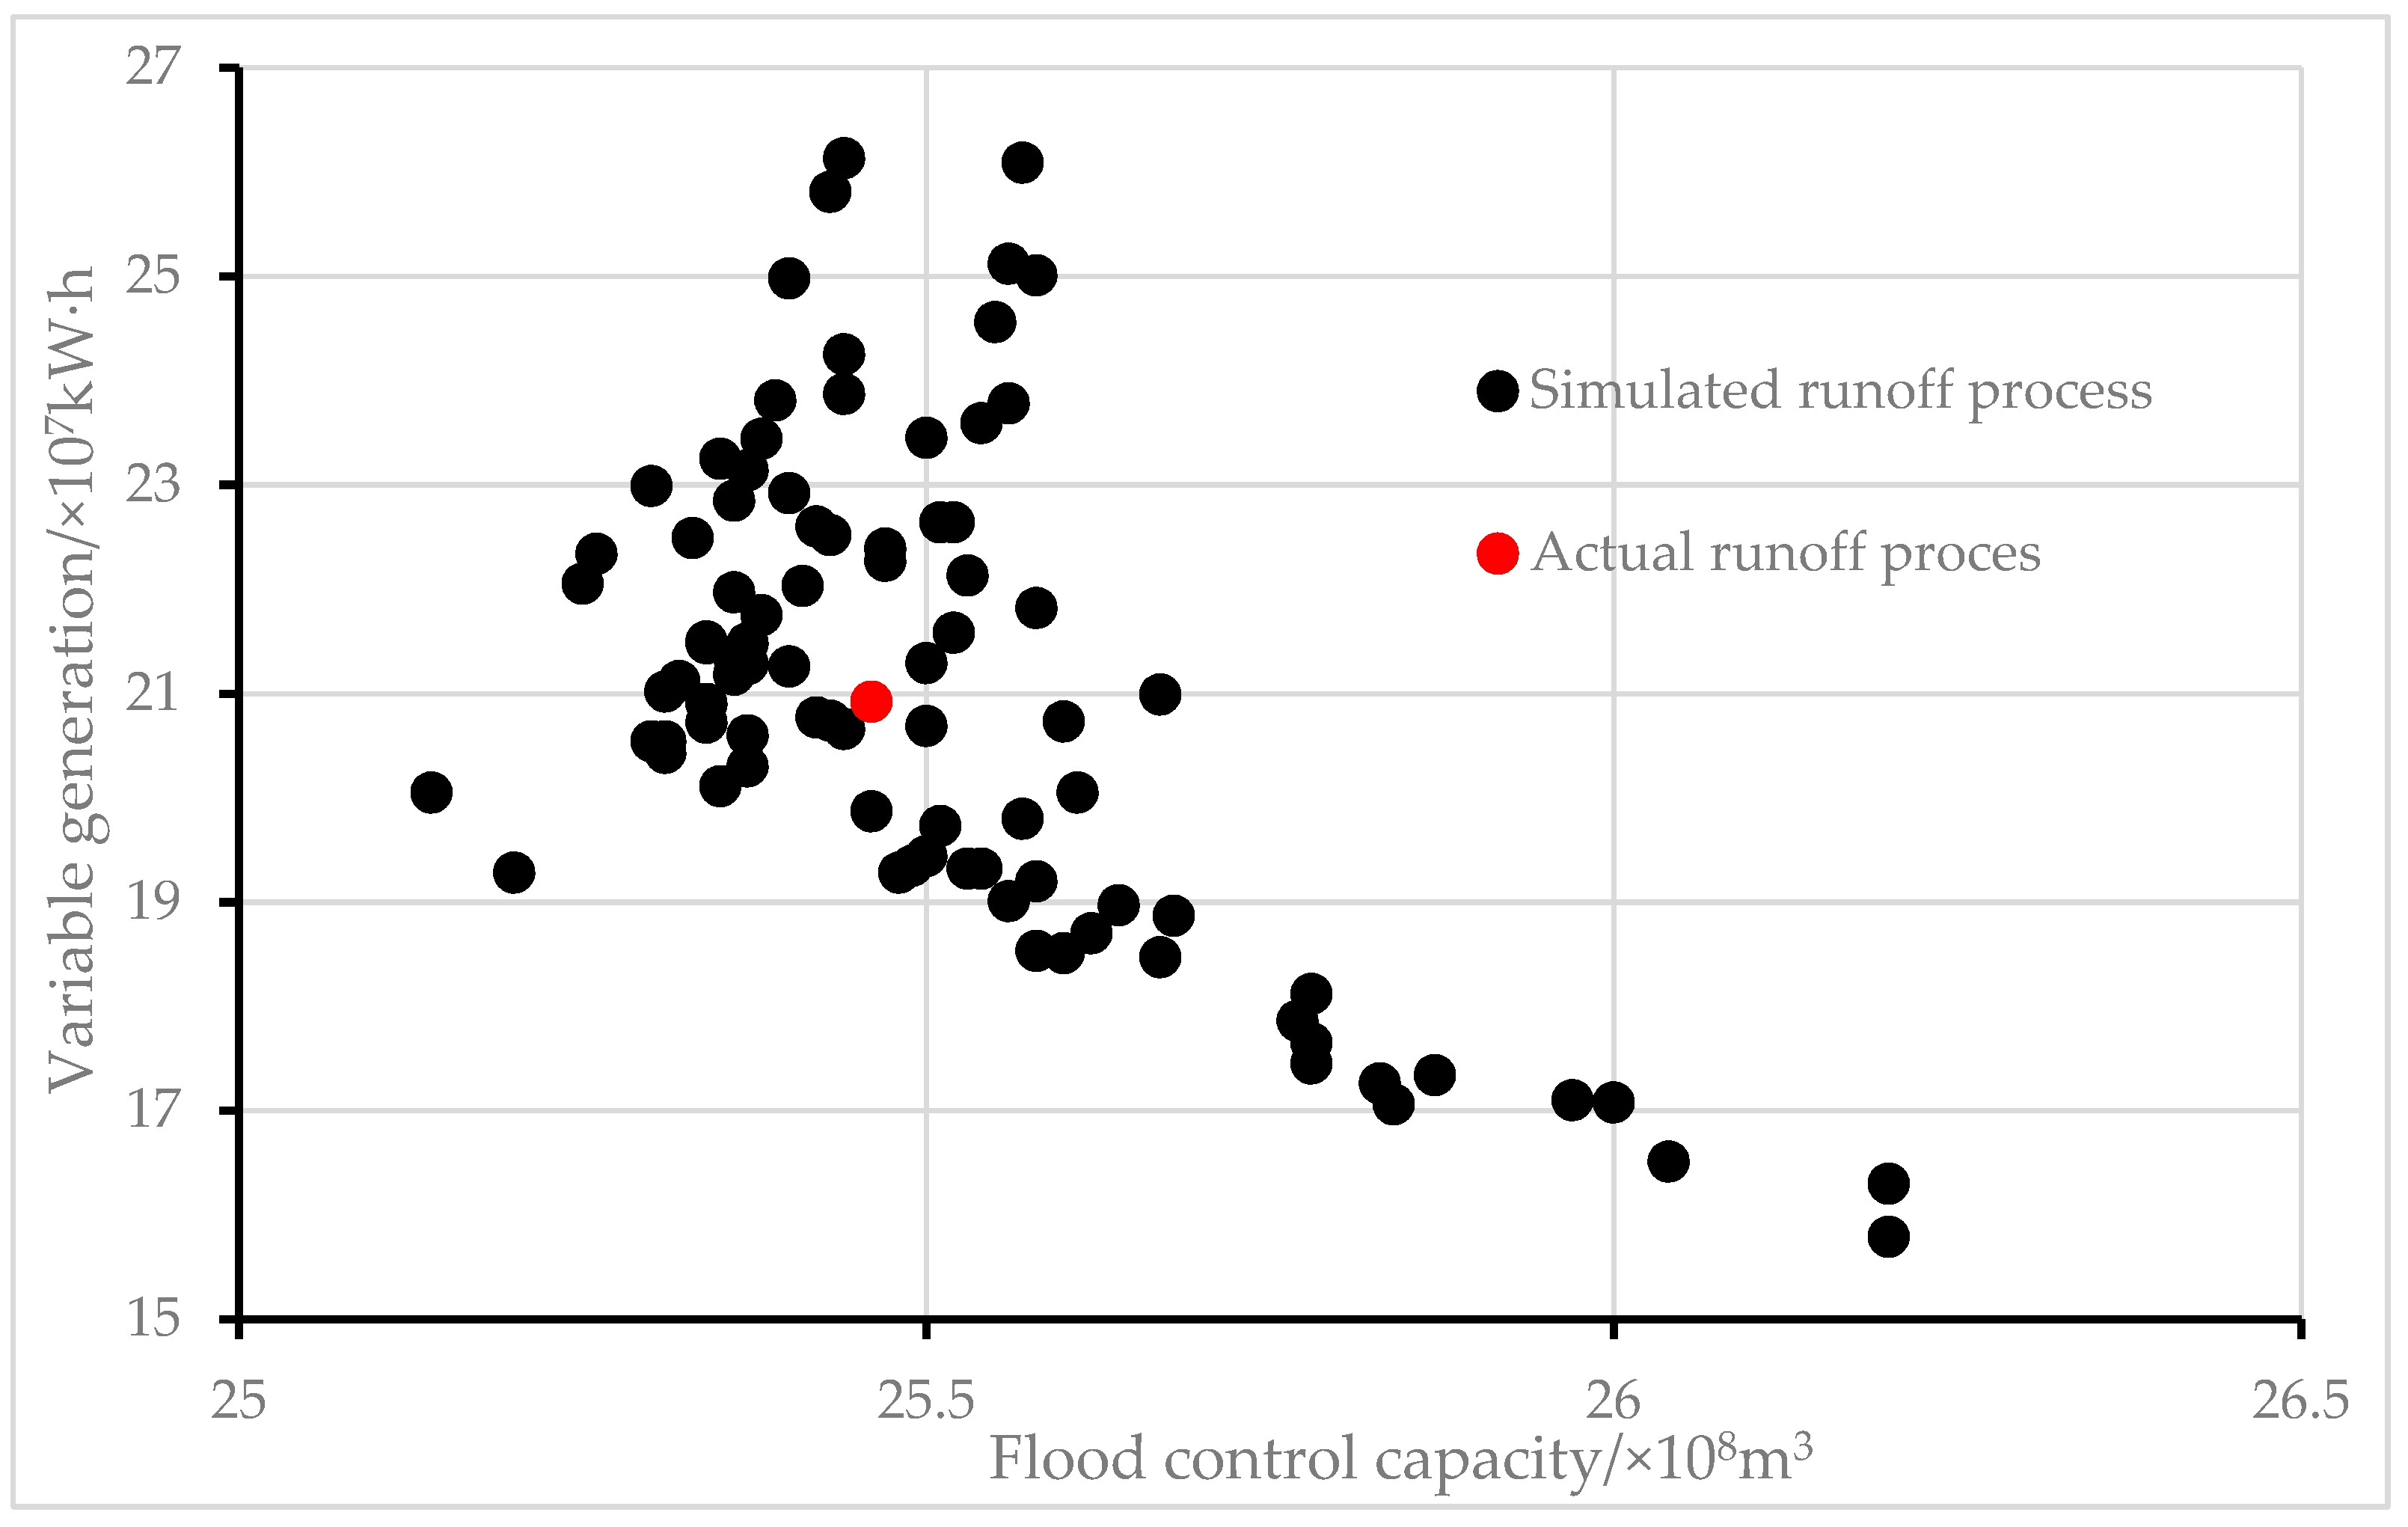
In order to analyze how to optimize the multi-objective reservoir operation decision with runoff forecast error, this study carries out the optimal operation calculation on the measured runoff data in 2006 and 90 simulated runoff processes with forecast error. The MRT method is used for the multi-objective decision making to obtain the best equilibrium point of each runoff process, as shown in Figure 9. For the actual runoff process, the maximum allowable water level for power generation at the best equilibrium point is 149.88 m, the variable power generation is 20.92 × 10⁷ kW·h, and the flood control storage capacity is 25.46 × 10⁸ m3. For the simulated runoff process, the best equilibrium point is near that of the actual runoff, which means that the simulation accuracy is high and the proposed method can guide the decision making of multi-objective optimal operation scheme under runoff uncertainty.
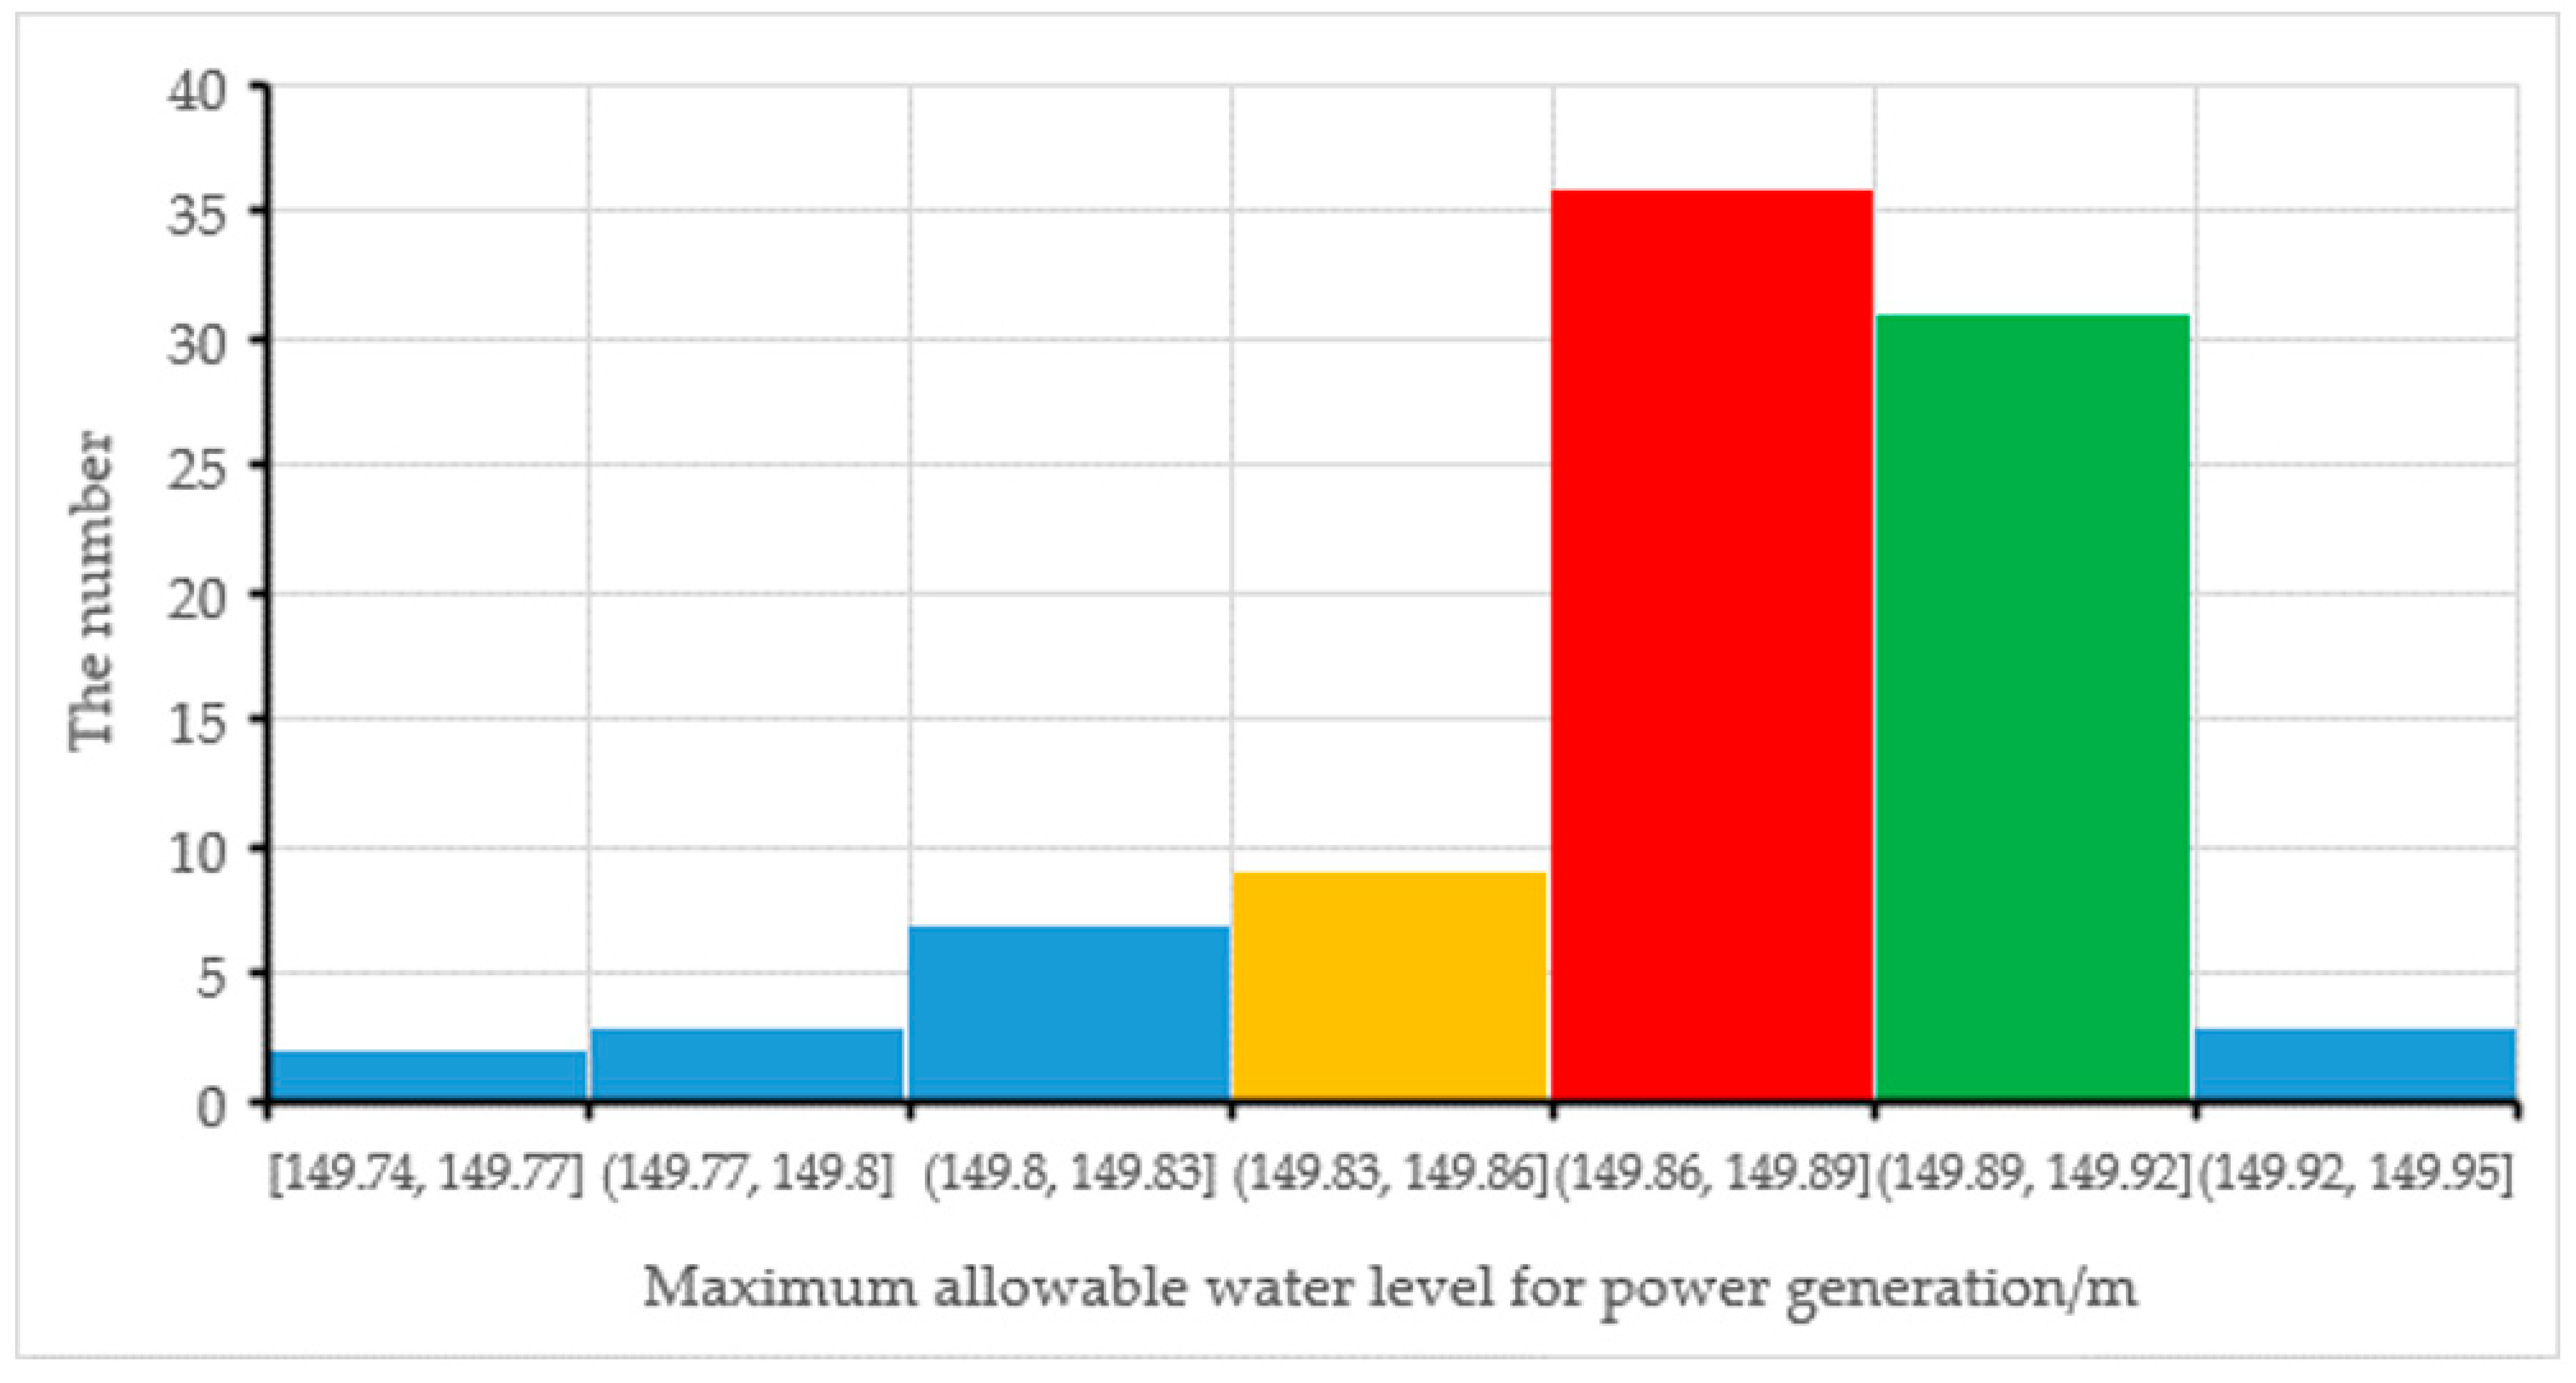
To present the maximum allowable water level for power generation range with uncertain inflow, the maximum allowable water level for power generation at the best equilibrium point of each runoff series is plotted on a graph, as shown in Figure 10. It is illustrated that there is little difference between the simulated runoff series and the measured runoff in the maximum allowable water level for power generation, which are both around 149.88 m. The percentage of 149.86–149.89 m, 149.89–149.92 m, 149.80–149.83 m, and 149.00–149.92 m is 38.89%, 34.44%, 18%, and 91.33%, respectively. Accordingly, the range of 149.00–149.92 m can be selected as the optimal area of maximum allowable water level for power generation in the early flood season of the dry year.
4. Discussion
(1) Based on the analysis of the runoff data, it is found that the runoff is not very large at the beginning of the flood season. If we stick to the flood control limited water level for power generation, part of the water will be wasted. So, we can make full use of this part of water by raising the maximum allowable water level for power generation to increase power generation benefits. On the basis of ensuring the flood control safety, the optimal maximum allowable water level for power generation is 149.88 m, which can produce the greatest combined benefits (a considerable increase of 20.90 × 10⁷ kW·h in power generation compared with the maximum water level of 145 m). Currently, the runoff forecast technology is relatively mature, a flood can be predicted based on the analysis of forecast runoff and forecast error, so that the operating water level in flood season can be flexibly controlled and the utilization rate of flood resources can be improved.
(2) For the 90 simulated runoff processes, the range of variable power generation at the best equilibrium point is 26.13 × 10⁷–15.79 × 10⁷ kW·h, whose expected value is 20.95 × 10⁷ kW·h and is 0.03 × 10⁷ kW·h different from that of the actual runoff process. The variable power generation of the simulated runoff is basically consistent with the actual runoff. The maximum allowable water level for power generation ranges from 149.74 to 149.95 m, whose expected value is 149.88 m, which is consistent with that of the actual runoff. The calculation of the expected maximum allowable water level for power generation of the best equilibrium solution set from simulated runoff can guide the actual reservoir operation.
(3) At the left end of the conversion curve of power generation and flood control (Figure 7), the maximum allowable water level for power generation is quite different from the flood limited water level. Since the inflow is large in flood season, the objective of power generation is gradually saturated, and the increase of storage capacity cannot bring more power generation benefits. Instead, the large occupation of flood control storage capacity dwindles the flood control benefits. At the right end of the Figure 7, the maximum allowable water level for power generation is close to the flood limited water level, where raising the maximum water level will significantly increase water head and thus power generation benefits. In addition, the occupation of flood control storage capacity is less, so the conversion efficiency between flood control and power generation is relatively high. This index is very important for decision making. It represents the conversion efficiency between the two objectives. High efficiency means that taking part of the risk will bring the same or even more benefits, while low efficiency means that the benefits and sacrifices are not proportional, and in other words, the risk increases.
5. Conclusions
Based on the MRT method, this paper analyzes the mutual feedback relationship between flood control and power generation benefits in the dry year under deterministic and uncertain inflow conditions. The conclusions are as follows.
(1) The calculation principle of the MRT method is relatively simple. For the complex multi-objective reservoir optimal operation decision-making problem, it is more convenient and practical to use, and the result is less affected by subjective factors.
(2) In the dry year with small inflow, changing the maximum allowable water level for power generation in the flood season will have a certain impact on flood control and power generation benefits. However, if we choose a good scheme, we can get the maximum comprehensive benefits.
(3) Based on the simulation of runoff forecast error in the dry year, the mutual feedback relationship between flood control and power generation benefits with the forecast runoff series is analyzed, and the optimal maximum allowable water level for power generation area is obtained, which can be used to guide the actual operation and achieve the best expected combined benefits of flood control and power generation.
(4) Most of the commonly used multi-objective evaluation methods are greatly influenced by subjective factors, which affect the rationality of the results. The MRT method uses the principle of equivalent utility to find the best equilibrium point of the two objectives, so as to maximize their comprehensive utility. This method is practical and straightforward, and it avoids the influence of subjective factors. However, how to deal with the substitution relationship among three or more objectives by the MRT method needs to be further studied in the future work.
Author Contributions
Conceptualization, Y.W. and L.W.; methodology, Y.W. and Y.Z.; software, J.W.; validation, Y.W., Y.Z. and L.W.; formal analysis, Y.W.; investigation, Y.W. and L.Y.; data curation, Y.W. and J.W.; writing—original draft preparation, Y.W.; writing—review and editing, Y.W. and Q.M.; visualization, Y.W.; supervision, L.W. and Y.Z; funding acquisition, Y.Z. and Q.M. All authors have read and agreed to the published version of the manuscript.
Funding
This study was funded by the National Natural Science Foundation of China (Grant number: 51709105), Fundamental Research Funds for the Central Universities (Grant number: 2020MS026), and China Postdoctoral Science Foundation (Grant number: 2020M680487).
Institutional Review Board Statement
Not applicable.
Informed Consent Statement
Not applicable.
Data Availability Statement
Not applicable.
Conflicts of Interest
The authors declare no conflict of interest.
References
- Huang, C.; Wang, Z.J.; Li, S.F.; Chen, S.L. A multi-reservoir operation optimization model and application in the upper Yangtze River Basin Ⅰ. Principle and solution of the model. J. Hydraul. Eng. 2014, 9, 1009–1018. [Google Scholar]
- Wang, L.P.; Yan, X.R.; Mao, H.Y.; Li, N.N.; Yu, H.J.; Ji, C.M. Study on multi-objective mutual feedback relationships of reservoirs based on structural equation modeling. J. Hydroelectr. Eng. 2019, 10, 47–58. [Google Scholar]
- Zhang, J.T.; Shen, J.J.; Cheng, C.T.; Niu, W.J. Multi-objective optimal operation of cascade hydropower stations based on objective adjacent scale and marginal analysis principle. Proc. CSEE 2019, 5, 1268–1277. [Google Scholar]
- Ji, C.M.; Li, K.F.; Zhang, Y.K.; Zhao, B.K. Stochastic multi-objective decision-making model of the reservoir operation based on chance-constrained programming. Power Syst. Prot. Control 2012, 19, 36–40. [Google Scholar]
- Cao, R.; Shen, J.J.; Cheng, C.T.; Zhu, J.; Gao, Y. Multi-objective optimal control of cascaded reservoirs during drawdown period before flood season. Proc. CSEE 2019, 12, 3465–3475. [Google Scholar]
- Xu, B.; Zhong, P.A.; Zachary, S.; Zhao, Y.F.; William, W.G.Y. A multiobjective short-term optimal operation model for a cascade system of reservoirs considering the impact on long-term energy production. Water Resour. Res. 2015, 5, 3353–3369. [Google Scholar] [CrossRef]
- Reed, P.M.; Hadka, D.; Herman, J.D.; Kasprzyk, J.R.; Kollat, J.B. Evolutionary multiobjective optimization in water resources: The past, present, and future. Adv. Water Resour. 2013, 51, 438–456. [Google Scholar] [CrossRef] [Green Version]
- Wang, H.; Wang, X.; Lei, X.H.; Liao, W.H.; Wang, C.; Wang, J. The development and prospect of key techniques in the cascade reservoir operation. J. Hydraul. Eng. 2019, 1, 25–37. [Google Scholar]
- Xu, B.; Zhong, P.A.; Chen, Y.T.; Zhao, Y.F. The multi-objective and joint operation of Xiluodu cascade and three gorges cascade reservoirs system. Sci. Sin. Technol. 2017, 8, 823–831. [Google Scholar]
- Zhu, F.L.; Zhong, P.A.; Xu, B.; Liu, W.F.; Wang, W.Z.; Sun, Y.M.; Chen, J.; Li, J.Y. Short-term stochastic optimization of a hydro-wind-photovoltaic hybrid system under multiple uncertainties. Energy Convers. Manag. 2020, 257, 1–14. [Google Scholar] [CrossRef]
- Wang, X.J.; Dong, Z.; Ai, X.S.; Dong, X.; Yi, L. Multi-objective model and decision-making method for coordinating the ecological benefits of the Three Gorger Reservoir. J. Clean. Prod. 2020, 270, 1–14. [Google Scholar] [CrossRef]
- He, Z.Z.; Zhou, J.Z.; Jia, B.J.; Zhang, Y.C. Study on the mutual feedback relation among water supply-power generation-environment of reservoir group in the upper reaches of the Yangtze River based on gradient analysis method. Adv. Water Sci. 2020, 4, 601–610. [Google Scholar]
- Zhang, Y.C.; Bing, F.S.; Xiong, S.Y. Fuzzy Set Theory and its application. Water Resour. Power. 1984, 1, 27–37. [Google Scholar]
- Chen, S.Y.; Qiu, L. Multi objective fuzzy optimization stochastic dynamic programming of water resources system and an example. J. Hydraul. Eng. 1993, 8, 43–48. [Google Scholar]
- Ji, C.M.; Wang, L.; Feng, S.Y. Multi-objective risk analysis in a key water control project management. Model. Meas. Control 1994, 4, 7–56. [Google Scholar]
- Ji, C.M.; Zhang, P.; Su, Y.Y.; Zhang, Y.K.; Peng, Y. Ideal mean rate method and its application to multi-objective reservoir operation decision making. J. Hydroelectr. Eng. 2017, 12, 1–9. [Google Scholar]
- Peng, Y.; Ji, C.M.; Liu, F. Multi-objective optimization model for coordinative dispatch of water and sediment in cascade reservoirs. J. Hydraul. Eng. 2013, 11, 1272–1277. [Google Scholar]
- Chen, G.; Hu, D.W.; Chen, S.; Guo, L.; Liu, M.Z. Optimizing wireless charging locations for battery electric bus transit with a Genetic Algorithm. Sustainability 2020, 21, 8971. [Google Scholar] [CrossRef]
- Gabriel-Martin, I.; Sordo-Ward, A.; Santillán, D.; Garrote, L. Flood control versus water conservation in reservoirs: A new policy to allocate available storage. Water 2020, 12, 994. [Google Scholar] [CrossRef] [Green Version]
- Zhou, Y.L.; Guo, S.L.; Chen, J. Multi-objective decision and joint refill schemes of Xiluodu-Xiangjiaba-Three Gorges cascade reservoirs. J. Hydraul. Eng. 2015, 10, 1135–1144. [Google Scholar]
- Gao, H.Y. Western Economics, 6th ed.; 21 century economics textbook series; China Renmin University Press: Beijing, China, 2014; pp. 109–110. [Google Scholar]
- James, L.D.; Robert, R.L. Economics of Water Resources Planning, 1st ed.; McGraw Hill Text Press: New York, NY, USA, 1971; pp. 91–93. [Google Scholar]
- Ji, C.M.; Liang, X.Q.; Zhang, Y.K.; Liu, Y. Stochastic model of reservoir runoff forecast errors and its application. J. Hydroelectr. Eng. 2019, 8, 27–36. [Google Scholar]
- He, Y. The Analysis on Inflow Runoff Forecast Error and the Application in Reservoirs Short-term Generation Scheduling. Postgraduates. Master’s Thesis, North China Electric Power University, Beijing, China, 2016. [Google Scholar]
Figure 1.
Conversion of storage capacity for flood control and power generation.

Figure 2.
Marginal transformation diagram of flood control and power generation benefits.

Figure 3.
Multi-objective optimal reservoir decision process based on inflow runoff error.

Figure 4.
Location map of Three Gorges Reservoir.

Figure 5.
The flow variation process from 1 June to 30 July.

Figure 6.
The variation in actual reservoir levels and the reservoir-level pattern for MRT optimized operation in 2006 from 11 June to 30 June.
Figure 6.
The variation in actual reservoir levels and the reservoir-level pattern for MRT optimized operation in 2006 from 11 June to 30 June.

Figure 7.
Conversion curve of power generation and flood control.

Figure 8.
Optimal output of flood control and power generation benefits with deterministic inflow runoff.
Figure 8.
Optimal output of flood control and power generation benefits with deterministic inflow runoff.

Figure 9.
Best equilibrium points of the actual and the simulated runoff processes.

Figure 10.
Statistical chart of the maximum allowable water level for power generation at the best equilibrium point.
Figure 10.
Statistical chart of the maximum allowable water level for power generation at the best equilibrium point.


Table 1.
Main parameters of Three Gorges Reservoir.
| Reservoir Name | Output Coefficient | Installed Capacity ×104 kW | Minimum Output ×104 kW | Normal Water Level m | Design Flood Level m | Flood Limit Water Level m |
|---|---|---|---|---|---|---|
| Three Gorges | 8.5 | 2250 | 180 | 175 | 175 | 145 |
Table 2.
Multi-objective optimal operation results of different schemes.
| Operation Scheme | Maximum Allowable Water Level for Power Generation m | Power Generation ×108 kW·h | Variable Power Generation ×108 kW·h | Relative Flood Control Guarantee Rate% | Flood Control Storage Capacity ×108 m3 | Relative Flood Control Storage Capacity ×108 m3 |
|---|---|---|---|---|---|---|
| 1 | 145.00 | 46.58 | 0 | 100.00% | 221.50 | 50.28 |
| 2 | 145.50 | 46.86 | 0.28 | 98.33% | 219.00 | 47.78 |
| 3 | 146.00 | 47.11 | 0.53 | 96.67% | 216.51 | 45.29 |
| 4 | 146.50 | 47.36 | 0.78 | 95.00% | 214.01 | 42.79 |
| 5 | 147.00 | 47.58 | 1 | 93.33% | 211.51 | 40.29 |
| 6 | 147.50 | 47.8 | 1.22 | 91.67% | 209.02 | 37.80 |
| 7 | 148.00 | 48.01 | 1.43 | 90.00% | 206.52 | 35.30 |
| 8 | 148.50 | 48.2 | 1.62 | 88.33% | 203.92 | 32.70 |
| 9 | 149.00 | 48.37 | 1.79 | 86.67% | 201.31 | 30.09 |
| 10 | 149.50 | 48.54 | 1.96 | 85.00% | 198.71 | 27.49 |
| 11 | 150.00 | 48.69 | 2.11 | 83.33% | 196.10 | 24.88 |
| 12 | 150.50 | 48.83 | 2.25 | 81.67% | 192.99 | 21.77 |
| 13 | 151.00 | 48.95 | 2.37 | 80.00% | 189.88 | 18.66 |
| 14 | 151.50 | 49.06 | 2.48 | 78.33% | 186.77 | 15.55 |
| 15 | 152.00 | 49.14 | 2.56 | 76.67% | 183.66 | 12.44 |
| 16 | 152.50 | 49.21 | 2.63 | 75.00% | 180.55 | 9.33 |
| 17 | 153.00 | 49.25 | 2.67 | 73.33% | 177.44 | 6.22 |
| 18 | 153.50 | 49.28 | 2.7 | 71.67% | 174.33 | 3.11 |
| 19 | 154.00 | 49.31 | 2.73 | 70.00% | 171.22 | 0.00 |
Publisher’s Note: MDPI stays neutral with regard to jurisdictional claims in published maps and institutional affiliations. |
© 2021 by the authors. Licensee MDPI, Basel, Switzerland. This article is an open access article distributed under the terms and conditions of the Creative Commons Attribution (CC BY) license (http://creativecommons.org/licenses/by/4.0/).
Share and Cite
MDPI and ACS Style
Wu, Y.; Wang, L.; Zhang, Y.; Wu, J.; Ma, Q.; Yue, L. Application of Marginal Rate of Transformation in Decision Making of Multi-Objective Reservoir Optimal Operation Scheme. Sustainability 2021, 13, 1488. https://doi.org/10.3390/su13031488
AMA Style
Wu Y, Wang L, Zhang Y, Wu J, Ma Q, Yue L. Application of Marginal Rate of Transformation in Decision Making of Multi-Objective Reservoir Optimal Operation Scheme. Sustainability. 2021; 13(3):1488. https://doi.org/10.3390/su13031488
Chicago/Turabian StyleWu, Yueqiu, Liping Wang, Yanke Zhang, Jiajie Wu, Qiumei Ma, and Lisha Yue. 2021. "Application of Marginal Rate of Transformation in Decision Making of Multi-Objective Reservoir Optimal Operation Scheme" Sustainability 13, no. 3: 1488. https://doi.org/10.3390/su13031488
Note that from the first issue of 2016, this journal uses article numbers instead of page numbers. See further details here.