Article

Key Ratios for Long-Term Prediction of Hotel Financial Distress and Corporate Default: Survival Analysis for an Economic Stagnation

by
Antonio Pelaez-Verdet
* and
Pilar Loscertales-Sanchez
Department of Business and Economics, University of Málaga, 29016 Málaga, Spain
*
Author to whom correspondence should be addressed.
Sustainability 2021, 13(3), 1473; https://doi.org/10.3390/su13031473
Submission received: 31 December 2020 / Revised: 24 January 2021 / Accepted: 28 January 2021 / Published: 31 January 2021

Abstract

:
Hospitality companies often face economic crises, which stress their financial structure. In 2008, Spanish hotels were jeopardized when the travelers’ flows became stagnated, in either domestic and foreign markets. Most of them overcame the crisis, but not all, in part depending on their capital structure at the moment the downturn loomed upon them. This study analyzes the financial ratios registered in 2008 by 3.341 Spanish lodging enterprises, to find out the most relevant ratios that were associated with an eventual breakdown. The analyzed ratios have been largely suggested by previous literature for anticipating financial distress; however, using survival tables and Kaplan–Meier estimates we could also find new insights about several promising variates for future research. In the end, by performing a Cox regression, we could isolate the return on capital employed (ROCE) ratio as a long-term predictor for small hotels’ bankruptcy after a market downturn. Moreover, the legal status seems to be a key predictor concerning medium-sized hotels.

1. Introduction

The corporate financial soundness can be analyzed using financial ratios, in a rather similar way than a person’s health using a blood analysis. Financial ratios are proportions of relative magnitudes that use two or more figures taken from financial statements. When compared to a given standard, the observer can tell whether the company is more likely to experience some event (provided everything remains constant). A good set of ratios, carefully chosen and properly analyzed, can even give an expert an accurate idea of how much time could the firm live before entering a financial distress period and, eventually, go bankrupt. The interest from both industry and scholars on this topic gained intensity after several rather expensive corporate failures from 2000 onward.
This topic has been largely addressed by the scholar community, addressing it using different models and techniques, from traditional techniques, such as discriminant or logit analysis, to modern deep-learning schemes. The debate has substantially been focused on the following three questions: (1) what is the optimal ratio set for a given industry? (2) for how long can a given model be considered accurate and reliable prior to a bankruptcy event? and (3) how can the problems associated with unbalanced datasets, lack of variates’ normality, or large amounts of financial data disconnected from their—perhaps relevant—market information? The models proposed so far featured quite different approaches, trying to address some of the constraints detected prior to each one in this field. Thus, since the first logit or regressive models were presented, more techniques that are progressively more powerful have been incorporated, such as neural networks or business intelligence algorithms. However, parametric multivariate approaches have repeatedly faced two problems—first, the fact that a given set of financial information accomplishes the normality condition and, second, the datasets are often plenty of information about alive firms but lack the essential data about enterprises who yet expired. This problem is even more critical when the information is taken in a relative timeline, totally disconnected from the events that possibly affected the historical records for any firm in the dataset. As a result, the models yet known are good classifying firms that most likely will go bankrupt in the medium term, a maximum of four years.
In this study, we try to address several of those issues and verify the usefulness of the ratio approach proposing a method to identify particular information associated with a future long-term bankruptcy event, depending on the size of the company. For this purpose, we addressed the aforementioned issues in several ways. First, we focused on the particular industry of hotels, based on the pursue of an adapted model specific for them. The reason for that is working under the assumption that not all the financial ratios need to be entirely relevant for any industry when it comes to bankruptcy prediction. Second, as a way of overcoming the time boundaries that come from the traditional time-relative approach (prediction reliable no more than two or three years before the failure event), we decided to anchor our analysis in a specific year to test the evolution of the firms from that moment on, using a looking-forward approach. The chosen year was 2008, particularly challenging for every hotel in Spain (see Figure 1).
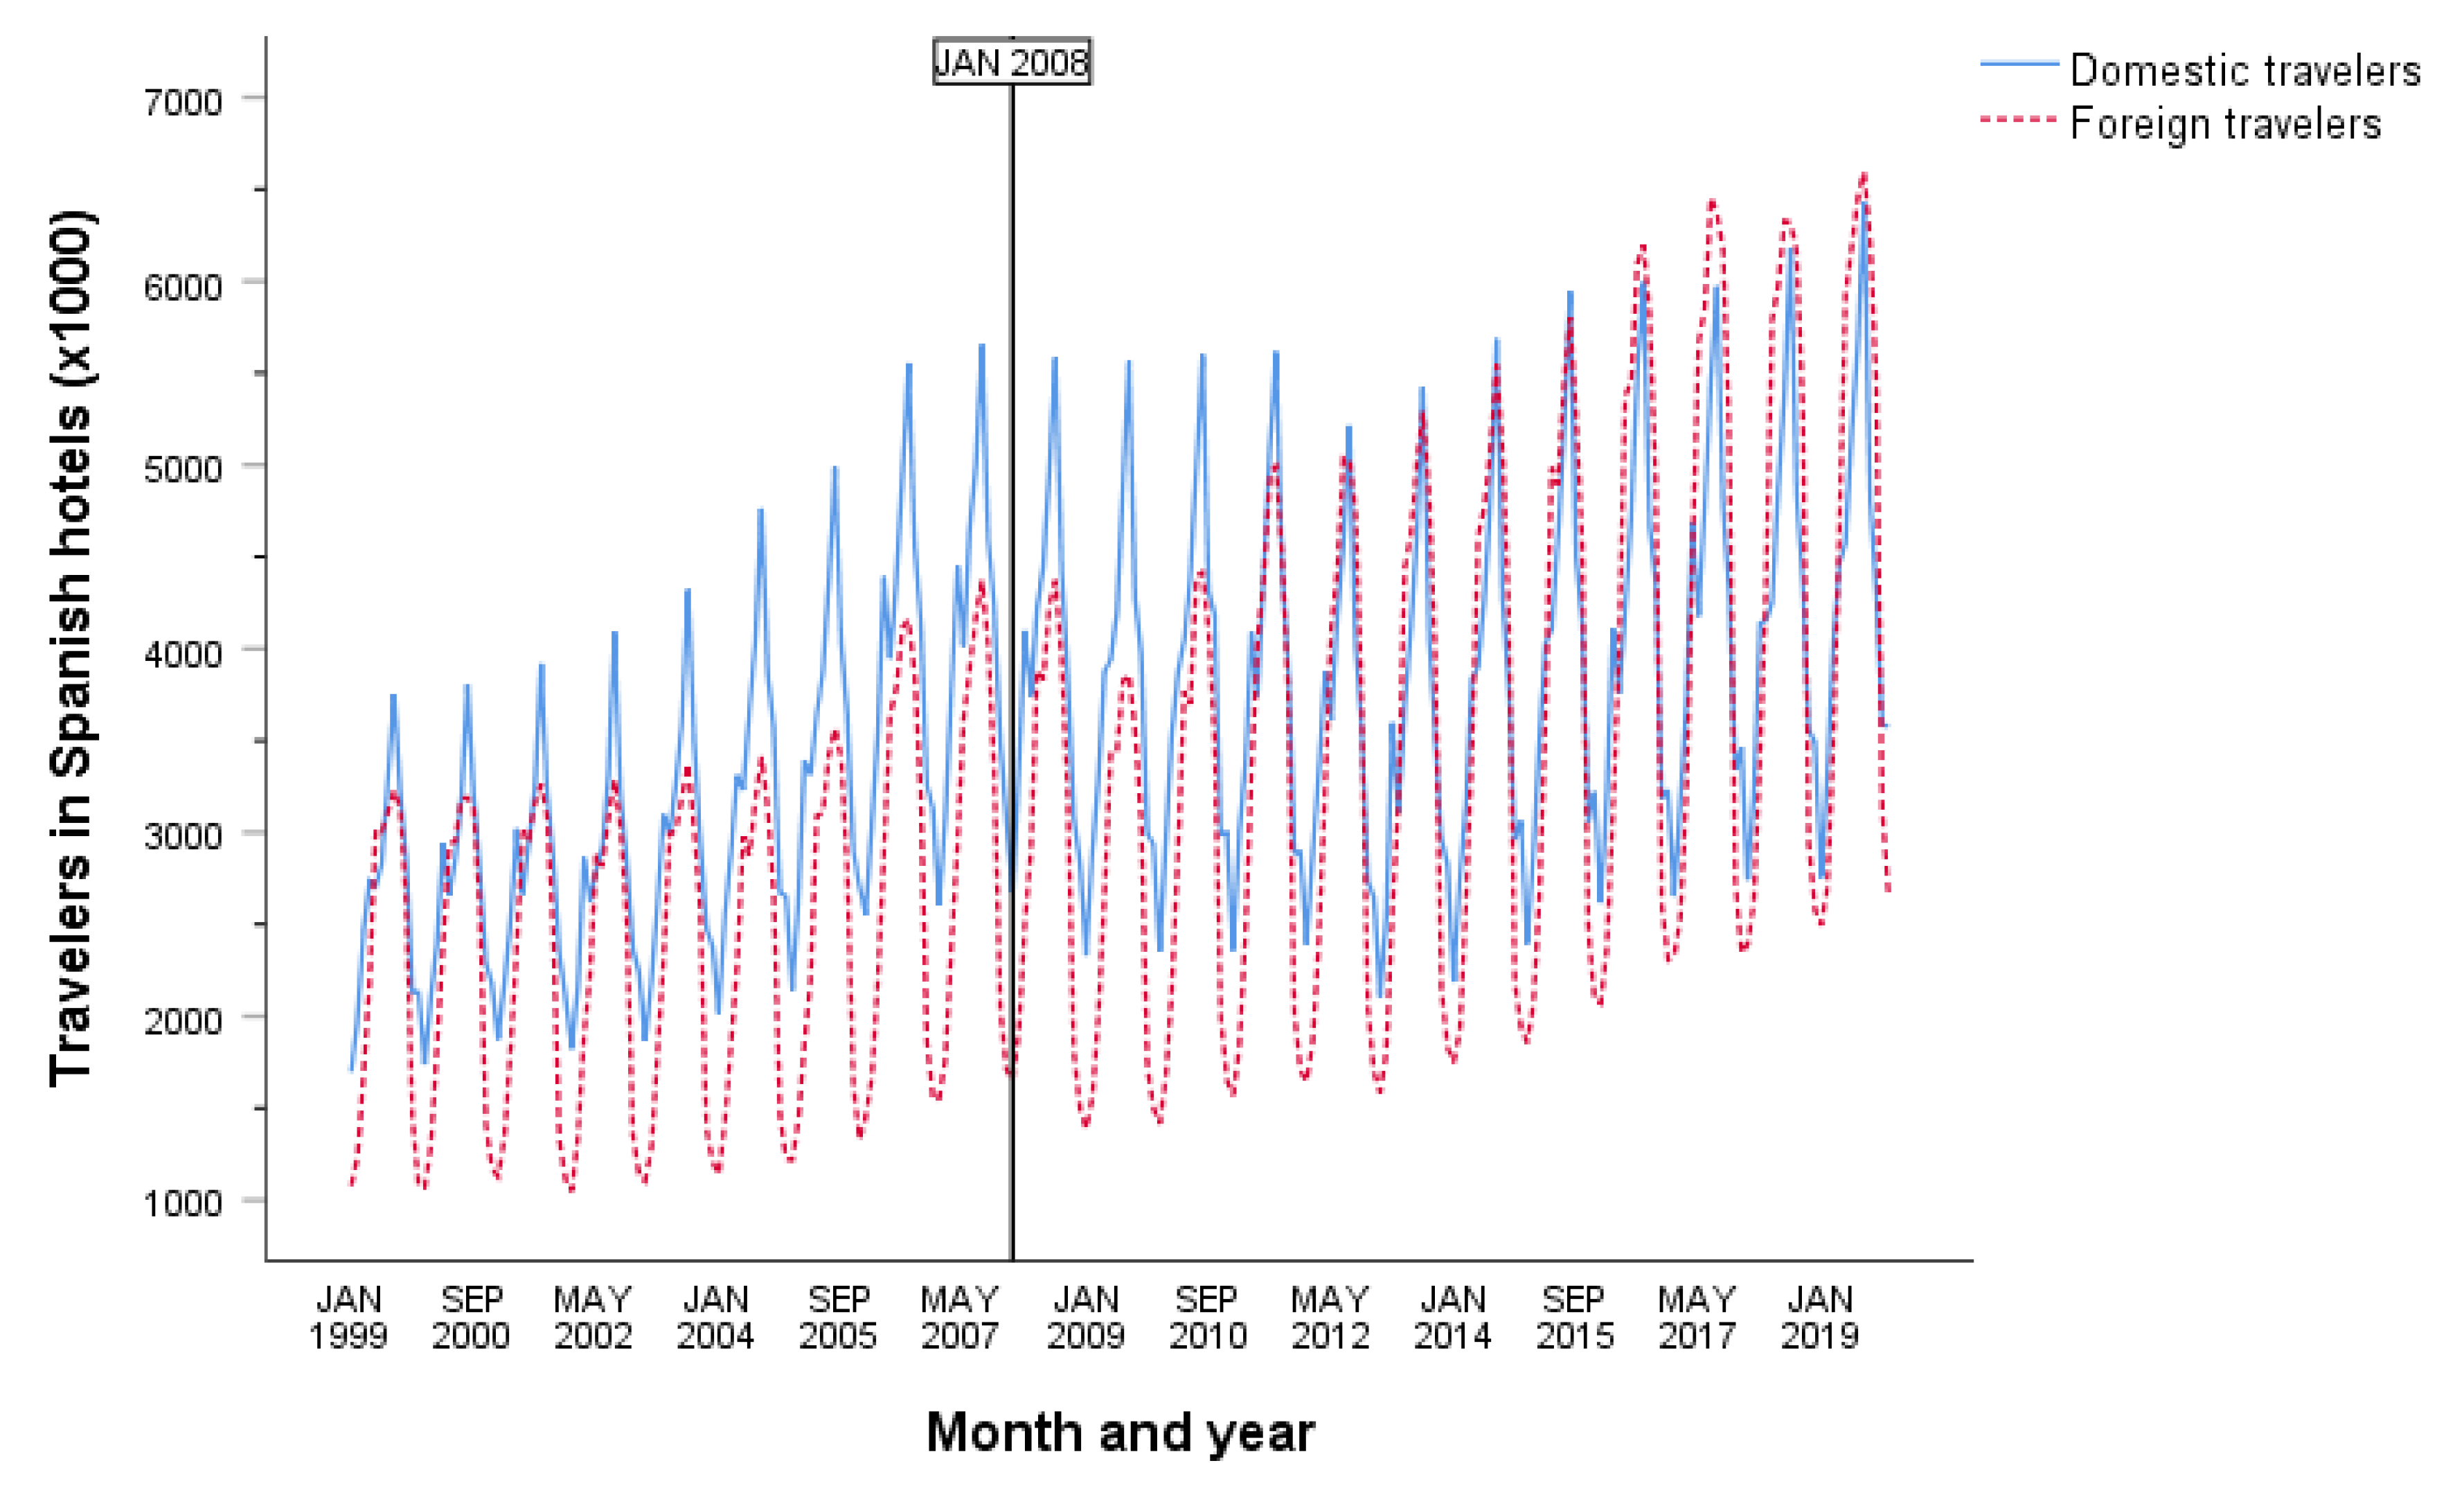
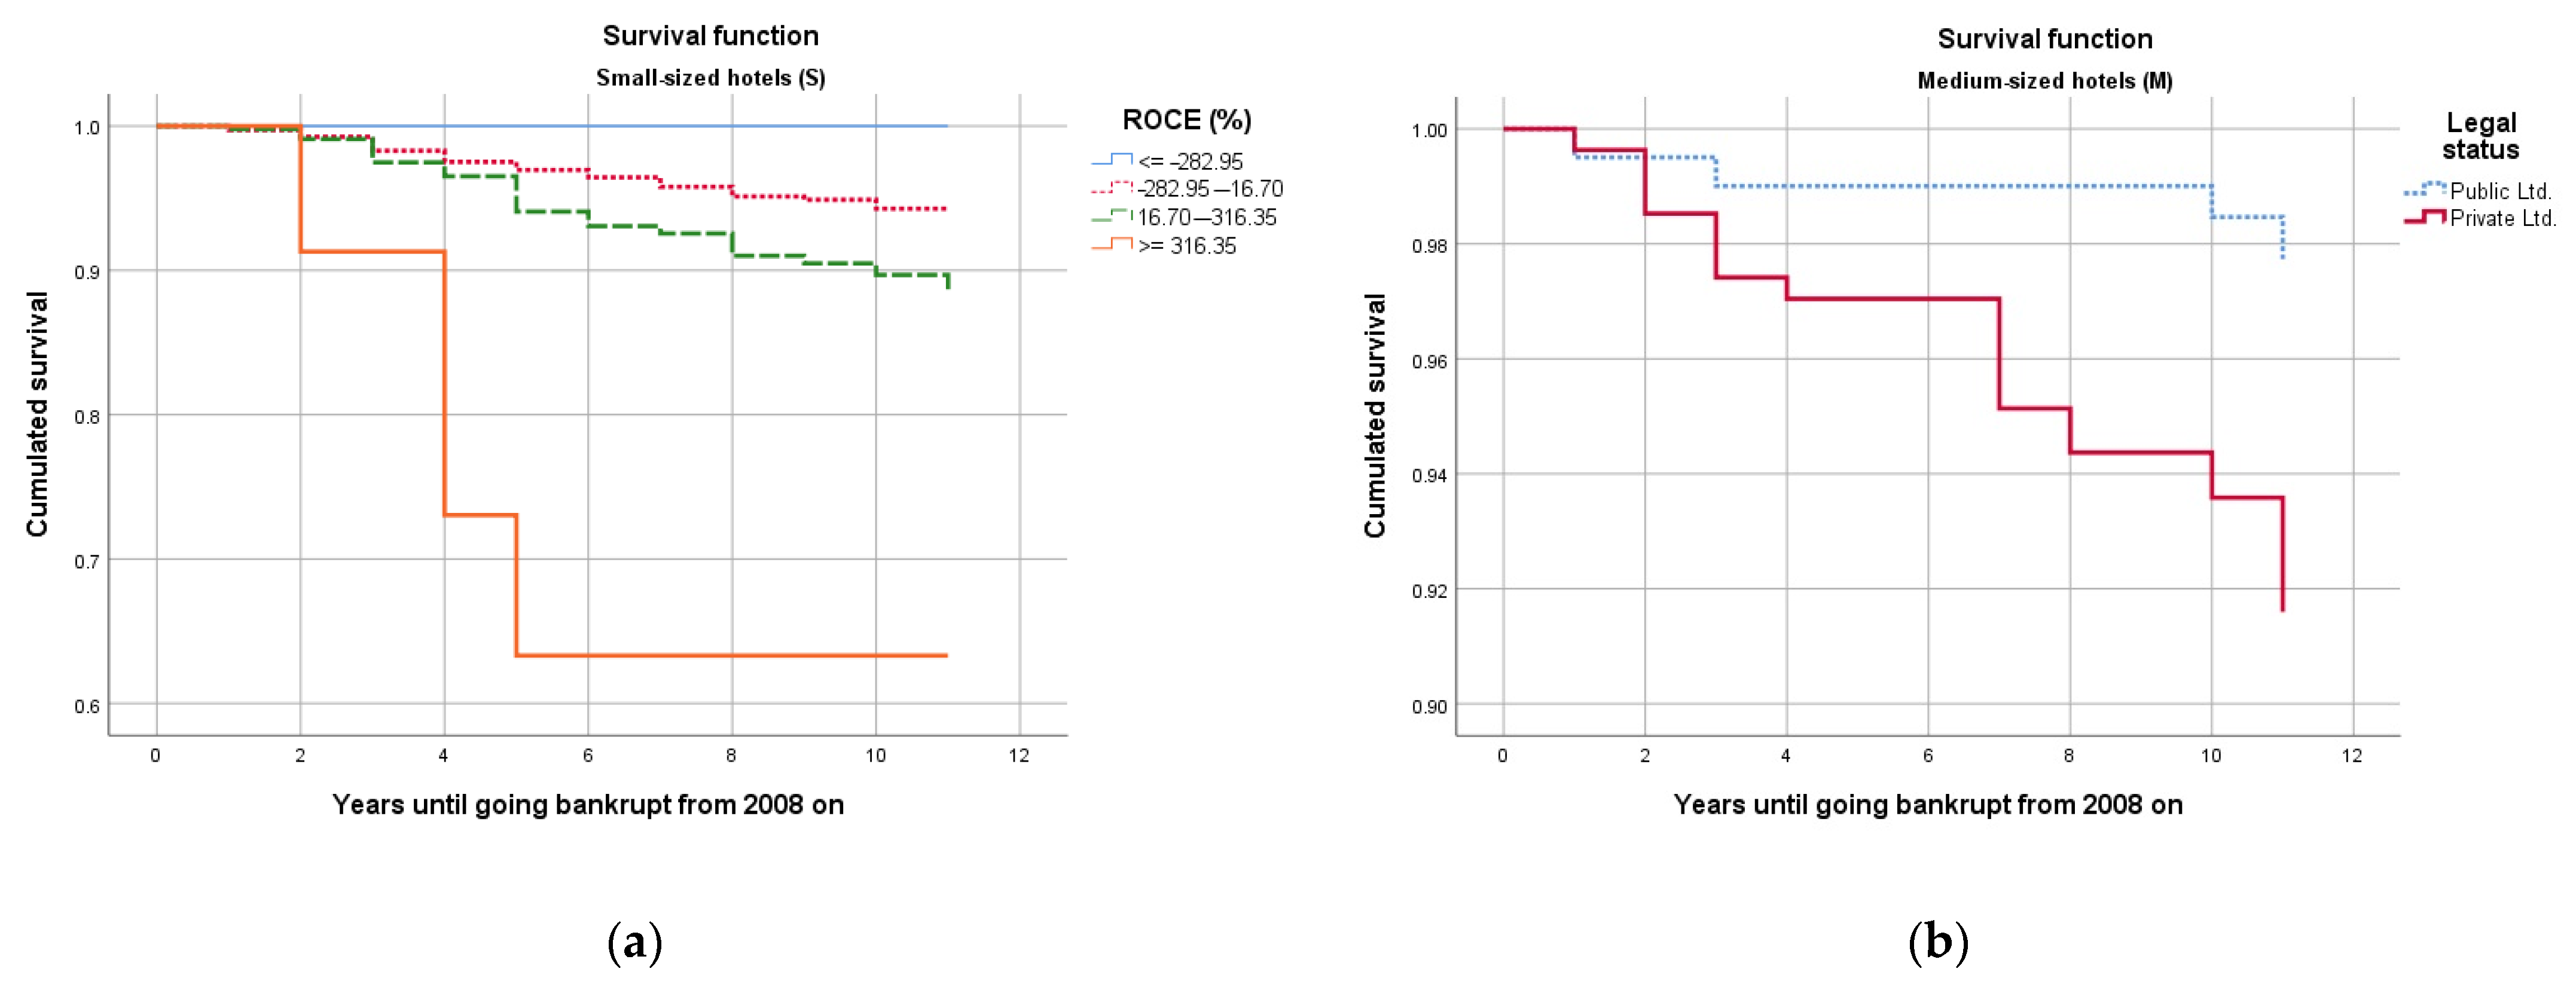
Furthermore, because 2008 was the year when an unprecedented economic stagnation began for the whole tourism industry in Spain, we considered it a relevant starting point to go forward in time, analyzing the ratios of the companies at that point in 2008 and stating if it had a significant influence on whether the hotel had survived the crisis.
We also focused on a particular set of nine ratios, well known and widely used in the most common models of bankruptcy forecasting. Those were organized around two dimensions commonly accepted as strongly involved in financial distress—firm profitability and financial structure. Those variables were discretized (see Section 2.1) for addressing the traditional problem of normality, given the fact that the non-parametrical method chosen (survival analysis) does not require a specific distribution for the continuous metric variables.
Consequently, as we were speculating with the theory of a long-term effect of any of the ratios in the survival function of the firms when a crisis arises, we stipulated our hypotheses in the following way:
Hypothesis 1 (H1).
The return on shareholders’ funds is positively associated with the survival function.
Hypothesis 2 (H2).
The return on capital employed is positively associated with the survival function.
Hypothesis 3 (H3).
The return on total assets is positively associated with the survival function.
Hypothesis 4 (H4).
The profit margin is positively associated with the survival function.
Hypothesis 5 (H5).
The solvency ratio is positively associated with the survival function.
Hypothesis 6 (H6).
The liquidity ratio is positively associated with the survival function.
Hypothesis 7 (H7).
The financial autonomy ratio is positively associated with the survival function.
Hypothesis 8 (H8).
The solvency coefficient is positively associated with the survival function.
Hypothesis 9 (H9).
Gearing is positively associated with the survival function.
Basically, the theory behind those hypotheses consisted of the idea that the soundness of the financial statements in terms of profitability and structure significantly helped hotels to overcome the economic crisis. Provided that market considerations are transparent in this issue, as suggested by Kim et al. [1], and that using ratios along with survival analysis is considered better than other mixed approaches [2], we set up the method described in Section 2 for contrasting our theory.

1.1. Models and Techniques Used in Corporate Failure Prediction

Analyzing the financial distress of companies has been a challenge widely tackled by scientists, due to its importance when it comes to evaluating loans, insurances, and any sort of operation subject to the fact that the enterprise is still open for business in the stipulated time. The modern approaches early in de seventies pointed out very soon the usefulness of the ratios as predictors of the companies’ financial distress. Historically, the first attempts to provide scientific insights over bankruptcies and their prediction focused on different ratio sets, often too diffuse and too dependent on large datasets. In particular, the outstanding work created by Altman [3] in 1968 was widely applied in many sectors, whereas it was designed for manufacturing corporations through a Z-score evaluation concerning a set of ratios. Dividing that score into three areas, namely a distress zone, a grey zone, and a safe zone, the model became very popular among practitioners and scholars for decades. Moreover, Johnson [4] summarized and proposed an interesting set of relevant ratios in 1979, again based on manufacturing and retailers’ data. After screening 61 financial ratios, Johnson found that a factor analysis grouped them up into eight categories, highlighting the fact that there are ratios that belong to a similar group, yet empirically determined.
These preliminary approaches were completed very soon using other models and statistics, and comparing them to each other in pursuit of the optimal way of evaluating different ratio sets. Several important advances in this side were produced in the 1990s when multinomial logit methods [5] or neural networks [5,6] seemed pretty promising. Actually, Johnsen and Melicher [5] pointed out that it is better to understand the classification using the distress zone as a continuum, rather than only looking for a two-class classifier (i.e., bankrupt versus non-bankrupt). In the same vein, Atiya [6] proposed using neural networks as a way to better analyze the ratio sets and include novel indicators that increased the accuracy of the forecasts up to three years in advance.
Later on, new comparisons were then performed in the search for an optimal model, but ultimately, there seemed to be no single specific standard to compare, so the issue generated several ways for comparing different options for bankruptcy prediction. An example of this can be found in the case of using linear discriminant analysis by Altman himself and Varetto [7]. On the opposite side, from the ratio-approach academicians, Mossman et al. [8] suggested in 1998 that although ratios are a good predictor for the very short term, none of the models proposed so far were accurate enough beyond a two-year horizon. Despite this fact, in 2007, Sun [9] proposed including non-traditional variables (e.g., abnormal stock returns) and using a hazard model that outperformed the reference classification model. In 2008, Agarwal and Taffler compared two approaches—the Z-score model against market-based models—and concluded that every approach captures different information about corporate failure, but “neither method subsumes the other” [10].
It can be noted that the first comprehensive studies had the merit of establishing the basics for the forthcoming approaches, given the technology and techniques of the times. The main goal was then getting the best classification model for telling whether a given company could go bankrupt with anticipation enough to avoid it or, at least, to issue a warning to lenders, customers, employees, or shareholders. On a slightly different approach, this work evaluates the relative importance of several of the traditional ratios and seeks how related they are, in the long term, with bankruptcies already known.
In the last two decades, other models emerged, proposing binary classification [11], Malahanobis distance [12], or multiperiod prediction [13] as more fit techniques for predicting corporate failure. These methods were proposed along with the evolution of neural networks in the shape of fuzzy logic, also at the same time of quite interesting works comparing those models. It is remarkable how outperformed a radial basis function network compared to other classification systems [14], which is consistent with Kim’s findings. He suggested using artificial neural networks as the most accurate classifier compared to logistic or discriminant multivariate approaches, or event to support vector machine [15], which solves the classification problem using hyperplanes. In recent years, the proposed models have been using genetic algorithms [16] or deep learning techniques [17], mainly black-box approaches to achieve the objective of optimal classifications and, eventually, forecasts. Chou et al. [16] divided their 600-company dataset into three groups, according to their respective industries, the selected year, and the company capital. Adapting their assumption to our case, we have also split the sample into three groups. Moreover, Mai et al. [17] introduce a relevant concept for our purposes, the fact that economic crises are relevant for bankruptcy prediction. They actually point out 2008 as “the Great Recession,” which is in line with our work assumptions.
However, in spite of the large effort of research put into this topic, it is remarkable how few papers have addressed two relevant topics still under debate—(1) the unbalanced datasets commonly used in the research so far and (2) the valid anticipation for prediction. In the first issue, it is important to bring forward the works of Le et al. [18,19], who proposed compensating the unbalanced datasheets when using complex algorithms, due to the fact that there were always many more non-bankrupt companies in the datasets than firms that had gone bankrupt. This concern has also been addressed by Zoričák et al., who used three algorithms in turn [20]. This paper approaches the issue in a different way, addressing it either in the technique or the method, by combining the relatively new survival analysis with a time-fixed data scheme.
On the other hand, the classification methods—regardless of the technique—do not seem to be able of improving the time period within the forecast is valid and reliable. Yet, in 1998, Mossman et al. pointed out that the models can predict bankruptcy only two years in advance [8], which only improved up to three years when using multiperiod prediction [13], but still certainly short; sadly, it is interesting to remark at this point how the most recent literature underlines logistic regressions or neural network as superior methods compared to other models [21]. This work does not provide a comprehensive classification model; however, it can help improving part of the systems already provided, underlining the relative importance of several ratios when trying to build a long-term classification model, accurate for five or more years, as illustrated by Altman et al. [21].
Irrespective of the scholarly trend into which any study falls (i.e., finding the failure and its symptoms versus comparing the classification systems accuracy [14]), the ultimate resource to be taken into consideration is the ratio dataset. Despite the fact that other mixed approaches have been proposed, the specific financial ratio analysis is still a very challenging and active topic for there are continuous outcomes concerning the relationship with the financial health of a given company. In addition, there is evidence of a strong relationship between several ratios and corporate failure. There are a number of ratios mentioned in the literature that could play a different role in this process, and they are specially surveyed by those who, in one way or another, need to foreknow the expected life of any company, such as lenders, insurance companies or public institutions. However, the model used often changes depending on the country [22] or could be influenced by the nature of the activity of the enterprise [23]. Those aspects have been seldom approached by academicians or practitioners, and it is worthwhile bringing forward those who underpinned this issue. On one side, Kliestik et al. presented a quite original way of grouping up ratios, using cluster analysis rather than like Johnson’s [4] factor analysis. Moreover, they crossed the ratios and the countries where they are commonly used for calculating financial distress, and it turned out that depending on the country (or political background), the ratios used are different. On a different topic, Pech et al. [23] used a well-balanced 60-enterprise sample for analyzing the bankruptcies in the same period of the present study. One of their outcomes was that there were weaker classification systems when the dataset mixes companies from different industries. That is the reason for this study to focus on a single homogenous service (lodging).
Using financial ratios for getting diagnostics about financial distress or the likelihood of a corporate failure has been a boosting topic in the last two decades, associated with new algorithms and techniques, not to mention the improved capabilities of the technology for managing large datasets and perform complex calculations. Many of the analyses use a single sound technique for improving the accuracy of the models proposed or rather propose new models. In 2000, Laitinen and Laitinen [24] proposed a solution for the issue about the normality of the variables involved in many of those analyses, using Taylor’s series expansion instead of a logistic or exponent function. At this point, it is remarkable that the model proposed in this research overcomes the problem of data normality, due to the fact that the survival analysis is not a parametrical test and, consequently, does not assume a specific distribution of the data.
The logit model used so far also was improved in 2010 by Li and Liu [25], who proposed to use dynamic loadings instead of constant. Bahiraie et al. [26] proposed another approach in 2011, the dynamic geometry approach, which is really promising, but it seems to have no further improvements on that side so far. De Andrés et al. [27] approached the topic in a different way and suggested that it is not the ratio, but its deviation from an industry standard, which really matters for classifiers, suggesting several interesting ideas to the scholarly debate. In 2017 Tian and Yu [28] suggested a different set of ratios for Japan and several European countries, providing a quite interesting insight into how different predictors could be depending on the country where the firm is located. This seems to be confirmed by the work performed by Kliestik et al. [22], which suggests different preferences depending on the country when it comes to evaluate firms and predict their bankruptcy. The latest improvements addressing issues in this matter came from Balina and Idasz-Balina [29], who proposed to take into consideration two so-called stimulants—current assets to total assets ratio and quick liquidity ratio.

1.2. Previous Works about Hotel Bankruptcy Prediction

The goal of this work is to underpin the ratio approach as a proper way for anticipating corporate failure in a near future. However, a cross-sectional approach would drive us to similar conclusions, already pointed out by previous studies, for different branches within with companies operate might change the accuracy of the model, as indicated by Pech [23]. Consequently, we selected a quite homogeneous industry not subject to diversification, which is the hotel industry. The advantages of doing so are that the companies are rather comparable to each other, belonging to the same sector and rather similar business and technology. Given the fact that all the analyzed hotels worked in the same environment, they had also to comply with similar regulations (that are Spanish lodging law). Moreover, we decided to use information attached to a specific year, provided that all the info supplied by the companies to the public agencies is true and reliable. This allowed us to compare and build the model within an explicit time horizon, avoiding the bias that eventually could arise if considering events in a relative timeline and utterly ignoring external effects on any given year. This side-effect was controlled referring the analysis to a particular moment for any firm considered—the year 2008 when the economic downturn stroked the Spanish tourism sector. Another reason for choosing hotels was that we noticed a lack of works related to this sector and topic. The tourism sector has been seldom researched concerning financial distress or corporate failure. Most relevant papers happen to diverge when it comes to models but not so much in the ratios they regularly use. In 2006, Kim and Gu [30] focused on a very particular part of the tourism sector. They pointed out, after running either a discriminant and a logit model, that restaurants with low earnings before interest and taxes (EBITs) and high total liabilities are more likely to go bankrupt. Five years later, Kim [15] provided evidence that neural networks are more reliable than other techniques outputting early warnings about Korean hotels bankruptcy, suggesting that five ratios would play the predictor’s role—ordinary income to owner’s equity ratio, quick ratio, account receivable turnover, growth in assets and debt-equity ratio. In 2012, another paper [31] focused on Greek hotels and evaluated Altman’s model and its accuracy among different hotel categories, splitting it by hotel stars and Z1 to Z3 scores; according to Diakomihalis, five and three-star hotels are more likely to go bankrupt than four and two-star firms. In 2014, a neural network model [32] displayed that the group of ratios that best could classify bankrupt versus non-bankrupt hotels is (a) financial expenses to sales, (b) financial expenses to operating income, (c) owner’s equity growth, (d) operating income to sales, (e) total assets turnover, (f) current assets to total assets, (g) net income and depreciation to total liabilities, and (h) quick asset to total asset.

2. Materials and Methods

For addressing this project’s goal, we first gathered information from SABI (Iberian Statements Analysis System) financial database. The constraints used for this analysis were set up in order to find a suitable set of information, which in turn allowed us to build a sound model. First of all, we needed a comprehensive list of hotels that were already open in 2008, when the tourism crisis took place. We also needed to combine the list with information about their financial ratios comprising 2008–2019 years, due to the fact that the last available report recorded in the dataset was 2019, and we would like to consider the largest timeline feasible for the study.

2.1. Preparation of the Dataset

To this purpose, we conducted a search within the aforementioned SABI database, using, in turn, three Boolean constraints for identifying and sorting the companies we were interested in. First, we selected national Spanish companies, regardless of whether they were still alive or not in 2019, due to the fact that we were indeed interested in those who had been terminated within the time-lapse considered. This allowed us to access more than 1.7 million firms. Afterward, we located those linked to lodging and hospitality activities using not only a criterion but two; the most accurate way of identifying lodging enterprises in the list was using the economic activity classification declared by the enterprise (CNAE 2009). However, to remove firms not directly linked to this activity we added another boundary at that moment using IAE (Economic Activities Tax), a similar activity list; making both requirements to be achieved at the same time we made sure all the companies in the list belonged to the desired set and could utterly be considered suitable for the analysis. This reduced the number of firms first to 14.250 and, in the second step, 11.893 hotels. However, many of those companies were not still active in 2008, and this issue could bias the results of the analysis entirely, so we had to filter the list once more and consider only 3.341 enterprises from the whole dataset. As an ultimate filtering and sorting method, we removed the outliers in the database calculating the Z-score for either the variables “total assets” and “employees” related to 2008, the year we considered as the beginning of the analysis. Afterward, we ran a K-means cluster analysis, distributing the sample in 25 different groups depending on three variables—"total income,” “total assets,” and “number of employees.” This method output three main clusters where the firms converged, namely 17, 20, and 25, adding up to 2.639 hotels altogether in the final sample. The centroids and size of those clusters are represented in Table 1, along with the reference for each one, to be used in the rest of this work for descriptive purposes.
Due to the fact that we were speculating with the idea of how strong is the impact of an economic crisis in the profitability of any hotel considered, depending on its financial structure when the crisis started, we saw fit to include nine standard ratios used in the literature as indicators of the profitability and the structure of the firm. The variables to be used had to fulfill two requirements—(1) minimizing the missing values and (2) expressing a financial insight of different aspects of the firm. SABI database, which records Spanish and Portuguese firms, offers a wide set of ratios, divided into four categories—profitability, operations, structure, and employee. Ratios about operations are often used in manufacturing and retail, but seldom in hotels, due to the nature of the service provided. Additionally, ratios per employee add little new information if the model already has considered that a preliminary parameter, as was the case. As a result, we included in the model the ratios belonging to “profitability” and “structure” categories as representative measures of the financial aspect of the hotels.
Consequently, the selected ratios described in Table 2 were collected from the SABI database for the 2008–2019 time period and included in the research. Moreover, along with those ratios, other data were also registered for each firm in the dataset—the Spanish region, which hosts the hotel headquarters, and legal status, both to be used as control variables. Operating income, number of employees, and total assets were also included in the dataset for the initial clustering.
Once those ratios were downloaded, and after preformatting the figures involved using an Excel procedure for that, two calculations were achieved—first, using the variable that indicated the last year each company presented their financial records, we calculated whether the firm was still alive (then it was considered to be censored), or actually had been declared extinct (bankrupt). Moreover, we also calculated the number of years from 2008 that the company had stayed alive because it was the main variable to be used in any survival analysis. The business status different than “active” or “extinguished” (e.g., “temporarily inactivated”) were also considered censored data.
Afterward, the data were loaded in an SPSS (Statistical Package for the Social Sciences) datasheet for running the analysis. We needed to perform some transformations on the data at that moment, like converting text chains in operational values. We also produced discretized variables from financial figures. The discretizing method consisted of allocating the information for each ratio in 2008 and setting up boundaries based on their respective average and standard deviation +1 (see Table 3). This allowed us to standardize the financial data and have a homogenous starting point to begin the analysis, featuring also the correlation measures for the ratios involved (see Table 4).
In the end, the dataset boiled down to a sheet containing information from 2.639 Spanish lodging firms and their respective profitability and structure ratios throughout the 2008–2019 period. Moreover, city and region information was also included for each case, along with the year they were bankrupt (if they were). Categorized variables for 2008 ratios were also included in the dataset because it was the factors (covariates) information for setting up the model. Control variables and information for clustering were also collected.

2.2. Method

After preparing the dataset as described previously, we ran the analysis. It was designed from the beginning in three stages, namely, (1) we built a preliminary survival table, after which (2) we figured out Kaplan–Meier indicators, and (3) we used a Cox regression for retrieving the most relevant variates according to the main objective of this research. The logic behind this design of the research is to progressively isolate relevant ratios that could be associated with the future performance of the companies, discarding those of the dataset that add little or no value at all to the final conclusion. This led us to establish a three-stage process, increasingly demanding in order to get a parsimonious model.

2.2.1. Survival Tables

The survival analysis is a quite preliminary method in this context, which is commonly used for either medical and economic issues. It is also widely applied in educational design, or even in engineering forecasting. It is essentially a method that describes the moment when an event occurs and allows the researcher to model it, discriminating factors that could affect the manifestation of the event [42].
The events described might ensue within the period of study. However, there are subjects of the study who do not experience the event (in this case, enterprises that do not go bankrupt), or might experience it beyond the study threshold. We also could have missed the information about if they survived or not. All those cases in the sample are considered censored due to the fact that the event cannot be registered for them. The survival analysis organizes the information according to the time until the event happens using also information coming from censored subjects.
Moreover, the event could be associated with factors that can be described and analyzed. In this case, conditions associated with financial strength expressed through ratios have been included. Nonetheless, this analysis could also be broadened including companies that started their activity in the middle of the study period, but they were excluded due to the fact that we were interested in measuring how the initial condition affects the verification of the event from a particular controlled moment on.

2.2.2. Kaplan–Meier Indicators

In 1958, professors Kaplan and Meier presented a method for estimating nonparametric magnitudes when missing information [43], which became a standard in survival analysis. In this paper, they proposed a way for figuring out the probability of a subject among a population for surviving more than a given time, not assuming a particular shape of the probability function. This was called the survival function S(t).
They proposed to estimate the function by maximizing the likelihood function of the sample. In other words, a given random sample (sized n) coming from a certain population could be split into k times where an event could be observed (kn). There are ni hazarded subjects in each time ti, when di events are observed. Moreover, for each interval between ti and ti+1, mi losses are registered.
In their work, Kaplan and Meier demonstrated that the likelihood function for the whole sample could be estimated in the following way:
S ^ ( t ) = t i < t n i d i n i
The convenience of this technique is remarkable if there is the need for predicting how much time would live a given subject who belongs to a specific part of the population, especially if the subject herself is featuring differences compared to other groups (e.g., a quite different profitability or structure ratios).

2.2.3. Cox Regression

Cox regression is a function that describes the risk of experiencing the event according to time t and a set of r explanatory covariates (X). It is a semi-parametric function, due to the fact that it is comprised of two parts [44]
( h , X ) = h 0 ( t ) g ( X ) .
First, the non-parametric side of the function evaluates the risk of occurrence based on the maximization of a partial-likelihood function, which allows us to calculate β coefficients for each significant covariate for the model as indicated in Equation (3)
g ( X ) = e i = 1 r β i x i = exp ( i = 1 r β i x i ) .
In a second stage, once the β coefficients are known, the parametric part of the equation, which is the baseline hazard estimation, can be calculated. At this second stage, the researcher needs to estimate the risk for any individual who presents β = 0 for any covariate to experience the event.
In this case, given that an estimate of h0(tj) for any value of j belonging to space [j = 1, 2…, m] is
h 0 ( t j ) = 1 c j
and provided that cj is the solution to the equation
S ϵ D j g s ( X ) 1 c j g s ( X ) = S ϵ R j g s ( X )
it might be concluded that cj is the probability that an individual does not experience the event from a moment tj to the next tj+1. Consequently, the estimated baseline survival function, for any t belonging to the interval [k = 1,2…m − 1] is
S 0 ( t ) = j = 1 k c j
Then, the cumulative baseline hazard function, that is, the baseline function if the model eventually did not also add covariates, should be
H o ( t ) = ln S 0 ( t ) = j = 1 k ln c j

2.3. Survival Analysis Applied to Bankruptcy Prediction

Although survival analysis has been widely applied in other fields such as medicine, it is a relatively new technique when it comes to corporate failure prediction. The first relevant survival analysis research applied to this topic goes back to 2001, in the work presented by Turetsky and McEwen [45]; in this paper, the decline in cash-flows allows us to determine the groups considered for business failure and the event of default. Later, in 2008, Gepp and Kumar [2] also discarded using the survival analysis along with other techniques, stating that the joint performance was poorer. Chancharat et al. [36] confirmed in 2011 that survival analysis is an adequate technique for pointing out relevant ratios associated with financial distress, such as profitability, leverage, past excess returns, or even the size of the company. In the same vein, in 2016, Kim et al. [1] showed that the market information adds no accuracy to a ratio-based model. Moreover, they highlighted the fact that the Cox hazard model performs better than the traditional logit model when evaluating financial distress. Kim et al. [46] focused on restaurants and non-financial information for conducting their survival analysis in 2017, with outstanding results concerning high stock return, limited-service operations, or category. Finally, in 2018, Gupta et al. [47] found evidence of the inverse relationship between the size of the firm and the probability of corporate failure applied to small and medium enterprises.

3. Results

As the preliminary stages of the analysis were carried out, there seemed to be a very promising set of ratios related to the forthcoming results of the firm. However, after calculating Mantel–Cox and Kaplan–Meier estimates, we could identify six of them as relevant indicators for the objective of the research, finding rather interesting information about the expected time of survival when presenting different levels for each ratio. However, concerning the relationship between the ratios and the long-term bankruptcy forecasting, we had to build a more severe examination by using a Cox regression. After the analysis, it turned out that the return on capital employed ratio suggested evidence of being linked to the future performance of the company when a crisis strikes. Thus, in this case, we could reject the null hypothesis and accept hypothesis H2 among the initial set of hypotheses.

3.1. Preliminary Survival Analysis

Considering both groups (censored and non-censored), the first measure we took was to perform a Mantel–Cox test, contrasting their survival functions. As described in Section 2.2.1, this test is often used to identify the influence of different factors in the survival time of a given subject.
In this case, the factors were considered within which interval for any ratio each company was in 2008. In other words, as we speculated with the theory about the effect of having any ratio in 2008 over the time up to a bankruptcy event, we first discretized each ratio in 2008 into intervals (see Section 2.1) and then run a survival analysis calculating log-rank indicator for each variate (ratio) in the dataset, against the time until each firm went bankrupt or censored (see Table 5).
As a result, five out of the nine ratios seemed significant in the model and, therefore, linked to the survival function of the firm, namely, return on shareholders’ funds (for sizes M and S), return on capital employed (M and S), return on total assets (S), solvency ratio (M), and liquidity ratio (M). In other words, there seems to be a relationship between the bankruptcy probability of medium-sized hotels and their return on shareholders ratio, the return on capital employed, the solvency ratio, and the liquidity ratio. When it comes to small companies, the results revealed that a difference arises—the return on total assets was significant instead of solvency or liquidity ratio.

3.2. Kaplan–Meier Indicator Outcomes

Considering the results previously described, we confirmed them by using a more accurate technique, i.e., Kaplan-Meier indicators, to be applied only in those ratios already identified as having an effect in the survival function.
As indicated in Section 2.2.2, Kaplan–Meier indicator is a non-parametric method for estimating the probability for any firm of living more than the time t by using maximum likelihood. The advantage of this estimation is that it takes into account the censored subjects of study, so we could also include in the analysis the liquidity ratio already discarded in the previous step. Once performed, the results of this analysis are displayed in Table 6:
As it can be stated, there are a number of intervals where the probability of survival is quite long, regardless of the initial ratio in 2008. It suggests that, in the long term, the initial financial position of the firm is not so relevant to be considered due to having time enough to recover after the initial shock. However, there are also several interesting questions concerning high ratio intervals, which seems inversely proportioned to the probability of surviving. It is remarkable the case of unusually high levels for return on capital employed and return on total assets, which indicate slightly lower expected survival times. The measures suggest that presenting an intermediate value (similar to the standard) for each ratio—at the moment when market difficulties come over—might be associated with a higher survival probability.

3.3. Cox Regression Results

As described in Section 2.2.3, Cox regression is a semi-parametric function that estimates the baseline hazard of experiencing an event, combined with a factor analysis, which might influence up to a certain extent in anticipating the event in time. In this case, the factors considered were, again the relevant ratios discretized in 2008, and the variable time registered the years between 2008 and the moment each firm went bankrupt. We also included two control variables for checking the influence of either the geographical location of the hotel (19 Spanish regions) and their legal status (partnership, private limited, or public limited companies). The distribution of the latter is displayed in Table 7.
For setting up the Cox regression, we considered the most suitable parameters were using a “Forward LR” algorithm, which included covariates in the model in an iterative process if the p-value associated was less than 0.05. All nine ratios considered were included initially as covariates for estimating the partial likelihood function with its respective exp(β), if significant. Moreover, both control variables were also included in the initial set for being tested.
After running the model, it only converged onto one significant ratio, the return on capital employed (ROCE), which was clearly associated with the survival function of small-sized hotels. Moreover, the legal status seems to have a predictive relationship about the corporate failure of medium-sized hotels, as displayed in Table 8.
The omnibus test for the model coefficient can be observed in Table 9.
Graphically, the survival functions for either variable could be represented, respectively, according to Figure 2.
After the three tests performed, it can be concluded that there is only one particular ratio that is clearly associated with the probability of a small hotel surviving in the long term to an economic downturn. The return on capital employed ((EBIT + financial expenses)/(shareholder’s equity + fixed liabilities)) is a complex measure that links earnings to fixed liabilities and equity. From this point of view, it can be said that the larger the earnings compared to the shareholder’s equity, the higher the ratio. Moreover, a smaller magnitude for the fixed liabilities compared to the earnings could increase this ratio. In other words, there seems to be a significant relationship between survival function and hotels with large earnings, which are well-funded by shareholders and whose liabilities are carefully managed.
On the other hand, concerning medium-sized hotels, it can be said that the data provides an interesting association not concerning ratios, but the legal status. These types of hotels seemed more likely to survive under the public limited status than rather private.

4. Discussion

There are no studies that estimate the effect of ratios in the long term, at least following the path pointed out by Altman et al. [21]. For addressing this issue, this analysis was performed following a forward-looking approach (i.e., considering an initial event for any hotel and analyzing the time until going bankrupt), whereas the mainstream research follows a reverse approach—most papers on this topic focus first on the relative moment the enterprise goes bankrupt and then go back in time analyzing ratios till the model lacks reliability or accuracy. As we previously mentioned, two or three years [5,8,13], at most five, is the time threshold for getting good classification models. We suggest that this limitation could be overcome using the survival analysis and following a forward-looking approach.
Another constraint to be tackled was the too general approach in many papers. This topic lacks works focused on specific industries, whereas several authors addressed the issue [15,20]. Following their works, we limited the analysis to a particular sector and activity, because hotels are places where companies are not likely to have branches in different industries, as suggested by Pech et al. or Choi and Lee [23,32]. This requirement was double-checked when retrieving the dataset using, not one, but two activity filters.
Concerning the results of the research, and after performing the three tests, it can be concluded that the return on capital employed ratio (ROCE) is consistently associated with the bankruptcy of lesser dimension hotels when an economic downturn happens. This particular ratio is the only one that could be associated with this fact in the eleven-year timeline considered, among the initial nine ratio sets that were included in the analysis. This is consistent with the notion that the capital structure in the companies is remarkably relevant in order to get ready for economic downturns and, eventually, manage the ensuing financial distress.
Because ROCE is a structural ratio, which marks up the proportion between EBIT and financial expenses, versus the shareholders’ equity and fixed liabilities, the following insights can be concluded:
  • We considered an intermediate ROCE value the interval limited by the mean of the sector ± its standard deviation;
  • When an economic crisis bursts, considered in the long term, a given small hotel that features a ROCE value within that intermediate interval is more likely to survive than small hotels with ROCE in extreme values, 95% significant;
  • The rest of the ratios analyzed in this study do not meet this characteristic, according to Cox regression;
  • Preliminary, and less accurate, survival analysis or Kaplan–Meier models suggested a relevant—but not significant—relationship in the long term with other ratios and hotel dimensions. Particularly, the return on shareholders’ funds, the solvency ratio and the liquidity ratio seem to influence somehow the medium-sized enterprises’ long-term survival function;
  • Our conclusions also underpin the idea that, combined with ratios, market information adds little accuracy to the forecasting methods. Nonetheless, there is a secondary outcome in this research, which would support the fact that legal status plays a relevant role in the bankruptcy prediction when it comes to medium-sized hotels, which is something to be included among the inputs of forthcoming research.
The overall results support that the survival analysis is a proper technique for approaching this topic, the Cox regression being the most restrictive method compared to survival tables or Kaplan–Meier estimates. At this point, we could remark that the advantages of using survival analysis addressing this matter are the usage of the whole information, including those cases including missing values, and the possibility of estimating results among large unbalanced datasets.
Using this information, we could suggest hotel managers who are facing an economic downturn pay attention to the relation between earnings and capital employed, because it is quite related to the probability of experiencing financial distress and, eventually, a corporate failure. More specifically, it applies to small hotels, which were dimensioned for this study’s purposes according to the following cluster’s centroid characteristics: operating income: 958,240 €; total assets: EUR 1,356,390; employees: 12.31). Given that premise, the logical application of the conclusions is to keep the ROCE within that intermediate interval in the event of an economic crisis.
This study considers the crisis that befell in 2008 as the main initial fuse for the subsequent bankruptcies in the Spanish hotel sector. However, this might be the case for hotels, certainly much worse, of the current economic situation derived from the COVID-19 crisis. The statistics show that after the outbreak and the closure of the border, the market dropped nearly to zero customers, ruining the high season entirely. It is undeniable that many hotel businesses will come to an end in the forthcoming months and years, providing a unique opportunity for testing new models. However, the challenge for researchers shall be discriminating the reasons for the future corporate failures, splitting them into regular reasons—perhaps the financial situation was yet weak upon the outbreak or extraordinary reasons due to pandemic itself-.
Despite the results, the limitations of this paper are to be overcome and its outcomes improved in future research. First, the ratio set could be improved considering the profitability and capital structure of the firm, in addition to operations or ratios per employee, which seem also promising for being evaluated in the same model. Afterward, in a second stage, when all the regular ratios had been evaluated, the model should be tested against a more comprehensive version including appropriate hotel revenue management information, such as revenue per available room (REVPAR) or gross operating profit per available room (GOPPAR), to check whether this information is actually related to early or late bankruptcies. When it comes to medium-sized hotels, the legal status seems to be linked to the hazard function, which is something to be investigated in future research. On the other hand, the method will also be tested using another industry whose companies are more likely to have branches and different activities, so that other significant ratios might emerge.

Author Contributions

Conceptualization, A.P.-V. and P.L.-S.; methodology, A.P.-V. and P.L.-S.; software, A.P.-V.; validation, P.L.-S.; formal analysis, A.P.-V.; investigation, A.P.-V. and P.L.-S.; resources, A.P.-V.; data curation, P.L.-S.; writing—original draft preparation, A.P.-V.; writing—review and editing, A.P.-V. and P.L.-S.; visualization, P.L.-S.; supervision, A.P.-V. and P.L.-S. All authors have read and agreed to the published version of the manuscript.

Funding

This research received no external funding. All the datasets and tools used for this research belong or have been subscripted by the University of Malaga (Business and Management Dpt.).

Data Availability Statement

Not applicable.

Acknowledgments

The authors would like to express their gratitude for the indications of our colleague Ivan Gómez Gallego who first suggested the method for properly evaluating the model.

Conflicts of Interest

The authors declare no conflict of interest.

References

  1. Kim, M.H.Y.; Ma, S.; Zhou, Y.A. Survival prediction of distressed firms: Evidence from the Chinese special treatment firms. J. Asia Pacific Econ. 2016, 21. [Google Scholar] [CrossRef]
  2. Gepp, A.; Kumar, K. The Role of Survival Analysis in Financial Distress Prediction. Int. Res. J. Financ. Econ. 2008, 16, 13–34. [Google Scholar]
  3. Altman, E.I. Financial Ratios, Discriminant Analysis and the Prediction of Corporate Bankruptcy. J. Financ. 1968, 23, 589–609. [Google Scholar] [CrossRef]
  4. Johnson, W.B. The Cross-Sectional Stability of Financial Ratio Patterns. J. Financ. Quant. Anal. 1979, 14. [Google Scholar] [CrossRef]
  5. Johnsen, T.; Melicher, R.W. Predicting corporate bankruptcy and financial distress: Information value added by multinomial logit models. J. Econ. Bus. 1994, 46. [Google Scholar] [CrossRef]
  6. Atiya, A.F. Bankruptcy prediction for credit risk using neural networks: A survey and new results. IEEE Trans. Neural Netw. 2001, 12. [Google Scholar] [CrossRef] [Green Version]
  7. Altman, E.I.; Marco, G.; Varetto, F. Corporate distress diagnosis: Comparisons using linear discriminant analysis and neural networks (the Italian experience). J. Bank. Financ. 1994, 18. [Google Scholar] [CrossRef]
  8. Mossman, C.E.; Bell, G.G.; Swartz, L.M.; Turtle, H. An empirical comparison of bankruptcy models. Financ. Rev. 1998, 33. [Google Scholar] [CrossRef]
  9. Sun, L. A re-evaluation of auditors’ opinions versus statistical models in bankruptcy prediction. Rev. Quant. Financ. Account. 2007, 28. [Google Scholar] [CrossRef]
  10. Agarwal, V.; Taffler, R. Comparing the performance of market-based and accounting-based bankruptcy prediction models. J. Bank. Financ. 2008, 32. [Google Scholar] [CrossRef] [Green Version]
  11. Min, J.H.; Jeong, C. A binary classification method for bankruptcy prediction. Expert Syst. Appl. 2009, 36. [Google Scholar] [CrossRef]
  12. Cho, S.; Hong, H.; Ha, B.C. A hybrid approach based on the combination of variable selection using decision trees and case-based reasoning using the Mahalanobis distance: For bankruptcy prediction. Expert Syst. Appl. 2010, 37. [Google Scholar] [CrossRef]
  13. Duan, J.C.; Sun, J.; Wang, T. Multiperiod corporate default prediction—A forward intensity approach. J. Econom. 2012, 170. [Google Scholar] [CrossRef]
  14. Tseng, F.M.; Hu, Y.C. Comparing four bankruptcy prediction models: Logit, quadratic interval logit, neural and fuzzy neural networks. Expert Syst. Appl. 2010, 37. [Google Scholar] [CrossRef]
  15. Kim, S.Y. Prediction of hotel bankruptcy using support vector machine, artificial neural network, logistic regression, and multivariate discriminant analysis. Serv. Ind. J. 2011, 31. [Google Scholar] [CrossRef]
  16. Chou, C.H.; Hsieh, S.C.; Qiu, C.J. Hybrid genetic algorithm and fuzzy clustering for bankruptcy prediction. Appl. Soft Comput. J. 2017, 56. [Google Scholar] [CrossRef]
  17. Mai, F.; Tian, S.; Lee, C.; Ma, L. Deep learning models for bankruptcy prediction using textual disclosures. Eur. J. Oper. Res. 2019, 274. [Google Scholar] [CrossRef]
  18. Le, T.; Vo, M.T.; Vo, B.; Lee, M.Y.; Baik, S.W. A Hybrid Approach Using Oversampling Technique and Cost-Sensitive Learning for Bankruptcy Prediction. Complexity 2019, 2019. [Google Scholar] [CrossRef] [Green Version]
  19. Le, T.; Son, L.H.; Vo, M.T.; Lee, M.Y.; Baik, S.W. A cluster-based boosting algorithm for bankruptcy prediction in a highly imbalanced dataset. Symmetry 2018, 10, 250. [Google Scholar] [CrossRef] [Green Version]
  20. Zoričák, M.; Gnip, P.; Drotár, P.; Gazda, V. Bankruptcy prediction for small- and medium-sized companies using severely imbalanced datasets. Econ. Model. 2020, 84. [Google Scholar] [CrossRef]
  21. Altman, E.I.; Iwanicz-Drozdowska, M.; Laitinen, E.K.; Suvas, A. A Race for Long Horizon Bankruptcy Prediction. Appl. Econ. 2020, 52. [Google Scholar] [CrossRef]
  22. Kliestik, T.; Valaskova, K.; Lazaroiu, G.; Kovacova, M.; Vrbka, J. Remaining financially healthy and competitive: The role of financial predictors. J. Compet. 2020, 12. [Google Scholar] [CrossRef]
  23. Pech, M.; Prazakova, J.; Pechova, L. The evaluation of the success rate of corporate failure prediction in a five-year period. J. Compet. 2020, 12. [Google Scholar] [CrossRef]
  24. Laitinen, E.K.; Laitinen, T. Bankruptcy prediction: Application of the Taylor’s expansion in logistic regression. Int. Rev. Financ. Anal. 2000, 9. [Google Scholar] [CrossRef]
  25. Li, M.-Y.L.; Miu, P. A hybrid bankruptcy prediction model with dynamic loadings on accounting-ratio-based and market-based information: A binary quantile regression approach. J. Empir. Financ. 2010, 17, 818–833. [Google Scholar] [CrossRef]
  26. Bahiraie, A.; Azhar, A.K.M.; Ibrahim, N.A. A new dynamic geometryc approach for empirical analysis of finantial ratios and bankruptcy. J. Ind. Manag. Optim. 2011, 7, 947–965. [Google Scholar]
  27. de Andrés, J.; Landajo, M.; Lorca, P. Bankruptcy prediction models based on multinorm analysis: An alternative to accounting ratios. Knowl. Based Syst. 2012, 30, 67–77. [Google Scholar] [CrossRef]
  28. Tian, S.; Yu, Y. Financial ratios and bankruptcy predictions: An international evidence. Int. Rev. Econ. Financ. 2017, 51. [Google Scholar] [CrossRef]
  29. Balina, R.; Idasz-Balina, M. Financial Stability in the Food Supply Chain. Rev. Integr. Bus. Econ. Res. 2020, 9, 157–164. [Google Scholar]
  30. Kim, H.; Gu, Z. Predicting Restaurant Bankruptcy: A Logit Model in Comparison with a Discriminant Model. J. Hosp. Tour. Res. 2006, 30. [Google Scholar] [CrossRef]
  31. Diakomihalis, M.N. The Accuracy of Altman’s Models in Predicting Hotel Bankruptcy. Int. J. Account. Financ. Report. 2012, 2. [Google Scholar] [CrossRef]
  32. Choi, S.-J.; Lee, S.-W. A Development of Hotel Bankruptcy Prediction Model on Artificial Neural Network. J. Korea Soc. Comput. Inf. 2014, 19. [Google Scholar] [CrossRef]
  33. Halkos, G.E.; Tzeremes, N.G. Industry performance evaluation with the use of financial ratios: An application of bootstrapped DEA. Expert Syst. Appl. 2012, 39, 5872–5880. [Google Scholar] [CrossRef]
  34. Beaver, W.H.; McNichols, M.F.; Rhie, J.-W. Have Financial Statements Become Less Informative? Evidence from the Ability of Financial Ratios to Predict Bankruptcy. Rev. Account. Stud. 2005, 10, 93–122. [Google Scholar] [CrossRef]
  35. Brîndescu-Olariu, D. Profitability Ratio as a Tool for Bankruptcy Prediction. SEA Pract. Appl. Sci. 2016, IV, 369–372. [Google Scholar]
  36. Chancharat, N.; Davy, P.; McCrae, M.S.; Tian, G.G. Firms in Financial Distress, a Survival Model Analysis. SSRN Electron. J. 2011. [Google Scholar] [CrossRef]
  37. Tomczak, S. Comparative analysis of liquidity ratios of bankrupt manufacturing companies. Bus. Econ. Horiz. 2014, 10. [Google Scholar] [CrossRef] [Green Version]
  38. Voulgaris, F.; Doumpos, M.; Zopounidis, C. On the evaluation of Greek industrial SMEs ’ performance via multicriteria analysis of financial ratios. Small Bus. Econ. 2000, 15, 127–136. [Google Scholar] [CrossRef]
  39. Brîndescu-Olariu, D. Bankruptcy Prediction Based on the Autonomy Ratio. Euro Econ. 2016, 35, 78–93. [Google Scholar]
  40. Brîndescu-Olariu, D. Solvency ratio as a tool for bankrupcy prediction. Ecoforum 2016, 5, 278–281. [Google Scholar]
  41. Ogachi, D.; Ndege, R.; Gaturu, P.; Zoltan, Z. Corporate Bankruptcy Prediction Model, a Special Focus on Listed Companies in Kenya. J. Risk Financ. Manag. 2020, 13, 47. [Google Scholar] [CrossRef] [Green Version]
  42. Cox, D.R. Regression Models and Life-Tables. J. R. Stat. Soc. Ser. B 1972, 34, 187–202. [Google Scholar] [CrossRef]
  43. Kaplan, E.L.; Meier, P. Nonparametric Estimation from Incomplete Observations. J. Am. Stat. Assoc. 1958, 53, 457–481. [Google Scholar] [CrossRef]
  44. Cox, D.R.; Oakes, D. Analysis of Survival Data; CRC Press: Boca Raton, FL, USA, 1984. [Google Scholar]
  45. Turetsky, H.F.; Mcewen, R.A. An empirical investigation of firm longevity: A model of the Ex Ante predictors of financial distress. Rev. Quant. Financ. Account. 2001, 16. [Google Scholar] [CrossRef]
  46. Kim, S.Y.; Hua, N.; Upneja, A. What drives restaurants bankrupt? A survival analysis perspective. In Progress in Economics Research; NOVA Science Publishers: Harpak, NY, USA, 2017; Volume 39. [Google Scholar]
  47. Gupta, J.; Barzotto, M.; Khorasgani, A. Does size matter in predicting SMEs failure? Int. J. Financ. Econ. 2018, 23. [Google Scholar] [CrossRef]
Figure 1. Travelers in Spanish hotels, either domestic and foreigners. Note the downturn in 2008 compared to the growth in previous and past years. Source: INE (Instituto Nacional de Estadística, Encuesta de Ocupación Hotelera, 2019).
Sustainability 13 01473 g001
Figure 2. Functions associated with the model: (a) survival function for small hotels with return on capital employed (ROCE) displayed and (b) survival function for medium hotels, according to their legal status.
Sustainability 13 01473 g002
Table 1. Sample description after clustering.
ClusterReference for DimensionHotels within the ClusterCentroid: Operating Income 1Centroid: Total Assets 1Centroid: Number of Employees
17Large (L)1928726.2020,797.8980.33
25Medium (M)4753968.688034.0539.37
20Small (S)1972958.241356.3912.31
1 Unit: Thousand euros.
Table 2. Ratio dataset descriptive information.
RatioDescriptionUsed in Literature
Return on shareholders’ fundsEBIT/shareholders’ equity[33]
Return on capital employed(EBIT + financial expenses)/(shareholders’ equity + fixed liabilities)[34]
Return on total assetsEBIT/total assets[25,34]
Profit marginEBIT/operating income[33,35,36]
Solvency ratioShareholders’ equity/total assets[26]
Liquidity ratio (or quick ratio)(current assets − inventories)/current liabilities[2,37,38]
Financial autonomy ratioShareholders’ equity/total liabilities[39]
Solvency coefficientTotal assets/total debt[40]
Gearing(long-term debt + short-term debt)/shareholders’ equity[2,36,41]
Table 3. Proportion bankrupt/censored at each variable, interval, and size.
RatioIntervalLarge
(L)
Medium (M)Small
(S)
Return on shareholders’ funds<−350.77 0.00 1
−350.77–17.310.090.050.06
17.31–385.390.020.070.10
>385.39 1.000.30
Return on capital employed<−282.95 0.00 1
−282.95–16.70.080.050.06
16.70–316.350.050.090.11
>316.35 0.50
Return on total assets−11.27–7.130.070.060.06
7.13–25.540.100.050.09
>25.540.00 10.110.15
Profit margin−3,295,771.41–67,993.270.070.050.07
67,993.27–3,431,757.97 0.00 1
>3,431,757.97 0.00 1
Solvency ratio−2214.16–75.380.070.050.07
75.38–2364.920.00 10.00 10.16
>2364.92 0.00 1
Liquidity ratio (or quick ratio)−2214.53–74.990.070.050.07
74.99–2364.520.00 10.00 10.17
>2364.52 0.00 1
Financial autonomy ratio−1177.55–52.170.080.050.05
52.17–1281.900.100.000.06
>1281.900.00 10.00 10.00 1
Solvency coefficient<−98.05 0.20
−98.05–39.90.120.080.08
39.90–177.870.050.060.04
Gearing<−10,153.42 0.00
−10,153.42–142.690.060.050.07
142.69–10,438.810.090.080.06
>10,438.81 0.00 10.08
1 Not bankrupt or censored companies in the interval and size.
Table 4. Significant correlation measures for described ratios (sizes).
RatioChi-SquaredfSig.Pearson Corr. ValueSt. ErrorAprox. TAprox. Sig.
Return on shareholders’ funds (M)8.79620.120.0730.0591.5890.113
Return on shareholders’ funds (S)15.78230.0010.0840.0253.7310.000
Return on capital employed (M)19.93920.0000.1030.0632.2490.025
Return on capital employed (S)25.67630.0000.0990.0274.4190.000
Return on total assets (S)9.61820.0080.0670.0262.9890.003
Solvency ratio (M)18.02220.0000.1500.1103.2990.001
Liquidity ratio (M)18.02220.0000.1500.1103.2990.001
Table 5. Log-rank (Mantel–Cox) for the ratios.
Ratio Chi-SquareDegrees of Freedom (d.f.)Sig.
Return on shareholders’ fundsL1.72410.189
M8.96320.011
S18.14230.000
Return on capital employedL0.23910.625
M22.80320.000
S34.26630.000
Return on total assetsL0.89320.640
M0.92320.630
S10.40320.006
Profit margin 1M0.02210.882
S0.07310.786
Solvency ratioL0.14410.704
M28.88520.000
S1.96920.374
Financial autonomy ratioL0.51020.775
M2.80220.246
S0.73920.691
Liquidity ratioL0.14410.704
M28.88520.000
S2.19020.334
Solvency coefficientL2.96110.085
M2.28010.131
S5.31820.070
GearingL0.53210.466
M2.46520.292
S0.58230.900
1 Not large (L) hotels for calculating factor variable.
Table 6. Kaplan–Meier mean estimates for log-rank significant ratios 1.
Ratio (Size)IntervalEstimatedStd. Dev.Lower Bound (95% C.I.)Upper Bound (95% C.I.)
Return on shareholders’ funds (M)−350.77–17.3110.7660.06610.63710.896
17.31–385.3910.4760.21110.06210.889
>385.3910.0000.7078.61411.386
Return on capital employed (M)−282.95–16.710.7620.06810.62910.894
16.70–316.3510.4450.2279.99910.890
>316.359.0000.0009.0009.000
Return on total assets−11.27–7.1310.6080.04510.52010.697
7.13–25.5410.4770.09410.29310.661
>25.549.9940.2639.47810.510
1 Calculated for intervals with censored and bankrupt companies.
Table 7. Distribution of hotels according to legal status and dimension.
Legal StatusCensored (L)Bankrupt (L)Censored (M)Bankrupt (M)Censored (S)Bankrupt (S)
Private limited50.3%53.8%56.0%84.0%17.0%20.8%
Public limited49.7%46.2%44.0%16.0%82.9%79.2%
Partnership 0.1%0.0%
Table 8. Cox regression estimates for the model after iterative convergence.
PredictorBSEWalddfSig.Exp(β)Lower Bound (95% C.I.)Upper Bound (95% C.I.)
ROCE (S)0.9210.25413.15010.0002.5121.5274.131
Legal status (M)1.3350.6324.45510.0353.7991.10013.124
Table 9. Omnibus test for significant models.
PredictorLog LikelihoodChi-SquareDfSig.
ROCE (S)938.78614.05910.000
Legal status (M)208.5625.15610.023
Publisher’s Note: MDPI stays neutral with regard to jurisdictional claims in published maps and institutional affiliations.

