Defining Sustainability in an Input–Output Model: An Application to Spanish Water Use


1
Facultad de Ciencias Jurídicas y Sociales, Universidad Rey Juan Carlos, Paseo de los Artilleros s/n, 28032 Madrid, Spain
2
Departament d’Economia, Universitat Rovira i Virgili and ECO-SOS, Avinguda Universitat 1, 43204 Reus, Spain
*
Author to whom correspondence should be addressed.
Water 2021, 13(1), 1; https://doi.org/10.3390/w13010001
Submission received: 20 November 2020
/
Revised: 17 December 2020
/
Accepted: 18 December 2020
/
Published: 22 December 2020
(This article belongs to the Section Water Use and Scarcity)
Abstract
:The continuous increase in freshwater consumption threatens water availability worldwide, especially in dry and arid regions. In this paper, we evaluate the sustainability of water use in Spain, a Mediterranean country that suffers from a permanent imbalance between water availability and water use. Our method, based on the input–output (IO) model, calculates the total water requirements of the Spanish production system. According to input–output assumptions, however, factors (i.e., labor and capital) and resources (such as natural goods or human capital) are not fully employed (not completely used), and therefore any expansion in demand is thought to always be automatically covered by production activities. This assumption seems unrealistic in water-scarce regions since it implies the following: (i) water resources are not quantitatively limited, and (ii) demand inflows can be fully produced and completely covered by the corresponding water requirements (i.e., the IO model assumes that water is always underused). To address this weakness in input–output water applications, we present a method that combines input–output analysis and sustainability criteria by incorporating physical environmental measurements that take into account thresholds in water usage. In particular, the Water Exploitation Index (WEI) evaluates whether water availability is sufficient to satisfy changes in demand in a sustainable or unsustainable way. Application of this index to Spanish water usage shows that services and manufacturing are linked to an unsustainable use of water.
1. Introduction
The importance of water for human consumption and economic activity is unquestionable [1]. A crucial tool for managing water resources and maintaining an adequate level of water for society, especially in dry and arid countries and regions, is hydrographic planning. In the last three or four decades, water has been treated as an essential resource for guaranteeing economic development and maintaining living standards.
Water stress makes it necessary to consider water to be a scarce resource and to focus more strongly on managing demand. Water resources management provides a broad framework for governments to align water use patterns to the needs and demands of its various users, including the environment. Indeed, permanent water shortages give rise to water scarcity, which is driven primarily by the following two factors: (i) water demand, which is largely affected by population trends and socioeconomic developments, and (ii) climate conditions, which govern the availability of renewable freshwater resources and the seasonality of water supply.
Water management has long been a contentious issue in Spain, because some regions suffer severe droughts and because the Mediterranean climate renders water availability strongly seasonal. This traditional debate has led to ongoing discussions regarding the need for an inter-basin transfer policy between Spanish territories (see, for instance, [2] for an overview of water problems in Spain). For one regional water analysis in Spain, [3] used a constrained maximization model to address water scarcity, whereas [4] assessed the technical performance of water utilities from the perspective of sustainability. For the Spanish region of Catalonia, [5] constructed a computable general equilibrium model and analyzed the environmental and economic impact of alternative water-management policy instruments from both the supply and demand perspectives. [6] analyzed the impact on water availability in the Catalan economy of two of the main challenges faced by agriculture in Europe, i.e., technological changes and the application of the cost-recovery principle to water services. Their study, which was based on a computable general equilibrium model, took into account the economic, social, and ecological consequences of water measures. The results of the study suggested that greater economic efficiency was not necessarily optimal if social or environmental criteria were considered. More recently, [7] proposed a new method for decomposing temporal changes in water use intensity into various explanatory factors and showed an empirical application of this method to water usage in Catalonia.
Water resources in Spain have also been analyzed using input–output (IO) methods. The input–output model is an analytical framework that was first proposed by Leontief [8]. Through a system of linear equations, it defines the sectoral relations of an economy by capturing interdependence within the production system. Specifically, the application of this model requires the use of an input–output table, a database for a geographic region or country that reflects the activity of all industries. In this table, there is detailed information of the consumption of goods made by all sectors from other sectors (inputs) and the production of goods used by other sectors (outputs) or by final demand, i.e., private consumption, public consumption, investment, and exports. For example, [9] used an input–output model based on the hypothetical extraction method and analyzed the behavior of Spanish productive sectors as direct and indirect water consumers. [10] presented an input–output model of sectoral water consumption using the concept of water embodiment. [11] constructed an input–output price model and showed that a tax on the water used by sectors considerably reduced intermediate water consumption and increased production and consumption prices. [12] disaggregated the agricultural sectors into irrigated and unirrigated farming, which enabled them to take into account improvements in irrigation efficiency and the various payment scenarios that affected direct users, exporters and end-users. For the Catalan economy, [13] used the IO model and analyzed how the region’s water distribution was affected by changes in both final demand and the technological requirements of water by sectors of production. [14] used the input–output model and quantified the contribution of final consumption in IO structural path analysis and provided an application to water usage in Catalonia.
Internationally, [15] dissected Australia’s annual water use by employing input–output techniques and incorporating the embodied water concept and concluded that the urban population was mainly responsible for the environmental damage caused by inappropriate water use. [16] discussed the advantages of combining process-based water footprints with information from input–output techniques and presented a comprehensive and systematic outline of potential policy applications of environmental multi-region input–output analysis. [17] investigated water relationships in Macedonia using input–output linkage analysis (backward and forward linkages) and concluded that agriculture was the major water-consuming sector. [18] evaluated the patterns of water consumption in European Union countries using an accounting indicator of water intensity and an application of a subsystem input–output model. More recently, [19] proposed a multi-regional input–output model using the world input–output database (WIOD). The main results were that most increases in water usage between 1995 and 2008 mainly affected the water resources of developing countries but that an increasing share of the water used in water-rich countries such as China, Brazil, Canada, India, and Indonesia was devoted to sustaining consumption in developed countries. Moreover, increasing water consumption rates seemed to be completely unsustainable in the medium-to-long term.
According to the input–output theory, multipliers rely on unemployed resources that enable output to always expand when exogenous demand also expands. However, this may be an unrealistic assumption in the case of water analyses, especially when it comes to water-scarce economies, since it implies an infinite amount of water is available to cover the increases in production. For these situations, it appears necessary to relax the excess capacity inherent to the input–output model so that reasonable and realistic water constraints can be considered. To the best of our knowledge, however, all IO water applications have (inherently) assumed that water resources were not completely employed and that all demand inflows could be automatically covered by using a larger amount of water. In this article, we address this issue and aim to improve the assumption of water availability by considering thresholds to water use that meet sustainability criteria (i.e., the thresholds are defined to achieve sustainability). In particular, our method explores whether existing natural stocks of water provide a flow that satisfies changes in demand in a sustainable or unsustainable manner. To do so, we calculate the Water Exploitation Index (WEI), which measures the country’s annual freshwater use as a percentage of its long-term annual renewable freshwater resources. Applying the model to Spanish water uses, reveals its usefulness for addressing sustainability issues and highlights the extent to which services endanger water sustainability.
The rest of this paper is organized as follows: In the next section, we present the methodological framework used in the analysis of water sustainability; in Section 3, we describe the databases used and the study area; in Section 4, we present the empirical results on Spanish water uses’ and in the final section, we discuss the findings and draws several conclusions.
2. Method
2.1. Input–Output Model of Water Usages
The use of renewable resources follows sustainability criteria if those resources are used in a way that satisfies the requirements for withdrawals. This occurs when extractions are less than or equal to natural replacement. Sustainable water use, therefore, does not reduce the ability of the ecosystem to continue providing the processes, services, and goods used by society [20].
Let rki define the annual amount of renewable resource k used by industry or household i in a country or region. The units associated with rki are in physical terms (in this case, cubic hectometers of water per year). Column vector rk accounts for the annual renewable resource used by each sector or agent i in biophysical terms:
where i = 1, 2, …, n; n is the number of users; and superscript ”T” is the transposition of the original (column) vector, which is transformed into a row vector. The total amount of resource k used annually, Rk, is the sum of the annual uses by industries and households, that is:
rkT = (rk1, rk2, …, rkn),
Rk = Σi rki; ∀ k.
According to the input–output theory, output multipliers rely on the existence of unemployed resources that enable output expansions when demand changes. Therefore, if there is an exogenous change in final demand, the model assumes that the resources required to satisfy the increased final demand are always available.
When applied to environmental issues, the (inherent) input–output assumption of full capacity implies there is a perfectly adaptable quantity of natural resources. In other words, the IO framework assumes there is no restriction or limitation in the quantity of environmental goods to be used and, accordingly, this model does not take into account sustainability issues. To address this question, and considering the ecological preservation of natural goods, the sustainable use rate can be derived from analytical biophysical measurements of the renewable resources over time. If the use rate is less than (greater than) growth, the inventory will increase (decrease) and the renewable resource will be used sustainably (unsustainably). Thus, at any given stock, a sustainable use rate is equal to or lower than the growth rate. Resource scarcity can be defined with respect to the requirement to maintain or increase the (given) level or stock of natural capital. A decrease in this stock (i.e., the use rate is greater than the growth rate) violates sustainability and implies that the renewable resource is becoming scarce in biophysical terms.
In what follows, the technical coefficients of resource extraction (cki) define a relationship between the annual use in physical terms (rki) of natural resource k and the ith industry’s total output in monetary terms (xi):
cki = rki/xi; ∀ k.
Using this definition, we can rewrite Equation (1) as:
and Equation (2) as:
rkT = (ck1x1, ck2x2, …., cknxn),
Rk = Σickixi; ∀ k.
The input–output model defines sectoral production by assuming a linear (and constant) structure of intermediate transactions plus an exogenous sectoral final demand (private and public consumption and exports). By assuming that the users of water correspond to sectors of production, the gross output in sector n (Xn) can be written as:
where xnj are sector j’s intermediate consumption of products from sector n, and Yn is the amount of final demand for n’s production (including private consumption, public consumption, investment, and exports). By defining the input–output technical coefficients (aij) as the (constant) relationship between the (monetary) intermediate consumption (xij) and the total sectoral output (xj) (aij = xij/xj), Equation (6) transforms to:
xn1 + xn2 + ... + xnn + Yn = Xn,
an1x1 + an2 x2 + ... + ann xn + Yn = Xn.
Using matrix notation and discrete time differences, increases in sectoral production can be obtained as [21]:
where Δy is a column vector of dimension n × 1 (where n is now the number of productive sectors) that contains the increases in final demand; Δx is a column vector of dimension n × 1 made up of the increases in sectoral output; and (I − A)−1 is the Leontief inverse matrix, or the matrix of multipliers, in which each element lij shows the change in the output of sector i if sector j receives an additional and unitary demand inflow. In addition, in Equation (8), A is the matrix of input–output technical coefficients (aij),
Δx = (I − A)−1 Δy,
By inserting Equation (8) into Equation (5) and defining discrete time variations, it follows that:
where ckT = (ck1, ck2, …, ckn). Equation (9) defines the total change in the use of resource k for any given exogenous change in final demand. Notice that the product ckT (I − A)−1 defines a row vector of the resource k extraction multipliers which, being measured in physical terms, implies that the interpretation should be in physical terms rather than the (usual) monetary terms.
ΔRk = Σi cki Δxi = ckT Δx = ckT (I − A)−1 Δy,
2.2. Water Exploitation Index
The European Environmental Agency [22] used the Water Exploitation Index (WEI) as an indicator to assess the degree of stress suffered in a river basin. This index is obtained as the average freshwater annual demand with respect to the long-term mean annual freshwater resources.
The WEI illustrates the pressure on renewable freshwater resources in a region (e.g., a country or a river basin) in a certain time period (e.g., a season or a year) due to human water use. It provides a measure of total water usage as a percentage of the renewable freshwater resources for a given territory and time scale. It quantifies how much water is abstracted monthly, annually, or seasonally and how much water is returned to the environment via basins. The difference between water abstraction and water return is regarded as water use. Units of measurement of WEI are given as percentages (i.e., water use as a percentage of total renewable water resources). Specifically, the Water Exploitation Index can be calculated from the Equation (10) [23]:
where AB are water abstractions, i.e., the volume of water intake for a particular use (i.e., agrarian, urban, or industrial), RT are the water returns (i.e., the volume of water that returns to the environment after use), and RFR is the total renewable freshwater resource.
The novelty of this paper is to link the WEI index with the input–output methodology. Thus, an alternative definition for Equation (10) can be given by:
In Equation (11), the difference between total abstractions (AB) and total returns (RT) is equal to total water usage in a given time period (Rk = ckT (I − A)−1 y = Σi cki xi). Equation (11), therefore, integrates the IO model into a sustainability index that enables us to calculate the amount of (physical) natural resources used in relation to total renewable freshwater resource (RFR). Total water resources are determined by an economy’s hydrographic characteristics. These resources positively depend on precipitation and external water inflows and negatively depend on outflow to water downstream, flows to the sea, and evapotranspiration. Finally, changes in storage (lakes and reservoirs) also (positively or negatively) contribute to total freshwater resources.
Taking as a reference the actual values for the WEI index provided by [23], the input–output model allows us to obtain new (simulated) values for that index that may come from changing some of the model’s variables in Equation (11), such as a new final demand (). The difference between both values for the Water Exploitation Index (i.e., − ) provides a quantification of the different pressures on water resources from different sectors of production and the different consequences on water sustainability.
To assess pressure on water resources, the international consensus is to use the Water Exploitation Index to identify areas that have high abstraction levels on a seasonal scale in relation to available resources, and therefore are prone to water stress and water scarcity. Moreover, changes in WEI illustrate how changes in water usage affect the sustainability of freshwater resources (i.e., by putting water under pressure or making water use more sustainable).
As well as percentage changes in the WEI, several (absolute) limits for this indicator can be defined to detect borderline situations and discriminate between sustainable and unsustainable water usage. [24] suggested that a WEI value of over 20% should indicate water scarcity, while a value of over 40% should indicate severe water scarcity. These thresholds are commonly used in scientific studies (see, for instance, [25]) and have been adopted by the European Environment Agency [26]. The empirical application in this paper uses a WEI threshold of 20% to distinguish between stressed and unstressed areas.
3. Study Area and Data Sources
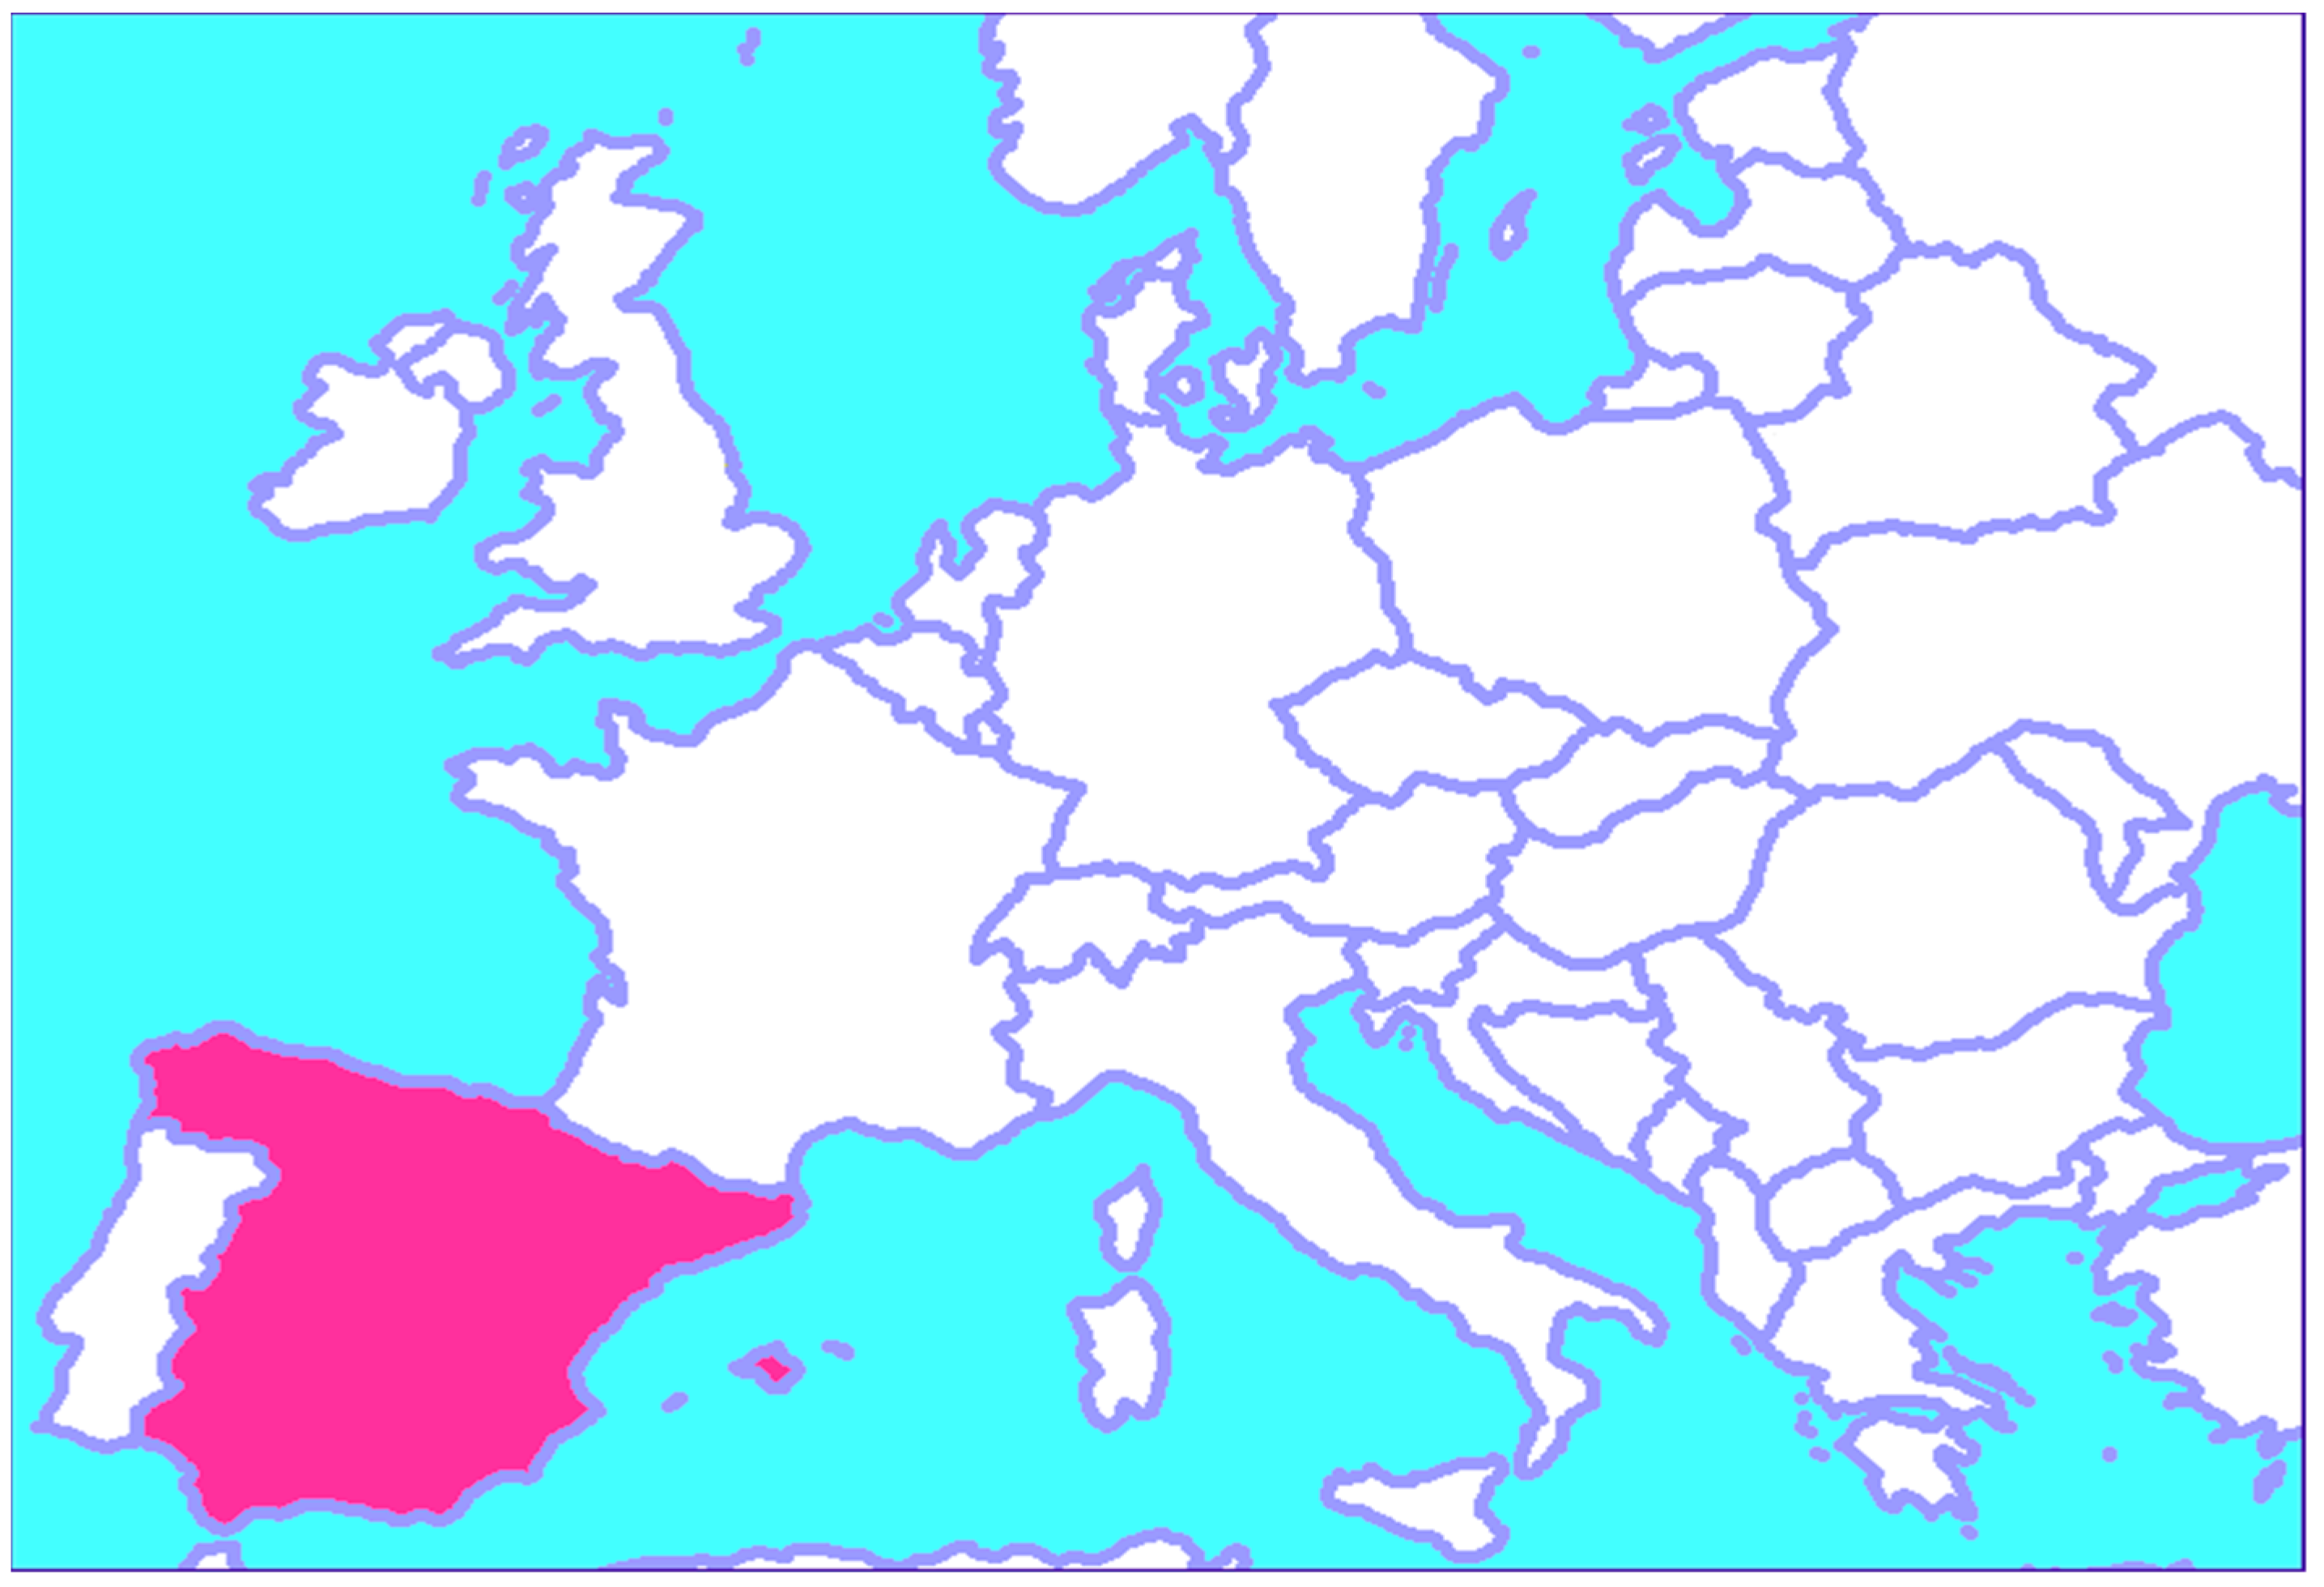
Our empirical application evaluates the sustainability of water uses in Spain (see Figure 1). This country has a typical Mediterranean climate characterized by water deficit during the hottest times of the year. In Spain, rain is seasonally distributed and precipitations in summer are few. In fact, in recent decades, water unavailability has led to emergencies in some Spanish regions, especially in the coastal areas where tourist activity is significant mainly during the driest months of the year. This problem of water scarcity is also acute in certain large cities and metropolitan areas with large populations and important economic activity during the annual periods of drought (e.g., Madrid and Barcelona). Table 1 shows some data for Spain in the three years analyzed.
Our empirical analysis uses an input–output table for the Spanish economy that covers a full decade (2005–2015) as well as three individual years (2005, 2010, and 2015). This database, which is available from the Spanish National Statistics Office [27] originally contains the symmetric input–output tables for the Spanish economy valuated at basic prices. The empirical application also uses physical water usage by sector of production (ri), which is obtained from Eurostat [28] and contains water use by production sector in million cubic meters. Since water statistics are limited to showing six sectors of production, the IO tables are aggregated to match this sectoral detail.
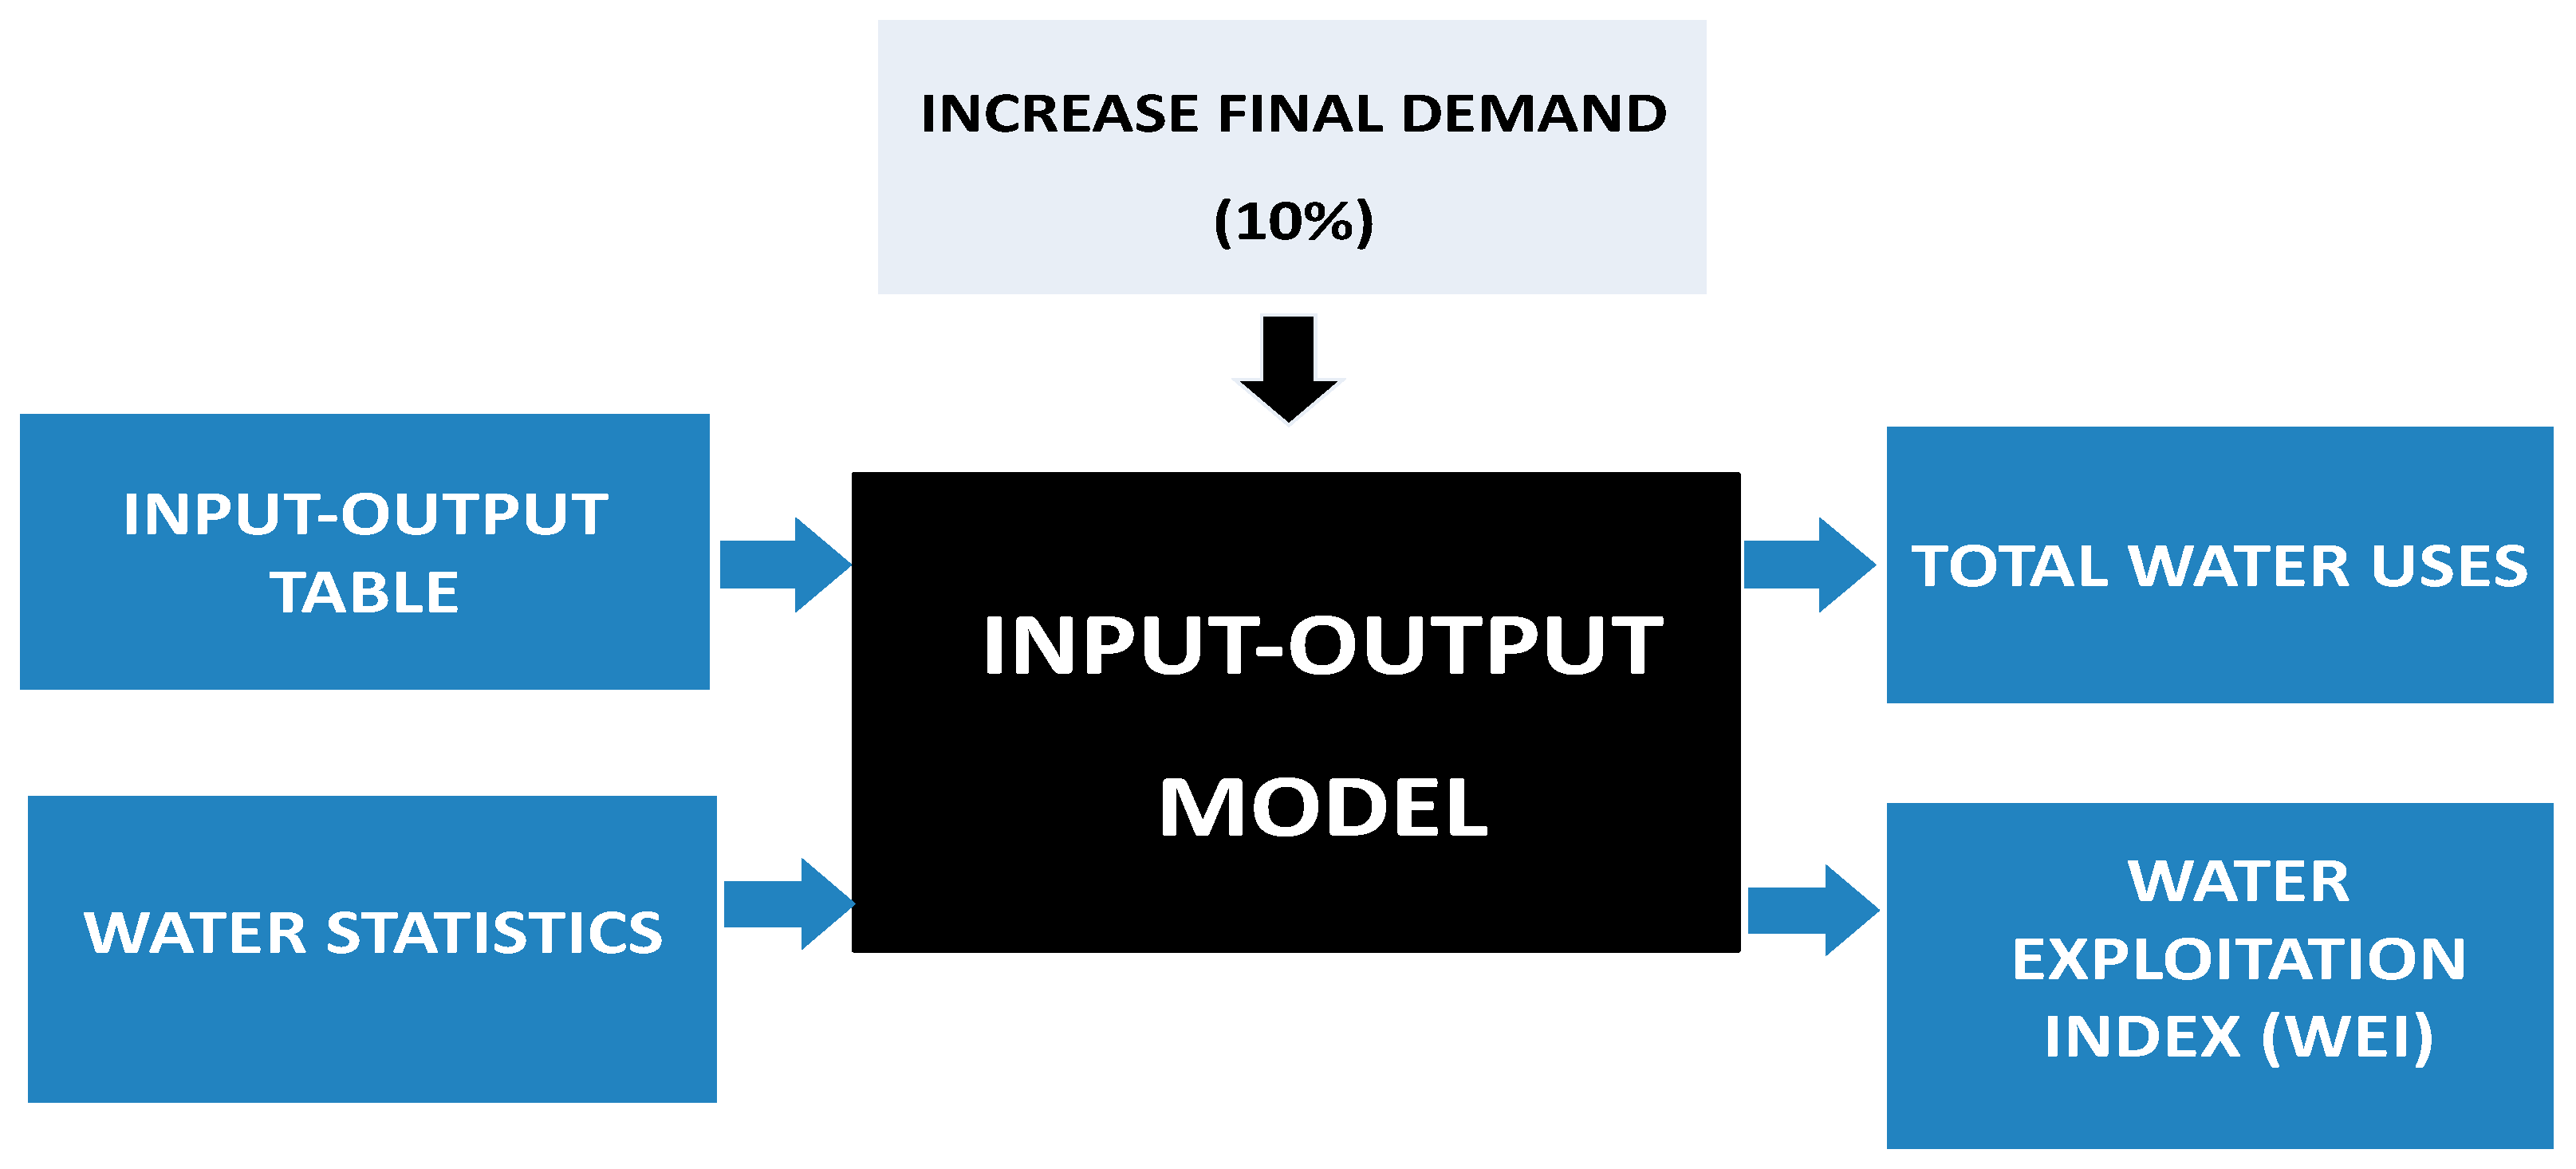
Figure 2 illustrates the flowchart of the method used. The Spanish input–output table and sectoral water statistics are the basis of the input–output model for water issues. After applying an increase (10%) in water demand by all sectors of production, the model provides new values for water usages and, additionally, the Water Exploitation Index is calculated.
According to the European definitions, the water database shows public water supply corresponding to the “water supplied by economic units engaged in collection, purification and distribution of water (including desalination of sea water to produce water as the principal product of interest and excluding treatment of wastewater solely in order to prevent pollution)” [29]. Total water used comes from water abstracted directly from the environment for own use (self-supply) and water received by distributors (e.g., public water supply and irrigation systems) through systems of pipes (water mains), but other means of transportation are also possible (such as artificial open canals and trucks). Wastewater for further use received from another economic units also are included.
Eurostat water use statistics only include “public water supply” and “self and other water supply”, but do not include “other supply, i.e., all system operation for agricultural irrigation which are not individual irrigation systems”. Although the unavailability of this data is a limitation of the model, (according to the Spanish statistics office (INE), irrigated agriculture in Spain consumed 14,944.7 hm3 of water in 2015 (https://www.ine.es/prodyser/espa_cifras/2019/8/). Despite being the most important water destination, the present study does not consider this item to match the European database. The results must therefore be interpreted taking into account the absence of agricultural irrigation water in the analysis.) the analysis of water used by the rest of the economic sectors allows us to detect some sectoral outcomes, such as the importance of services and manufacturing. Despite these limitations, the value of the present model is the combination of input–output analysis and sustainability criteria, by incorporating physical environmental measurements (the Water Exploitation Index) that take into account thresholds in water usage.
4. Results
4.1. Sectoral Water Use in the Spanish Production System
Table 2 shows the (physical) water coefficients (ci) for the three years and six sectors of production analyzed. Notice that since output is expressed in monetary units (millions €) and water uses are expressed in physical uses (cubic hectometers), the resulting water coefficients are cubic hectometers per million €. The total values show that services and manufacturing are the highest water consumers in physical terms, while the technical coefficients show that agriculture and electricity have the highest values. Annual comparisons show that agriculture, mining, manufacturing, and electricity clearly reduced their water uses in relation to total output between 2005 and 2015. This could indicate greater efficiency in water usage and water management in those sectors and a reduction in water requirements in relation to sectoral production. Construction and services show a mixed trend as their water usage coefficient was lower in 2010 than in 2005 but increased again in 2015.
The water coefficients measure sectoral water intensity, which can be viewed an indicator of resource usage efficiency. Note that for sectors of production, the water coefficients comprise not only economic behaviors related to services provided by water (e.g., cleaning and sanitizing), but also technical issues related to production requirements (e.g., water requirements as inputs or raw materials to be transformed) and ecological behaviors (e.g., desalination processes or strategies for recycling grey waters).
4.2. Water Use Sustainability
The water coefficients illustrate a wide range of economic, technological, and ecological phenomena at the sectoral level. However, water resource analysis should define threshold levels for distinguishing between situations that are sustainable or unsustainable in relation to water usage. The Water Exploitation Index indicates the degree of sustainability with regard to water use, since it shows the pressure exerted by water withdrawal on water resources. This index is in fact a relative measure of water usage, since it relates water consumption by agents and individuals to total water availability. This information is useful for management issues as well as for efficiency policies aimed at preserving hydrological resources.
Table 3, Table 4 and Table 5 show the water used by the Spanish production system when sectoral final demand increases. Specifically, the input–output model quantifies by how much the amount of water used increases when the final demand in each sector is iteratively increased by 10%. In practical terms, individual (sector by sector) simulations are applied to the IO model to obtain the new amount of water required.
The left-hand columns in Table 3, Table 4 and Table 5 show the total water usage (i.e., real data) for the Spanish production system. The relative importance of water use shows that services and manufacturing had the strongest influence, jointly representing 87% (2005), 90% (2010), and 94% (2015) of total water consumption. The other columns in Table 3, Table 4 and Table 5 show the results of applying individual simulations (one-by-one) of increases in sectoral demand. For example, the first value in the agriculture column in Table 3 shows that a 10% increase in final demand by agriculture would imply a consumption of 51.36 cubic hectometers of water by that activity, while the same increase in final demand by mining would imply a consumption of 15.82 cubic hectometers. The remaining values would be interpreted in the same way.
In the three years analysed, the most influential sectors (i.e., those that cause the greatest increase in total water consumption) after receiving demand inflows were services, manufacturing, and construction (in that order). Interestingly, however, in those three years, the simulated values for total water usage were similar, which suggested parallel impacts on total water pressure after the increase in demand in all sectors of production.
For further insight into the underlying mechanisms governing water consumption in Spain, Table 6 shows the Water Exploitation Index corresponding to increased sectoral demand. The amount of renewable freshwater resources (RFR) required to calculate the WEI was obtained from [29]. The information provided by the Water Exploitation Index illustrates how water sustainability is affected by the demand inflows received by sectors. Since WEI is calculated for a country’s total water consumption, it considers water usage by the production system as well as by households.
Table 6 shows that the water consumption of final users is more than double that of the production system and that this result is reproduced in every year analyzed. Since we are focusing on the production system, the simulation analysis in Table 6 assumes that the contribution to WEI made by household water usage is fixed, and therefore the total changes are assumed to be exclusively caused by sectoral demand inflows.
The first interesting value in Table 6 is total WEI, which was 34.20% in 2005, 31.80% in 2010, and 28.40% in 2015. These values are clearly above 20%, which is the threshold chosen to define sustainability in water use, and therefore demonstrate that Spanish water consumption is (unquestionably) in a pressure situation. The decreasing values in these years may indicate an improvement in water sustainability over the period analyzed. However, despite this positive trend, we cannot say that the pattern of Spanish water usage is sustainable. It is, therefore, crucial to develop a new water policy aimed at preserving water for firms and individuals.
Table 6 also shows that a 10% increase in final demand for services would lead to increases in WEI of 0.58%, 0.48%, and 0.58% in 2005, 2010, and 2015, respectively, while a 10% increase in final demand for manufacturing would lead to increases of 0.37%, 0.29%, and 0.28%, respectively. However, an increase in final demand for the other sectors would not significantly affect the Water Sustainability Index.
These results suggest, on the one hand, that the economic sectors with the greatest possibilities for generating unsustainable water consumption in Spain are services and manufacturing. On the other hand, water consumption by agriculture, mining, construction, and electricity would lead to fewer increases in the sustainability indicator. If we compare Table 2 and Table 6, we can see how important it is to move forward the input–output relations and take into account the preservation of natural resources. In the Spanish production system, the most important consumers of water in relation to its output (i.e., the sectors with the highest water coefficients) do not coincide with those activities that have the greatest effect on water sustainability. More specifically, although agriculture and electricity showed the greatest water intensity, the main pressure on hydrological resources was produced by services, which is the sector that most endangers water sustainability.
The similarity between the results in 2005, 2010, and 2015 reinforces the reliability of the outcomes, since it suggests that the WEI analysis is robust for the temporal period considered. Additionally, the sectoral asymmetric impacts on the Water Exploitation Index indicate that industrial and sectoral planning in Spain cannot be separated from water management issues. As the various sectors exert different levels of pressure on water resources and have different consequences for water sustainability, the production system and the sectoral specialization cannot be disregarded by the Spanish water policy.
5. Discussion
This paper uses the input–output (physical) model of water usage to analyze sectoral water usage in the Spanish production system. As is well known, the IO model assumes full capacity, which when applied to water issues, means that water is elastically supplied. To address this drawback and promote realism in relation to water constraints, we integrate IO outcomes with measures showing the degree of sustainability in water usage or, more precisely, the level from which water is unsustainably consumed. This method determines whether the current level of extraction is sustainable. By assuming that resource usage is proportional to production, our analysis completes the input–output environmental framework with ecological issues focused on sustainability criteria. Specifically, we show that an economy can be studied in terms of how far final demand can increase without threatening the level of natural resources.
The application to Spanish water usage shows that inflows to industries, modeled via a 10% increase in final demand for each sector, can lead to unsustainable water usage. An interesting outcome, in this paper, is the significant role of services and its potential to worsen both water availability and water preservation. Apart from the (well-known) significance of agriculture and electricity in water usage, our findings should be further investigated by taking into account the relative increase in the importance of services in developed economies and how this trend could threaten water sustainability. Additionally, the results reported in this paper could facilitate the accurate allocation of environmental responsibilities in relation to water resources, since the sectoral water pressure is individually identified.
Future research beyond the scope of this paper should extend this model to include how water supply would certainly be affected by climate change. In a Mediterranean country such as Spain, any potential changes in demand would also need to be considered together with potential changes in water supply and efficiency mechanisms of consumption, especially to ensure that enough water is available for society. All these aspects of water issues will also warrant new research in the foreseeable future. Finally, new, detailed, and updated databases are indispensable for conducting water analyses from which to obtain accurate data on water sustainability.
Author Contributions
Á.C. collected the data, performed the empirical calculations, and devised the paper’s conceptualization; M.L. designed the methodology and validated the results. Both authors prepared the manuscript, read the submitted version, and agreed on the paper’s content. All authors have read and agreed to the published version of the manuscript.
Funding
This research was funded by the Spanish Ministry of Economy and Competitiveness and the European Regional Development Fund, grant number ECO2016-75204-P AEI/FEDER-UE. The second author also received funding from the Universitat Rovira i Virgili, grant PFR2020.
Informed Consent Statement
Not applicable.
Data Availability Statement
The data presented in this study are available on request from the corresponding author. The data are not publicly available due to formatting and processing reasons.
Conflicts of Interest
The authors declare no conflict of interest.
References
- UNESCO. Managing Water under Uncertainty and Risk. UN Water Reports. 2012. Available online: http://unesdoc.unesco.org/images/0021/002156/215644e.pdf (accessed on 20 May 2020).
- Sánchez-Martínez, M.T.; Rodríguez-Ferrero, N.; Salas-Velasco, M. La gestión del agua en España. La unidad de cuenca. Rev. Estud. Reg. 2011, 92, 199–220. [Google Scholar]
- Bielsa, J.; Duarte, R. An Economic Model for Water Allocation in North Eastern Spain. Intern. J. Water. Res. Dev. 2001, 17, 397–408. [Google Scholar] [CrossRef] [Green Version]
- Sáez-Fernández, F.; González-Gómez, F.; Picazo-Tadeo, A. Opportunity Costs of Ensuring Sustainability in Urban Water Services. Intern. J. Water. Res. Dev. 2011, 27, 693–708. [Google Scholar] [CrossRef]
- Llop, M.; Ponce-Alifonso, X. A never-ending debate: Demand versus supply water policies. A CGE analysis for Catalonia. Water Policy 2012, 14, 694–708. [Google Scholar] [CrossRef]
- Llop, M.; Ponce-Alifonso, X. Water and agriculture in a Mediterranean region: The search for a sustainable water policy strategy. Water 2016, 8, 66. [Google Scholar] [CrossRef] [Green Version]
- Llop, M. Decomposing the changes in water intensity in a Mediterranean region. Water. Resour. Manag. 2019, 33, 3057–3069. [Google Scholar] [CrossRef] [Green Version]
- Leontief, W. Quantitative input-output relations in the economic system of the United States. Rev. Econ. Stat. 1936, 18, 105–125. [Google Scholar] [CrossRef] [Green Version]
- Duarte, R.; Sánchez-Chóliz, J.; Bielsa, J. Water use in the Spanish economy: An input-output approach. Ecol. Econ. 2002, 43, 71–85. [Google Scholar] [CrossRef]
- Velázquez, E. An input-output model of water consumption: Analysing intersectoral water relationships in Andalusia. Ecol. Econ. 2006, 56, 226–240. [Google Scholar] [CrossRef]
- Llop, M. Economic impact of alternative water policy scenarios in the Spanish production system: An input-output analysis. Ecol. Econ. 2008, 68, 288–294. [Google Scholar] [CrossRef]
- Cazcarro, I.; Duarte, R.; Sanchez Chóliz, J.; Sarasa, C. Water rates and the responsibilities of direct, indirect and end-users in Spain. Econ. Syst. Res. 2011, 23, 409–430. [Google Scholar] [CrossRef]
- Llop, M. Water reallocation in the input–output model. Ecol. Econ. 2013, 86, 21–27. [Google Scholar] [CrossRef]
- Llop, M.; Ponce-Alifonso, X. Identifying the role of final consumption in structural path analysis: An application to water uses. Ecol. Econ. 2015, 109, 203–210. [Google Scholar] [CrossRef] [Green Version]
- Lenzen, M.; Foran, B. An input-output analysis of Australian water usage. Water Policy 2001, 3, 321–340. [Google Scholar] [CrossRef]
- Daniels, P.; Lenzen, M.; Kenway, S. The ins and outs of water use—A review of multi-region input-output analysis and water footprints for regional sustainability analysis and policy. Econ. Syst. Res. 2011, 23, 353–370. [Google Scholar] [CrossRef]
- Hristov, J.; Martinovska-Stojceska, A.; Surry, Y. Input-output analysis for water consumption in Macedonia. In Proceedings of the Management of International Water, Colombo, Sri Lanka, 22–23 November 2012; pp. 1–33. [Google Scholar]
- Di Cosmo, V.; Hyland, M.; Llop, M. Disentangling water usage in the European Union: A decomposition analysis. Water. Resour. Manag. 2014, 28, 1463–1479. [Google Scholar] [CrossRef] [Green Version]
- Arto, I.; Andreoni, V.; Rueda-Cantuche, J.M. Global use of water resources: A multiregional analysis of water use, water footprint and water trade balance. Water. Resour. Econ. 2016, 15, 1–14. [Google Scholar] [CrossRef] [Green Version]
- Martínez de Anguita, P.; Wagner, J.E. Environmental Social Accounting Matrices: Theory and Application; Routledge Studies in Ecological Economics, Routledge Press: London, UK, 2010. [Google Scholar]
- Miller, R.E.; Blair, P.D. Input-Output Analysis: Foundations and Extensions, 2nd ed.; Cambridge University Press: Cambridge, UK, 2009. [Google Scholar]
- European Environment Agency. The European Environment—State and Outlook 2005; European Environmental Agency: Copenhagen, Denmark, 2005. [Google Scholar]
- European Environment Agency. Use of freshwater resources in Europe. Available online: https://www.eea.europa.eu/data-and-maps/indicators/use-of-freshwater-resources-3/assessment-4 (accessed on 20 May 2020).
- Raskin, P.; Gleick, P.H.; Kirshen, P.; Pontius, R.G., Jr.; Strzepek, K. Comprehensive Assessment of the Freshwater Resources of the World; Document prepared for UN Commission for Sustainable Development 5th Session; Stockholm Environmental Institute: Stockholm, Sweden, 1997. [Google Scholar]
- Alcamo, J.; Henrich, T.; Rosch, T. World Water in 2025—Global Modelling and Scenario Analysis for the World Commission on Water for the 21st Century; Report A0002, Centre for Environmental System Research; University of Kassel: Kassel, Germany, 2000. [Google Scholar]
- CIRCABC. Informal Meeting of Water and Marine Directors of the European Union. Candidate and EFTA Countries. 2012. Available online: https://circabc.europa.eu/sd/a/981c1845-a59e-4f94-8770-fc5cd0626fee/Final%20synthesis%20Heraklion%20Water%20Marine%20Directors%20clean.pdf (accessed on 20 December 2019).
- National Statistical Institute of Spain (INE). Input Output Tables (IOT) for Spain. Available online: https://www.ine.es/dyngs/INEbase/es/categoria.htm?c=Estadistica_P&cid=1254735570541 (accessed on 20 December 2019).
- Eurostat. Data Collection Manual for the OECD/Eurostat. Join Questionnaire on Inland Waters and Eurostat Regional Water Questionnaire. Concepts, Definitions, Current Practices, Evaluations and Recommendations. 2018. Available online: https://ec.europa.eu/eurostat/ramon/statmanuals/files/OECD_ESTAT_JQ_Manual_version_4_2018.pdf (accessed on 20 September 2020).
- Eurostat. Water Statistics. Available online: https://ec.europa.eu/eurostat/statistics-explained/index.php/Water_statistics#Water_uses (accessed on 20 May 2020).
Figure 1.
Map of Spain. (Available at: http://cmap.unavarra.es/rid=1QTS39HDW-1DQWXSC-1NG/España%20en%20Europa.gif).
Figure 1.
Map of Spain. (Available at: http://cmap.unavarra.es/rid=1QTS39HDW-1DQWXSC-1NG/España%20en%20Europa.gif).

Figure 2.
Flowchart of the method used.


Table 1.
Data for Spain.
| 2005 | 2010 | 2015 | |
|---|---|---|---|
| Population (inhabitants) | 43,296,335 | 46,486,621 | 46,449,565 |
| Area (Km2) | 505,990 | 505,990 | 505,990 |
| GDP: total (million euros) | 927,357 | 1,072,709 | 1,077,590 |
| GDP: per capita (euros/inhabitant) | 21,418.8 | 23,075.6 | 23,199.1 |
Source: Spanish Statistics Office (INE).
Table 2.
Technical coefficients of water usage. Spain (2005, 2010 and 2015).
| 2005 | 2010 | 2015 | |||||||
|---|---|---|---|---|---|---|---|---|---|
| Water Use (ri) | Output (Xi) | Coeff. (ci) | Water use (ri) | Output (Xi) | Coeff. (ci) | Water Use (ri) | Output (Xi) | Coeff. (ci) | |
| Agriculture | 49.40 | 48,799 | 0.00101 | 54.10 | 51,688 | 0.00105 | 23.08 | 60,563 | 0.00038 |
| Mining | 15.80 | 72,193 | 0.00022 | 4.30 | 85,707 | 0.00005 | 2.70 | 77,606 | 0.00003 |
| Manufacturing | 485.40 | 634,164 | 0.00077 | 360.10 | 618,895 | 0.00058 | 360.89 | 692,173 | 0.00052 |
| Construction | 48.30 | 273,682 | 0.00018 | 8.50 | 216,290 | 0.00004 | 14.02 | 145,857 | 0.00010 |
| Electricity | 57.18 | 39,936 | 0.00143 | 28.50 | 79,913 | 0.00036 | 28.70 | 80,776 | 0.00036 |
| Services | 641.80 | 974,667 | 0.00066 | 555.60 | 1,267,198 | 0.00044 | 792.52 | 1,284,391 | 0.00062 |
Total Output in millions €. Water use in hm3.
Table 3.
Water usage (hm3) after a 10% increase in sectoral final demand (2005).
| Water Use | 10% Increase in Final Demand | ||||||
|---|---|---|---|---|---|---|---|
| Agriculture | Mining | Manufacturing | Construction | Electricity | Services | ||
| Agriculture | 49.40 | 51.36 | 49.40 | 51.31 | 49.73 | 49.40 | 50.13 |
| Mining | 15.80 | 15.82 | 16.33 | 16.14 | 15.93 | 15.88 | 16.28 |
| Manufacturing | 485.40 | 485.85 | 485.47 | 519.31 | 491.08 | 485.48 | 493.75 |
| Construction | 48.30 | 48.31 | 48.30 | 48.39 | 52.47 | 48.30 | 48.86 |
| Electricity | 57.18 | 57.24 | 57.22 | 58.65 | 57.59 | 58.64 | 59.48 |
| Services | 641.80 | 642.02 | 641.92 | 647.33 | 644.69 | 641.95 | 697.06 |
| TOTAL | 1297.88 | 1300.60 | 1298.65 | 1341.14 | 1311.49 | 1299.66 | 1365.56 |
Table 4.
Water usage (hm3) after a 10% increase in sectoral final demand (2010).
| Water Use | 10% Increase in Final Demand | ||||||
|---|---|---|---|---|---|---|---|
| Agriculture | Mining | Manufacturing | Construction | Electricity | Services | ||
| Agriculture | 54.10 | 56.38 | 54.11 | 56.24 | 54.31 | 54.11 | 54.86 |
| Mining | 4.30 | 4.30 | 4.49 | 4.39 | 4.33 | 4.33 | 4.39 |
| Manufacturing | 360.10 | 360.50 | 360.20 | 386.86 | 362.52 | 360.24 | 366.29 |
| Construction | 8.50 | 8.50 | 8.50 | 8.52 | 9.24 | 8.50 | 8.59 |
| Electricity | 28.50 | 28.52 | 28.52 | 29.18 | 28.74 | 29.38 | 29.50 |
| Services | 555.60 | 555.80 | 555.72 | 559.81 | 558.14 | 555.83 | 603.86 |
| TOTAL | 1011.10 | 1014.01 | 1011.54 | 1045.00 | 1017.28 | 1012.39 | 1067.49 |
Table 5.
Water usage (hm3) after a 10% increase in sectoral final demand (2015).
| Water Use | 10% Increase in Final Demand | ||||||
|---|---|---|---|---|---|---|---|
| Agriculture | Mining | Manufacturing | Construction | Electricity | Services | ||
| Agriculture | 23.09 | 24.16 | 23.09 | 24.02 | 23.16 | 23.09 | 23.32 |
| Mining | 2.70 | 2.70 | 2.84 | 2.75 | 2.71 | 2.72 | 2.75 |
| Manufacturing | 360.89 | 361.28 | 360.96 | 389.03 | 362.83 | 361.02 | 366.31 |
| Construction | 14.02 | 14.02 | 14.02 | 14.06 | 15.21 | 14.02 | 14.18 |
| Electricity | 28.70 | 28.73 | 28.73 | 29.43 | 28.91 | 29.69 | 29.60 |
| Services | 792.52 | 792.95 | 792.73 | 799.32 | 795.20 | 792.92 | 861.25 |
| TOTAL | 1221.92 | 1223.83 | 1222.37 | 1258.61 | 1228.02 | 1223.47 | 1297.40 |
Table 6.
Total water usage (hm3) and the Water Exploitation Index (WEI).
| 10% Increase in Final Demand | ||||||
|---|---|---|---|---|---|---|
| 2005 | Agriculture | Mining | Manufacturing | Construction | Electricity | Services |
| All activities | 1300.60 | 1298.65 | 1341.14 | 1311.49 | 1299.66 | 1365.56 |
| Households | 2673 | 2673 | 2673 | 2673 | 2673 | 2673 |
| WEI | 34.20% | 34.20% | 34.20% | 34.20% | 34.20% | 34.20% |
| New WEI () | 34.22% | 34.21% | 34.57% | 34.32% | 34.22% | 34.78% |
| 0.02% | 0.01% | 0.37% | 0.12% | 0.02% | 0.58% | |
| 2010 | Agriculture | Mining | Manufacturing | Construction | Electricity | Services |
| All activities | 1014.01 | 1011.54 | 1045 | 1017.28 | 1012.39 | 1067.49 |
| Households | 2740 | 2740 | 2740 | 2740 | 2740 | 2740 |
| WEI | 31.80% | 31.80% | 31.80% | 31.80% | 31.80% | 31.80% |
| New WEI () | 31.82% | 31.80% | 32.09% | 31.85% | 31.81% | 32.28% |
| – | 0.02% | 0.00% | 0.29% | 0.05% | 0.01% | 0.48% |
| 2015 | Agriculture | Mining | Manufacturing | Construction | Electricity | Services |
| All activities | 1223.83 | 1222.37 | 1258.61 | 1228.02 | 1223.47 | 1297.4 |
| Households | 2454.31 | 2454.31 | 2454.31 | 2454.31 | 2454.31 | 2454.31 |
| WEI | 28.40% | 28.40% | 28.40% | 28.40% | 28.40% | 28.40% |
| New WEI () | 28.41% | 28.40% | 28.68% | 28.45% | 28.41% | 28.98% |
| 0.01% | 0.00% | 0.28% | 0.05% | 0.01% | 0.58% | |
Publisher’s Note: MDPI stays neutral with regard to jurisdictional claims in published maps and institutional affiliations. |
© 2020 by the authors. Licensee MDPI, Basel, Switzerland. This article is an open access article distributed under the terms and conditions of the Creative Commons Attribution (CC BY) license (http://creativecommons.org/licenses/by/4.0/).
Share and Cite
MDPI and ACS Style
Cámara, Á.; Llop, M. Defining Sustainability in an Input–Output Model: An Application to Spanish Water Use. Water 2021, 13, 1. https://doi.org/10.3390/w13010001
AMA Style
Cámara Á, Llop M. Defining Sustainability in an Input–Output Model: An Application to Spanish Water Use. Water. 2021; 13(1):1. https://doi.org/10.3390/w13010001
Chicago/Turabian StyleCámara, Ángeles, and Maria Llop. 2021. "Defining Sustainability in an Input–Output Model: An Application to Spanish Water Use" Water 13, no. 1: 1. https://doi.org/10.3390/w13010001
Note that from the first issue of 2016, this journal uses article numbers instead of page numbers. See further details here.