

Abstract
In this present study, a wet chemical method with environmentally friendly and cost-effective bagasse ash is used to prepare the mesoporous silica structures. Significant amounts of silica (SiO2) (∼75 percent) were measured in the bagasse ash as confirmed by x-ray fluorescence spectroscopy (XRF). The porous silica particles with uniform morphology showed a weight loss of ∼150 to ∼45%. The removal of crystal violet was performed with silica extracted from bagasse ash along with two other silica samples prepared from commercially available sodium silicate and TEOS for comparison purposes. The equilibrium adsorption data followed the Langmuir model for both linear and non-linear adsorption isotherm. The maximum monolayer capacity was found to be 26.53 mg/g. From the Langmuir isotherm, the value of ∆H is (SiO2 (SS) = 0.83, SiO2 (BA) = 5.19, and SiO2 (TEOS) = 3.05), which indicates that the uptake of CV dye on mesoporous silica particles could be attributed to physical adsorption. The positive value of ∆H confirms that the adsorption is endothermic, and the positive value of ∆S indicates a certain structural modification and randomness increases in solid/liquid interface. The respective activation energy values for CV dye adsorption on mesoporous SiO2 (SS), SiO2 (BA), and SiO2 (TEOS) are 0.83, 5.19, and 3.05 kJ mol−1. All values are less than 8, showing that it is corresponding to physical adsorption. The findings further show that silica obtained from the bagasse ash is a cost-effective and equally effective adsorbent for the removal of crystal violet from an aqueous solution.
Export citation and abstract BibTeX RIS

Original content from this work may be used under the terms of the Creative Commons Attribution 4.0 licence. Any further distribution of this work must maintain attribution to the author(s) and the title of the work, journal citation and DOI.
1. Introduction
Over the last two decades, mesoporous silica nanoparticles (MSN), because of their high surface area, tuneable pore size, and easily modified surface, have grown in importance due to their potential application in a broad range of fields such as drug delivery [1–4], adsorption [5, 6], catalysis [7–9] and separations [10–12]. The uniform pore size of MSN plays a key role in determining the molecular size to be absorbed into the mesopores [12]. For practical applications with MSN, the tuneable pore size is therefore extremely significant, particularly for applications involving different sizes of molecules. Many attempts have recently been made to change the pore size of MSN. The appropriate way of changing the pores is to use suitable swelling agents. In the literature, decane [13], trimethyl benzene [14], heptane [15], and hexane [16] were reported as swelling agents that lead to a large micelle size of structure-directing-agents, and as a result the final ordered mesoporous silica materials have a large pore diameter.
Tetraethylorthosilicate (TEOS) is commonly used to synthesize siliceous material using the sol-gel process. Although numerous efforts have been made by authors to investigate condensation and hydrolysis reactions using TEOS as a silicon precursor to prepare xerogels, the rationalization for kinetic mechanisms and kinetic trends is still under discussion. In general, TEOS is used to synthesize silica nanoparticles as a precursor in an alkaline medium [17]. If the concentration of ammonia and TEOS increases, the size of particles increases as well [18]. A sodium silicate (SS) solution, in addition to TEOS, is another cost-effective, commonly used precursor for the synthesis of silica nanoparticles. SS has advantages in comparison to TEOS such as a uniform and refined particle size and high nanoparticle concentrations [19]. Conventionally, an acid medium is used for the synthesis of silica from SS [20, 21]. Both TMOS and SS are relatively expensive methods for the synthesis of silica particles, and careful handling is required to avoid any environmental pollution.
Sugarcane is one of the world's most popular agricultural products. In the sugar cane sector, bagasse is a renewable material extracted from sugar-bearing juice [22]. Factories use it as their primary fuel to generate steam during the processing of sugar. The energy used when burning bagasse produces huge amounts of ash waste and creates environmental waste disposal problems, the production of odours that can affect human health, and the attraction of insect pests that can harm humans, farm animals, and crops. Bagasse ash (BA), however, is rich in silica, with a silica content of between 75 and 90 percent [23, 24].
This work examines the removal of crystal violet (CV) dye by adsorption process. CV is broadly used in textiles, printing ink, and paints. It can persist in a variety of environments and is non-biodegradable. Therefore, the removal of CV from wastewaters is of utmost importance [25–27]. Cationic CV dye is commonly used not only in the textile and paper industries but also in biology, dermatology, and veterinary applications [28]. This dye is harmful if ingested, if inhaled, or if it comes into contact with the skin. It was also found to cause cancer and serious human eye irritation. The removal of dyes from wastewater is a difficult task, as it is resistant to aerobic digestion, light, heat, and oxidizing agents [29–31].
This work presents the synthesis of silica nanoparticles from TEOS, SS and sodium silicate extracted from BA by using low energy and less chemical consumption. The paper is intended to examine the adsorption of basic CV dye using TEOS, SS and BA. Our objective was to assess the effectiveness of BA as a promising sorbent by comparing the adsorption isotherms (correlated with a comparison of linear and nonlinear regression analysis) of silica particles extracted from BA with silica extracted from well-known precursors TEOS, and SS. The adsorption study was performed by selecting different initial concentrations of dye at different temperatures. To calculate the sorption capacities and thermodynamic parameters, sorption data were interpreted using Langmuir, Freundlich, and Temkin models. On both linear and non-linear isotherm, Langmuir isotherm were best fitted on the equilibrium data. CV adsorption on the silica's was found to be well consistent with Langmuir model for non-linear isotherm than the linear model. Thermodynamic parameters, such as enthalpy (ΔH), entropy (ΔS), free energy (ΔG), and activation energy (Ea), have been evaluated and a possible adsorption mechanism was also studied. The values of Ea show that CV uptake by the silica samples is physisorption. The negative value of ΔG indicates that the reaction is spontaneous and favourable, whereas positive ΔH indicates the endothermic nature of the sorption process. The findings of this paper suggest that bagasse ash is an efficient, cost-effective, and promising adsorbent that efficiently removes CV from wastewater.
2. Experimental
2.1. Materials/chemicals
The following chemicals were used as received without any further purification: Hydrochloric Acid (BDH, 35%), Cetyl Trimethyl Ammonium Bromide (CTAB) (99%, Sigma-Aldrich), Hydrogen Peroxide (3% in H2O, Sigma-Aldrich), Sodium Silicate (98%, Sigma- Aldrich), Ethanol (Merch, 98%), Sodium Hydroxide (99.80%, Merck), Methanol (Merck, 98%), Tetraethylorthosilicate (TEOS) (99%, Merck), 3-Aminopropyltriethoxy silane (APTES) (98% Merck), Acetic acid (100%, Merck), Sulfuric Acid (BDH, 98%), Sugarcane bagasse ash (Ashraf Sugar Mill, Bahawalpur-Pakistan), and Acetone (Merck, 98%), Crystal Violet (CV) ACS reagent (98%).
2.2. Instrumentation/methods
To validate the composition of the materials, XRF analysis was performed using JEOL JSX 3202 M (Na-U). The SEM/EDX study was conducted using a JEOL JSM-6490A electron microscope. The XRD analysis was performed using a Philips X 'Pert PRO 3040/60 diffractometer with Cu K5-007 as a source of radiation. The FTIR spectra was recorded with a Nexus 470 spectrometer. A thermal analyzer (SDT Q600 V8.2 Build 100) was used to carry out the thermal tests (TGA/DTA) at a heating rate of 10 °C min−1. Quantachrome NovaWin2 was used for nitrogen adsorption/desorption measurements.
2.3. Extraction of sodium silicate from bagasse ash
The extraction of sodium silicate was carried out by a modification of the procedure as stated in the literature [32]. To oxidise the adherent organic material, the bagasse ash (100 g) was treated with hydrogen peroxide (100 ml) and washed with deionized water. The drying was carried out at 105 °C, and the resulting powder was milled and then sieved below 100 μm. This material was then placed in a vacuum desiccator for further use [33].
2.3.1. Alkali fusion of pre-treated bagasse ash
The alkali fusion process was done to extract sodium silicate from pre-treated bagasse ash in a similar way as reported by [34]. Bagasse ash (75 g) was thoroughly mixed in a china dish with sodium hydroxide (90 g) at a 1/1.2 ratio. The mixture was fused in a controlled muffle furnace at a high temperature (550 °C) for 1 h. The fused bagasse ash powder was then dissolved in deionized water. The resultant mixture was then stirred at 298 K for ∼24 h. The clear solution of sodium silicate was obtained through filtration as a supernatant. This supernatant was also used to make mesoporous silica particles. The supernatant (50 ml) was taken in a china dish and heated to a high temperature (105 °C) in a water bath to obtain a dry mass for further characterization of its components. The EDX study confirmed the presence of sodium silicate in the supernatant.
2.3.2. Synthesis of mesoporous silica particles using sodium silicate extracted from bagasse ash
Nanoporous silica particles have been synthesized by modifying the work as reported in [32, 35]. Cetyltrimethylammonium bromide (CTAB) (0.21 g) in a round-bottom flask was dissolved in deionized water (90 ml) and placed on a magnetic stirrer. A mixture of co-solvents (90 ml) (acetone/ethanol) at a ratio of 8:1 was applied to the above-mentioned mixed CTAB solution. The solution (90 ml) was then added to sodium silicate under strong stirring to the reaction mixture, and aqueous ammonia (3 ml) was added. The resulting reaction mixture was then further stirred at 298 for 3 h. The pH of the reaction mixture was adjusted at 3, 7, 10, and 12 using hydrochloric acid and concentrated acetic acid. The filtrate/product was then washed with an excess of deionized water using a Buckner funnel and Whattman filter paper. The crude product was dried in an oven at approximately 100 °C overnight. Using a muffle furnace, the dried crude product was calcinated at 550 °C for six hours at a heating rate of 10 °C per minute.
2.3.3. Synthesis of mesoporous silica particles using commercial Na2SiO3 and TEOS
Commercial sodium silicate and TEOS were used to synthesize silica particles. The synthesis was performed using a modified procedure as reported in the literature [34]. The levels of the reagents and the synthesis conditions were kept the same as those for silica prepared from sodium silicate (extracted bagasse ash), i.e. aqueous ammonia (3.0 ml), CTAB (0.21 g), (acetone/ethanol at an 8:1 ratio) (90 ml), concentrated CH3COOH, TEOS (1.0 ml) and HCl to adjust the pH. A modified technique, as reported in [35], was used for the synthesis of silica particles from commercial sodium silicate. The silica samples thus obtained from the bagasse source, commercial sodium silicate, and TEOS were labelled as SiO2 (BA), SiO2 (SS), and SiO2 (TEOS) respectively.
2.4. Adsorption study
The adsorption studies were conducted for mesoporous silica particles by using the batch technique. For this purpose, 20 mg of each of the absorbents was taken separately in a 50 ml conical flask. A stock solution of 1000 ppm of dye was prepared by dissolving 1.00 g of dye in 1 l of distilled water. An experimental solution for five concentrations was prepared by diluting a stock solution i.e. 1.25/250 ml, 3.75/250 ml, 7.5/250 ml, and 18.75/250 ml, 25/250 ml. In the various experiment sets, the impact of the temperature on dye adsorption was analysed at different temperatures, notably 293 K, 303 K, and 313 K. The adsorption of CV was observed to increase as the temperature increased.
A UV-1800 Spectrophotometer (SHMADZU) was used for absorbance measurements. The maximum wavelength λmax was measured at 602 nm. A standard calibration curve was constructed to measure concentrations during experimental work. Before the UV spectrophotometric analysis, the absorbent was separated by filtering the dye solution via filtering paper. The adsorbing amount adsorbed by the adsorbent, qe (mg g−1) in equilibrium was estimated by equation (1), whereas the proportion of the dye removal was determined by equation (2).

2.4.1. Adsorption Isotherm
The isotherm typically defines the adsorption mechanism, from which an equation describing the results can be developed. Three balanced isothermal systems have been analysed for the adsorption isotherm: Langmuir, Freundlich, and Temkin. In Langmuir isotherm, monolayer adsorption is assumed on a surface with a small number of adsorption sites with uniform strategies without adsorbing the transmigration to a flat surface [36]. No more sorption can be performed at that site once it is occupied. This indicates that the saturation point on the surface achieves the maximum surface adsorption. An expression of Langmuir adsorption isotherm is shown by,

Where qe is the adsorption capacity (equilibrium concentration), and qm is the maximum adsorption capacity (mg g−1). The linear transformation of the Langmuir adsorption isotherm is given in equation (3), which is used to determine the Langmuir adsorption isotherm constant b and maximum adsorption capacity qm .

Freundlich isothermal adsorption assumes a multiple-layer surface adsorption. The isothermal is an exponential equation given by,

Where KF is the Freundlich constant and an indication of the adsorbent's relative adsorption capacity, while n is a constant that shows the adsorption intensity. The linearized form of Freundlich isothermal adsorption is given in equation (5) and is used to estimate the Freundlich isotherm constants.

The Temkin's isotherm was developed to take into account the effect of indirect adsorbent-adsorbate interactions on adsorption [37]. It assumes that the heat of layer adsorption decreases linearly due to these interactions. The Temkin isotherm is described as,

Where R is the gas constant, KT (L m g−1) and B (J mol−1) are Temkin constants. The linearized form of Temkin isothermal adsorption is given in equation (7), which is used to estimate the Temkin isotherm constants.

3. Results and discussion
3.1. Synthesis of mesoporous silica particles
Mesoporous silica particles (MPSPs) were synthesized using various sources using well-established updated protocols [33, 35]. The key goal was to use the waste of sugar cane, i.e. bagasse ash, to indirectly obtain mesoporous silica particles with mono dispersion and a tuneable pore size, as they have potential applications in various industrial applications, catalysis, and environmental remediation (i.e. water purification), etc. For comparison, the silica particles were also synthesized using pure organic (TEOS) and inorganic (sodium silicate) silica precursors. Synthesized mesoporous silica particles have been characterized by various techniques such as scanning electron microscopy (SEM), x-ray fluorescence spectroscopy (XRF), energy-dispersive x-ray spectroscopy (EDX), and thermogravimetric analysis/differential thermal analysis (TGA/DTA).
3.2. XRF/EDX analysis
To check the suitability, XRF and EDX analyses of bagasse ash and extracted sodium silicate were conducted for the determination of elemental compositions. The XRF analysis of bagasse ash (table 1) revealed the major components such as SiO2, K2O, and CaO, while the other minor components such as SO3, TiO2, Cr2O3, MnO, Fe2O3, CuO, ZnO, and SrO were also identified. The presence of the high silica content was the key reason for the choice of this raw material for the extraction of sodium silicate. The XRF spectrum of bagasse ash is shown in figure 1, whereas figure 2 demonstrates the EDX spectrum for sodium silicate extracted from bagasse ash, which ensures to synthesize silica particles.
Table 1. The elemental composition of bagasse ash as determined by XRF analysis.
| S. No | Elements | Mass (%) | Mole (%) | Oxides | Mass (%) | Mole (%) |
|---|---|---|---|---|---|---|
| 1 | Na | 1.27 | 1.81 | *SiO2 | 75.61 | 80.32 |
| 2 | Mg | 1.36 | 1.84 | SO3 | 3.38 | 2.69 |
| 3 | *Si | 44.48 | 51.99 | Cl | 1.48 | 2.66 |
| 4 | P | 2.15 | 2.27 | K2 O | 13.40 | 9.07 |
| 5 | S | 4.10 | 4.20 | CaO | 3.62 | 4.11 |
| 6 | K | 34.92 | 29.32 | TiO2 | 0.11 | 0.08 |
| 7 | Ca | 7.95 | 6.52 | Cr2O3 | 0.08 | 0.04 |
| 8 | Cr | 0.14 | 0.08 | MnO | 0.042 | 0.038 |
| 9 | Mn | 0.13 | 0.07 | Fe2O3 | 2.12 | 0.084 |
| 10 | Fe | 2.52 | 1.48 | CuO | 0.018 | 0.01 |
| 11 | Cu | 0.06 | 0.03 | ZnO | 0.029 | 0.02 |
| 12 | Br | 0.63 | 0.26 | Br | 0.042 | 0.03 |
| 13 | Sr | 0.24 | 0.09 | SrO | 0.066 | 0.04 |
| 14 | Zr | 0.02 | 0.009 | — | — |
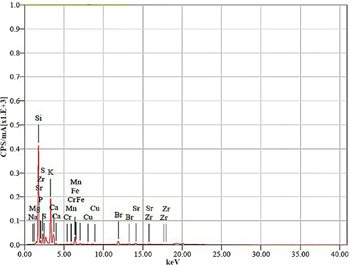
Figure 1. XRF spectrum of bagasse ash.
Download figure:
Standard image High-resolution image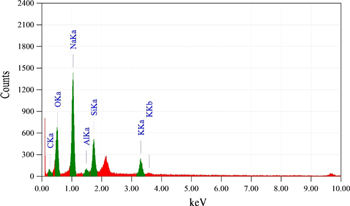
Figure 2. EDX spectrum of sodium silicate extracted from bagasse ash.
Download figure:
Standard image High-resolution imageTable 2. Elemental composition of sodium silicate as extracted from bagasse ash.
| S. No | Elements | Mass (%) | Atom (%) | keV |
|---|---|---|---|---|
| 1 | C | 6.49 | 10.61 | 0.277 |
| 2 | O | 36.65 | 45.02 | 0.525 |
| 3 | Na | 37.25 | 31.84 | 1.041 |
| 4 | Al | 1.89 | 1.38 | 1.486 |
| 5 | Si | 11.36 | 7.95 | 1.739 |
| 6 | K | 6.37 | 3.20 | 3.312 |
| Total | — | 100 | 100 | — |
Table 3. Elemental compositions of the mesoporous silica particles as determined by EDX spectroscopy.
| Element | O (mass %) | Si (mass %) | Na (mass %) | Al (mass %) | Total |
|---|---|---|---|---|---|
| SiO2 (BA) | 48.37 | 49.91 | 0.67 | 1.06 | 100 |
| SiO2 (SS) | 43.52 | 56.48 | — | — | 100 |
| SiO2 (TEOS) | 44.34 | 55.66 | — | — | 100 |
3.3. SEM/EDX analysis of mesoporous silica particles
The SEM/EDX analyses of SiO2 (BA), SiO2 (SS) and SiO2 (TEOS) were performed for the morphology, dimensional distribution and basic compositions of the silicon. Figure 3 displays the SEM images of the SiO2 (BA), SiO2 (SS) and SiO2 (TEOS). The silica particles extracted from the bagasse source were comparatively smaller (∼600 nm) (figure 3(a)); however, the particles prepared from commercial TEOS displayed high-quality monodispersed mesoporous silica particles (∼700 nm) (figure 3(c)). Commercial sodium silicate was used for the synthesis of silica of a smaller spherical shape as well as larger particles (multimodal particle size distribution of ∼600–2500 nm). Nevertheless, a very small degree of agglomeration can be observed, especially for the particles prepared from the bagasse source. EDX analysis was carried out for determination of elemental composition. All expected elements were idenetified and their contents as determined from EDX analysis are given in table 2 and table 3.
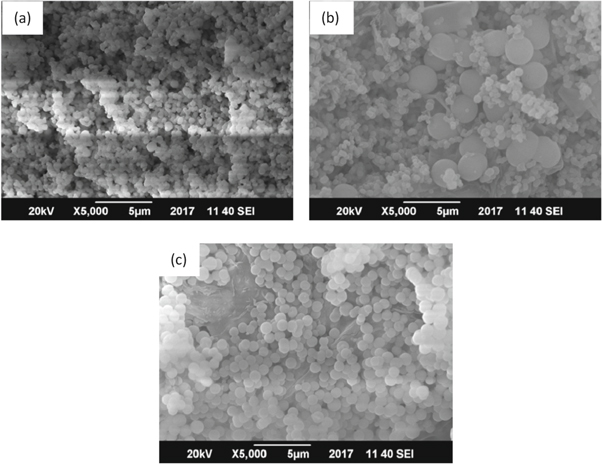
Figure 3. SEM image of: (a) mesoporous SiO2 (BA), (b) SiO2 (SS) and (c) SiO2 (TEOS).
Download figure:
Standard image High-resolution image3.4. Surface area and pore volume determination of mesoporous silica particles
The nitrogen adsorption method is employed to determine the BET pore diameter, pore-volume, and surface area of mesoporous silica particles produced by various starting materials. Figure 4 shows the plots for surface area measurements, and the detailed surface parameters are shown in table 4. These parameters, as shown in the table, have been extracted from the BET and BJH processes. The surface area values were between 209.87 and 355.36 m2 g−1. The diameter of the pore was estimated at ∼3 to 12 nm, which confirms the mesoporous nature of the silica particles, while the total volume of the pore was in the range of 0.08 to ∼0.6 cm3 g−1. These surface area and pore values are considered in line with the previously reported literature [38].
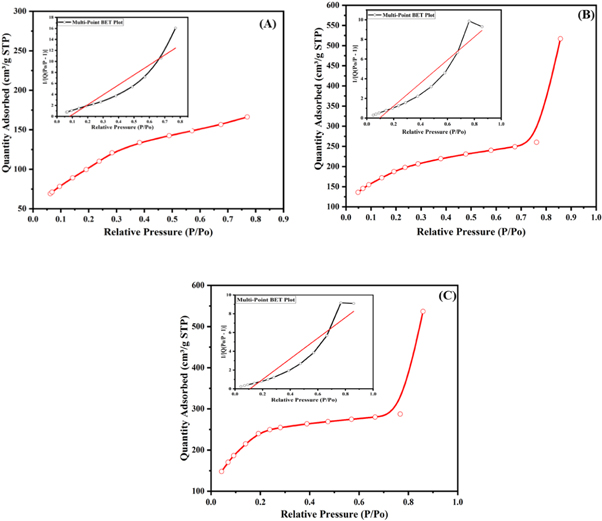
Figure 4. BET surface area measurements for (A) SiO2 (BA), (B) SiO2 (SS) and (C) SiO2 (TEOS).
Download figure:
Standard image High-resolution imageTable 4. Surface area, pore diameter and pore volume of mesoporous silica particles.
| Silica Particles | Surface Area (m2 g−1) a | Pore Diameter (nm) b | Pore Volume (cc/g) b |
|---|---|---|---|
| SiO2 (BA) | 209.87 | 3.52 | 0.08 |
| SiO2 (SS) | 328.64 | 11.8 | 0.58 |
| SiO2 (TEOS) | 355.36 | 12.03 | 0.55 |
*N. B: a Surface area determined by the Brunauer–Emmett–Teller (BET) method. b Pore diameter and pore volume determined by the Barrett–Joyner–Halenda (BJH) method.
3.4.1. Thermogravimetric and differential thermal analysis (TGA/DTA) of mesoporous SiO2 particles
The thermogravimetric analysis is a method used to find out the organic content of inorganic metal particles and also to determine the thermal stability of the materials. The results are shown in figure 5. All the thermograms showed a weight loss of about 15%–20% that occurred in four different stages. The weight loss could be justified by the removal of water content, water trapped in pores and, finally, the degradation of CTAB and other organic impurities. These results were found to be compatible with the results reported for mesoporous silica particles [39].
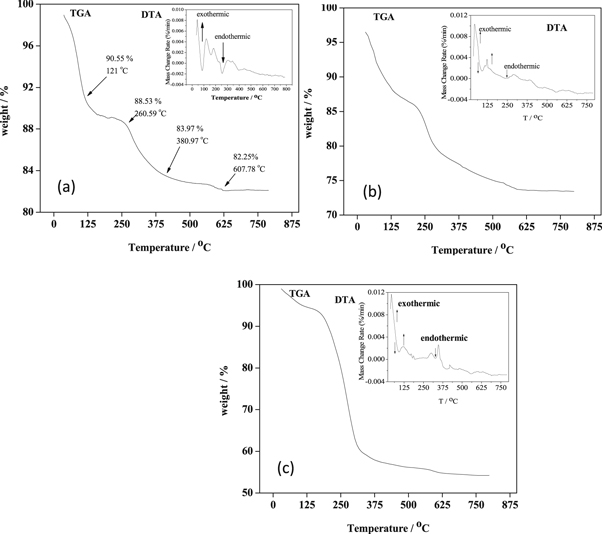
Figure 5. TGA/DTA of: (a) SiO2 (BA), (b) SiO2 (SS) and (c) SiO2 (TEOS).
Download figure:
Standard image High-resolution image3.4.2. Adsorption modelling
Three isothermal models: Freundlich, Langmuir and Temkin have been used, as mentioned above, to compare the adsorption efficiency and residual adsorbate concentration. Table 5 summarises the linearized forms and plots of all three isotherms.
Table 5. Plots for the adsorption models in non-linear and linearized form.
| Isotherm | Non-linear equation | Linearized form | Plot |
|---|---|---|---|
| Langmuir |

|

|
 versus versus 
|
| Freundlich |

|
|
 versus versus 
|
| Temkin |

|
|
 versus versus 
|
For nonlinear regression, trial and error process was developed to determine the isothermal parameters by maximising the respective determination factors/coefficients. Figure 6 show the predicted equilibrium curve and the experimental data for three silica's SiO2 (SS), SiO2 (BA), and SiO2 (TEOS) at three different temperatures 293 K, 303 K, and 313 K. A comparison of the Langmuir, Freundlich, and Temkin adsorption isotherms is given in table 6. The data plotted (figure 6) shows that the adsorption characteristic of CV onto SiO2 (SS), SiO2 (BA), and SiO2 (TEOS) more closely follows the Langmuir isotherm. This observation is further supported by the higher value of correlation coefficient R2, as shown in table 6, which is regarded as a measure of good fit for experimental data on the isothermal models. The order of the non-linear isotherm, therefore, better suits the three sets of experimental data in this study to Langmuir >Freundlich >Temkin. The adsorption capacity of CV dye increases with temperature.
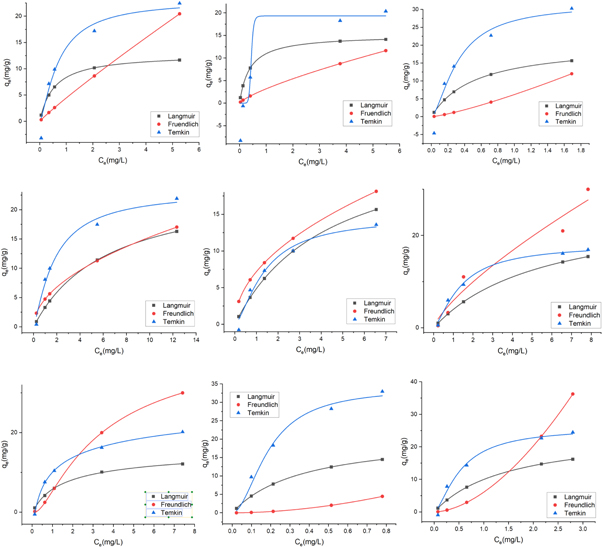
Figure 6. Non-linear isotherm models of Langmuir, Freundlich and Temkin for the removal of CV dye using mesoporous silica particles of SiO2 (SS), SiO2 (BA) and SiO2 (TEOS). First row shows the plot of SiO2 (SS), second row shows the plots of SiO2 (BA) and last row shows the plots of SiO2 (TEOS). The temperatures are divided row wise as: 293 K, 303 K, and 313 K, in first, second and third respectively.
Download figure:
Standard image High-resolution imageTable 6. Langmuir, Freundlich and Temkin isotherm parameters obtained by non-linear fitting for CV adsorption on mesoporous silica particles.
| Langmuir isotherm | Freundlich isotherm | Temkin isotherm | ||||||||
|---|---|---|---|---|---|---|---|---|---|---|
| Sample | Temp. (K) | R2 | KL | qm (mg g−1) | R2 | Kf | 1/n | R2 | lnK | B (J mol−1) |
| SiO2 (SS) | 293 | 1 | 0.21 | 12.84 | 0.999 | 0.92 | 1 | 0.952 | 0.79 | 254 |
| 303 | 1 | 0.32 | 15.11 | 0.999 | 0.68 | 0.767 | 0.881 | 0.72 | 360 | |
| 313 | 1 | 0.12 | 20.53 | 1 | 1.50 | 1.271 | 0.948 | 0.67 | 140 | |
| SiO2 (BA) | 293 | 1 | 0.03 | 24.75 | 0.999 | 0.23 | 0.510 | 0.986 | 0.94 | 265 |
| 303 | 1 | 29.9 | 25.97 | 1 | 7.20 | 0.492 | 0.974 | 1.47 | 550 | |
| 313 | 0.99 | 0.16 | 26.52 | 0.953 | 1.18 | 0.752 | 0.993 | 1.31 | 545 | |
| SiO2 (TEOS) | 293 | 0.999 | 4.23 | 17.80 | 0.999 | 2.18 | 5.430 | 0.993 | 0.88 | 340 |
| 303 | 1 | 8.52 | 21.32 | 1 | 7.13 | 1.890 | 0.934 | 0.23 | 101 | |
| 313 | 1 | 0.15 | 24.81 | 1 | 6.11 | 1.743 | 0.933 | 0.51 | 215 | |
For the linear regression analysis of Langmuir isotherm, a graph between 1/Ce and 1/qe was plotted, as shown in figure 7, and the values of constants KL and qm were obtained from the slope and the intercept of these plots. Figures 7(a)–(c) shows the linear fitting of SiO2 (SS), SiO2 (BA), and SiO2 (TEOS) on three different temperatures: 293 K, 303 K, and 313 K respectively. Based on the regression coefficient, the isotherm data for CV adsorption by SiO2 (SS) was best fitted at 303 K, whereas the isotherm data for CV adsorption by SiO2 (BA) was best fitted at 313 K and the same temperature. The data were found to be well fitted for SiO2 derived from TEOS. The maximum monolayer adsorption capacity qm of SiO2 (SS), SiO2 (BA), and SiO2 (TEOS) were 20.53, 26.53, and 24.81 mg/g respectively.
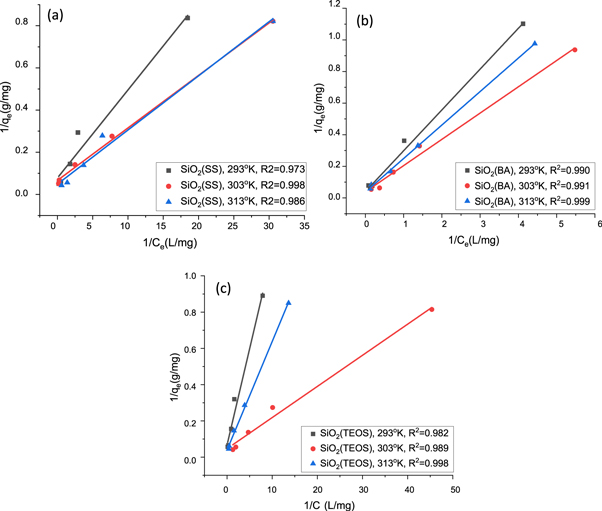
Figure 7. Langmuir linear fitting plot of (a) SiO2 (SS), (b) SiO2 (BA) and (c) SiO2 (TEOS).
Download figure:
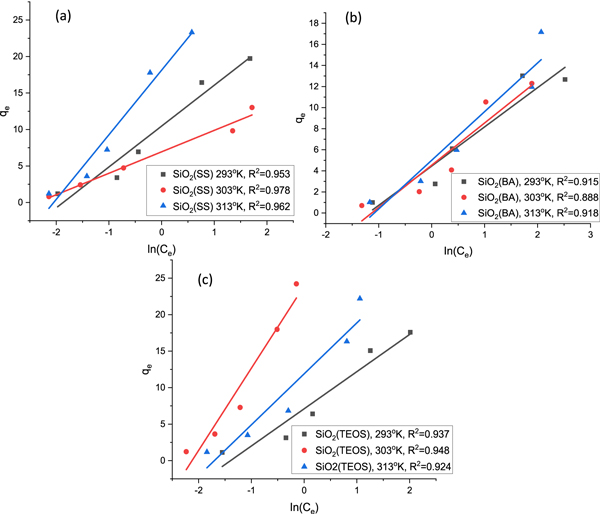
Standard image High-resolution imageFor the Freundlich isotherm, a graph between log Ce and log qe was plotted, as shown in figure 8. Figures 8(a)–(c) shows the linear fitting of SiO2 (SS), SiO2 (BA), and SiO2 (TEOS) on three different temperatures: 293 K, 303 K, and 313 K, respectively. The isotherm data were best fitted to 313 K for CV adsorption by SC with R2 = 0.980, whereas for CV adsorption by BA the best-fitted data were observed at 313 K with R2 = 0.979. The isotherm data for CV adsorption by TEOS were best fitted at the same temperature with R2 = 0.995. As observed, the values of Kf and 1/n lie in-between 0–1 and 0.1–10 respectively, which represents a favorable adsorption process. The slope 1/n (range of 0–1) determines the surface heterogeneity. The surface heterogeneity is strong when the slope value is near zero [23]. The highest heterogeneity 1/n = 0.492 is obtained by SiO2 (BA) at 30 °C, which shows that SiO2 (BA) is more heterogenic than the other two mesoporous silica particles.

Figure 8. Freundlich linear fitting plot of (a) SiO2 (SS), (b) SiO2 (BA) and (c) SiO2 (TEOS).
Download figure:
Standard image High-resolution imageFor the Temkin isotherm, a graph between ln Ce and qe was plotted, as shown in figures 9(a)–(c), which shows the linear fitting of SiO2 (SS), SiO2 (BA), and SiO2 (TEOS) on three different temperatures: 293 K, 303 K, and 313 K, respectively. For SiO2 (SS) mesoporous silica particles, the adsorption isotherm data of CV were best fitted at 293 K with R2 = 0.978. The CV adsorption isotherm data of SiO2 (BA) were best fitted at 313 K with R2 = 0.92. The CV adsorption isotherm data of TEOS were best fitted at 313 K with R2 = 0.948. The high affinity of CV dye was indicated for the Temkin model on SiO2 (SS), SiO2 (BA), and SiO2 (TEOS). It is concluded that this model does not fit well with the equilibrium data compared to the Langmuir and Freundlich models. The data plotted (figures 7–9) shows that the adsorption characteristic of CV onto SiO2 (SS), SiO2 (BA), and SiO2 (TEOS) more closely follows the Langmuir isotherm. This observation is further supported by the higher value of correlation coefficient R2, as shown in table 7. The order of the non-linear isotherm, therefore, better suits the three sets of experimental data in this study to Langmuir > Freundlich > Temkin. (Two more lines). To compare the fitting quality of both linear and non-linear isotherms in terms of the correlation coefficient R2, it was noticed that CV adsorption on the silica's is quite well consistent with Langmuir model for non-linear isotherm than linear isotherm. All the calculated parameters are given in table 8.
Figure 9. Temkin linear fitting plot of (a) SiO2 (SS), (b) SiO2 (BA) and (c) SiO2 (TEOS).
Download figure:
Standard image High-resolution image
Table 7. Langmuir, Freundlich and Temkin isotherm parameters obtained by linear fitting for CV adsorption on mesoporous silica particles.
| Langmuir isotherm | Freundlich isotherm | Temkin isotherm | ||||||||
|---|---|---|---|---|---|---|---|---|---|---|
| Sample | Temp. (K) | R2 | KL | qm (mg g−1) | R2 | Kf | 1/n | R2 | lnK | B (J mol−1) |
| SiO2 (SS) | 293 | 0.998 | 1.87 | 12.84 | 0.968 | 4.47 | 0.916 | 0.953 | 0.54 | 232.66 |
| 303 | 0.997 | 2.66 | 15.11 | 0.966 | 3.19 | 0.761 | 0.978 | 0.42 | 362.71 | |
| 313 | 0.986 | 1.89 | 20.53 | 0.980 | 6.20 | 1.263 | 0.962 | 0.49 | 143.53 | |
| SiO2 (BA) | 293 | 0.990 | 0.16 | 24.75 | 0.915 | 4.78 | 0.506 | 0.916 | 0.84 | 547.05 |
| 303 | 0.991 | 0.23 | 25.97 | 0.963 | 7.20 | 0.492 | 0.888 | 0.88 | 555.02 | |
| 313 | 0.999 | 0.18 | 26.53 | 0.979 | 5.56 | 0.551 | 0.918 | 0.92 | 520.13 | |
| SiO2 (TEOS) | 293 | 0.982 | 0.64 | 14.68 | 0.975 | 5.22 | 0.706 | 0.918 | 0.72 | 342.96 |
| 303 | 0.989 | 2.73 | 21.32 | 0.995 | 7.13 | 1.467 | 0.937 | 0.47 | 105.26 | |
| 313 | 0.998 | 0.67 | 24.81 | 0.998 | 6.11 | 0.979 | 0.948 | 0.59 | 218.81 | |
3.4.3. Thermodynamic studies
Thermodynamic considerations of adsorption are needed to determine if the adsorption is spontaneous or not. Thermodynamic parameters are used to understand the effects of temperature in a better way on dye adsorption on an adsorbent. The thermodynamic function is obtained from the Van't Hoff equation, which relates the equilibrium constant of the absorption process to an absolute temperature.


Where R is the general gas constant (8.314), K is the equilibrium constant and T is the absolute temperature. Equation (8) was used to calculate the value of ∆G. The value of ∆H and ∆S can be calculated, respectively, from the slope and intercept of Van't Hoff lnK versus1/T (equation (9)). At a particular temperature, the fundamental reaction criteria occur spontaneously when the value of ∆G is negative.
The negative value ∆G and the positive value of both ∆H and ∆S of the Langmuir and Freundlich isotherm of all three mesoporous silica indicated that the adsorption process is spontaneous and endothermic. The decrease in the negative value of CV dye on SiO2 (SS), SiO2 (BA), and SiO2 (TEOS) with an increase in temperature indicates that the adsorption process of CV dye at a high temperature becomes more favorable. The positive value of ∆H indicates that the adsorption is endothermic, and the positive value of ∆S indicates a certain structural modification of the adsorbent. In the adsorption process, randomness increases in the solid/liquid interface. From the Langmuir isotherm, the value of ∆H is (SiO2 (SS) = 0.83, SiO2 (BA) = 5.19, and SiO2 (TEOS) = 3.05), which indicates that the uptake of CV dye on mesoporous silica particles could be attributed to the process of physical adsorption. From the Temkin data, the negative values of ∆S for the adsorption of CV onto SiO2 (SS) and SiO2 (TEOS) revealed the decreased randomness at solid/liquid and suggested that the adsorption process involved an associative mechanism. The negative value of ∆H on SiO2 (SS) and SiO2 (TEOS) suggested the adsorption process is exothermic. The positive value of ∆G demonstrated that adsorption took place non-spontaneously on SiO2 (SS) and SiO2 (TEOS). Meanwhile, ∆G for SiO2 (BA) was negative, and ∆H and ∆S were positive on Temkin and confirmed that the nature of the adsorption process is spontaneous, favourable, and endothermic.
3.4.4. Activation parameter
In thermodynamics studies, activation energy is an important parameter. A linearized Arrhenius equation is used to calculate the activation energy as:

Where R is the general gas constant, A is the frequency factor, K is the adsorption rate constant, Ea is the activation energy (kJ mole−1) and T is the temperature. The slope of the straight line of plotting lnK versus 1/T is used to determine activation energy, as shown in table 9. Another indication of the type of adsorption of CV dye adsorption on mesoporous silica is the value of the activation energy. During a physical adsorption process, the equilibrium is usually achieved rapidly and is easily reversible since the energy requirement is low (Ea = 0 to 40 kJ mol−1) [40] and the involved forces are weak. Chemical adsorption involves forces that are far stronger compared to physical adsorption. Thus, the activation energy of the same magnitude varies with the temperature depending on the finite activation energy (Ea = 40 to 800 kJ mol−1) in the Arrhenius equation [41]. The respective activation energy values for CV dye adsorption on mesoporous SiO2 (SS), SiO2 (BA), and SiO2 (TEOS) are 0.83, 5.19, and 3.05 kJ mol−1. All values are less than 8, showing that it is corresponding to physical adsorption. The value of activation energies when less than 40 kJ mol−1 is indicative of the physisorption mechanism [42].
Table 8. Temkin, Freundlich, and Langmuir isotherm parameters obtained by linear fitting.
| Temkin isotherm | Freundlich isotherm | Langmuir isotherm | ||||||||
|---|---|---|---|---|---|---|---|---|---|---|
| ΔS | ΔH | ΔG | ΔS | ΔH | ΔG | ΔS | ΔH | ΔG | ||
| SiO2 (SS) | Temp (K) | (kJ/ (mol K)) | (kJ mol−1) | (kJ mol−1) | (kJ/ (mol K)) | (kJ mol−1) | (kJ mol−1) | (kJ/ (mol K)) | (kJ mol−1) | (kJ mol−1) |
| 293 | −2.15 | −1.86 | 628 | 50.07 | 11.56 | −14658 | 8.97 | 0.83 | −235 | |
| 303 | 649 | −15158 | −244 | |||||||
| 313 | 671 | −15659 | −252 | |||||||
| SiO2 (BA) | 293 | 18.31 | 3.33 | −5362 | 32.95 | 5.76 | −9648 | 3.15 | 5.19 | −1516 |
| 303 | −5546 | −9978 | −1568 | |||||||
| 313 | −5729 | −10307 | −1620 | |||||||
| SiO2 (TEOS) | 293 | −11.88 | −5.09 | 3475 | 33.94 | 5.92 | −9939 | 10.5 | 3.05 | −883 |
| 303 | 3595 | −10278 | −914 | |||||||
| 313 | 3714 | −10618 | −944 | |||||||
Table 9. Activation energy values obtained by linear fitting of the Arrhenius equation.
| SiO2 (SS) | Temp. (K) | 1/T | ln K | Ea (kJ mol−1) |
|---|---|---|---|---|
| 293 | 0.0034 | 0.54 | 0.83 | |
| 303 | 0.0033 | 0.42 | ||
| 313 | 0.0032 | 0.49 | ||
| SiO2 (BA) | 293 | 0.0034 | 0.84 | 5.19 |
| 303 | 0.0033 | 0.88 | ||
| 313 | 0.0032 | 0.92 | ||
| SiO2 (TEOS) | 293 | 0.0034 | 0.72 | 3.05 |
| 303 | 0.0033 | 0.47 | ||
| 313 | 0.0032 | 0.59 |
4. Discussions
In this paper, mesoporous silica particles (MPSPs) were synthesized using various sources using well-established updated protocols [33, 35]. Synthesized mesoporous silica particles have been characterized by various techniques such as scanning electron microscopy (SEM), x-ray fluorescence spectroscopy (XRF), energy-dispersive x-ray spectroscopy (EDX), and thermogravimetric analysis/differential thermal analysis (TGA/DTA). Synthesized mesoporous silica particle surface values range from 209.87 to 355.36 m2 g−1. The pore diameter was estimated to be between ∼3 and 12 nm, thus confirming the mesoporous nature of silica particles whereas the total pore volume ranged from 0.08 to ∼0.6 cm3 g−1. Similar results are reported in [38]. All the thermograms showed a weight loss of about 15%–20% that occurred in four different stages, compatible with the results reported for mesoporous silica particles [39]. Crystal violet removal was performed with silica extracted from bagasse ash, together with two further silica samples prepared for comparison purposes from commercially available sodium silicate and TEOS. The adsorption data for equilibrium follow the isothermal model of Langmuir and the maximum single-layer capacity was 26.53 mg g−1, similar results are reported elsewhere [42]. When comparing R2 values of the isotherm models, the theoretical assumption of Langmuir isotherm model was fitted best for both linear and non-Linear isotherms. While on non-linear isotherm, the Freundlich model is also best fitted with R2 = 1 for certain temperatures. The adsorption data was not very well represented in the Temkin isotherms. On Linear isotherm models, the equilibrium study showed that the Langmuir model (R2 = 0.999) fits well with adsorption data, considered in line with the previously reported literature [42–46]. The respective activation energy values for CV dye adsorption on all prepared silica's are less than 8, showing that it is corresponding to physical adsorption [42]. Furthermore, the results show that silica obtained from bagasse ash is an adsorbent that is cost-effective and equally efficient for removing crystal violet from an aqueous solution.
5. Conclusions
This paper presents a cost-effective and easy way to synthesize high-quality, monodispersed, and mesoporous silica particles. Bagasse ash, a sugar cane industry waste byproduct, was used to extract sodium silicate (an inorganic source of silica). The extracted sodium silicate was characterized by XRF and successfully used for the synthesis of mesoporous silica particles. The particles were then characterized by different techniques such as TGA/DTA, SEM/EDX, BET, and FTIR. The mesoporous silica particles of BA have smaller surface area, pore diameter and pore volume of mesoporous silica particles than other two source of silica (TEOS and SS). Adsorption CV removal was performed on bagasse ash along with TEOS and commercially available sodium silicate. The adsorption CV removal kinetics of bagasse ash follow the Langmuir isotherm model. From the activation thermodynamic parameters, the negative value of ΔG indicates that the reaction was favorable, and positive ΔH shows that the reaction is endothermic. The obtained values of Ea showed that the nature of CV sorption on mesoporous silica particles is physisorption. The acquired thermodynamic data portrays the spontaneous nature of the sorption. The findings of this paper suggest that bagasse ash is could be a cheap and promising anticipated for the removal of CV dye from wastewater. It can therefore be further examined and considered as a cheaper alternative to commercial adsorbents.
Acknowledgments
Authors Muhammad Farooq Warsi and Mirza Mahmood Baig are thankful to the Islamia University of Bahawalpur and Higher Education Commission of Pakistan for start-up research grant under project No: PM-IPFP/HRD/HEC/2011/2264. Author from King Saud University sincerely appreciates King Saud University, Riyadh (Saudi Arabia) for his contribution to this research through the Researchers Supporting Project (RSP-2020/163).