
Abstract
Styrene butadiene rubber(SBR) consists of two random polymerization units, styrene and butadiene. As a rigid segment, styrene chain provides strength and rigidity to the rubber. The content of styrene in SBR directly affects its strength and stiffness. In this paper, the effect of styrene content on the fatigue characteristics and rheological properties of SBR have been investigated. The stress relaxation of SBR was reduced and the cross-linking density of butadiene was increased with the increasing styrene content. Especially the dynamic fatigue life of precracked SBR samples was obviously prolonged via slow down crack growth rate when the styrene content increased, which was accompanied by an augment in the value of J-integral and tearing energy in the case of a same gap extension length. At the initial stage of crack growth, the growth of secondary crack played an important role in the growth of main crack, and when the main crack accelerates, the growth of main crack itself dominated. On the other hand, the glass transition temperature obviously increased with the increase of styrene content.
Export citation and abstract BibTeX RIS

Original content from this work may be used under the terms of the Creative Commons Attribution 4.0 licence. Any further distribution of this work must maintain attribution to the author(s) and the title of the work, journal citation and DOI.
1. Introduction
Styrene butadiene rubber (SBR) is one of the most widely used synthetic rubber varieties, which possesses physical properties and processing performances close to those of natural rubber (NR). In some areas, such as wear resistance, heat resistance and aging resistance, SBR even exhibits better performances than NR. Owing to its excellent wear resistance and cutting resistance, SBR is widely used in tire industry. However, for some special environment, such as in a mine, the tire tread is required to possess higher cutting resistance and better puncture resistance performance. Recently, the cutting resistance of SBR was improved via increasing the content of styrene in the copolymerized rubber macromolecules by PetroChina Lanzhou Petrochemical Company.
Fatigue performance is another one of the main evaluation indexes of rubber materials. Especially for tires subjected to alternating stress (strain), the material properties are gradually weakened in the applying process due to the continuous development of fatigue damage. The fatigue resistance of rubber material determines its safety and reliability, so it is of great significance to study the fatigue performance of SBR and develop novel type SBR materials with excellent fatigue resistance. Researchers have deeply studied the fatigue behavior of rubber materials, mainly focusing on the initiation, development and termination of fatigue cracks [1–9]; fatigue damage evolution and fatigue crack growth [10–13]; the prediction of fatigue life via tearing energy or strain energy density [14–16]; and the fatigue properties of various rubber materials [17–19]. Dong and Wu [20–22] investigated the influence of synergistic effect of carbon black and carbon nanotubes on the fatigue properties of NR composites by J-integral method. Yao and Weng [23–25] found the relationship between tear energy and fatigue fracture by studying the cracking behavior of carbon black-filled or silica-filled rubber. Yin and Wang[26] studied the effect of different grafted silica on the crack growth behavior of solution polymerized SBR, and Fu et al [27] explored the effect of different particle sizes and different fractions of silica on the crack growth behavior of NR. Luo and Zhong [28–31] studied fatigue crack growth in aramid-fiber-reinforced styrene-butadiene rubber composites. It is a common method to improve the strength and fatigue performance of SBR by adding reinforcing materials such as carbon black and silica. However, facing the increasingly fierce market competition, rubber enterprises and tire enterprises are looking for more effective ways to strengthen SBR, hoping to obtain a kind of SBR with higher fatigue performance. As known, SBR is the random copolymer of butadiene and styrene, while properties are related to the copolymerization structure and monomer content of butadiene and styrene. Styrene is not only a rigid segment in SBR, but owns larger volume compared with that of butadiene segment. Therefore, the rigidity of SBR material can be improved via increasing the content of styrene segments in SBR macromolecules. The strength of SBR can be improved by increasing the styrene content in the rubber molecules. On the other hand, rheological properties and chain segment motion characteristics may be affected by the content of styrene. So, it is important to investigate the effect of high styrene content on various properties and fatigue behaviors of SBR.
2. Experimental
2.1. Materials
SBR 1500E (styrene of 23.5%) and SBR 1586 (styrene of 40.0%) were provided by PetroChina Lanzhou Petrochemical Company. Zinc oxide (ZnO) was purchased from Shijiazhuang Zhiyi Zinc Industry Co. Ltd, China. Stearic acid (SA) was acquired from Zhejiang Hengxiang Chemical Co. Ltd, China. Sulphur (S8) was obtained from Guiyang Hangyi Rubber and Plastic Accessories Co. Ltd, China. The accelerant, N-tert-butyl-2-benzothiazole sulfenamide (TBBS), was purchased from Yanggu Huatai Chemical Co. Ltd, China.
2.2. Sample preparation
Sample formula: four kinds of SBR rubber respectively with styrene content of 23.5%, 28%, 34% and 40% were obtained by adjusting the mixing ratio of SBR1586 and SBR1500E, and the detailed formula for the four systems are listed in table 1. The samples are named as SBRxx, where the subscript 'xx' represents the percentage of styrene in the sample.
Table 1. Sample formula.
| Sample | SBR1500E (g) | SBR1586 (g) | ZnO (g) | SA (g) | S (g) | TBBS (g) |
|---|---|---|---|---|---|---|
| SBR23.5 | 800 | 0 | 24 | 8 | 14 | 8 |
| SBR28 | 582 | 218 | 24 | 8 | 14 | 8 |
| SBR34 | 291 | 509 | 24 | 8 | 14 | 8 |
| SBR40 | 0 | 800 | 24 | 8 | 14 | 8 |
Mixing process: the raw materials were weighed according to the formula shown in table 1, then the plastic refining of raw rubber was taken place on an open mixer (XSS-300, Shanghai Kechuang Rubber and Plastic Machinery Equipment Co. Ltd, China). The roller distance was set as 1.1 mm and the roller temperature was set as 50 ± 5 °C, in order to ensure the rubber can wrap the roll, and the rubber was alternately made 3/4 cutters from both sides every 30 s. After homogenizing for 9 min, S8 and SA were evenly added into the rubber along the roller, and the rubber sheet was made 3/4 cutters on each side. After homogenizing for 12 min, ZnO and TBBS were evenly added into the rubber along the roller, and the rubber sheet was made 3/4 cutters on each side for 3 times. Then, the roller distance was set as 0.6 mm and the mixing rubber was vertically rolled for 6 times. At last, the roller distance was set as 2.0 mm, and the compounded rubber sheet can be obtained after being folded through the open mill for 4 times.
Vulcanization process: the compounded rubber was first placed on a flat surface for 24 h to relieve stress. And then the rubber sheet was cut into rectangle specimens with a size of 14 cm × 12 cm along the direction in which the sheet was taken from the open mill. Finally, the cut rubber sheet was cured at 151 °C for 40 min on a vulcanizing press.
2.3. Characterization
2.3.1. Scanning electron microscope (SEM)
An SEM (JSM-7500F, JEOL, Japan) was applied to observe the morphology of dynamic fatigue fracture of SBR, with the accelerating voltage of 10 kV. Before observation, the specimens were pasted onto the conductive tapes and treated by gold spraying.
2.3.2. Testing of stress relaxation and vulcanization properties
The compound rubber sheet was cut into circular shape with the diameter of 4.5 cm and thickness of 2 mm. Then, the circular specimen was placed on the molding chamber of a rubber processing analyzer (RPA2000, ALPHA, USA), and the testing below can be taken place.
Stress relaxation testing: the scanning temperature was set as 60 °C and the strain was maintained at 100%. The stress relaxation testing time was 300 s.
Vulcanization behavior testing: the scanning temperature was set as 151 °C, the frequency was maintained at 0.1 Hz and the amplitude was set as 6.975%. The testing time was 60 min.
2.3.3. Rheological measurements
The compound rubber sheet was cut into circular shape with the diameter of 4.5 cm and thickness of 2 mm for the rheological measurement on a rotational rheometer (ARES-G2, TA instrument, USA) using a parallel clamp with the diameter of 25 mm in air atmosphere at 100 °C. For frequency sweeping, the strain maintained at 0.1%, with the sweep range from 100 rad·s−1 to 0.01 rad·s−1. For strain sweeping, the frequency maintained at 1.0 rad·s−1, and the sweep range was set from 0.01% to 100%.
2.3.4. Dynamic mechanical analysis (DMA)
A dynamic mechanical analyzer (Q800, TA instrument, USA) was applied to obtain the glass-transition temperature of the rubber sample. The frequency and amplitude were set as 1.0 Hz and 20 μm, respectively. The temperature sweep range was from −70 °C to + 70 °C, with the heating rate of 3 °C·min−1.
2.3.5. Dynamic fatigue test
The vulcanized SBR was cut into the shape shown in figure 1 for fatigue testing. Pre-cuts of 2 mm were introduced at the centre of one edge of the specimens by a new razor blade, thus producing single-edge notched test pieces. The tensile fatigue cycle test was carried out on a dynamic fatigue tester (DF-8000-5, GO-TECH, China) in strain control mode and sinusoidal loading, with the specimen being pre-stretched for 5 mm. The circulating strain was ±5 mm, elongation was 67%, and the speed was 5 Hz. The length of the crack was measured by a magnifying glass (PEAK1983-15 X, PEAK, Japan) every 2500 fatigue cycles.
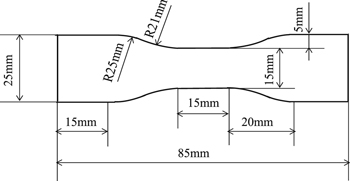
Figure 1. Schematic of the sample for dynamic fatigue testing.
Download figure:
Standard image High-resolution image2.3.6. Tearing energy and crack growth rate
Rivlin and Thomas [32] proposed that quasi-static crack propagation occurred above a certain critical tearing energy, independent of the specimen type, indicating that the critical tearing energy can be considered as an internal property of the rubber material. The tear energy (T) of single incision tensile specimen can be described as:
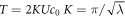
Where K is a geometrical parameter. λ is the elongation ratio, λ = 1 + ε, where ε is the tensile strain. U is the strain energy density, which is the integral area of the tensile stress-strain curve after the Mullins effect is removed. c0 is the crack length.
In the dynamic fatigue process, the crack and tear energy are constantly changing, so the concept of average tear energy is introduced. The average tear energy (Tav)for different loading times is calculated by the following equation:
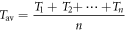
Where T1, T2, ..., Tn are the tear energy for every 2500 fatigue cycles.GJ Lake et al found that the relationship between the crack growth rate (dα/dN) and T of rubber followed a power law relationship (Equation 2) when the rubber sample was loaded with medium to high fatigue strain, that is:

Where B and β are two parameters.
2.3.7. J-integral
J-integral value can be considered as the required energy to produce a new fractured surface per unit area, which is to characterize the energy release rate when the crack length (α) is extended from α to α + ∂α. The vulcanized sheet was cut into a specimen with a length of 150 mm, a width of 19 mm and a thickness of 2 mm. In order to eliminate 'Mullins effect', the specimen was cyclically stretched for 10 times at a tensile rate of 100 mm min−1 and a strain of 80 mm on a tensile testing machine (Z005, Zwick, Germany) before the measurement. Then, 2 mm and 4 mm vertical edge incisions were cut respectively at the central and the edge of the specimen for the final tensile testing at a rate of 100 mm·min−1. The J-integral value can be calculated as [33]:
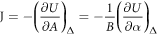
Where U is the strain energy, which equals the integral area of the force-displacement curve at a constant displacement (∆). A is the area of the section, B and α are respectively the thickness and the crack length of the specimen.
2.3.8. Transmission electron microscopy (TEM)
SBR40 were frozen sliced into a wafer, and then dyed with osmic acid for 8 h. The TEM images were acquired on a transmission electron microscope (JEOL 2100F, JEOL, Japan).
3. Results and discussions
3.1. Structure of SBR
Figure 2 shows the TEM images for SBR40. For SBR40, there is no styrene enrichment phase can be observed even though the content of styrene has reached 40%, which indicating that SBR40 is still a random copolymer as a kind of rubber.
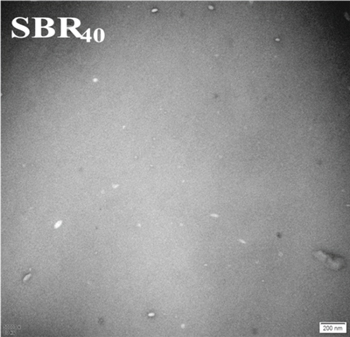
Figure 2. TEM image for sample SBR40.
Download figure:
Standard image High-resolution imageDMA curves further reflect the chain structure of SBR sample. As shown in figure 3, peak of Tan δ shifts to the direction of high temperature with the increasing styrene content, which indicating that the higher styrene content dose SBR possesses, the higher glass-transition temperature (GTT) is produced. GTT of SBR23.5 is −28 °C, while that of SBR40 is 3 °C.

Figure 3. Dynamic mechanical analysis curve of SBR with different styrene content.
Download figure:
Standard image High-resolution imageAlthough styrene only owns a small polarity, its large volume and steric resistance make the butadiene chain segment not easy to move. With the increase of styrene content, the internal rotation steric resistance of the molecular chain increases, so that the GTT of SBR is increased. Furthermore, there is only one Tan δ peak for each of the four different SBR samples despite the increasing styrene content. The transition peak of styrene copolymer is not found at about 50 °C [34], further indicating that the four kinds of SBR samples are all styrene and butadiene random copolymers without obvious phase separation structure.
3.2. Vulcanization of SBR
Figure 4 shows the vulcanization characteristics of SBR samples. With the increasing styrene content, the starting time (ts, acquired by the intersection of the bilateral tangent lines) of SBR vulcanization becomes more and more hysteretic. Furthermore, the maximum torque (MH) decreases, and the difference value between maximum and minimum torque (MH-ML) gradually becomes small, indicating the decline in crosslinking density of SBR [35]. The relative number of unsaturated double bonds in the rubber molecular chain (mainly distribute in butadiene segments) decreases with the rising content of styrene which have almost no unsaturated double bonds, resulting in the reduction of crosslinking points and the deceleration of torque growth during vulcanization, resulting in a low maximum torque. Before vulcanizing, SBR with high styrene content possesses a high minimum torque because there are lots of rigid styrene groups in the matrix. In order to reflect the butadiene crosslinking density more accurately, a characteristic numerical value φb = (MH-ML)/(1-percentage of styrene) is introduced, which stands for the crosslinking density per unit content of butadiene. As shown in table 2, the value of φb increases with the rise of styrene content, indicating that the augment of styrene dilutes the concentration of butadiene segments at the same amount of vulcanizing agent, although the total cross-linking density (reflected by the value of MH-ML) gets diminishing.
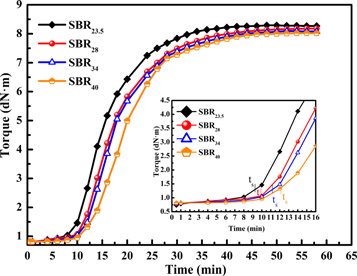
Figure 4. Vulcanization characteristic curves of SBR with different styrene content.
Download figure:
Standard image High-resolution imageTable 2. Vulcanization characteristic data of SBR with different styrene content.
| Sample | SBR23.5 | SBR28 | SBR34 | SBR40 |
|---|---|---|---|---|
| MH (dN·m) | 8.29 | 8.18 | 8.09 | 8.02 |
| ML (dN·m) | 0.73 | 0.78 | 0.80 | 0.81 |
| MH-ML (dN·m) | 7.56 | 7.40 | 7.29 | 7.21 |
| φb | 9.88 | 10.28 | 11.05 | 12.2 |
3.3. Viscoelastic characters of SBR
Figure 5 displays the stress relaxation behavior of SBR samples. It can be found that the styrene content plays a significant role in the stress relaxation of SBR. At the same relaxation time, torque retention rate increases with the rise of styrene content, and SBR23.5 has the shortest stress relaxation time. With the rise of styrene content, the steric hindrance increases correspondingly, which makes the conformational change of rubber macromolecules under the action of external forces more difficult and the relaxation time is prolonged. For the materials with similar elastic modulus, the longer relaxation time it owns, the higher elastic modulus will be represented in mechanical process.
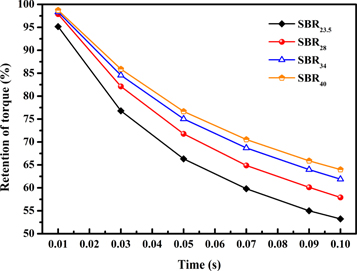
Figure 5. Stress-relaxation curve of SBR with different styrene content.
Download figure:
Standard image High-resolution imageAs shown in figure 6, with the increase of styrene content, the loss factor tan δ decreases gradually with the frequency (ω), especially for SBR40, the tan δ value decreases greatly. In the low frequency region, SBR with higher styrene content possesses larger tan δ value. While in the high frequency region, the tan δ value is lower in SBR material with high styrene content (such as SBR40). In the low-frequency region, the shear rate is slow, and the molecular chains in the SBR can change their conformations with the action of external force. For SBR with high styrene content (such as SBR40), the tan δ value is higher owing to its more styrene groups, which make the butadiene segment has a larger deformation at the same deformation degree compared with that of SBR23.5. However, in the high frequency region, the shear rate is faster, and the molecular chain in SBR has no time to change its conformation with the action of external force. Therefore, SBR with high styrene content possesses larger relative elastic modulus and lower tan δ value compared with those of SBR23.5.
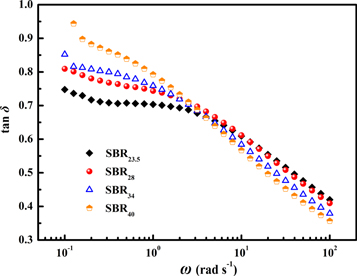
Figure 6. Tan δ Versus frequency (ω) plots of SBR with different styrene content at 100 °C.
Download figure:
Standard image High-resolution imageIn the small strain area, all SBR samples present a plateau region of storage modulus (G') Versus strains(γ) shown in figure 7, and the higher styrene content does SBR have, the higher platform region of G' can be observed. With the increasing strain, G' value begins to decline at a critical strain (γc), which can be attributed to the chain untangling of SBR. For SBR40, the highest G' platform can be found owing to its high styrene content and chain rigidity. However, G' value of all the samples decreases sharply when the strain exceeds γc. With the increase of strain, the degree of untangling is higher, thus the G' value sharply decreases [36].
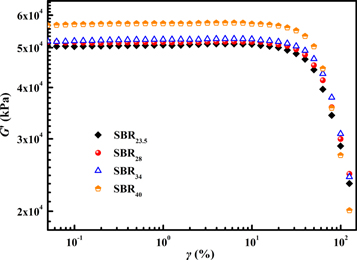
Figure 7. Storage modulus (G') Versus strain (γ) plots of SBR with different styrene content at 100 °C.
Download figure:
Standard image High-resolution image3.4. Quasi-static crack propagation behavior (J-integral) of SBR
J-integral is the energy value required to produce a new fractured surface per unit area, which represents the static crack growth. Its physical significance is to characterize the energy release rate when the crack length grows from α to α + ∂α.
As shown in figure 8, the J-integral value of SBR increases significantly with the rise of styrene content, indicating that SBR with high content styrene requires higher energy to produce new broken surface per unit area. For SBR40, the J-integral exhibits a power function curve and much higher than that of other test groups. When the developing crack tip encount styrene segments in SBR, the crack development can be stopped or changed direction due to the great rigidity of styrene. Moreover, the increase of the crosslinking density of butadiene enhances the rigidity of butadiene segments, which can also delay the growth of cracks.

Figure 8. J-integral curves of SBR with different styrene content.
Download figure:
Standard image High-resolution image3.5. Dynamic fatigue performance
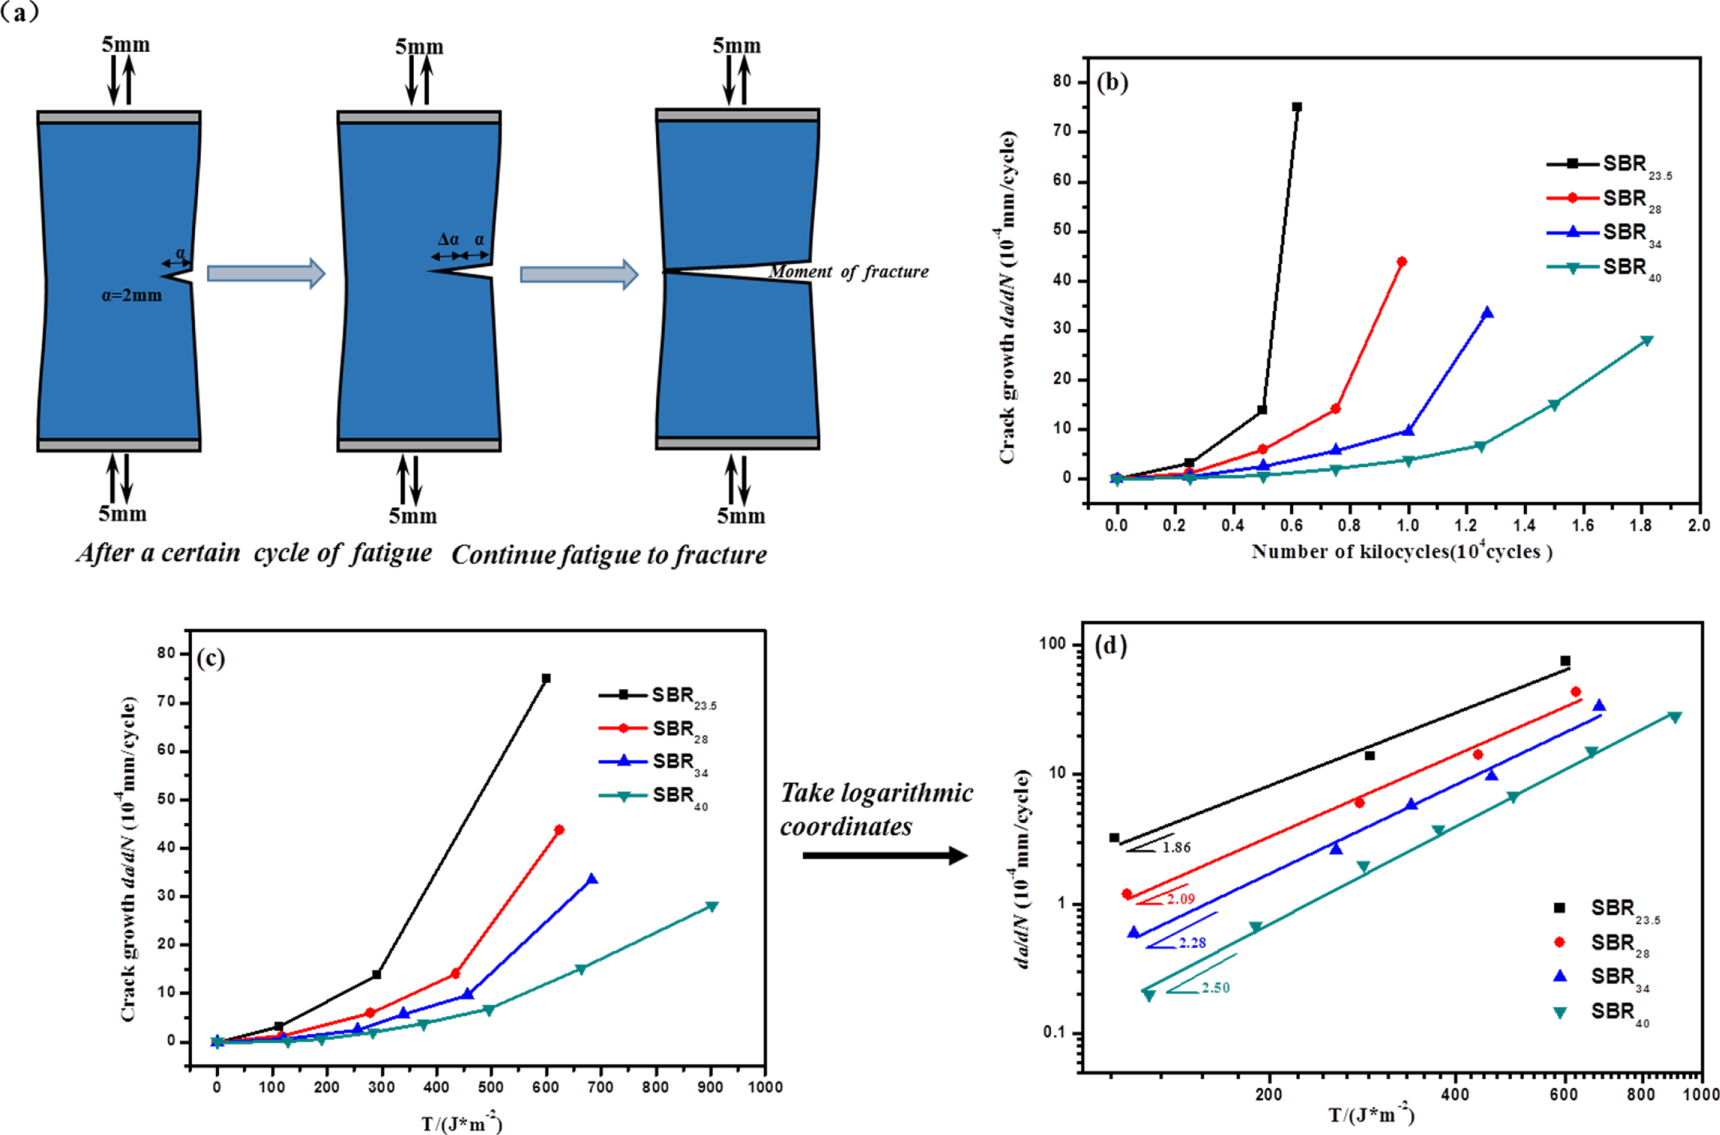
Figure 9 shows the dynamic fatigue behaviors of SBR samples. As shown in figure 9(a), the dynamic fatigue of SBR is carried out in strain control mode. With the reciprocating stretch cycle going on, the initial crack (α) gradually becomes larger and larger (α + ∂α), and the SBR sample completely break at the end. The dynamic fatigue crack growth rate (dα/dN) and dynamic fatigue cycle follow a power function relationship reflected in figure 9(b). As the styrene content rising, the crack growth slows down, and the fatigue life of SBR increases gradually.

Figure 9. (a) Schematic for the crack growth of SBR during dynamic fatigue process; (b) Dynamic fatigue crack growth rate (dα/dN) Versus fatigue cycle (N) and (c) Dynamic fatigue crack growth rate (dα/dN) Versus tearing energy (T) of SBR with different styrene content; (d) The logarithmic coordinates for (c).
Download figure:
Standard image High-resolution imageThe dynamic fatigue crack growth rate of SBR with low styrene content (such as SBR23.5) is faster, and there is no stable crack development stage. The higher the styrene content is, the longer the stable crack development stage is. Furthermore, SBR with high styrene content (such as SBR40) possesses more flat fatigue crack growth rate and longer fatigue life compared with those of SBR23.5. Similarly, the relationship between dα/dN and tearing energy (T) also follows a power function as shown in figure 9(c). Under the same tearing energy, SBR with high styrene content owns slow dα/dN. Combined with the J-integral curve, it can be found that the higher the J-integral value is, the slower the dα/dN exhibits. Converting horizontal and vertical coordinates into logarithmic coordinates, it can be observed form figure 9(d) that the plots of SBR samples display a linear relationship which can be expressed by:

where β is the slope of the straight line, indicating the dependence of the dα/dN on the tear energy. The larger the value is, the larger the dα/dN varies with the change of tear energy. As shown, SBR40 possesses the highest β value of 2.58, manifesting a high dependence between dα/dN and T. Both static crack growth and dynamic fatigue crack growth are related to the molecular structure of SBR. When the crack tip meets rigid styrene segments, they can prevent the development of the crack or change the developing direction of the crack. Therefore, the dynamic fatigue crack development of SBR can be delayed effectively by increasing the styrene content. On the other hand, butadiene is the flexible segments of SBR. The rising styrene content increases the crosslinking density of butadiene segments, which also increases the rigidity of SBR matrix, thus preventing the crack growth effectively.
3.6. SEM images of SBR fracture surface after dynamically fatiguing
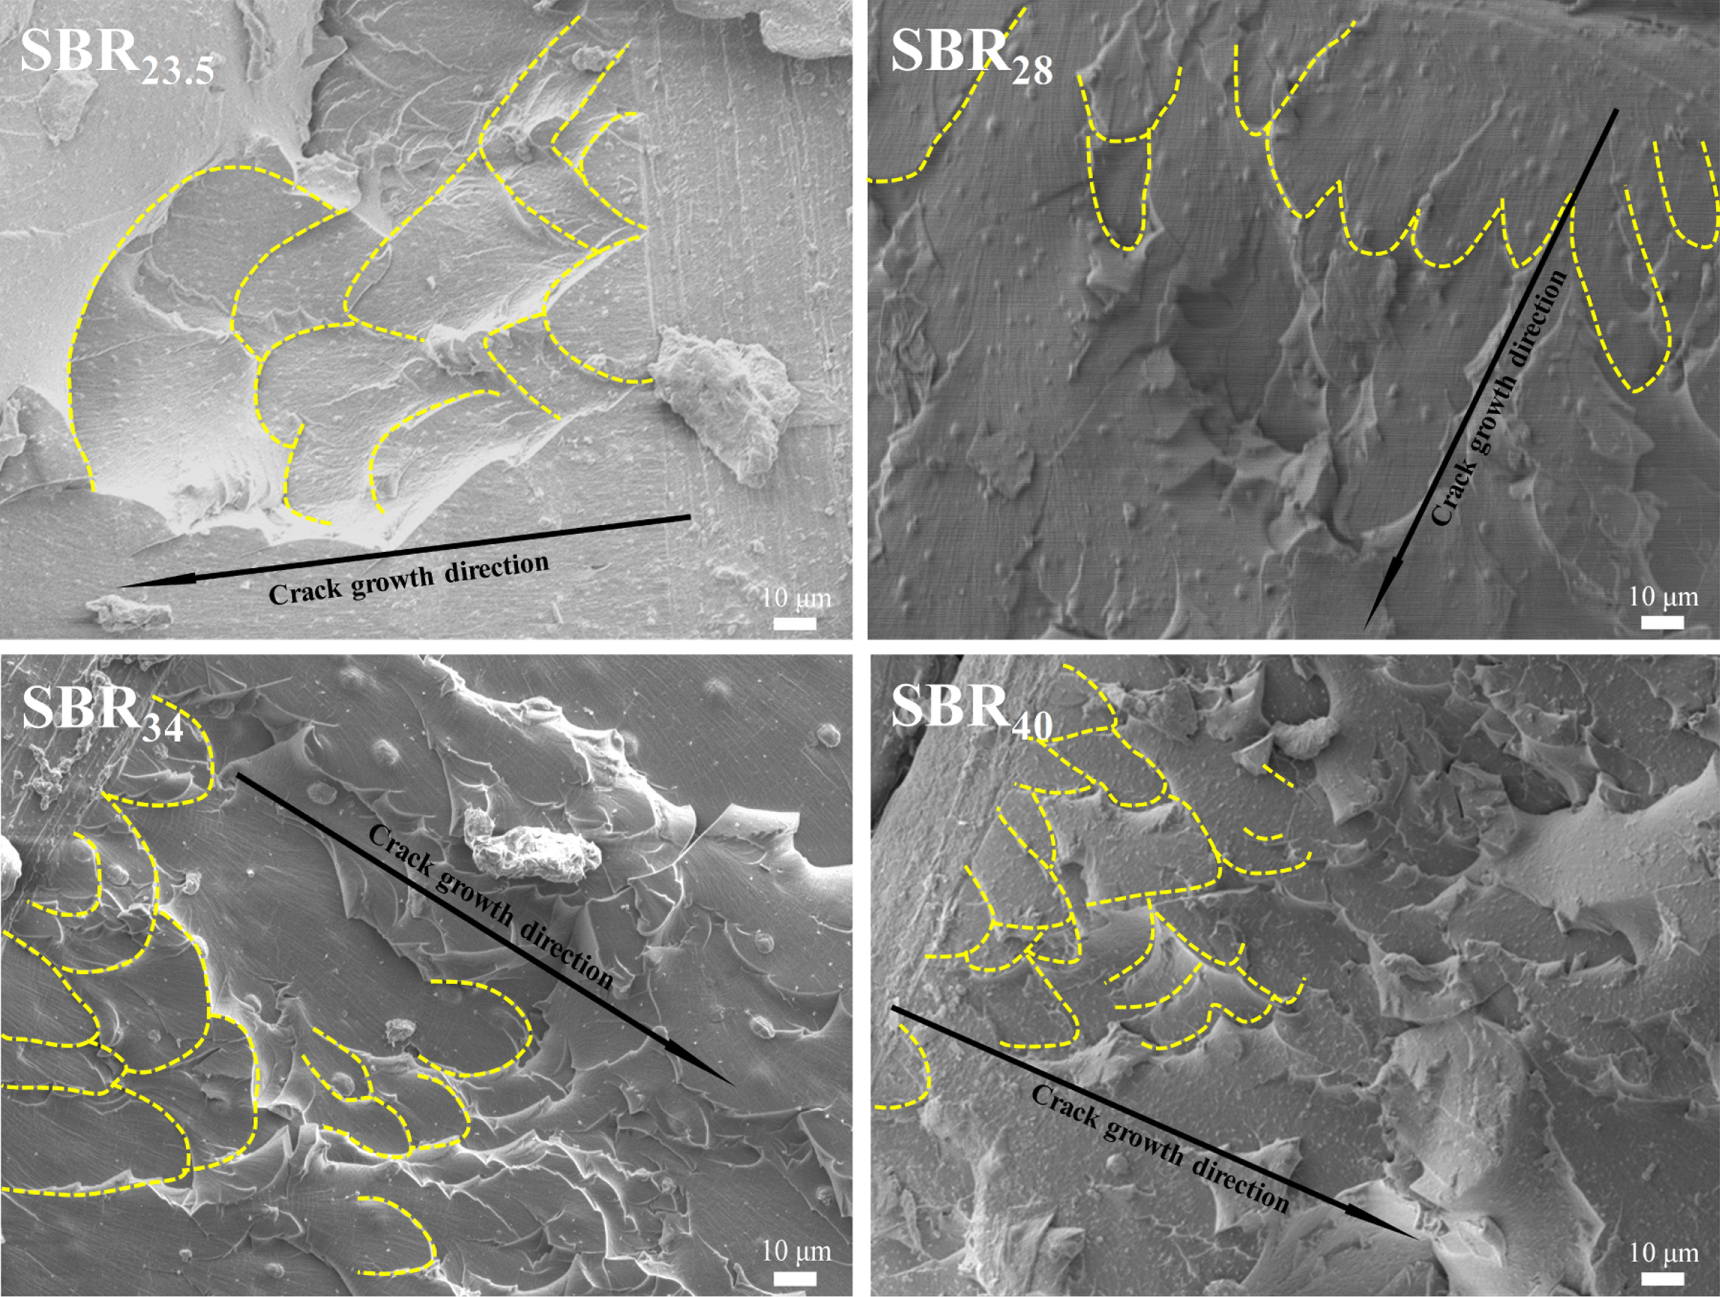
Figure 10 displays SEM images for the fracture surface of SBR after fatiguing. With the rise of styrene content, the fracture surface becomes more and more rough. A relatively smooth fracture surface can be observed in the SEM image of SBR23.5. Along the crack direction, SBR23.5 exhibits a larger parabolic shape from the beginning, followed by a flat area, and the fracture edge is relatively neat. However, SBR with high content (SBR40) shows rough fracture edge and rough fracture surface. The higher the styrene content is, the more uneven the surface will be, and after the initial smooth area, a smaller parabolic shape accompanied by uneven peaks and ravines can be observed clearly.

Figure 10. SEM images of SBR fracture surface after dynamically fatiguing.
Download figure:
Standard image High-resolution imageFigure 11 shows the crack expansion and formation of parabolic morphology for SBR samples during dynamically fatiguing. The parabolic morphology is formed by the mergence of main crack with the secondary cracks in front of the main crack during their growth. For SBR with low styrene content (SBR23.5), the secondary cracks propagate rapidly and merge with each other to form larger secondary cracks in the front of the main crack. When the main crack and the secondary crack meet, a large and neat parabolic morphology is formed. However, for SBR with high styrene content (SBR40), the development of the secondary cracks is relatively slow owing to the high strength matrix. When the main crack meets the secondary crack, the formed parabolic shape is small, with rough edge and obvious tearing trace. When the main crack accelerates, the growth of main crack itself dominated.

Figure 11. Schematic of crack expansion and formation of parabolic morphology for SBR samples during dynamically fatiguing.
Download figure:
Standard image High-resolution image
4. Conclusion
The TEM image and DMA curves displays SBR40 is a random copolymer. Through the stress relaxation, frequency and strain scanning curves of SBR with different styrene content, it was found that SBR with higher styrene content possessed slower stress relaxation, slower frequency response and larger variation of strain from small angle to large angle. The crosslinking density of butadiene in SBR increased with the rise of styrene content. Rigid styrene segments and the increase of crosslinking density of butadiene segment made the glass transition temperature obviously increased with the increase of styrene content. The dynamic fatigue life of SBR obviously increased via slow down crack growth rate when the styrene content increased, and meanwhile, the tear energy required for the same fracture length was increased. The parabolic shape of dynamic fatigue fracture of SBR with high styrene content was small and the edge part was rough. There were different mechanisms in the early and accelerated stages of fatigue crack growth. At the initial stage of crack growth, the growth of secondary crack formed in front of the main crack played an important role in the growth of main crack, and when the growth of main crack accelerates, the growth of main crack itself dominated. For the mechanism of initial crack growth, when styrene content was high, the propagation speed of secondary cracks was slow, and the parabola shape became smaller but the number was more when they compounded with the main crack.
Acknowledgments
This work was financially supported by National Natural Science Foundation of China for Project, and the Grant/Award Number is 51763004.